Abstract
Slow steaming is an operational measure in ocean-going vessels sailing at slow speeds. It can help climate mitigation efforts by cutting down marine fuel consumption and consequently reducing CO2 and other Greenhouse Gas Emissions (GHG). Due to climate change both the European Union (EU) and the International Maritime Organization (IMO) are analysing the inclusion of international shipping in the EU Emissions Trading System (ETS) in the near future or alternatively implementing a carbon tax. The paper proposes a methodology to decide the optimal speed of a vessel taking into account its characteristics and the factors that determine its economic results. The calculated cash flow can be used in valuation models. The methodology is applied for a case study for any container ship in a range from 2000 to 20,000 Twenty-foot Equivalent Units (TEU) on a leg of a round trip from Shanghai to Rotterdam. We calculate how speed reduction, CO2 emissions and ship owner’s earnings per year may vary between a business-as-usual scenario and a scenario in which shipping is included in the ETS. The analysis reveals that the optimal speed varies with the size of the vessel and depends on several variables such as marine fuel prices, cargo freight rates and other voyage costs. Results show that the highest optimal speed is in the range of 5500–13,000 TEUs whether or not the ETS is applied. As the number of TEUs transported in a vessel increases emissions per TEU decrease. In an established freight rate market, the optimal speed fluctuates by 1.8 knots. Finally, the medium- and long-term expectations for slow steaming are analysed based on future market prices.
1. Introduction
The International Maritime Organization (IMO) is the United Nations agency responsible for the safety and security of shipping and the prevention of marine and atmospheric pollution by ships. In April 2018, the IMO agreed on an initial strategy on the reduction of Greenhouse Gas Emissions (GHG) from ships [1]. Initial targets are to reduce CO2 emissions across international shipping by at least 40% by 2030 and aim for 70% by 2050 compared to 2008. This strategy is in line with the Paris Climate Agreement goals [2]. In December 2019, the European Commission announced the European Green Deal [3], which proposes to extend the EU ETS to the shipping industry.
In July 2020 the IMO released the fourth IMO GHG Study [4]. Figure 1 depicts the estimated total shipping GHG emissions including international and domestic shipping, and fishing. These GHG emissions include carbon dioxide (CO2), methane (CH4) and nitrous oxide (NO2) expressed in carbon dioxide equivalent (CO2e), and the recognised 2008 base-line figure is 794 million tonnes. Current figures account for about 2.9% of global anthropogenic CO2 emissions. If the maritime sector were a country, it would rank sixth between Germany and Japan [5]. The authors acknowledge the importance of global warming potential (GWP) in the case of marine fuels. This paper focuses in CO2 emissions which is consistent with IMO slow steaming reports as only CO2 emissions have price in the valuation model. However, carbon reduction generates a proportional reduction in the GWP.
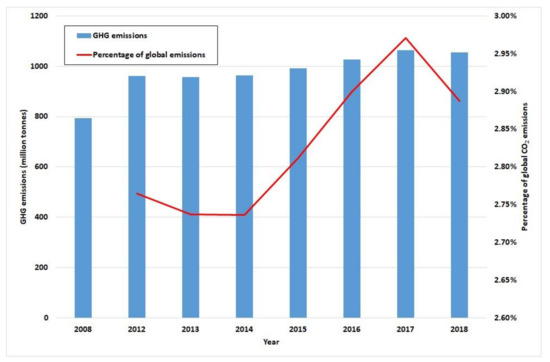
Figure 1.
Total estimated greenhouse gas (GHG) emissions from shipping and percentage of total global emissions. Source: drawn up by authors with data from [4].
Future projections augur an increment in the range of 90–130% in emissions on the 2008 figure by 2050 if no measures are taken [4]. The main GHG producer is international shipping, in which three types of vessel operate: tankers, bulk carriers and container ships [6]. In 2018 they produced 147.1, 193.4 and 232.1 million tonnes of CO2, respectively [4]. Faber et al. [7] assert that a short-term measure such as slow steaming could reduce emissions from the three major ship types (container, bulk and tanker) by a third. These three types alone account for 52% of global CO2 from ships. The European Union (EU) [8] asserts that container ships accounted for the largest proportion of GHG in 2018 at over 30%, i.e., 44 million tonnes in Europe based on data from the European Union Monitoring, reporting and verification THETIS-MRV. In this study we focus on container ships since this is the type that emits most out of the three, and high sailing speeds in the container fleet make its business more efficient. The relationship between fuel consumption and vessel speed is exponential. As a rule of thumb, engine power follows the cube of speed [9]. Meyer et al. [10] assert that this is an old admiralty formula dating from the times when ships were operated by coal. Be that as it may, one short-term measure for meeting GHG targets could be to reduce navigation speed in what is known as “slow steaming”. Czermanski et al. [11] examine the 2018 global container shipping fleet using an energy consumption approach and find total emissions of 282 million tonnes sailing at 14 knots and 407 million tonnes at 18 knots. Mandatory speed limits seem to have a number of shortcomings [12] and neither the IMO nor the International Chamber of Shipping (ICS) favours this option.
The cost of a running a vessel breaks down into fixed and variable or voyage costs. Voyage costs usually include bunker consumption, port costs, channel tolls and cargo handling costs [13]. Bunkering is the largest cost item for shipping lines and often exceeds 40% of total costs [14]. Zanne et al., however, find that in the operating expenses of a vessel fuel combustion accounts for 50–70% of the total [15]. Slow steaming is recognised as an effective short-term measure for reducing GHG, yielding a total fuel saving of approximately 19% if speed is reduced by 10% [16]. Cepeda et al. [17] carry out a simulation using a discrete event model of a fleet of thirteen bulk carriers based on fuel consumption, emissions and cargo transported under three conditions: sailing at current speeds, in slow steaming and in Ultra-Low Steaming (ULS). They find a reduction in fuel consumption of 51% for slow steaming and 85% for ULS and a drop in emissions of 22%. Gurning et al. [18] use a Technique for Order of Preference by Similarity for Ideal Solution (TOPSIS) method to determine optimal speed. Healy and Graichen [19] analyse slow steaming for different types of ship and find that its impact is considerably less for smaller vessels.
The bunker price is not the only factor that can force slow steaming. Other factors may include low freight rates and environmental pressure. Shortly before the financial crisis sparked by the collapse of Lehman Brothers in 2008, the shipping sector was at the peak of its economic cycle [20] and ship owners were still ordering ships. Ships designed around 2008 were built based on a scenario in which the bunker price was low and revenues were high. Therefore, they were designed for high sailing speeds, consuming a lot of fuel. The 2008 global crisis led to a worldwide recession, a decline in global trade and low freight rates, so ship-owners had to lower their operating costs [21]. They also had to face ship overcapacity, so many companies decided to reduce speed in order to lower operating costs and increase transport time to keep the whole fleet sailing.
Psaraftis and Kontovas [22] study the world fleet database to analyse statistics for total emissions from shipping. They break down CO2 emissions per vessel category and find that the category which emits the most GHG is the post-panamax container ship fleet with 110.36 million tonnes per year, nearly double the figure for the second highest category, i.e., new-panamax. The estimated total for emissions from international shipping in 2007 was 872 million tonnes [23]. The life expectancy of a ship is between 25 and 30 years and building one takes approximately 3 years. The container ships designed in 2008 are now about 12 years old and have another 15 years of lifetime remaining.
When freight rates are high shipping companies have a high profit margin, so from an economic perspective energy efficiency is relatively less important than completing as many legs per year as possible. However, if freight rates are low shipyards compete for clients [7] and if fuel costs are also high ship owners are more willing to build more efficient vessels and opt for slow steaming as a very efficient measure [24]. Since the financial crisis of 2008, the speed of Panamax containers and large containers has dropped from 25–27 knots to 20–22 knots.
Since 2018 the container ship industry has had to factor a new variable into its business model: a GHG reduction target independent of freight rates and dependent on voyage costs, which is mandatory to meet IMO and EU environmental regulations. In this regard [25] analyses optimisation measures in a large fleet of Aframax tankers that reduce fuel consumption and contribute to low-carbon shipping. The author finds that slow steaming is the most promising strategy, including include propeller change and engine derating. Izquierdo et al. [26] provide a theory on ocean wave mechanics and Vitali et al. [27] calculate voluntary speed reductions for a number of container ships due to rough weather conditions and their links to fuel consumption and GHG emissions. They find that there is a gap between theory and results in practice. Taskar and Andersen [28] analyse fuel savings from speed reduction in different weather and sea conditions and find that reducing speed by a third gives fuel savings of 2–45% depending the vessel type and weather conditions. Other studies analyse GHG emissions from maritime transport from wider viewpoints, e.g., the life cycle perspective, distinguishing between two different systems: well to tank and tank to propeller [29]. Lindstad et al. [30] investigate speed reduction, emissions and costs and find potential for reducing CO2 in maritime transport.
Container ships can carry large volumes of containers more cheaply than other forms of transport, and are the preferred mode for international trade. Specifically, 90% of the transport trade is carried out by sea.
In this paper a complex optimisation model for calculating the optimal speed of a vessel in each round trip sail is developed, the optimal speed depends on some variables. The model is applied in a study case where vessels are in a range from 2000 TEUs to 20,000 TEUs sailing through the Suez Canal and obtains the optimal operation mode, the variable margin, the fuel consumption and the CO2 emissions. Its results depend on the climate policy adopted to cut the GHG emissions. The proposed model can also be used with other values because obviously the results depend on fuel consumption of a specific engine at different speeds and other variables such as canal tolls that may vary due to political decision from year to year. The results also depend on other circumstances in each round trip such as weather conditions, unfavourable current or even a canal blockage. All these situations can be evaluated using the proposed model; however, in this case the evaluation is undertaken using average values because in a medium and long-term unfavourable circumstances should be offset by favourable circumstances.
The rest of this paper is organised as follows: Section 2 analyses different methodological approaches to decarbonising the maritime industry. Section 3 describes the base case and the economic model for slow steaming, which optimises the annual margin for the container ship fleet considering voyage costs. Section 4 shows the valuation of the optimal speed, variable margin, cost emission and emissions and their interpretation. Section 5 concludes.
2. Methodological Approaches for Decarbonising Maritime Transport
The third IMO Greenhouse Gas Study predicts an increase in maritime GHG emissions of 50–250% by 2050 [31] under a business-as-usual scenario, and the fourth IMO GHG Study forecasts an increase of about 90–130% on 2008 emissions by 2050 depending on economic growth [4]. Different pathways for decarbonising maritime transport have been are studied in scientific literature and in the shipping community. They can be arranged into four groups: alternative fuels, technological measures, operational improvements and Market-Based Measures (MBM). Depending on their maturity they can also be classified as short-, medium- and long-term measures. Bouman et al. [32] state that no single measure suffices to attain GHG targets: various measures are needed as the profiles and interests of the different fleets and stakeholders vary significantly. Balcombe et al. [6] analyse options for fuels, technologies and policies, and [33,34] address solutions and policy recommendations for decarbonising international shipping.
The actual international shipping fleet mainly consume Heavy Fuel Oil (HFO) and Marine Diesel Oil (MDO). Liquefied gas tankers obviously also burn liquefied natural gas (LNG) at an average LNG-HFO ratio of 50% [4]. 2015 also saw the start of methanol consumption in chemical tanker categories. Developing zero CO2 fuels such as bio-fuels, fuel cells, hydrogen and ammonia entails enormous technical challenges and must be seen as a long-term measure [35].
Technological measures for improving energy efficiency such as hull and bulbous bows design improvements, waste heat recovery, hull coating or power and propulsion optimisation can lower emissions. An in-depth review of the literature on shipping technology measures for reducing GHG can be found in [32]. There are also mandatory global regulations such as the Energy Efficiency Design Index (EEDI), which entered into force in 2013. EEDI [36] measures CO2 emissions based on the performance of machinery and electrical technologies incorporated into the vessel design [37,38] acknowledge that EEDI’s impact in decreasing GHG emissions is modest as there are only marginal differences between EEDI and non EEDI scenarios [39] state that EEDI measures should be applied under realistic operational sea conditions.
An operational policy measure is addressed by Ship Energy Efficiency Management Plans (SEEMP) for new and old vessels, requiring them to develop a plan to maximise operational efficiency in accordance with best practices in bunker operation and voluntary use of the Energy Efficiency Operational Indicator [36]. This measure does not set targets, so it is unlikely to reduce emissions significantly [40]. Prill et al. [41] set out a methodology for defining EEOI for specialised vessels, given that such vessels may find it hard to apply the IMO recommended method. Other operational improvements such as slower ship speeds, the use of larger, more efficient ships, weather routing and scheduling would also help.
Finally, MBM include tradable permits, pollution charges and ETS carbon prices. In 2015 the EU [42] published its regulation on the monitoring, reporting and verification (EU MRV) of carbon emissions from maritime transport for ships calling into European Economic Area (EEA) ports. In 2020 the European Commission presented the 2019 annual report on CO2 emissions from maritime transport [8] within the scope of EU 2015/757.
In 2018, the IMO adopted an initial strategy for reducing GHG emissions from ships. One of the objectives is to reduce carbon emissions by at least 40% by 2030 and 50% by 2050 compared to 2008 levels [1]. This strategy also amends the requirements for mandatory collection of data on bunker consumption, distance travelled and service hours from 2019 for vessels with Gross Tonnages in excess of 5000 t and establishes the IMO Data Collection System. More short-term measures are to be decided between 2020 and 2023, and proposals for the mid and long term are to be considered. All this will help to revise the IMO strategy.
In 2019 the EU presented the European Green Deal [3]. This is a roadmap for making Europe climate-neutral by 2050. The European Green Deal includes seaborne transport and the EC is looking into extending the emissions trading system (EU ETS) to cover the maritime sector. This work contributes in this MBM. An EU maritime ETS could result in incompatibilities with world trade legislation and conflicts with flag states [43]. ECSA and ICS [44] provide an in-depth analysis of the implications of EU ETS for international shipping. Other countries such as China have introduced an ETS that extends to shipping and aviation [45].
The basic idea of MBM is to encourage low-carbon vessels and penalise high carbon emitters, so another measure proposed is a constant levy on bunkers [46]. This pricing is not uncertain as it happens in the ETS. Kachi et al. [37] see the opposition of fuel suppliers as an important barrier for implementing a levy. In any event, funds generated through carbon pricing can be used for research and design, infrastructure development for zero emission bunkering and to penalise high-carbon-emitting vessels [47].
3. Methodology
3.1. Case Study
The maritime fleet comprises different types of vessel. In fact, the EU MRV divides them into 15 categories. This study focuses on the container ships segment because this is the category whose ships sail most nautical miles per year and emit the most CO2, (accounting for 30% of all maritime emissions), because the average service speed is the highest of all categories [8]. This high-speed tendency is due to the business model, that is, generate the maximum margin, the high-speed tendency is caused by the expectation of more benefits with more round’s trips and whoever arrives first at port obtains better prices. Specifically, we focus on five types of ocean-going container ship: panamax, post-panamax, new-panamax, Ultra-Large Ship Containers (ULSC) and Very Large Container Ships (VLC). Table 1 shows the main general features of each container vessel.

Table 1.
Different types of container ship.
A large proportion of the world’s containerised trade continues to be carried across the major East-West containerised trade routes, namely Asia–Europe [48]. The hypothetical vessel will make a round trip between the Chinese coast, Shanghai, the Suez Canal and the Netherlands (Rotterdam), but the proposed methodology in this Section can be applied to others round trips. In the relevant literature there may be inconsistencies in distances between ports. Those differences in legs are due to sudden events such as bad weather, wind conditions or the state of the sea [49], and they affect journey distances and routing decisions [50]. In this paper we develop a complex optimization model that depends on some variables. The proposed model can be used with other values because obviously the results depend on fuel consumption of a specific engine at different speeds and other variables such as canal tolls that may vary due to political decisions from year to year. The results also depend on other circumstances in each round trip such as weather conditions, unfavourable current or even a canal blockage. All these situations can be evaluated using the proposed model; however, an evaluation in a medium and long term should be done with average values since unfavourable circumstances should be offset by favourable circumstances.
At https://sea-distances.org/ (accessed on 15 July 2021) the distance between the ports of Shanghai and Rotterdam via the Suez Canal is recorded as 10,525 nautical miles, while the website http://ports.com/sea-route/ (accessed on 15 July 2021) shows it as 11,998 NM. Here we use the average of the two, which is in line with the distance reported in from [33], i.e., 11,078 NM. Another route from Shanghai to Rotterdam is the Northern Sea route [51].
3.2. The Economic Optimization Model
This Subsection describes the model that for optimising the annual margin. The annual income of each class of vessel (classified by their size in TEUs) depends on the number of round trips and on freight rates. Annual voyage costs depend on the variables described below, such as fuel cost, emission allowance price, port costs for container loading and unloading, port duties and in this case Suez Canal tolls. The objective is to find the optimal speed that maximises the annual margin depending on the vessel size (TEUs) and the corresponding cash flow generated by the variable income and costs.
Table 2 shows the principal variables used in the model, their acronym and its units, these variables are used in the model as shown in the Equations (1)–(12). All variables used are compatibles with the round trip (Shanghai–Rotterdam).

Table 2.
Variables.
Total duration (TT) is calculated as in Equation (1).
The number of trips in a year is calculated using Equation (2).
The income per round trip I(SS) is calculated as per Equation (3).
where
FBX11 is the China/East Asia to Northern Europe freight rate ($/FEU).
FBX12 is the Northern Europe to China/East Asia freight rate ($/FEU).
CC is the capacity coefficient, with CC = 0.90 being assumed, i.e., the vessel sails with 90% of its maximum TEU capacity.
LC is the load coefficient, with a value of 0.42 calculated using data from [48] for the 2014–2018 for the leg from Rotterdam to Shanghai.
The Rotterdam fuel cost per round trip C1(VS,SS) is calculated as in Equation (4).
where is the fuel price in Rotterdam and is the fuel consumption as a function of vessel speed and size.
The Shanghai fuel cost per round trip C2(VS,SS) is calculated as in Equation (5).
where is the fuel price in Singapore, which is take as the fuel price in Shanghai, and is the fuel consumption as a function of vessel speed and size.
The port costs for container loading and unloading are assumed to be 44.48 USD (€51) per loaded container and 35.75 USD (€41) per empty container [52]. That is the same price for loading and unloading the vessel depending on whether the container is empty or loaded. The vessel always sails with 90% of its container capacity (CC = 0.90).
When sailing from Shanghai to Rotterdam 90% capacity is loaded. When sailing from Rotterdam to Shanghai 58% of containers transported are empty and 42% loaded.
Equation (6) shows the Rotterdam port costs per round trip,
Similarly, Equation (7) shows the Shanghai port costs per round trip C3S(SS).
The total cost ports for loading and unloading per round trip are given by Equation (8).
The emissions costs per round trip C4(VS,SS) are calculated using Equation (9).
where is the emissions allowance price, is the fuel consumption as a function of the vessel speed and size, is the conversion factor and SU is a dummy variable with value SU = 1 if the round trip is subject to carbon prices and SU = 0 if not.
The total port duties are calculated in Equation (10).
where FP represents port duties as a function of size (SS) (see Appendix A).
FS in Equation (11) gives the Suez Canal tolls for the round trip as a function of size (SS) (see Appendix B).
The annual margin M(VS, SS) is given by Equation (12).
The rest of the costs and revenues are considered as fixed, so they do not intervene in the profit maximisation process. Equation (12) is the function to be maximised for each size value.
TP(SS) is calculated with the Piecewise Cubic Hermite Interpolating Polynomial (PCHIP) [53,54], using Table 3 values taken from [55] for the midpoint of each size interval (see Appendix C).

Table 3.
Port time (TP(SS)) as function of ship size (TEUs).
Figure 2 shows the original and interpolated values calculated from 2000 TEUs to 20,000 TEUs in steps of 100 TEUs. The data used are consistent with [56], who survey different stakeholders in the shipping industry and find that marine engines operate 7000 h per year on average. The shape of Figure 2 is caused because the port time depends on the number of port cranes used in loading and unloading. The more TEUs the ship carries the longer it is, so more cranes can be used. For example, at 6000 TEUs only one crane can work and at 8000 TEUs two cranes would work at the same time.
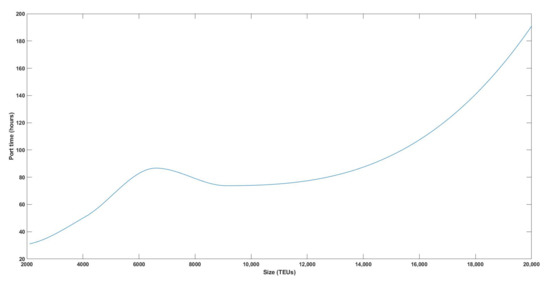
Figure 2.
Port time TP(SS) as a function of ship size (TEUs).
A matrix 1 × 181 with port time values from 2000 TEUs to 16,000 TEUs with steps of 100 TEUs is calculated.
The fuel consumption of vessels depends on speed and size. Table 4 shows the fuel consumption (tonnes/day) depending on two variables the vessel size (TEUs) and the vessel speed (knots), it is a two dimension matrix. Using the figures in Table 4 [57] with Piecewise Cubic Hermite Interpolating Polynomial (PCHIP), Figure 3 is obtained.

Table 4.
Fuel consumption (tonnes/day) as function of speed and size.
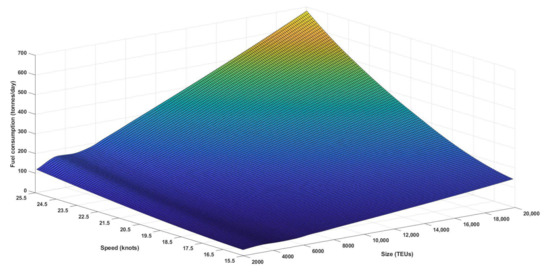
Figure 3.
Fuel consumption (FC(VS,SS)) as function of size (TEUs) and speed (knots).
Figure 3 shows the increases in fuel consumption with speed and vessel size. A matrix with 101 rows (values from 15.5 knots to 25.5 knots in steps of 0.1 knots) and 181 columns (values from 2000 TEUs to 20,000 TEUs in steps of 100 TEUs) is calculated. Figure 3 shows values compatible with those in Table 4 extrapolating from 11,680 TEUs to 20,000 TEUs. This extrapolation is used due to the scarcity of public data availability, so it may be less accurate for high TEUs values close to 20,000. Fuel consumption is influenced by many factors such as ship’s geometrical shape, flow resistance, type of screw/thruster, etc. Even for the same TEU size, depending on the auxiliary and main engines, there may be different consumption values, which may depend on the cost of the investment. However, the proposed model can be used for a specific vessel taking into account its characteristics.
Using Equation (2), a 101 × 181 matrix is calculated for NT(VS,SS). This matrix is represented in Figure 4.
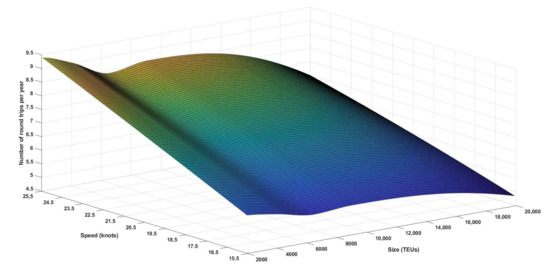
Figure 4.
Number of round trips as a function of size (TEUs) and speed (knots).
The Equation (12) to be optimised also depends on five variables shown in Table 5. For each variable a daily time series is used with values from 1 March 2018 to 26 February 2021. The source of marine fuel data for Intermediate Fuel Oil with viscosity 380 mm²/s (IFO380) is https://shipandbunker.com/prices (accessed on 15 July 2021) the source for freight rates is https://fbx.freightos.com/ (accessed on 15 July 2021) and the source for carbon prices is https://www.sendeco2.com/ (accessed on 15 July 2021). The original carbon prices in €/tonne CO2 were converted to $/tonne CO2 using the European Central Bank (ECB) rate at https://www.ecb.europa.eu. (accessed on 15 July 2021).

Table 5.
Statistics of the variables.
where:
- (a)
- = fuel price in Rotterdam.
- (b)
- = fuel price in Shanghai.
- (c)
- FBX11 = China/East Asia to Northern Europe freight rate.
- (d)
- FBX12 = Northern Europe to China/East Asia freight rate.
- (e)
- = emission allowance price if the round trip is subject to carbon prices.
These variables can be correlated as shown in Table 6:

Table 6.
Pearson correlations.
The two fuel prices are closely correlated, with a value of 0.947. This behaviour can also be seen in Figure 5.
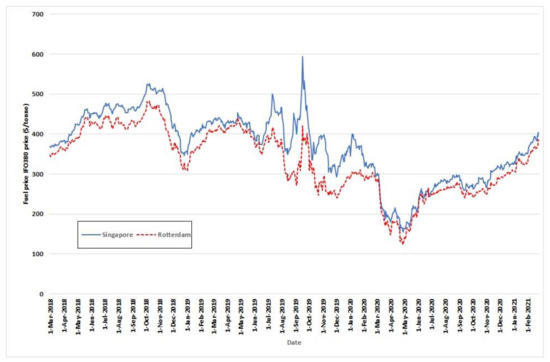
Figure 5.
Singapore and Rotterdam IFO380 prices for three years (from 1 March 2018 to 26 February 2021).
The time series for freight rates is represented in Figure 6, showing a strong increase in the China/East Asia to Northern Europe freight rate (FBX-11 index) since the end of 2020.
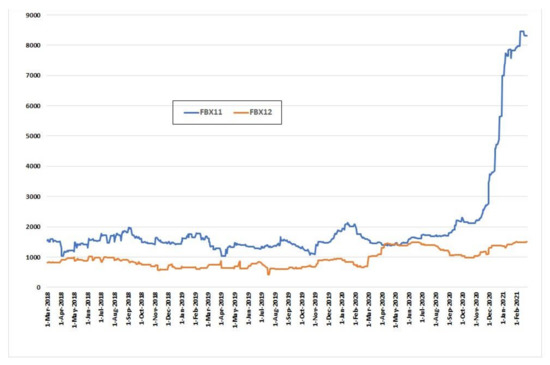
Figure 6.
FBX11 and FBX12 freight rates for three years (from 1 March 2018 to 26 February 2021).
Figure 7 shows the trend in carbon prices, showing a strong increase since the middle of the year 2020.
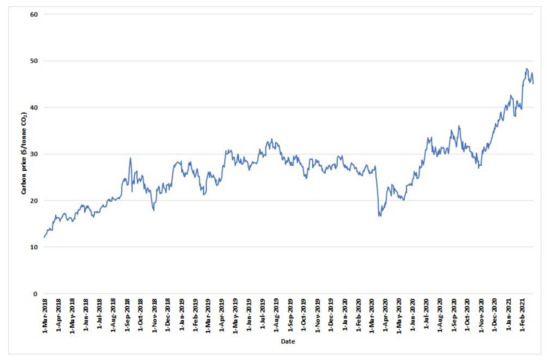
Figure 7.
Carbon prices for three years (from 1 March 2018 to 26 February 2021).
If shipping is subject to emission rights that must be acquired, this has an effect in favour of slow steaming, especially in a scenario of high carbon prices.
Figure 8 shows the port duties as function of size. The price in Euros was converted to US$ using the ECB rate for 26 February 2021 ($1.2121/€), (see Appendix A).
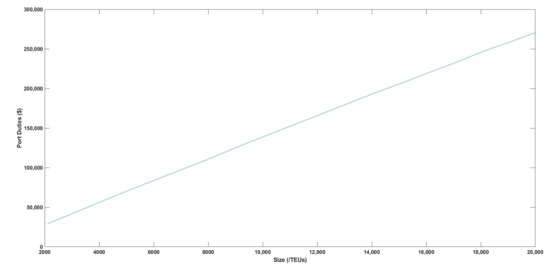
Figure 8.
Port duties FP(SS) as function of size in TEUs.
Figure 9 shows the cost of passing through the Suez Canal for a round trip for container ships of different sizes in TEUs. These costs are estimated using the Suez online calculator, https://lethagencies.com/egypt/calculator-suez (accessed on 15 July 2021), (see Appendix B).
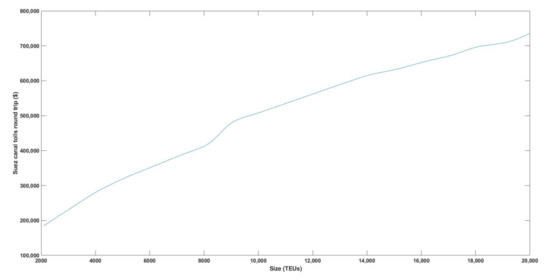
Figure 9.
Suez tolls for round trip as function of size in TEUs.
4. Results
4.1. Optimisation
Figures were initially optimised using the mean values from Table 5, so the function to be optimised was Equation (12). Figure 10 shows the 101 × 181 values for the variable margin obtained with CO2 allowance prices.
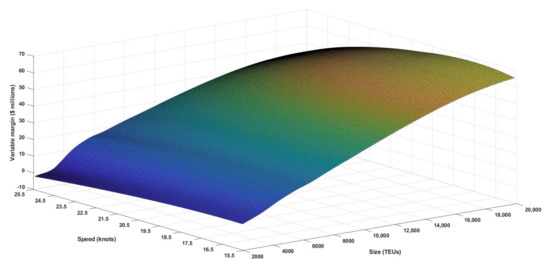
Figure 10.
Variable margin as a function of size (TEUs) and speed (knots) with CO2 allowance prices.
An optimal speed value VS*(SS) is obtained for each size (SS). Figure 11 shows these optimal values with and without carbon prices. A possible impact of 50% for carbon prices is also considered.
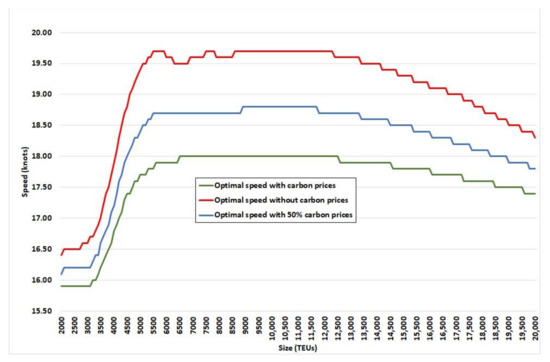
Figure 11.
Optimal speeds as a function of size (TEUs).
For vessels from 13,000 TEUs upwards, it can be seen that as vessels become larger the optimal speed drops steadily in all three scenarios (without ETS carbon prices and applying 100% and 50% carbon prices). Specifically, comparing the figures with no carbon price and with a 100% carbon price, optimal speed drops from 19.6 to 17.9 for new panamax, from 19.3 to 17.8 for ULSC and from 18.3 to 17.4 for VLC.
The highest optimal speeds can be found in the range of 5500–13,000 TEUs. For this whole segment, if no emission price is applied then optimal speed is 19.6. That figure drops to 18.7 for a 50% price and 18.0 for a 100% price
For the range from 3000 to 5500 TEUs optimal speed is found to increase exponentially for all three cases: from 16.6 to 19.6 if no emission price is applied, from 16.2 to 18.7 with a 50% carbon price, and from 15.8 to 17.7 for 100%.
Figure 12 shows the differences in optimal speed between 100% and 50% carbon prices on the one hand and no carbon price on the other as a function of size.
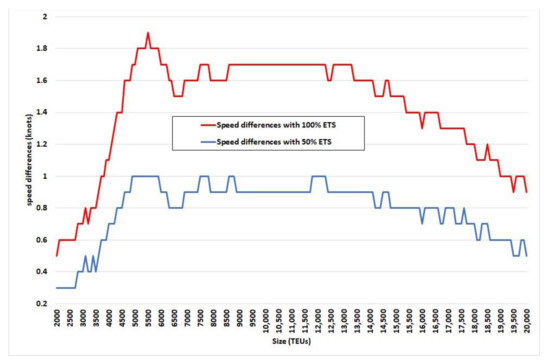
Figure 12.
Optimal speed differences between operation with carbon prices (at 100% and 50% Emissions Trading System (ETS)) and without carbon prices as a function of size (TEUs).
With a 100% ETS the maximum optimal speed difference for 5500 TEUs (post-panamax) is 1.9 knots. From 3000 to 5500 TEUs the difference increases exponentially from 0.8 to 1.9 knots. For the panamax fleet the speed difference is 1.4 knots. For the Post-Panamax segment up to 7000 TEUs the speed difference has a decreasing tendency from 1.85 to 1.5 knots. From 7500 to 13,500 TEUs (new panamax) the speed difference remains practically the same at around 1.65 knots. The curve then decreases steadily for ULSC at 1.5 knots and for VLC at 0.9 knots. In short, as vessels transport more TEUs their optimal speed with no emission prices tends to converge to the 100% application of carbon prices.
With the application of 50% of ETS the curve follows a similar trend, except that optimal speed difference is found to remain nearly constant from 5000 TEUs up to 15,000 TEUs at around 0.9 knots. From 15,000 onwards the optimal speed difference does not decrease as fast as in the 100% ETS scenario: it is 0.8 for ULSC and 0.6 for VLC.
4.2. Optimal Behaviour for Selected Vessels
This subsection outlines the optimal speeds that maximise the annual margin for different container vessels. We also quantify variable margins, cost emissions and CO2 emissions in three different scenarios: with 100%, 50% and 0% ETS. Table 7 shows all these variables per vessel and per TEU transported. This breakdown opens up the possibility of partial payment of carbon allowances, which could entail being given a percentage for free. This is equivalent to transferring a percentage to freight rates, increasing the cost for users. Also note that the total variable margin is the most relevant value because it can be used with the fixed costs for determining the annual cash flows. These annual cash flows can be used in financial models to calculate the value of the remaining vessel life, also the calculated cash flows can be used in an investment valuation model to estimate the profitability of investing in a vessel, using in this case its characteristics. The proposed model can be used in each round trip to obtain different values depending on the value of variables as freight rate, emission prices, fuel prices and others.

Table 7.
Optimal behaviour for selected vessels.
With a 100% emission price the most profitable fleet segment is from 8500 to 14,800 TEUs, where there is a variable average margin of around $3800/TEU, and a cost of emissions of around $280/TEU, with around 10.5 tonnes/TEU being emitted. For VLC the margin is $3378.57/TEU and emissions are 8.33 tonnes of CO2 per TEU. Vessels smaller than panamax are not very profitable and pollute 50% more.
With a 50% ETS the most profitable segment is the 4500–15,000 TEU range at around $3900/TEU with an average increase of CO2 emissions of around 20% on the above scenario.
If no emission prices are applied emissions increase by around 50% on the 100% emission price scenario and the variable margin increases by 7% for the most profitable vessel segment.
In all three scenarios, it is found that as the number of TEUs transported increases the tonnes of CO2 emitted per TEU decrease. With a 0% emission price the figure drops from 16.34 tonnes for 2000 TEU to 9.75 for VLC and with a 100% emission price it drops from 15.19 tonnes for 2000 TEU to 8.33 for VLC.
Table 8 shows the differences in optimal behaviour between 100% and 50% carbon prices and no carbon prices as a function of size.

Table 8.
Differences in optimal behaviour of selected vessels.
Table 8 shows that for both cases the margin losses are slightly greater than emission costs in all segments. The difference is greatest for the 100% emission price and smallest for the VLC segment, at $5.5/TEU for the 50% emission price and $17.51/TEU for the 100% emission price.
A comparison of the results from applying 50% and 100% emission prices reveals that the optimal speed difference decreases proportionally by around 50% for all segments to 0.5 for the VLC case in the 50% scenario and 0.9 in the 100% scenario. It is also found that in the 100% scenario emissions fall by 40% less than in the 50% scenario.
4.3. The Influence of Freight Rates on Optimal Speed
As described in Equation (12), the annual margin depends on income, which is correlated with the fluctuations in freight rates. Optimal speed is thus directly proportional to the freight index. Figure 13 shows how optimal speed for all the container fleet varies from March 2018 to December 2020 according to the monthly variance in freight rates.
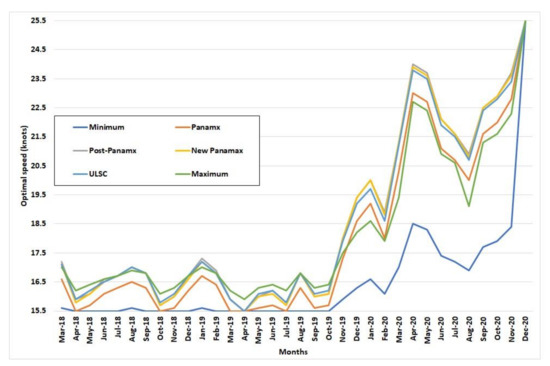
Figure 13.
Optimal speed for selected vessels depending on the month.
Figure 13 shows that as the freight rate increases so does the optimal speed for any container vessel. Surprisingly, the range of the optimal speed for any container ship over those three years is around 10 knots. The high FBX11 rates from the beginning of 2020 onwards are unusual (see Figure 6) and are probably influenced by SARS-CoV-2 (COVID-19), as acknowledged in [58]. In an established freight rate market fluctuation, the range of variation in optimal speed is 1.8 knots, as can be observed from March 2018 to October 2019.
4.4. Analysis of Sensitivity to Future Emission Prices
Spot carbon prices have tended to rise, as can be seen in Figure 7. Futures prices also have a growing shape (Table 9).

Table 9.
Carbon emission futures prices.
We next explore the impact of carbon prices of $50/tonne and $100/tonne for the selected vessels. The results are shown in Table 10 and Table 11, respectively. In all calculations it is assumed that carbon prices are not passed on to freight rates.

Table 10.
Optimal behaviour of selected vessels with a carbon price of $50/tonne.

Table 11.
Optimal behaviour of selected vessels with a carbon price of $100/tonne.
Table 10 and Table 11 show that the optimal vessel speed decreases as the spot carbon price increases and/or a higher emission price percentage is applied, and consequently CO2 emissions also decrease. For the container ship range from 4500–15,000 TEUs the speed difference found is around 3 knots and for VLC it is 2 knots. Emissions savings are around 3.2 tonnes/TEU for the 50% emission price and 4.8 for the 100% emission price if the allowance price is $50/tonne, and 6.5 tonnes/TEU if the price rises to $100/tonne.
The variable margin decreases from around $4100, $3800 and $3600/TEU with carbon at $50/tonne to $3200 at $100/ tonne.
A price increase in emissions or the application of a higher emission percentage would not affect the variable margin per TEU as much as it lowers CO2 emissions, by nearly 50% in the most severe ETS scenario, thus helping to meet environmental GHG targets.
5. Discussion and Conclusions
The IMO has agreed to reduce GHG emissions across international shipping by at least 40% by 2030 on 2008 figures, which means around 320 million tonnes. Forecasts predict an increase of 90–130% on 2008 emissions by 2050 in a business-as-usual scenario. Different measures can be applied to decarbonise the maritime industry. This study focuses on an operational measure for reducing vessel speed known as slow steaming, which was common practice 10 years ago when freight rates were low. This measure is related to other recent proposed MBMs such as pollution charges and ETS carbon prices. The European Green Deal is looking into extending the ETS to the maritime sector and countries such as China have already done so.
This study focuses on the container ship fleet, as it accounts for the largest proportion of GHG and its average service speed is the highest of any category due to its business model. An economic model is proposed to obtain the optimal speed for any container vessel from 2000 up to 20,000 TEUs, maximizing its annual economic margin with and without carbon allowance prices under the EU ETS. We consider voyage costs such as bunker costs, emission allowance prices, port costs for container loading and unloading, port duties and canal tolls for a leg of a round trip from Shanghai to Rotterdam via the Suez Canal. As income we apply the global container freight index.
The proposed model can be used for a specific vessel with its characteristics as several boats of the same size may have different characteristics depending on ship structure, flow resistance, engine power, type of screw/thruster and others.
The model calculates the total variable margin using the optimal operation mode what is the most relevant value because it can be used with the fixed costs in the calculation of the annual cash flows. These annual cash flows can be used in financial models as the Net Present Value (NPV) to estimate the value of the remaining vessel life, also the calculated cash flows can be used to estimate the profitability of investing in a vessel, using in this case its characteristics. The proposed model can be used dynamically in each round trip to obtain different values depending on the value of variables as freight rate, emission prices, fuel prices and others. Optimal behaviour is analysed in three different scenarios: with 0% emission price and applying 50% and 100% of the emission allowance. The study also analyses the results from two different perspectives: per vessel and per TEU transported. The model can be used to calculate the impacts of CO2 emission reduction in a climate policy on the vessel industry such as the container ship sector. Using representative input values of the vessel characteristics according to each TEU size range, it is possible to calculate the effects of profitability and emission reduction in this sector. This model enables us to know whether, if this MBM is implemented, how much helps to reach IMO’s environmental targets. This climate policy can also contribute to the reduction of other GHG proportionally generating a positive impact on GWP.
Our findings, in the case study, reveal that the highest optimal speeds are those of vessels in the range of 5500–13,000 TEUs. From 13,000 TEUs onwards, as vessels get larger the optimal speed drops steadily in all three scenarios and the optimal speed with no emission prices tends to converge to that for 100% application of carbon prices. The difference in optimal speed for the 50% scenario from 15,000 TEU onwards does not decrease as fast as in the 100% ETS scenario.
For the 100% emission price scenario the most profitable fleet segment is from 8500 to 14,800 TEUs, where there is a variable average margin of around $3800/TEU and an emission cost of around $280/TEU, with around 10.5 tonnes/TEU being emitted. For VLC the margin is $3378.57/TEU and 8.33 tonnes of CO2 is produced per TEU. If no emission prices are applied, emissions are around 50% higher than in the 50% and 100% emission price scenarios and the variable margin is 7% higher for the most profitable vessel segment.
In all three scenarios, the tonnes of CO2 emitted per TEU are found to decrease as the number of TEUs transported in a vessel increases. As freight rates increase so does the optimal speed for all container vessels: in an established freight rate market the variation in optimal speed range is 1.8 knots.
Finally, we conduct a CO2 sensitivity analysis, as there may be considerable volatility in future market prices. We assume that those prices are not passed on to freight rates. Optimal vessel speed is seen to decrease as the spot carbon price increases and/or a higher emission price percentage is applied. A price increase in emissions or the application of a higher emission percentage does not affect the variable margin as much as it lowers CO2 emissions by nearly 50% in a $100/tonne and 100% application scenario, thus helping considerably to meet environmental GHG targets.
Author Contributions
Conceptualisation, N.G. and L.M.A.; writing—original draft preparation, N.G. and L.M.A.; writing—review and editing, N.G. and L.M.A. model calculations, L.M.A.; data curation, N.G. and L.M.A. All authors have read and agreed to the published version of the manuscript.
Funding
This research is supported by the Basque Government through the BERC 2018–2021 programme and by the Spanish Ministry of Economy and Competitiveness (MINECO) through BC3 María de Maeztu excellence accreditation MDM-2017-0714. Further support is provided by the project MINECO RTI 2018-093352-B-I00.
Data Availability Statement
Not applicable.
Acknowledgments
The authors are grateful to Jon Garate from Boluda and Christoph Hahnkam and Magdalena Czernik from Alfinter International Forwarding for their guidance in helping to understand the shipping industry. The authors would like to extend their thanks to Anton Bar from Freightos Baltic Index for his advice on freight rates.
Conflicts of Interest
The authors declare that they are not affected by any conflict of interest. The funders had no role in the design of the study, the collection, analysis or interpretation of data, the writing of the manuscript or the decision to publish the results.
Appendix A. Port Duties
On arrival at a port, charges and dues are incurred. We calculate tariffs using the general terms and conditions of the Port of Rotterdam for 2021 (https://www.portofrotterdam.com/sites/default/files/general-terms-and-conditions-including-port-tariffs-2021.pdf (accessed on 15 July 2021) as shown in Table A1. The port dues calculated are consistent with the figures proposed by [59] in a study of liner sailing costs (specifically, port charges are estimated to be in the range of $7–18/TEU). La Vissiere [60] analyses port dues and classifies them in two categories: Gross Tonnage-based and cubic feet-based. Meersman et al. [61] recognise that port pricing is a very complicated matter and sometimes lacks transparency. Here, we assume that the port duties in Rotterdam and Shanghai are the same.

Table A1.
Port duties at the port of Rotterdam in €.
Table A1.
Port duties at the port of Rotterdam in €.
| TEU-s | Port Dues (€) |
|---|---|
| 2000 | 24,078.48 |
| 3000 | 35,679.48 |
| 4000 | 47,499.60 |
| 5000 | 59,100.60 |
| 6000 | 70,263.36 |
| 7000 | 81,426.12 |
| 8000 | 92,588.88 |
| 9000 | 104,409.00 |
| 10,000 | 115,571.76 |
| 11,000 | 126,734.52 |
| 12,000 | 137,897.28 |
| 13,000 | 149,060.04 |
| 14,000 | 160,222.80 |
| 15,000 | 170,728.20 |
| 16,000 | 181,671.84 |
| 17,000 | 192,396.36 |
| 18,000 | 203,778.24 |
| 19,000 | 213,845.40 |
| 20,000 | 224,350.80 |
Appendix B. Suez Canal Tolls
Ships passing through the Suez Canal have to pay a toll. Toll costs are estimated through the Suez online calculator, https://lethagencies.com/egypt/calculator-suez (accessed on 15 July 2021), based on various parameters such as vessel type, Suez Canal Net Tonnage (SCNT), Gross Tonnage (GRT), draft, northbound or southbound, and laden or ballast. We estimate that the toll for container ships ranges from 2000 to 20,000 TEU-s. We calculate draft based on the draft/TEU ratio proposed by [62]. Dead Weight Tonnage (DWT) is based on the DWT/TEU ratio reported by [63], SCNT is calculated as roughly half the vessel’s DWT and GRT is calculated using an average GRT/DWT ratio based on container ships reported in [64]. Entering all these parameters in the Suez online calculator, the figures shown in Table A2 emerge.

Table A2.
Suez Canal toll estimates in US $.
Table A2.
Suez Canal toll estimates in US $.
| TEU-s | Northbound (Shanghai–Rotter.) | Southbound (Rotter.-Shanghai) |
|---|---|---|
| 2000 | 119,088.36 | 65,601.04 |
| 3000 | 152,234.35 | 83,447.10 |
| 4000 | 181,495.07 | 103,058.41 |
| 5000 | 205,160.30 | 117,229.73 |
| 6000 | 225,049.74 | 129,080.32 |
| 7000 | 244,812.42 | 140,931.92 |
| 8000 | 263,848.82 | 152,783.01 |
| 9000 | 302,009.92 | 181,705.56 |
| 10,000 | 320,475.48 | 190,150.88 |
| 11,000 | 338,886.67 | 198,596.22 |
| 12,000 | 357,638.99 | 207,041.54 |
| 13,000 | 376,050.18 | 215,486.87 |
| 14,000 | 393,298.94 | 223,682.20 |
| 15,000 | 403,648.87 | 229,672.03 |
| 16,000 | 416,884.52 | 237,297.83 |
| 17,000 | 428,677.31 | 244,104.09 |
| 18,000 | 444,548.65 | 253,118.95 |
| 19,000 | 452,012.90 | 257,466.61 |
| 20,000 | 476,664.37 | 263,453.35 |
Appendix C. Average Port Time
On arrival in port there can be disruption related to congestion in docks, affecting whether terminals can attend to a vessel or not. Operational efficiency also differs from port to port, and there may be disruptions at sea which influence planned vessel schedules [65] and affect the sailing days per year of a vessel. Wan et al. [33] use a figure of 10 days stopped at port per loop for a post-panamax container ship. UNCTAD [48] reports a median time spent in each port on single port calls of 23.5 h for container ships. Container handling operations depend on the functionality of each port, and Ahmed et al. [66] report an overall productivity rate for loading and unloading cargo on a quay crane of 61.68 TEUs/. Obviously, the longer the vessel the more cranes that need to be employed.
In this study we use the data reported by [55], collected over three years (2014–2016) from the Port Management Information System (PORT-MIS), which show the average waiting time for berth allocation and average loading/unloading time to give the average port time per TEU ship size classification (see Table A3).

Table A3.
Average port time depending on ship classification.
Table A3.
Average port time depending on ship classification.
| Ship Classification (TEU) | Average Waiting Time (h) | Average Berthing Time (h) | Average Port Time (h) |
|---|---|---|---|
| 10,001–20,000 | 75.5 | 21.5 | 97.0 |
| 8001–10,000 | 54.0 | 19.8 | 73.8 |
| 5001–8000 | 69.6 | 17.1 | 86.7 |
| 3001–5000 | 36.6 | 14.6 | 51.2 |
| 1001–3000 | 22.4 | 8.7 | 31.1 |
| 501–1000 | 20.0 | 7.4 | 27.4 |
| 1–500 | 14.2 | 7.7 | 21.9 |
References
- MEPC. Resolution MEPC 304 (72), Initial IMO Strategy on Reduction of GHG Emissions from Ships. 2018. Available online: https://www.imo.org/en/OurWork/Environment/Pages/GHG-Emissions.aspx (accessed on 15 July 2021).
- United Nations. Paris Agreement. 2016. Available online: https://unfccc.int/process-and-meetings/the-paris-agreement/what-is-the-paris-agreement (accessed on 15 July 2021).
- EU. The European Green Deal EN. Communication from the Commission to the European Parliament, the European Council, the European Economic and Social Committee and the Committee of Regions, Brussel 11.12.2019 COM 640, 30 March 2019. 2019. Available online: https://eur-lex.europa.eu/legal-content/EN/TXT/PDF/?uri=CELEX:52019DC0640&from=EN (accessed on 15 July 2021).
- MEPC. Final Report MEPC 75/7/15 Reduction of GHG Emissions from Ships, Fourth IMO GHG Study 2020. 2020. Available online: https://imoarcticsummit.org/wp-content/uploads/2020/09/MEPC-75-7-15-Fourth-IMO-GHG-Study-2020-Final-report-Secretariat.pdf (accessed on 15 July 2021).
- Bullock, S.; Mason, J.; Broderick, J.; Larkin, A. Shipping and the Paris climate agreement: A focus on committed emissions. BMC Energy 2020, 2, 5. [Google Scholar] [CrossRef]
- Balcombe, P.; Brierley, J.; Lewis, C.; Skatvedt, L.; Speirs, J.; Hawkes, A.; Staffel, I. How to decarbonise international shipping: Options for fuels, technologies and policies. Energy Conv. Manag. 2019, 182, 72–88. [Google Scholar] [CrossRef]
- Faber, J.; Huigen, T.; Nelissen, D. Regulating Speed: A Short Term Measure to Reduce Maritime GHG Emissions. CE Delft. 2017. Available online: https://cedelft.eu/wp-content/uploads/sites/2/2021/03/CE_Delft_7L90_Regulating_speed_DEF.pdf (accessed on 15 July 2021).
- European Commission. 2019 Annual Report from the European Commission on CO2 Emission from Maritime Transport. 2020. Available online: https://ec.europa.eu/clima/sites/default/files/transport/shipping/docs/swd_2020_82_en.pdf (accessed on 15 July 2021).
- Ronen, D. The effect of oil price on containership speed and fleet size. J. Oper. Res. Soc. 2011, 62, 211–216. [Google Scholar] [CrossRef]
- Meyer, J.; Stahlbock, R.; Voß, S. Slow steaming in container shipping. In Proceedings of the 45th Hawaii International Conference on System Sciences, Maui, HI, USA, 4–7 January 2012. [Google Scholar] [CrossRef]
- Czermanski, E.; Cirella, G.T.; Oniszczuk-Jastrzabek, A.; Pawlowska, B.; Notteboom, T. An energy consumption approach to estimate air emission reductions in container shipping. Energies 2021, 14, 278. [Google Scholar] [CrossRef]
- Psaraftis, H.N. Speed optimization vs. speed reduction: The choice between speed limits and bunker levy. Sustainability 2019, 11, 2249. [Google Scholar] [CrossRef]
- Polo, G. On maritime transport costs, evolution, and forecast. Ship Sci. Technol. 2012, 5, 19–31. [Google Scholar] [CrossRef]
- Glave, T.; Joerss, M.; Saxon, S. The Hidden Opportunity in Container Shipping; McKinsey & Company: Chicago, IL, USA, 2014; Available online: https://www.mckinsey.com/business-functions/strategy-and-corporate-finance/our-insights/the-hidden-opportunity-in-container-shipping (accessed on 15 July 2021).
- Zanne, M.; Pocuca, M.; Bajec, P. Environmental and economic benefits of slow steaming. Trans. Marit. Sci.-ToMS 2013, 2, 123–127. [Google Scholar] [CrossRef][Green Version]
- Faber, J.; Nelissen, D.; Hon, G.; Wang, H.; Tsimplis, M. Regulated Slow Steaming in Maritime Transport: An Assessment of Options, Costs and Benefits; Publication Code: 12.7442.23; CE Delft: Delft, The Netherlands, 2012; Available online: https://theicct.org/sites/default/files/publications/CEDelft_slow_steaming_2012.pdf (accessed on 19 August 2021).
- Cepeda, M.; Assis, L.F.; Marujo, L.G.; Caprace, J.D. Effects of slow steaming strategies on a ship fleet. Mar. Syst. Ocean Technol. 2017, 12, 178–186. [Google Scholar] [CrossRef]
- Gurning, S.R.O.; Busse, W.; Lubnan, M. Decision making of full speed, slow steaming, extra slow steaming and super slow steaming using TOPSIS. Int. J. Marit. Eng. Innov. Res. 2017, 2, 41–50. [Google Scholar] [CrossRef][Green Version]
- Healy, S.; Graichen, J. Impact of Slow Steaming for Different Types of Ships Carrying Bulk Cargo; Öko-Institute e.V.: Freiburg, Germany, 2019; Available online: https://www.oeko.de/publikationen/p-details/impact-of-slow-steaming-for-different-types-of-ships-carrying-bulk-cargo (accessed on 15 July 2021).
- Haralambides, H.E.; Thanopoulou, H. The economic crisis of 2008 and world shipping: Unheeded warnings. J. Econ. Bus. 2014, 64, 5–13. [Google Scholar]
- Finnsgard, C.; Kalantari, J.; Raza, Z.; Roso, V.; Woxenius, J. Swedish shippers’ strategies for coping with slow-steaming in deep sea container shipping. J. Ship. Trade 2018, 3, 8. [Google Scholar] [CrossRef]
- Psaraftis, H.N.; Kontovas, C.A. CO2 emissions statistics for the world commercial fleet. WMU J. Marit. Aff. 2009, 8, 1–25. [Google Scholar] [CrossRef]
- Buhaug, Ø.; Corbett, J.J.; Eyring, V.; Endresen, Ø.; Faber, J.; Hanayama, S.; Lee, D.S.; Lindstad, H.; Markowska, A.Z.; Mjelde, A.; et al. Second IMO GHG Study 2009 Final Report Covering Phase 1 and Phase 2. International Maritime Organization (IMO) (Included as Annex in Document MEPC59/INF.10). 2009. Available online: https://www.transportenvironment.org/docs/mepc59_ghg_study (accessed on 15 July 2021).
- Mersin, K.; Bayirhan, I.; Gazioglu, C. Analysis of the effects of CO2 emissions sourced by commercial marine fleet by using energy efficiency design index. Therm. Sci. 2020, 24, S187–S197. [Google Scholar] [CrossRef]
- Armstrong, V.N. Vessel optimization for low carbon shipping. Ocean Eng. 2013, 73, 195–207. [Google Scholar] [CrossRef]
- Izquierdo, U.; Galera, L.; Albaina, I.; Esteban, G.A.; Aristondo, A.; Blanco, J.M. Experimental and numerical characterization of a 2D wave flume. Dyna 2019, 94, 662–668. [Google Scholar] [CrossRef]
- Vitali, N.; Prpic-Orsic, J.; Guedes, C. Coupling voyage and weather data to estimate speed loss of container ships in realistic conditions. Ocean Eng. 2020, 210, 106758. [Google Scholar] [CrossRef]
- Taskar, B.; Andersen, P. Benefit of speed reduction for ships in different weather conditions. Transport. Res. D Transp. Environ. 2020, 85, 102337. [Google Scholar] [CrossRef]
- Seithe, G.J.; Bonou, A.; Giannopoulos, D.; Georgopoulou, C.A.; Founti, M. Maritime transport in a life cycle perspective: How fuels, vessel types, and operational profiles influence energy demand and greenhouse gas emissions. Energies 2020, 13, 2739. [Google Scholar] [CrossRef]
- Lindstad, H.; Asbjornslett, B.; Stroman, A. Reductions in greenhouse gas emissions and cost by shipping al lower speeds. Energ. Policy 2011, 39, 3456–3464. [Google Scholar] [CrossRef]
- IMO. Third IMO Greenhouse Gas Study 2014. 2015. Available online: https://wwwcdn.imo.org/localresources/en/OurWork/Environment/Documents/Third%20Greenhouse%20Gas%20Study/GHG3%20Executive%20Sumary%20and%20Report.pdf (accessed on 15 July 2021).
- Bouman, E.A.; Lindstad, E.; Rialland, A.I.; Stromman, A.H. State-of-the-art technologies, measures, and potential for reducing GHG emissions from shipping—A review. Transport. Res. D Transp. Environ. 2017, 52, 408–421. [Google Scholar] [CrossRef]
- Wan, Z.; Makhloufi, A.; Chen, Y.; Tang, J. Decarbonizing the international shipping industry: Solutions and policy recommendations. Mar. Pollut. Bull. 2018, 126, 428–435. [Google Scholar] [CrossRef] [PubMed]
- Yang, H.; Ma, X.; Xing, Y. Trends in CO2 emissions from China-oriented international marine transportation activities and policy implications. Energies 2017, 10, 980. [Google Scholar] [CrossRef]
- ICS. Reducing CO2 Emissions to Zero: The “Paris Agreement for Shipping”; International Chamber of Shipping: London, UK, 2018; Available online: https://www.ammoniaenergy.org/wp-content/uploads/2021/04/ICS-Reducing-CO2-Emissions-to-Zero-The-%E2%80%98Paris-Agreement-for-Shipping-2018_07.pdf (accessed on 15 July 2021).
- IMO. Control of Greenhouse Gas Emissions from Ships Engaged in International Trade—Submission by the IMO to the UNFCCC AWG-LCA 8 at COP 15. Copenhagen. 2009. Available online: https://unfccc.int/files/methods/emissions_from_intl_transport/application/pdf/imo_awg-lca_8_submission.pdf (accessed on 15 July 2021).
- Kachi, A.; Mooldijk, S.; Warnecke, C. Carbon Pricing Options for International Maritime Emissions; New Climate-Institute for Climate Policy and Global Sustainability gGmbH: Berlin, Germany, 2019; Available online: https://newclimate.org/wp-content/uploads/2019/04/Carbon-pricing-options-for-international-maritime-emissions.pdf (accessed on 15 July 2021).
- Transport & Environment. Statistical Analysis of the Energy Efficiency Performance (EEDI) of New Ships Built in 2013–2017. 2017. Available online: https://www.transportenvironment.org/sites/te/files/publications/Statistical%20analysis%20of%20the%20energy%20efficiency%20performance%20%28EEDI%29%20of%20new%20ships.pdf (accessed on 15 July 2021).
- Lindstad, E.; Bo, T.I. Potential power setups, fuels and hull designs capable of satisfying future EEDI requirements. Transport. Res. D Transp. Environ. 2018, 63, 276–290. [Google Scholar] [CrossRef]
- Olmer, N.; Comer, B.; Roy, B.; Mao, X.; Rutherford, D. Greenhouse Gas Emissions from Global Shipping 2013–2015; The International Council on Clean Transportation: Washington, DC, USA, 2017; Available online: https://theicct.org/sites/default/files/publications/Global-shipping-GHG-emissions-2013-2015_ICCT-Report_17102017_vF.pdf (accessed on 15 July 2021).
- Prill, K.; Behrendt, C.; Szczepanek, M.; Michalska-Pozoga, I. A new method of determining energy efficiency operational indicator for spezialized ships. Energies 2020, 13, 1082. [Google Scholar] [CrossRef]
- European Union 2015/757 Regulation of the European Parliament and of the Council of 29April 2015 on the Monitoring, Reporting and Verification of Carbon Dioxide Emissions from Maritime Transport, and Amending Directive 2009/16/EC. Available online: https://eur-lex.europa.eu/legal-content/EN/TXT/PDF/?uri=CELEX:32015R0757&from=EN (accessed on 15 July 2021).
- Hermeling, C.; Klement, J.H.; Koesler, S.; Köhler, J.; Klement, D. Sailing into a dilemma: An economic legal analysis of an EU trading scheme for maritime emissions. Transp. Res. Part A Policy Pract. 2015, 78, 34–53. [Google Scholar] [CrossRef]
- ECSA; ICS. Implications of Application of the EU Emissions Trading System (ETS) to International Shipping, and Potential Benefits of Alternative Market-Based-Measures (MBMs). 2020. Available online: https://www.anave.es/images/documentos/ECSA_estudio_ETS.pdf (accessed on 15 July 2021).
- OECD/ITF International Transport Forum. Decarbonising Maritime Transport Pathways to Zero-Carbon Shipping by 2035. 2018. Available online: https://www.itf-oecd.org/decarbonising-maritime-transport (accessed on 15 July 2021).
- Lagouvardou, S.; Psaraftis, H.N.; Zis, T. A literature survey on market-based-measures for the decarbonisation of shipping. Sustainability 2020, 12, 3953. [Google Scholar] [CrossRef]
- Lee, T.; Nam, H. A study on green shipping in major countries: In the view of shipyards, shipping companies, ports, and policies. Asian J. Shipp. Logist. 2017, 33, 253–262. [Google Scholar] [CrossRef]
- UNCTAD. United Nations Conference on Trade and Development. Review of Maritime Transport 2019; UNCTAD: Geneva, Switzerland, 2020; ISBN 9789211129588. Available online: https://unctad.org/system/files/official-document/rmt2019_en.pdf (accessed on 19 August 2021).
- Zheng, B.; Jin, J.G.; Hu, H. Analysis of profitability for container shipping on artic routes by navigation speed and risk of disruption. Transp. Res. Record 2016, 2549, 54–63. [Google Scholar] [CrossRef]
- Kontovas, C.A. The green ship routing and scheduling problem (GSRSP): A conceptual approach. Transport. Res. Part D Transp. Environ. 2014, 31, 61–69. [Google Scholar] [CrossRef]
- Wan, Z.; Ge, J.; Chen, J. Energy-saving potential and an economic feasibility analysis for an Artic route between Shanghai and Rotterdam: Case study from China’s largest container sea freight operator. Sustainability 2018, 10, 921. [Google Scholar] [CrossRef]
- Containerships Group. 2018. Available online: http://www.containershipsgroup.com/wp-content/uploads/2016/05/Port-Tariff-2017-7.4.pdf (accessed on 15 July 2021).
- Fritsch, F.N.; Carlson, R.E. Monotone piecewise cubic interpolation. SIAM J. Numer. Anal. 1980, 17, 238–246. [Google Scholar] [CrossRef]
- Kahaner, D.; Moler, C.; Nash, S. Numerical Methods and Software; Prentice Hall: Hoboken, NJ, USA, 1988; ISBN 9780136272588. [Google Scholar]
- Park, N.K.; Suh, S.C. Tendency toward Mega containerships and the constraints of container terminals. J. Mar. Sci. Eng. 2019, 7, 131. [Google Scholar] [CrossRef]
- Corbett, J.J.; Koehler, H.W. Updated emissions from ocean shipping. J. Geophys. Res. 2003, 108, 4650. [Google Scholar] [CrossRef]
- Notteboom, T.; Cariou, P. Fuel surcharge practices of container shipping lines: Is it about cost recovery or revenue-making? In Proceedings of the IAME 2009 Conference, Copenhagen, Denmark, 24–26 June 2009. [Google Scholar]
- Blanco, J.M.; Ramos, J.C. Energy and climate change in the post-COVID-19 scenario. Dyna 2020, 95, 570–571. [Google Scholar] [CrossRef]
- Gkonis, K.G.; Psaraftis, H.N. Some Key Variables Affecting Liner Shipping Costs; Laboratory for Maritime Transport, National Technical University of Athens: Athens, Greece, 2010; pp. 1–22. Available online: http://martrans.org/documents/2009/prt/TRB_paper%2010_3188_Gkonis_Psaraftis_revised.pdf (accessed on 24 April 2021).
- La Vissiere, A. Vessel port dues: An influence from path dependency rather than geography ports. Asian J. Shipp. Logist. 2018, 34, 61–70. [Google Scholar] [CrossRef]
- Meersman, H.; Strandenes, S.P.; Van de Voorde, E. Port Pricing: Principles, Structure and Models; Discussion Paper No. 14/2014; NHH Department of Economics: Bergen, Norway, 2014. [Google Scholar] [CrossRef][Green Version]
- Rodrigue, J.P. The Geography of Transport System; Routledge: London, UK, 2020; ISBN 9780367364632. Available online: https://transportgeography.org/contents/chapter5/maritime-transportation/draft-containership-capacity/ (accessed on 22 April 2021).
- Abramowski, T.; Cepowski, T.; Zvolenský, P. Determination of regression formulas for key design characteristics of container ships at preliminary design stage. New Trends Prod. Eng. 2018, 1, 247–257. [Google Scholar] [CrossRef]
- Sys, C.; Blauwens, G.; Omey, E.; Van de Voorde, E.; Witlox, F. In search of the link between ship size and operations. Transp. Plan. Technol. 2008, 31, 435–463. [Google Scholar] [CrossRef]
- Abioye, O.F.; Dulebenets, M.A.; Pasha, J.; Kavoosi, M. A vessel schedule recovery problem at the liner shipping route with emission control areas. Energies 2019, 12, 2380. [Google Scholar] [CrossRef]
- Ahmed, E.; El-Abbasy, M.S.; Zayed, T.; Alfalah, G.; Alkass, S. Synchronized scheduling model for container terminals using simulated double-cycling strategy. Comput. Ind. Eng. 2021, 154, 107118. [Google Scholar] [CrossRef]
Publisher’s Note: MDPI stays neutral with regard to jurisdictional claims in published maps and institutional affiliations. |
© 2021 by the authors. Licensee MDPI, Basel, Switzerland. This article is an open access article distributed under the terms and conditions of the Creative Commons Attribution (CC BY) license (https://creativecommons.org/licenses/by/4.0/).