Abstract
Data centres are a key infrastructure for the global digital economy, helping enable the EU “Digital Decade” by 2030. In 2015, data centres were estimated to consume 2.5% of EU electricity demand. In Ireland, the concentrated presence of data centres could consume 37% of national electricity demand by 2028. The uncertainty of data centre facility-level energy efficiency paired with the need to achieve a low-carbon economy pose significant challenge for generation and transmission network planning. This is the first paper to apply a model of technology diffusion with a national forecast of changes in Irish data centre electricity demand through more efficient liquid cooling. The methodology serves as a technology-agnostic resource for practitioners performing forecasts under uncertainty with limited information. Results suggest that technology adoption could lower national electricity demand by 0.81% if adopted by new plant from 2019 to 2028. Savings rise to 3.16% over the same period if adopted by new and existing data centres. Adoption would also lower related emissions by 4.70% and 23.04% over the same period across both scenarios, respectively. Results highlight substantial potential electricity and associated emissions savings available in the sector and suggest policy options to support a transition towards a low-carbon economy.
1. Introduction
1.1. Rise of the Digital Economy
Most economic agents struggle to predict the future. This makes it difficult for policy makers to be proactive and forward looking in their design of regulations and price controls. A classic example of this concept is how few could have predicted how reliant the modern economy would become on the internet as an engine for economic growth. Internet infrastructure is viewed by the European Commission as “a key new type of economic asset” [1,2], the UN lists affordable internet access as a Sustainable Development Goal [3] and it is estimated that four billion people are currently without internet access [4]. At the same time, the European Union has outlined its ambition to become a net-zero economy by 2050 [5]. The increasing prominence of data centres as a pillar of internet connectivity presents an important opportunity as part of the transition towards a low-carbon economy.
The policy ambition behind increasing internet access is justified. Pradhan et al. [6] found evidence of a long-run relationship between the percentage of a country’s population with internet connectivity and economic growth, inflation and government expenditure for OECD countries during the period 1990–2010. Koutroumpis [7] found a significant causal impact of increased broadband penetration on economic growth for OECD countries. In the United States, the adoption of internet is associated with increased economic activity, higher income growth and lower unemployment growth in rural areas [8]. Lechman and Kaur [9] suggest a link between increasing internet connectivity, ICT use and improved social progress in developing countries from 2000 to 2014. Recent years have highlighted the importance of internet connectivity to support remote working and economic growth and development in rural regions [10]. Failure to improve internet connectivity has the potential to widen inequalities across countries, firms and workers [11].
The trend towards increasing digitalisation is unlikely to reverse. The volume of data in the global economy is expected to grow rapidly in the coming years, with estimates that global annual internet traffic will be 3.3 ZB in 2021 (zettabyte, or one trillion gigabytes), almost triple the 2016 level of 1.2 ZB [12]. The International Data Corporation estimates that the ‘digital universe’ of data will grow from 4.4 ZB in 2013 to 44 ZB in 2020—more than doubling every two years (see https://corporate.delltechnologies.com/en-us/newsroom/announcements/2014/04/20140409-01.htm, accessed on 01 June 2021). At the European level, the proposed “Digital Decade” seeks to develop digitally skilled citizens, foster sustainable digital infrastructures and transform business and public services by 2030 on the pathway towards climate neutrality [13].
1.2. Data Centres and the Low-Carbon Transition
Data centres form the beating heart of the digital economy, helping facilitate innovations such as cloud computing [14], online transactions, social media [15] and driverless cars [16]. However, their significant energy footprint, private ownership status and rapid growth present a challenge to policy makers and network planners. For information-intensive firms, the data centre can represent half of the company’s corporate carbon footprint [15].
Estimates vary on the energy footprint of the data centre sector. Recent estimates suggest that data centres account for one per cent of global electricity demand [17]. In the EU, data centres were estimated to consume 78 TWh of electricity in 2015, 2.5% of total electricity use [18]. Koomey [19] estimates that global data centre electricity consumption doubled from 2000 to 2005 and increased by 56% from 2005 to 2010 (this analysis is based on commercial sales of server components and omits the largest ‘hyper-scale’ facilities). Ebrahimi et al. [20] estimate that US data centres consume between 1.3% and 2% of the US national electricity consumption. In a study of equipment shipment data, Shehabi et al. [21] forecast 2020 US data centre electricity use at approximately 70 billion kWh, noting how energy efficiency has prevented electricity use from rising proportionally with the exponential increase in data. Crucially, this relationship is contingent on the nature and diffusion of future energy efficiency technologies [21].
Despite the apparent savings on offer, evidence suggests that firms often fail to optimise data centre energy efficiency. The Uptime Institute estimate that 20% of the servers in a data centre are underutilised, with ‘comatose servers’ that idle on standby. Koomey and Taylor [22] found that 30% of servers (from a sample of 4000 across North America) delivered no computing services in the six months prior to monitoring. A subsequent study found that one-quarter of comatose servers were located in firms that took no action to remove them [23]. This represents a wasted opportunity to optimise energy use and limit emissions.
Accurately reporting plant-level efficiency is difficult. The most popular metric is Power Usage Effectiveness (PUE), which is the ratio of total data centre energy use divided by the energy for computing equipment. In a 2014 Uptime Institute survey of 1000 data centre managers, the average PUE is 1.7 (see https://journal.uptimeinstitute.com/annual-data-center-industry-survey-2014/ accessed on 01 October 2020). Brady et al. [24] find that firms manipulate PUE by including energy consumption that is not strictly for IT purposes. PUE also fails to account for hardware efficiency, energy productivity and environmental performance [25]. Ebrahimi et al. [20] note that rising energy costs are likely to spur adoption of more energy efficient technologies. However, research at the European level has noted that the introduction of a voluntary Data Centre Code of Conduct for Data Centre Energy Efficiency has been associated with improvements in average Power Usage Effectiveness [26].
Data centres can also serve as a key enabler within an integrated energy system. The ability for data centres to contribute to the low-carbon economy is reflected in their presence as a source of energy supply district heating networks [27]. In this scheme, it is expected that waste hot air from the data centre will be collected, run through a heat exchanger, and boosted by heat pump to supply the district heat network [28]. Internationally, data centres have been able to contribute to the local district heating network, with an Apple data centre in Viborg, Denmark as a prominent example [29].
1.3. Data Centre Cooling—An Area for Growth
A major source of energy demand from data centres is for cooling. Substantial literature exists on data centre server cooling technologies (see [20]). In most data centres, servers are fan-cooled with a power-hungry mechanical chiller which can be responsible for one-third of facility energy consumption [30]. One innovation has been air-side economisation (‘free air’ cooling), which reduces energy costs by using filtered outside air to cool servers instead of a mechanical chiller. ‘Free air’ cooling is popular in temperate climates, especially for ‘hyper-scale’ facilities. Song et al. [31] found that ‘free air’ cooling could reduce consumption by up to 35% compared, depending on location, weather and energy prices.
Another technology is direct liquid cooling, which pipes liquid through the computer server to remove heat. The use of direct liquid cooling has typically been required for High-Performance Computing units. However, it is suspected that typical data centres may require liquid cooling to operate effectively in the future (see http://www.datacenterknowledge.com/archives/2014/08/14/is-direct-liquid-cooling-making-a-comeback/ accessed on 1 June 2020). To remove heat, Greenberg et al. [32] note that liquid has a much higher thermal carrying capacity than air, being able to carry 3500-fold more heat. Sickinger et al. [33] find that a direct liquid cooling unit was easy to retrofit to an existing supercomputer. Contrary to industry concerns about liquid cooling leakage, there was no maintenance or leaks during 16 months of operation and over half of the heat emitted from the central processing unit could be recovered. Clearly, direct liquid cooling could eliminate the need for a mechanical chiller while reducing and reusing energy.
The management of waste heat is of interest to data centres given their significant level of electricity consumption. With waste heat capture, data centres could potentially meet data centre heating needs, replace power used in computer server cooling process, heat nearby premises or even convert waste heat to electricity and supply to the national grid [20]. The higher temperature of recovered heat through liquid cooling is a benefit, although there is a trade-off between the quality of the waste heat collected and effectively cooling servers [34].
An Apple data centre, located in Jutland, Denmark, aims to use data centre waste heat in nearby homes (see http://www.usadk.org/news/apple-establishes-one-of-the-worlds-largest-data-centres-in-denmark/ accessed on 1 June 2021) as part of an existing district heating network which supplies 64% of homes (see http://www.investindk.com/Clusters/Cleantech/Data-Centres accessed on 15 May 2021). Other work has noted the potential for data centres within a district heating network, but the significant capital cost of district heating remains a hurdle in many cases [35,36]. In Ireland, the pilot Tallaght District Heating Scheme seeks to reuse data centre waste heat with a heat pump to supply space and water heating for 1962 homes, 16,250 m2 of commercial space and 47,000 m2 of public buildings in South Dublin [37]. The scheme is expected to reduce carbon dioxide emissions by just under 1900 tonnes per year when operational in 2022. Table 1 provides an overview of popular data centre cooling methods.

Table 1.
Summary of key data centre server cooling technologies.
A conventional data centre is typically arranged with servers in ‘hot’ and ‘cold’ aisles to disperse heat [38]. Mechanically chilled air is channelled through the floor into the servers. In contrast, a liquid-cooled facility would replace the mechanical air conditioner unit with a closed loop of fluid to remove heat. There is general agreement on the continued increase in effective power density which could be better met through liquid cooling [39].
1.4. Ireland—The Heart of the Global Digital Economy
Ireland is responsible for 14% of the global trade in ICT services in 2016 ($70 billion), higher than any other country [40]. It is the second-largest European city in terms of data centre capacity, trailing London [41]. Industry reports note that Dublin accounts for one-quarter of the European data centre market, with over 53 data centres [42]. Ireland features the key infrastructure to support data centres including a secure electricity supply and technological readiness [43]. The data centre location decision is influenced by quality electricity supply, robust fibre broadband infrastructure and the presence of affordable business units [44].
Despite the large energy footprint of the data centre sector on a constrained island electricity network, sectoral growth is anticipated to continue due to the strong economic benefits. The Irish Development Agency surveyed a sample of 16 data centre managers and estimated that since 2010, the data centre sector has contributed €7.13 bn to the Irish economy [45]. The benefit is split into €4.64 bn in construction (of which €1.59 bn is indirect) and €2.49 bn in operational expenditures (of which €0.90 bn is also indirect). In response to concerns about the relatively low level of direct employment by data centres [46], IDA [45] notes that annual average employment from data centres is equivalent to 5700 full-time equivalent employees. Furthermore, they note that companies with a data centre in Ireland have increased their employment from 4000 to almost 10,000 since 2010.
The increasing emphasis on a digital economy across the European Union suggests that Ireland will continue to be an appealing destination for data centre investment. This is especially true considering the consequences of General Data Protection Regulation [47] for how international companies handle EU consumer data [48]. Paired with the exit of Britain from the EU, it is likely that UK-based firms might also need to relocate their data to comply with EU legislation.
The EU seeks to achieve climate neutrality by 2050 [49]. The 2030 climate targets include (i) sourcing 32% of the energy mix from renewable sources, (ii) reducing GHG emissions by 40% from 1990 levels and (iii) a 32.5% improvement in energy efficiency, relative to a 2007 forecast of 2030 energy use [50]. The European Union Green Deal aims to ensure net-zero greenhouse gas emissions by 2050, with economic growth decoupled from resource use and a just transition for affected citizens and regions [5]. The Green Deal raised the emissions target for 2030 from 40% to 55% [5]. Ireland aimed to improve energy efficiency by 20% before 2020, relative to average national energy use during the period 2001–2005 [51]. By early 2017, Ireland only achieved a 12% improvement in energy efficiency and is expected to miss the 2020 target by 3.77% [52]. More recently, Ireland is estimated to have exceeded its 2020 target for emissions reductions by 12.2 MtCO2 eq, suggesting a need for improved policy and climate action (see EPA (2021): https://www.epa.ie/news-releases/news-releases-2021/ireland-will-not-meet-its-2020-greenhouse-gas-emissions-reduction-targets-action-is-needed-now-to-meet-2030-eu-targets.php accessed on 22 June 2021).
The popularity of Ireland as a data centre destination poses significant challenges for the electricity grid. EirGrid, the Irish transmission system operator, estimates that approximately 490 MVA installed capacity of data centres in 2019 consumes approximately 13.9% of the national electricity demand (~4.3 TWh out of 30.9 TWh). By 2028, it is expected that data centres could be responsible for between 28% and 37% of national electricity demand, depending on the level of growth [53]. New data centre capacity is expected to drive three-quarters of the national growth in electricity demand over the next decade [54]. Figure 1 illustrates how national electricity demand forecasts (top panel) are heavily influenced by expected data centre capacity (bottom panel) across three demand scenarios:
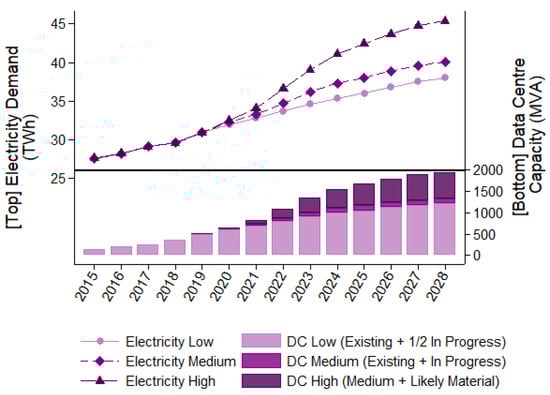
Figure 1.
Author’s illustration based on values from EirGrid [53] forecast of electricity demand and data centre capacity.
- Low: All existing data centre capacity and half of all in-progress enquiries;
- Medium: All existing data centre capacity and all in-progress enquiries;
- High: All existing, in-progress and likely material enquiries.
1.5. Aims and Objectives
Ireland has become a home to a thriving data centre industry while also failing to reach EU emissions reduction targets. Although data centres have many economic benefits that contribute towards a digital economy, future growth has the potential to undermine progress towards reducing energy use and emissions as part of the low-carbon transition.
This paper seeks to understand the potential for data centres to improve their energy demand resulting from a change in cooling technology. It applies an economic model of technology diffusion to forecast how potential efficiencies could be adopted over time. It is motivated by the recent rise in data centre energy demand and their potential to influence efforts to transition to a low-carbon economy. The innovation considered in this study is direct liquid server cooling, which addresses challenges posed by rising server power density, intensive mechanical air cooling and could serve as a source of low-carbon waste heat supply [20]. Garimella et al. [30] notes that liquid cooling could reduce total data centre electricity demand by one-third.
After quantifying the rate of technology adoption, it models the reduction in electricity use at both sector and national levels and quantifies associated CO2 emissions savings. This is the first study to use an economic model of technology diffusion in the context of the data centre sector. It serves as a helpful resource for researchers that are dealing with the need to provide sectoral forecasts under uncertainty with little detailed information. This is studied for Ireland, a key hub for global ICT activity, where data centres are expected to be responsible for between 28% and 37% of national electricity demand by 2028, depending on the level of construction [53].
2. Materials and Methods
This section outlines the methods and model used to address the questions of this research. It begins by contextualising this study within the framework of the Energy Efficiency Gap and specifies the model of technology diffusion which is applied to model sectoral electricity demand and related emissions (Section 2.1). Following this, the assumptions underlying the model are detailed and justified in addition to the data sources used and scenarios present in results (Section 2.2).
2.1. Model of Technology Diffusion
Rising global energy consumption and emissions pose a serious threat to the global economy [55]. Although there is limited research into the role of data centres in the energy system, there is a broad literature that explains why economic agents fail to engage with energy efficiency. The theory underlying the Energy Efficiency Gap posits that goods with a positive net present value are not as widely adopted as they should be [56,57]. This Gap is explained by market failures, model measurement error and behavioural factors.
In studying improved energy efficiency of consumer durable appliances in the 20th century, Newell et al. [58] found that autonomous technical change, standards and energy prices all influence the range of products on offer. In many cases, there is ample information on market participants and their purchasing decisions. Researchers are challenged by the lack of information in markets where purchasing decisions are not observable. In such cases, modelling technology diffusion serves a helpful purpose.
This study considers how energy efficient server cooling technology could be adopted in the Irish data centre market to reduce energy use and support a low-carbon transition. This study presents a novel methodology that can be applied across a variety of settings to address similar research questions where information is limited. Given the lack of private information on data centres, modelling market adoption helps quantify the potential benefit of upgrading, which could be used to design effective policies. It is especially helpful when public data are limited, as is the case with data centres, which are often privately. Early applications of diffusion have studied mortality [59] and economic growth [60].
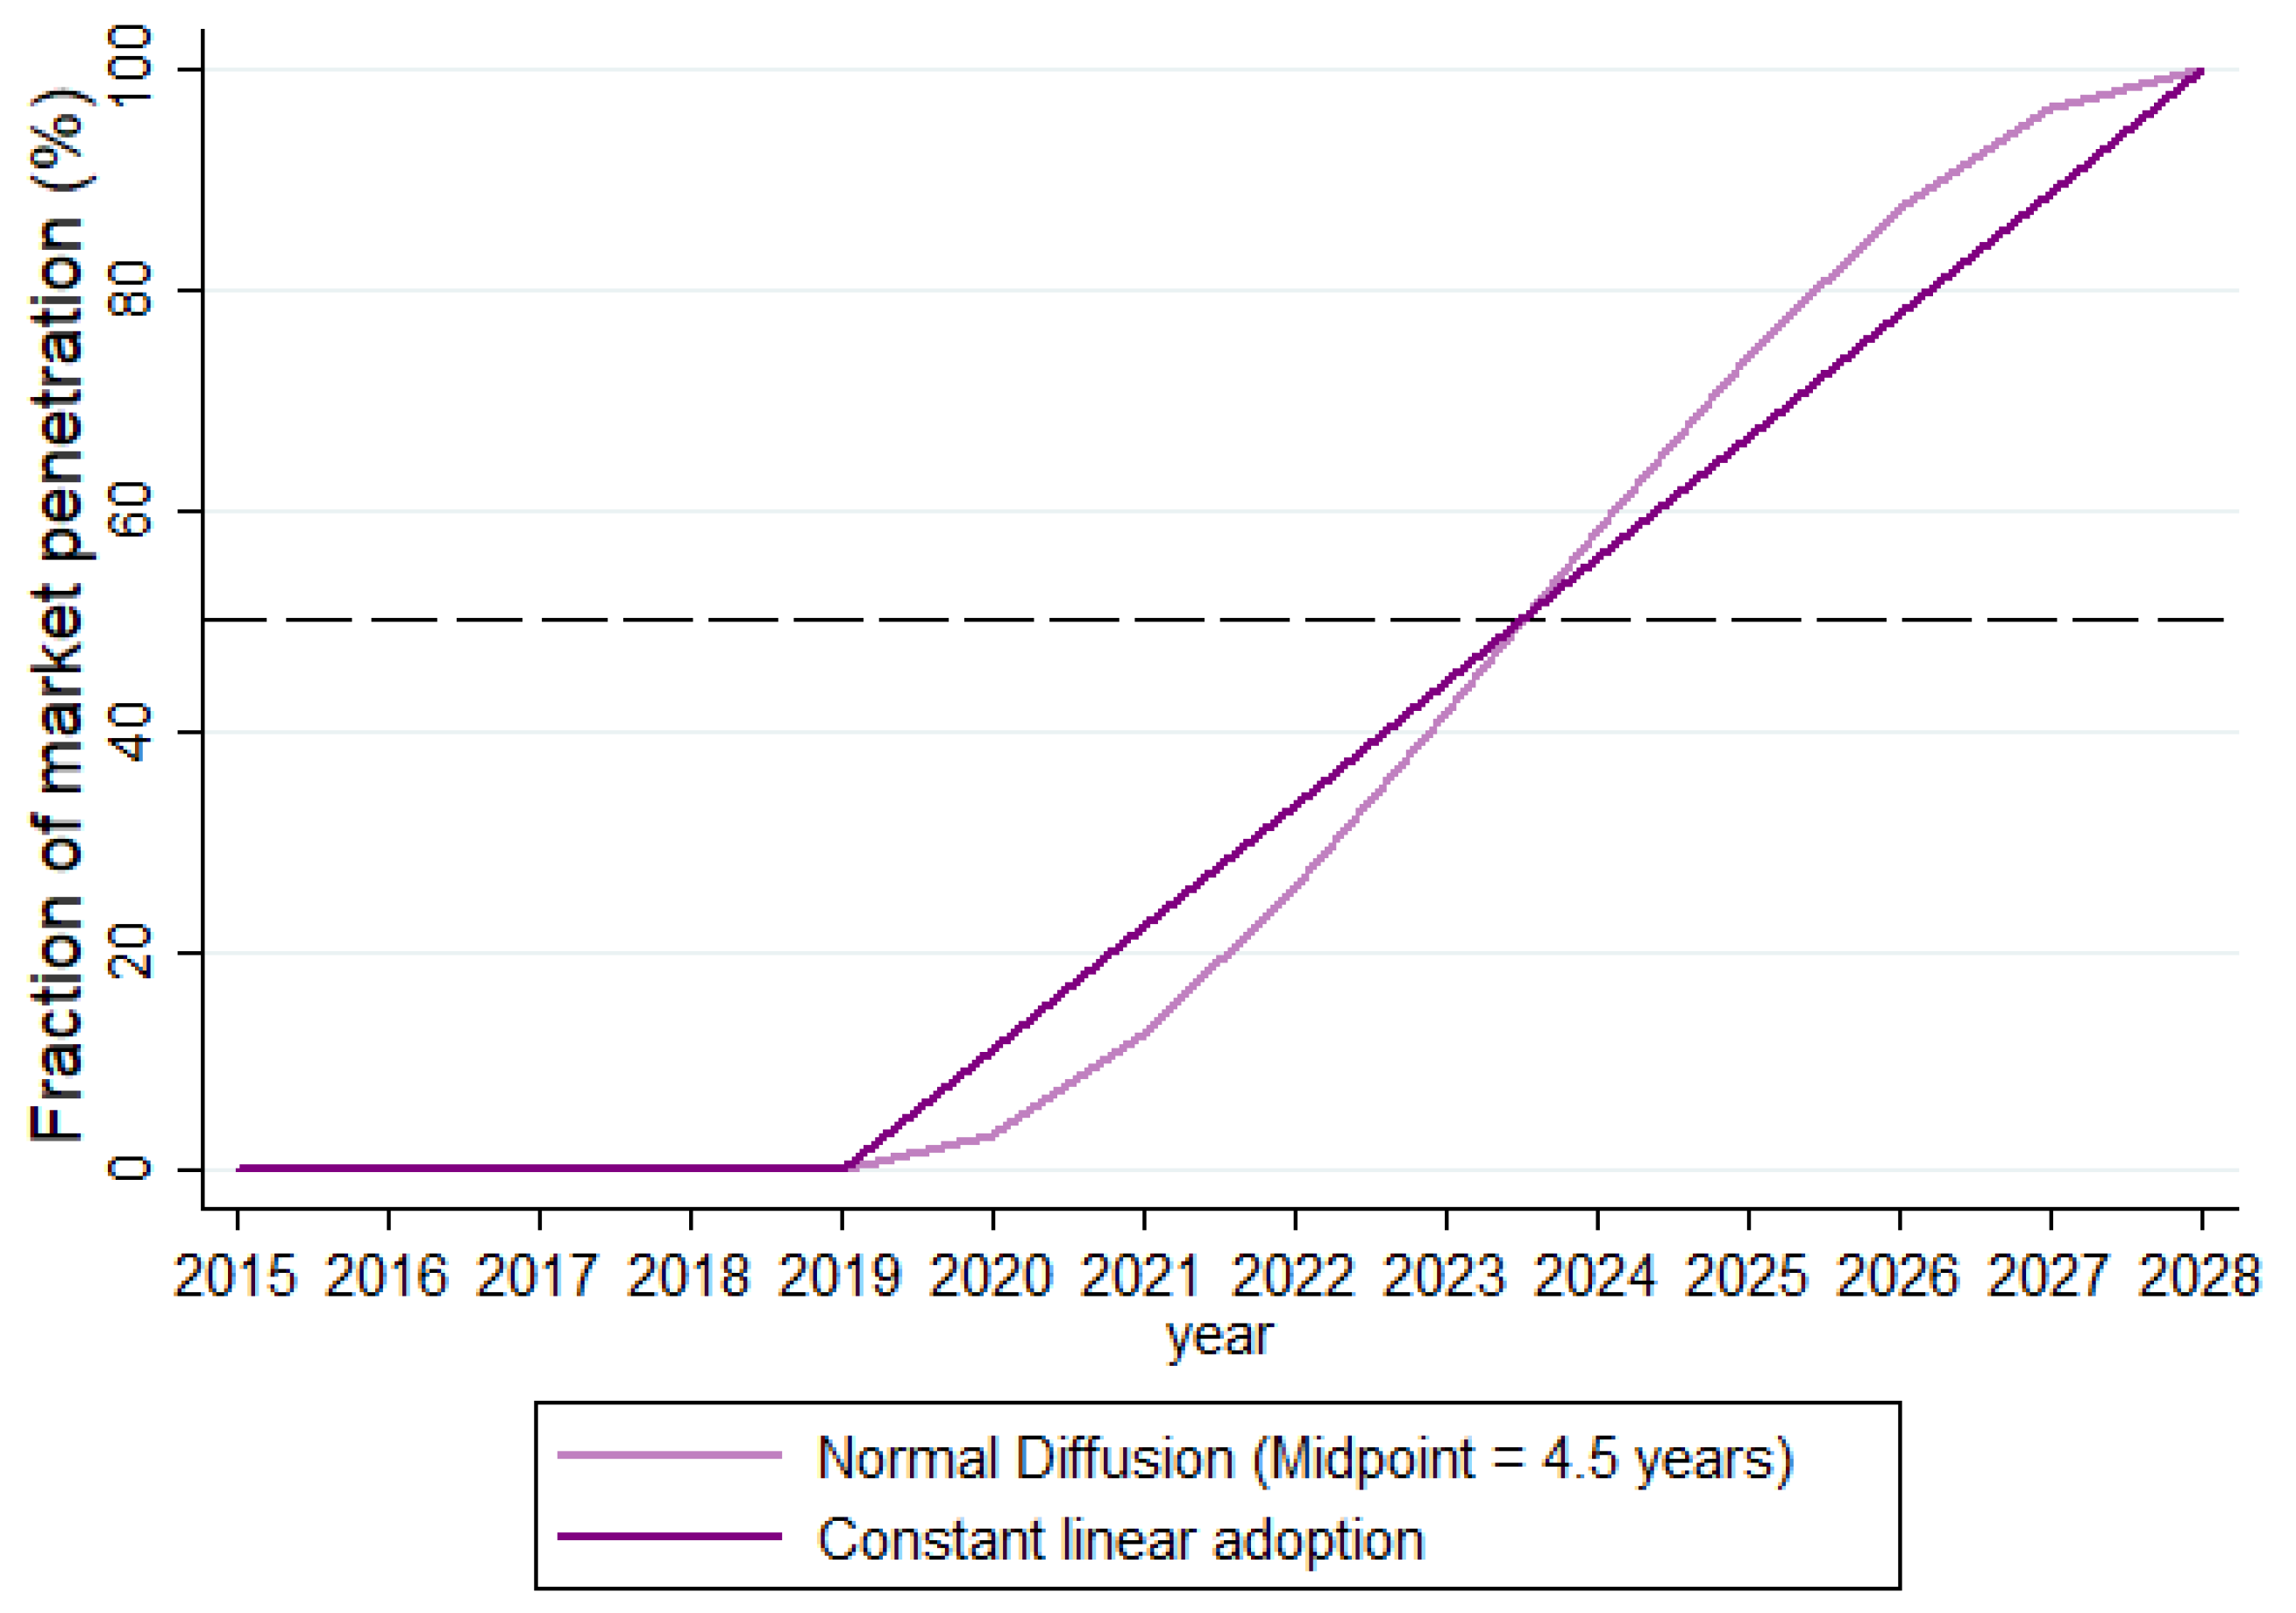
Jaffe and Stavins [57] note that the adoption of economically superior technologies is never instantaneous. In fact, market adoption usually approximates a sigmoid (s-shaped) curve. Technology adoption has been studied across a range of contexts: Energy efficient durable consumer goods [61], patterns of wind energy diffusion following policy interventions [62], the diffusion of electric vehicle charging points in Stuttgart over time [63]. Baptista [64] summarises key work in the area of induced diffusion. S-shaped diffusion features a slow initial uptake followed by growth as the product becomes more widely adopted before slowing down again as the market saturates. Davies and Diaz-Rainey [62] apply the Bass model [61] to sales of consumer durable goods to model expected diffusion.
Equation (1) denotes the general diffusion framework, where the change in diffusion (P) between two periods depends on the speed of diffusion (b), the current penetration rate relative to saturation (P(t)) and exogenous ‘external’ effects, such as advertising, marketing or government interventions (a). Where this is not present, a = 0.
The Gompertz curve is considered a better fit than the logistic curve to reflect technology diffusion [65]. The Gompertz function (Equation (2)) is an asymmetric curve, where the growth in a period (w) is a function of the maximum growth rate , which is 1 for full market adoption, a constant and the difference between the mid-point and end-point :
One limitation of the Gompertz curve is that it reaches its asymptotic peak at infinity. Yin et al. [66] adjust the curve to feature a defined end-point and mid-point . Following Equation (3), for any given period the proportional level of diffusion is related to the end- and mid-points of the specified horizon:
This paper considers the rate of diffusion of an energy efficiency technology (liquid server cooling) in the data centre sector in Ireland. The rate of diffusion determines how quickly the new technology is adopted and therefore the amount of energy saved each year. This paper follows Yin et al. [66] and assumes full market adoption by the end of 2028, which is consistent with the horizon forecast of data centre capacity developed by EirGrid, the Irish Transmission System Operator [53].
Following Equation (3), the symmetric ‘s-shaped’ adoption curve [66] is chosen as it is more representative of market behaviour than a constant adoption rate each year (Figure 1). Following this curve, initial adoption is slow, but increases as other firms observe the technology is viable. As the technology approaches full market adoption, growth slows due to saturation. Figure 2 illustrates the market adoption pattern, with adoption beginning in 2020 and ending in 2028, a nine-year period where the market reaches fifty percent saturation four and a half years into the horizon (mid 2023).
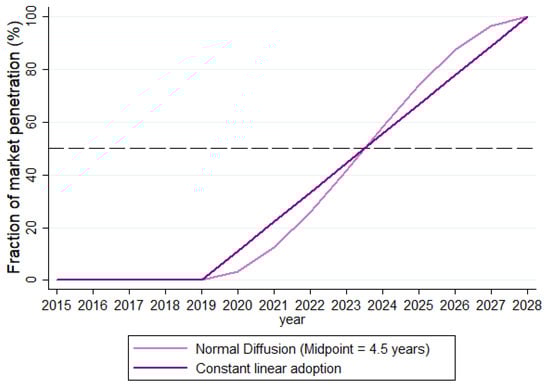
Figure 2.
Author’s comparison of linear and s-shaped market diffusion (2019–2028).
2.2. Assumptions, Data Sources and Modelling Scenarios
This study applies a model of technology diffusion to quantify the potential for liquid cooling technology to lower data centre energy use in Ireland. Given the lack of publicly available data, assumptions are needed regarding the composition of data centres:
- The market consists of identical data centres using standard mechanical air cooling.
- A form of direct liquid cooling for computer server cooling is adopted. This is chosen for two reasons: Firstly, rising demand for data services will require denser computer servers that require advanced liquid cooling. Secondly, increasing energy and climate awareness will spur interest in technologies that help reduce energy consumption and that have an additional benefit in reusing waste heat.
- The liquid cooling technology is assumed to provide a 33% reduction in data centre electricity demand (following Garimella et al. [30]). The additional benefit of reused waste heat is not quantified but is noted as an important factor for the commercial viability of liquid cooling adoption [30].
- Results assume a data centre capacity factor of 0.75 to convert plant capacity to actual load. This has been deemed an appropriate average value for the Irish market based on prior literature which has justified this value due to “design norms and allowance for capacity increase” [44].
This study uses a forecast of national data centre capacity from EirGrid [53]. Values are converted from units of megavolt ampere (MVA) to capacity units of megawatts (MW). Annual electricity demand is calculated by converting to megawatt hours (MWh) and multiplying by the number of days and hours and applying the capacity factor of 0.75 to estimate electricity demand. It is important to highlight that an alternative capacity factor could alter results. For example, a higher capacity factor (consuming closer to full capacity) would result in larger data centre electricity demand and larger energy savings when adopting energy efficiency measures (and vice versa).
The Irish government published a wide-ranging Climate Action Plan with consideration to “align the rapid growth in energy demand from data centres with grid infrastructure plans” [67]. Based on that, this study considers two types of data centres: those operational before 2020 (“existing (E)”) and those currently in the connection process (“new (N)”). This definition of new data centres is obtained from the EirGrid [53] medium demand forecast (Figure 1) of annual data centre market capacity categorised by existing data centres, those already in the connection process and likely material enquiries. The forecast commences in 2020 due to data availability and to ensure consistency with Irish policy targets.
In terms of cooling technology, data centres choose whether to use traditional mechanical air cooling using a vapour compression cycle (“M”) or the new liquid cooling that provides a 33% reduction in plant-level electricity use (“L”). Changes in electricity demand depend on the share of the market that adopts the new technology. Table 2 considers three scenarios which are present in results at the sectoral (Section 3.1) and national level (Section 3.2), with an additional forecast of related emissions at the national level (Section 3.3):
Table 2.
Taxonomy of energy efficiency technology adoption scenarios.
- Business as Usual (BAU: NM, EM): Liquid cooling is not adopted by any plant. Consumption in this case is assumed to match the projection provided by EirGrid.
- New Only Diffusion (ND: NL, EM): In this scenario, only the new data centres will adopt liquid cooling as the existing stock of data centres do not adopt the technology. The new data centres adopt liquid cooling in the period they commence operation.
- All Diffusion (AD: NL, EL): Both existing and new data centres adopt liquid cooling with the timing of adoption subject to the s-shaped diffusion model.
Prior literature has noted the important role of other technologies within the data centre that can influence energy demand such as server energy consumption, location and size [20,39]. This study is constrained by the aggregated nature of the data centre capacity data, the lack of public information regarding technology used at facility-level and the uncertainty surrounding technologies adopted in future data centre capacity. The scope of the issue for Ireland justifies a market-level study while prior literature and market trends have influenced the research focus on the adoption of liquid cooling technology.
3. Results
This section presents results following the previously discussed approach. Firstly, results are presented for the data centre sector (Section 3.1). This outlines the scope for efficiencies in data centre cooling over the coming years. This is followed by results presented at the national level (Section 3.2). These results provide context on how Ireland is particularly sensitive to the data centre sector and stands to benefit from any efficiencies in their energy demand. The final set of results (Section 3.3) quantify the reduced emissions as a result of reduced electricity demand. This is an important societal benefit of the reduction in data centre energy use.
3.1. Data Centre Electricity Demand
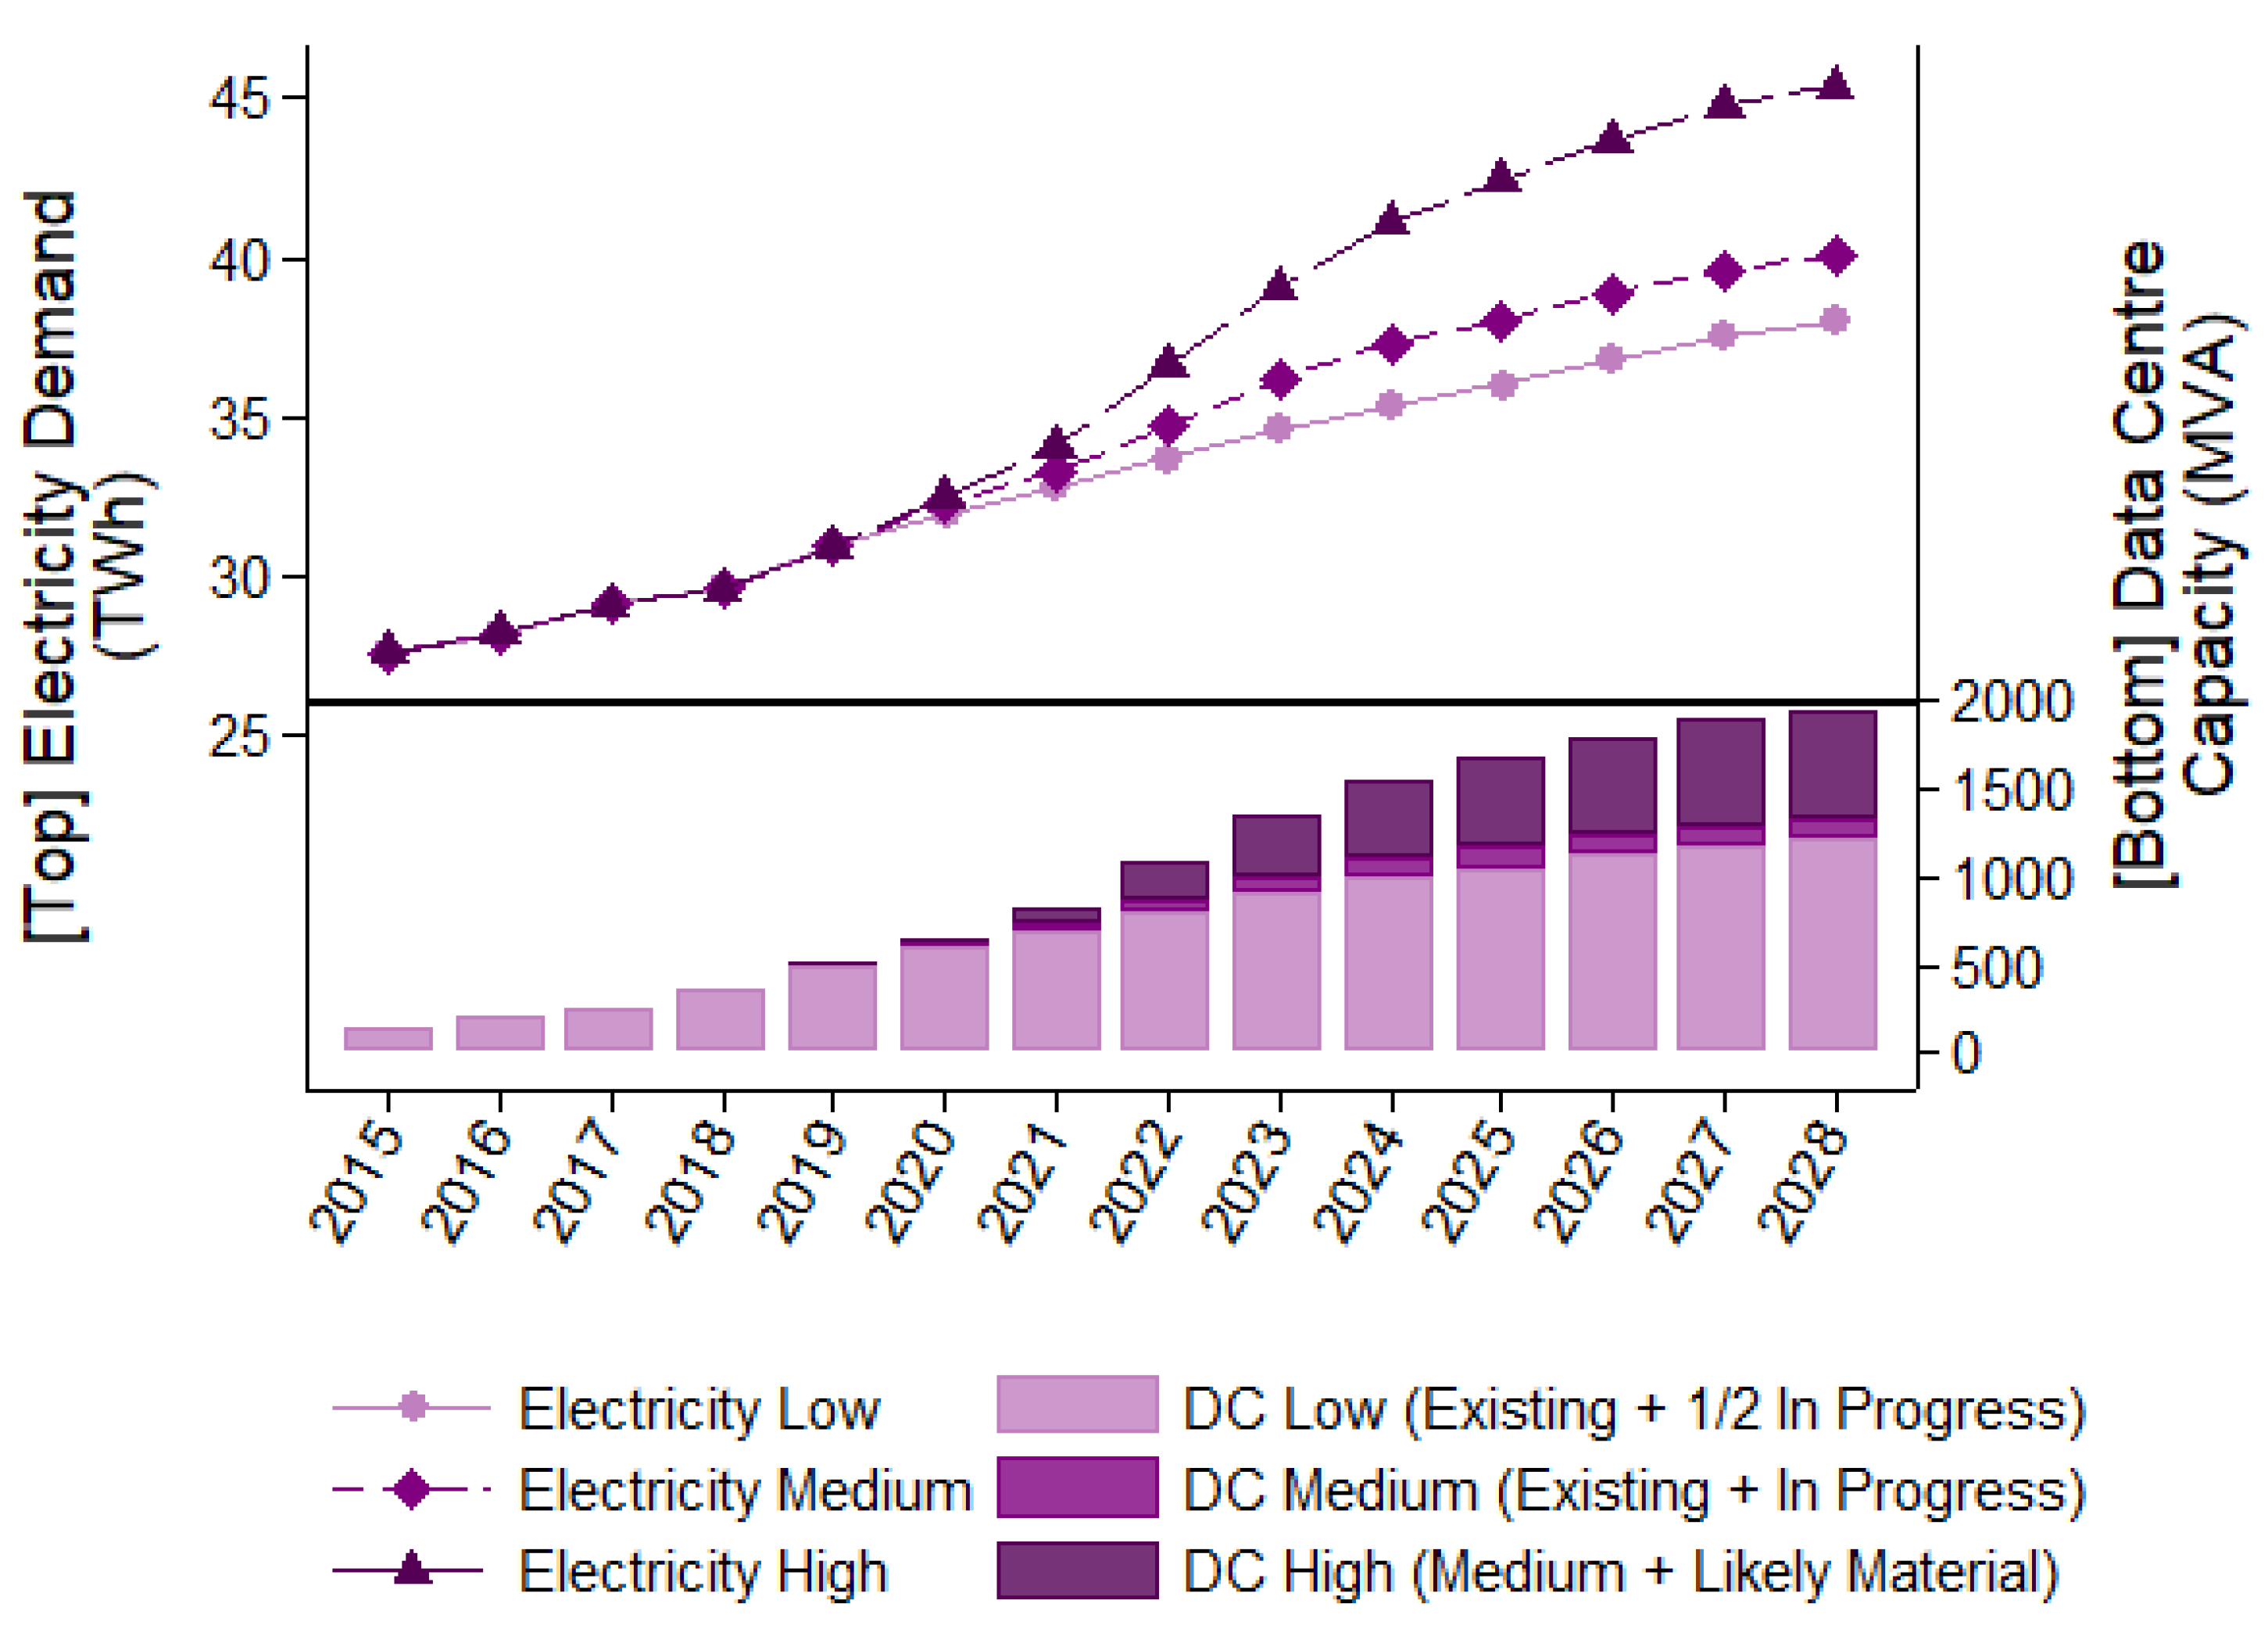
Figure 3 illustrates the reduction in data centre capacity associated with each scenario. It highlights the significant scope for reducing data centre capacity in the ND (light blue bar) and AD (dark blue bar) case, depending on the extent of adoption.
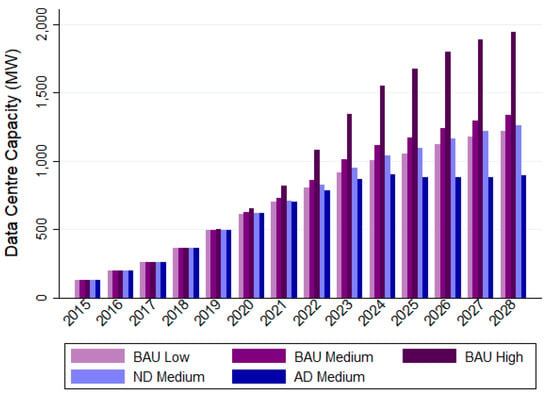
Figure 3.
Data centre sector capacity (MW). Source: Author’s calculations based on EirGrid [53] data. Note: Capacities in MW, no capacity factor applied.
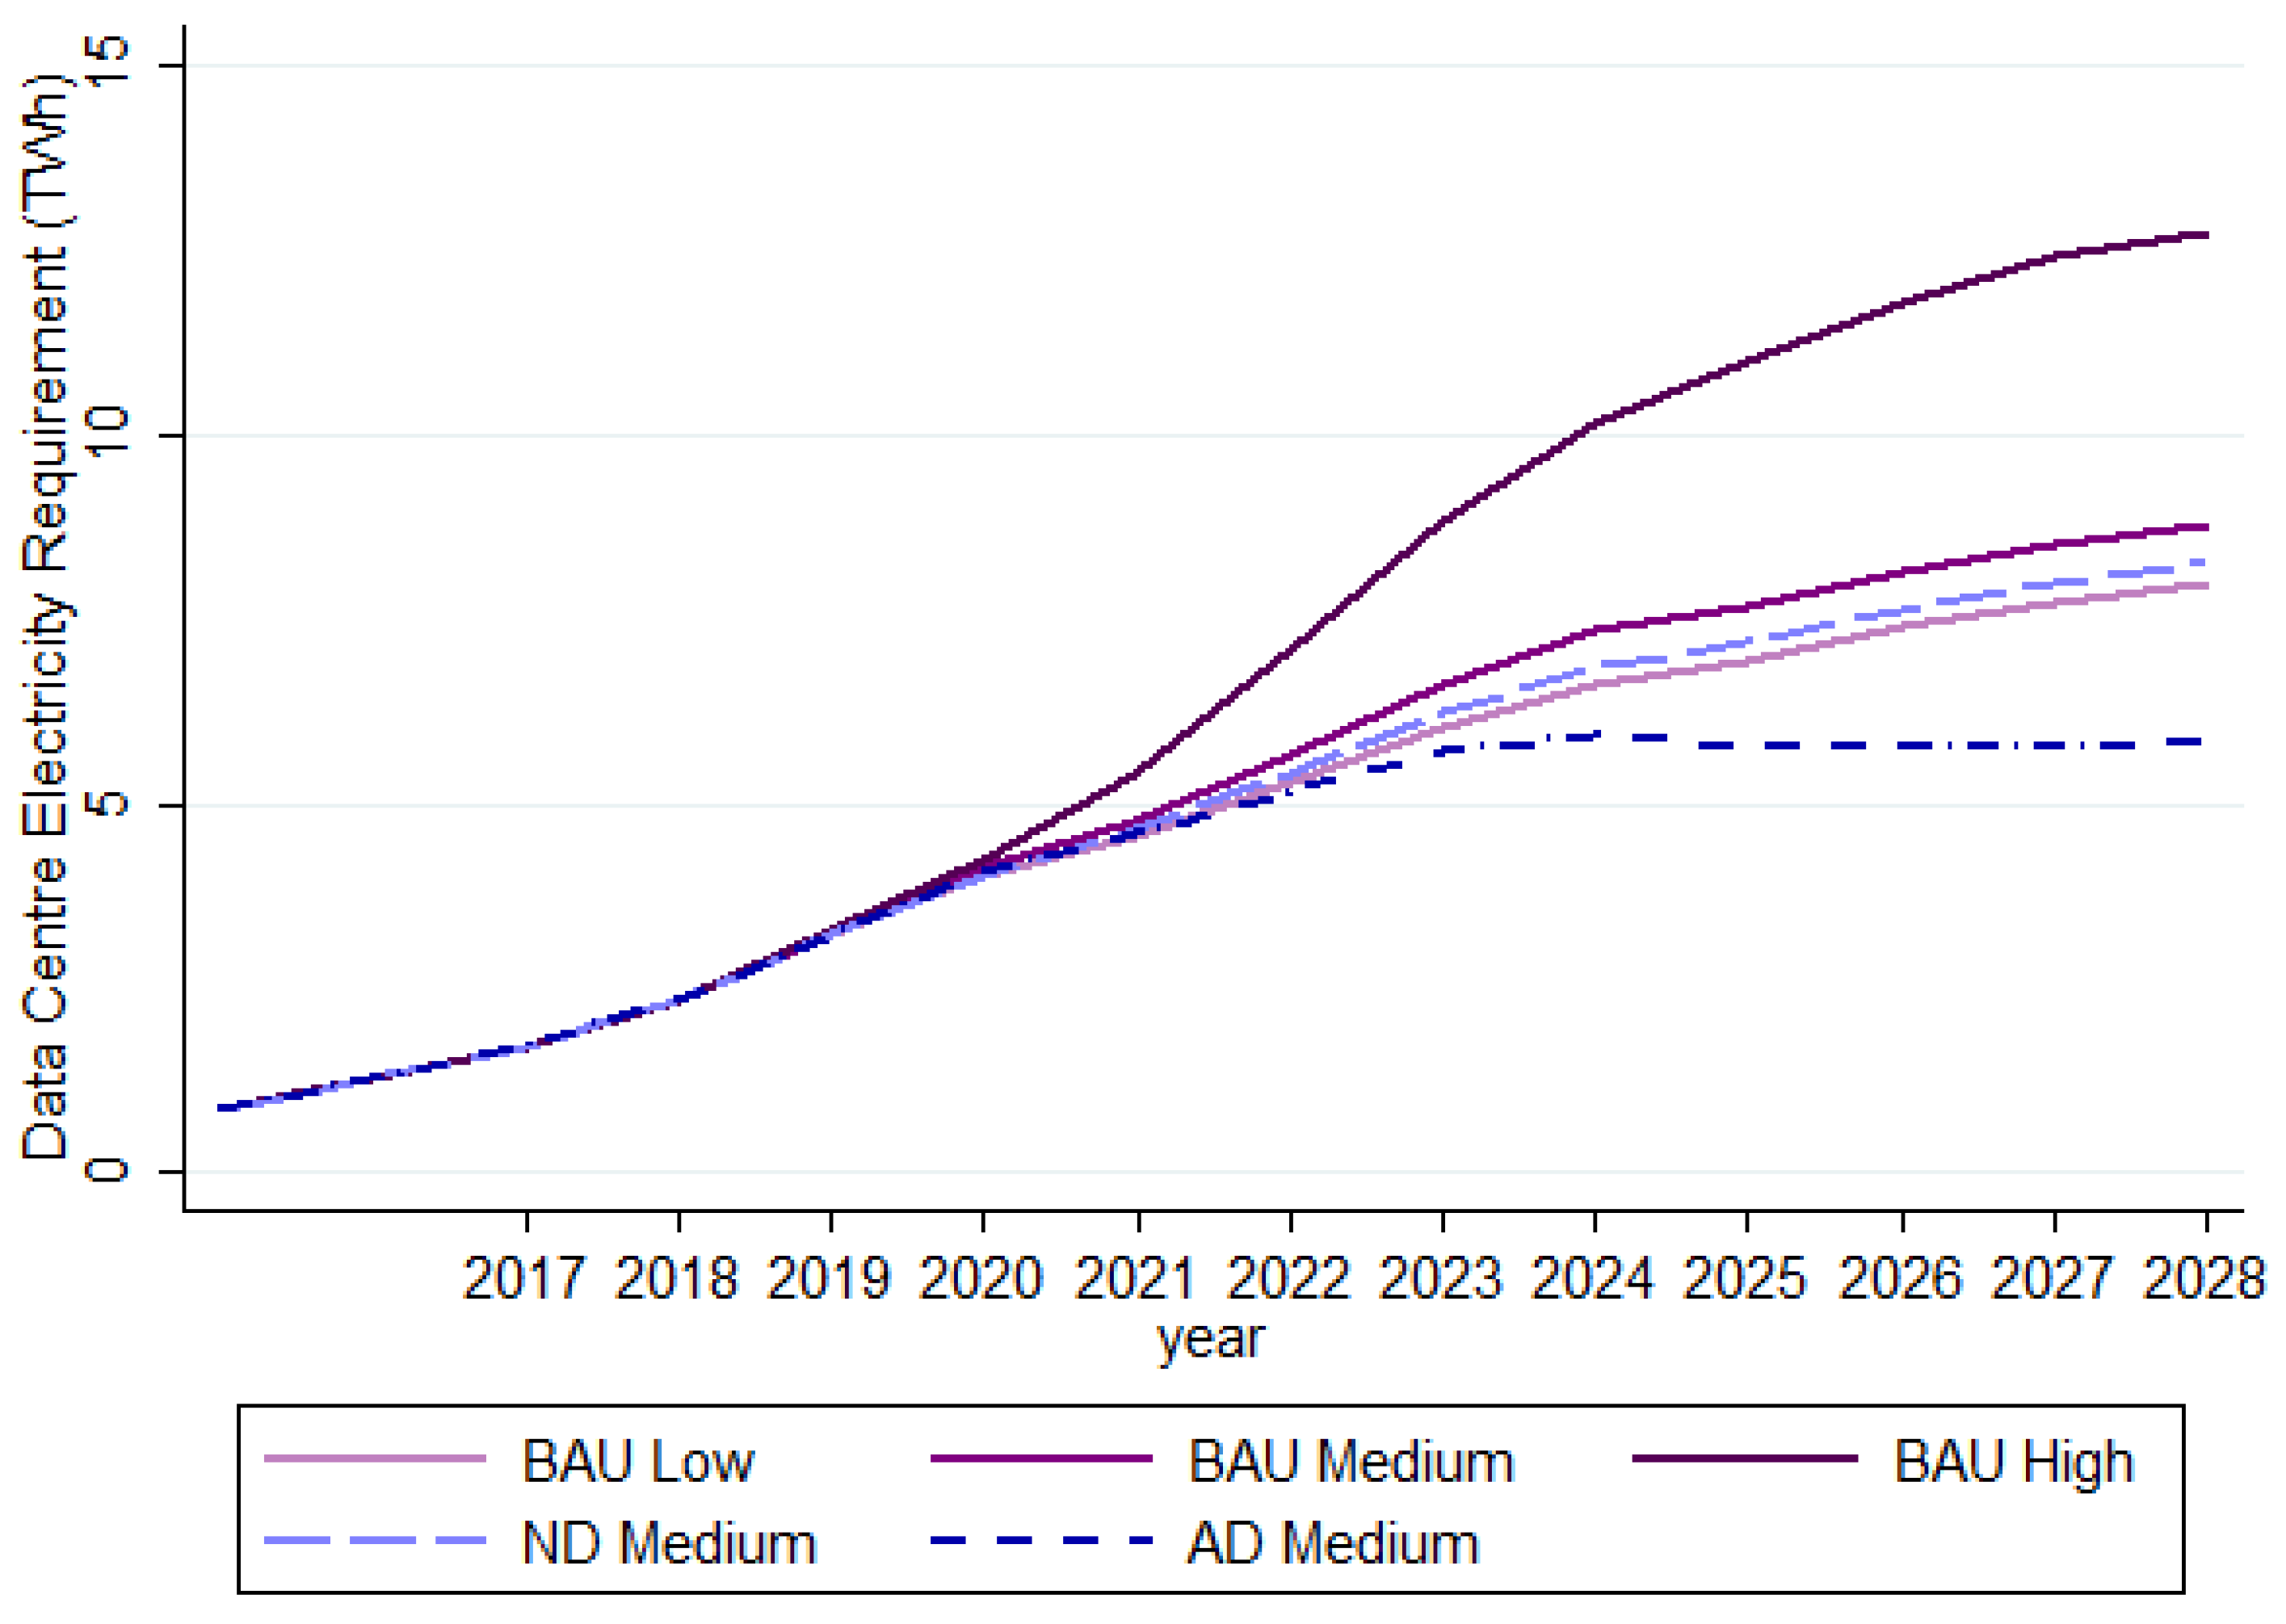
Figure 4 illustrates the forecast of sectoral electricity demand using a capacity factor of 0.75. The most interesting comparison is between the Business as Usual (BAUMED) scenario, which EirGrid consider most likely with two adoption scenarios: New Only Diffusion (ND, long-dash line) and All Diffusion (AD, dot-dash line), the latter of which assumes that existing data centres also upgrade their cooling technology. In 2028, electricity consumption by data centres would be 6% lower in the “New Only Diffusion” (ND) scenario and 33.3% lower in the “All Diffusion” (AD) scenario.
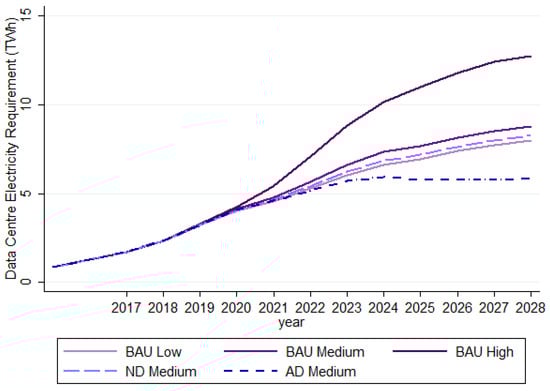
Figure 4.
Data centre sector electricity consumption (TWh). Source: Author’s calculations based on EirGrid [53] data. Note: Assumes a data centre capacity factor of 0.75.
This result is consistent with the assumption that technology adoption will reduce data centre energy consumption by one-third, but it also emphasises the significant role that existing data centres play in determining the scope for new technology to spur widespread improvement in sectoral energy demand.
Focusing only on the final year of the horizon neglects cumulative energy savings. Over the nine-year period (2020–2028) when diffusion occurs, the ND scenario lowers energy use by 5.58% over the entire period, while the AD scenario lowers energy use by 21.14% (relative to the EirGrid BAUMED scenario). This result emphasises the importance of the timing of technology adoption in addition to which plant choose to adopt.
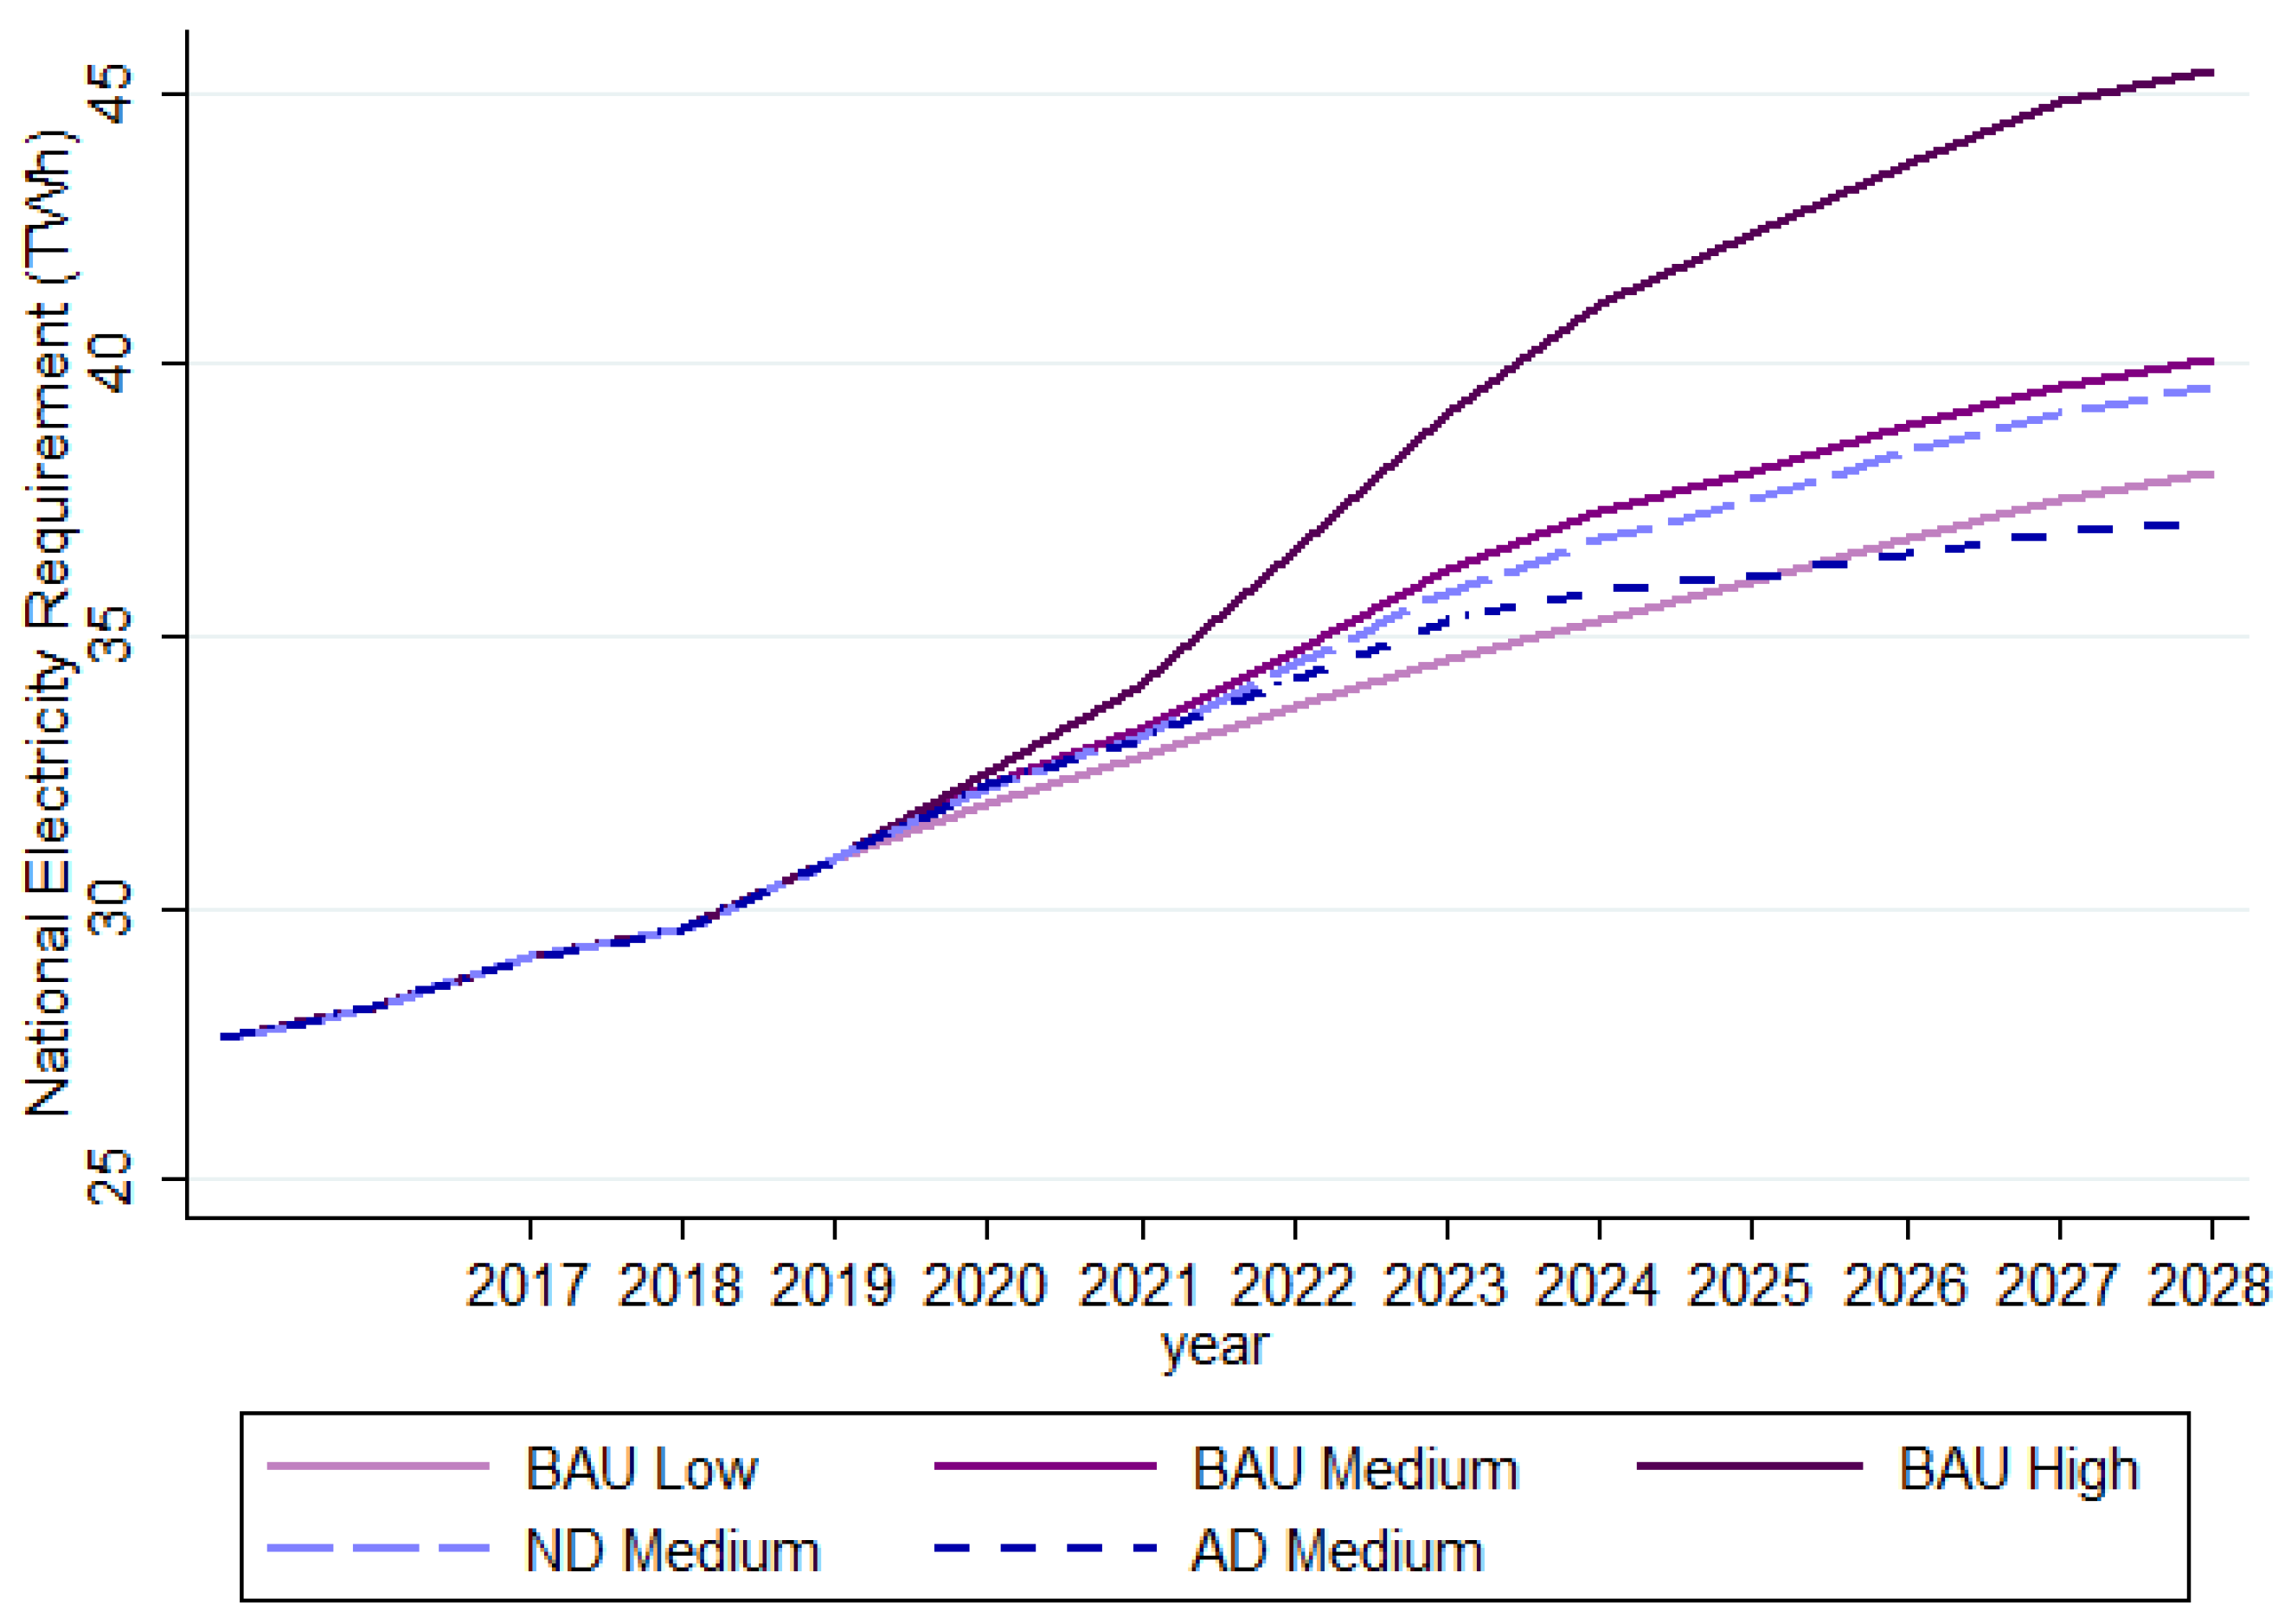
3.2. National Electricity Demand
Focusing only on the final year of the horizon neglects cumulative energy savings. Over the nine-year period (2020–2028) when diffusion occurs, the ND scenario lowers energy use by 5.58. This section considers the effect of data centre technology adoption on national electricity demand. To facilitate appropriate comparison between BAU and adoption scenarios, the annual series of national electricity demand must reflect the cumulative difference between the BAU level of data centre electricity consumption and the lower forecast in adoption (ND, AD) scenarios.
Equation (4) explains the construction of this measure for diffusion scenarios . The variable reflects the electricity demand attributable to data centres each year, while reflects national electricity demand for the BAU scenario. This variable must be adjusted to reflect new, lower data centre electricity demand each year. Following Equation (4), national electricity demand is deflated by the difference in relative share of data centre electricity use within the national BAU value. As an example, if the BAUMED scenario had data centre electricity use represent 20% of the national total, while a diffusion scenario lowered this ratio to 10%, then the diffusion forecast of national electricity demand must be deflated to 90% of its previous level (1 − 0.10 = 0.90).
Figure 5 illustrates national electricity demand, with the three BAU scenarios where no technology diffusion occurs [53] compared with the technology diffusion scenarios (long-dash ND line, dot-dashed AD line). In 2028, the ND scenario reduces national electricity consumption by 1.32% relative to BAUMED, while the AD scenario would save 7.31%. Over the nine-year period, the total reduction in electricity demand is 1.03% and 3.94% for ND and AD scenarios, respectively. This result highlights the significant presence of data centres on the national level and emphasises the significant scope for improvements in data centre energy to translate to significant national savings.
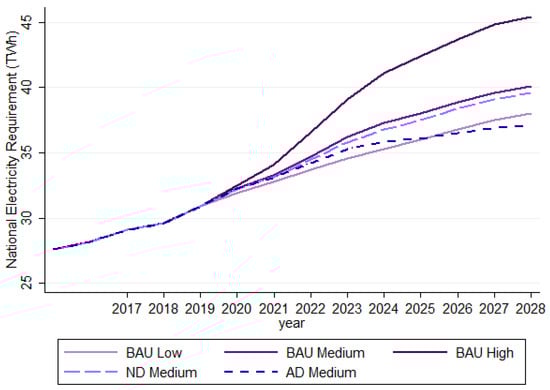
Figure 5.
National electricity consumption (TWh). Source: Author’s calculations based on EirGrid [53] data. Note: Assumes a data centre capacity factor of 0.75.
Table 3 highlights the share of national electricity consumption attributable to data centres over time. Every forecast shows data centres comprising a smaller share relative to BAUMED. Based on savings from the 2020–2028 period, the ND scenario reflects a 1.00 percentage point reduction in the national share, from an average of 18.44% under BAUMED to 17.44 under ND. The reduction is even greater for the AD scenario, featuring a 3.76 percentage point reduction in the national share to an average share of 14.69%. This result highlights the large share of data centres in the national context while also highlighting the significant scope for energy savings, especially in the scenario where all data centres adopt the technology in question.
Table 3.
Data centre share of national electricity demand.
The final two columns of Table 3 show how the level of savings is moderated somewhat when the share of data centre consumption is computed as a fraction of the deflated national electricity consumption (following Equation (4)). For the ND case, the average shares for the 2020–2028 period are 17.63% and 15.28% in the ND and AD scenarios, respectively. This result emphasises the influential role of data centres in the national context, even after accounting for a forecast of national electricity demand that accounts for improvements in data centre efficiency over time.
3.3. Carbon Dioxide Emissions
Associated with the reduction in energy demand from the data centres is a reduction in CO2 emissions from electricity generation. The International Energy Agency (IEA) publishes country-specific emissions factors, which relate the level of carbon dioxide (CO2) emissions to the quantity of energy consumed in a country. However, Brander et al. [68] note that the IEA reports a composite electricity and heat emissions factor, which might not reflect the actual value of electricity emissions. For data centres, the correct emissions factor should be adjusted to only reflect electricity consumption. Table 4 presents emissions factors for Ireland based on 2010 energy quantities, accounting for transmission and distribution losses, finding a 7% difference between the IEA composite emissions factor and an electricity-specific factor [68].
Table 4.
Electricity-specific emissions factors.
The electricity-specific emissions factor of 0.5661 kgCO2/kWh [68] is applied to the electricity consumption in each scenario to quantify the carbon dioxide emissions associated with data centre operations (Table 5). Comparing the BAU medium and adoption scenarios over the 2020–2028 period shows that emissions would be 4.7% lower for the ND scenario and 23.04% lower for the AD scenario. This result highlights a societal benefit of improving energy efficiency, with data centres serving as a key source of potential benefit.
Table 5.
Estimated data centre CO2 emissions.
This is especially important in the case of Ireland, where fines for non-compliance will result from failing to achieve EU energy efficiency targets. These results are illustrative given that results are sensitive to the emissions factor, which is likely to improve over time as the generation mix for Ireland becomes less carbon intensive. In this sense, these results serve as an upper bound of the potential savings.
4. Conclusions
This research is motivated equally by the prominent role of data centres within the global digital economy and the significant pressure they exert on national energy demand on the pathway towards a low-carbon society. The presence of data centres is a particular challenge for certain economies, such as Ireland, that are already struggling to comply with EU targets for improving energy efficiency. Data centres are a prime example of a rapidly evolving industry that challenges policy makers with consequences for future energy demand, transmission systems and emissions. Evidence on this issue is made especially complex by the lack of suitable publicly available information on data centres, where the only data source is a forecast of expected data centre capacity. This can hinder decision making under uncertainty.
This study is the first to apply a novel economic model of technology diffusion to quantify the potential savings from a transition to more efficient liquid cooling technology which reduces energy consumption compared to mechanical air cooling. Prior research has identified cooling as one of the most energy-intensive aspects of data centres, where mechanical cooling can comprise one-third of data centre energy use [30]. This study focuses on eliminating this share of energy use in the data centre, and the direct consequences this would have on sectoral electricity demand and related emissions in the future. Although the specific technology may change, research has identified cooling as one of the most energy-intensive aspects of data centres. The methodology applied serves as a helpful tool when publicly available data are limited.
The key finding in this paper is that data centres could serve a key role in fostering improvements in energy efficiency pursuant to national and EU objectives. This is especially true in Ireland, a smaller economy where data centres are expected to consume almost 40% of national electricity demand by 2028. Results suggest that technology adoption could reduce national energy use by 3.16% over the 2020–2028 period if every data centre adopts the energy efficiency technology. The second result is that the level of savings depends on whether technology can be adopted by both emerging and existing data centres. A 3.16% reduction in national electricity demand is only achieved if every data centre adopts the technology. These savings fall to a 0.81% reduction if adoption is only possible for upcoming data centre capacity. The final result notes the potential savings in terms of associated emissions, with scope to reduce sectoral emissions by 23.04% over the period 2020–2028, depending on the extent of technology adoption. This is a significant saving that serves as added motivation for policy makers to foster improvement in data centre energy efficiency-possibly through the design of subsidies to bridge the Energy Efficiency Gap and support technology adoption where the societal benefit of adoption outweighs the privately optimal level of investment in energy efficiency.
Although future market trends cannot be predicted, technological innovations are expected. It is for this reason that this paper has taken a technology-agnostic approach and is guided by evidence to date on improvements from liquid cooling technology. Advancements in data centre energy use, energy generation, transmission and interconnection will also matter, as results presented for emissions reduction are a function of the carbon-intensity of electricity generation in Ireland. However, changes in legislation and political factors may also serve as demand shifters for the data centre sector.
A major contribution of this paper lies in its novel methodology and how this is applicable in situations where forecasts must be made under uncertainty. It features flexibility to respond to new forecast horizons and alternative technologies within the data centre and the wider transmission network. This research is intended to be illustrative for researchers, industry stakeholders and policy makers. Importantly, it does not consider the cost of the technology—either for new-build data centres or retrofit to existing plants. A more substantial cost–benefit analysis would be required to determine if the net present value of energy savings outweighs the marginal capital costs of adoption. However, this would rely on the availability of accurate and publicly available information, which is not yet available.
Most technological innovation within data centres has been driven by private incentives, offering better service, with reduced energy consumption that increases profitability. Usually, technologies that are not sufficiently profitable would not be considered. This forms the basis for much of the Energy Efficiency Gap literature. However, the Irish policy environment appears to be changing in several important ways. Policy makers have signalled an intention to incentivise data centres to locate in regions to minimise costly grid network reinforcements [67]. This effort will seek to be supported with an industry-led sector plan.
Separately, the utilities regulator in Ireland has recently fielded a consultation on options to manage soaring data centre capacity. Options proposed by the consultation include a moratorium on new data centre construction, steering new data centre capacity to be prioritised based on their location and an option to explore the potential for data centres to support demand side management by running on their own on-site backup generation during times of grid constraint [69].
Results highlight the potential savings and suggest that policy makers should seek to foster improvements in energy efficiency. This may be attainable given the relatively small number of firms in the Irish market. Another recommendation is that policy makers publish more details of data centres in Ireland and the efforts firms have made to improve energy efficiency. This has been effective at EU level, with the Data Centre Code of Conduct for Data Centre Energy Efficiency [70] that has been associated with improvements in average Power Usage Effectiveness [26].
The increasingly urgent need for change at a societal level paired with policy maker enthusiasm for change highlights potential for mutually beneficial collaboration. One major example is the Tallaght District Heating Scheme, which will be heated by waste heat from a data centre [37]. As has been demonstrated in the Irish residential sector, a subsidised retrofit has proven an effective policy tool to achieve change. Further research should explore solutions that do not adversely affect private investment. Specifically, it should seek to encourage changes that can allow data centres to play a more active part in an integrated energy system.
Author Contributions
Conceptualisation, E.D.; data curation, B.C.; formal analysis, B.C.; funding acquisition, E.D.; methodology, B.C.; project administration, E.D.; software, B.C.; supervision, E.D.; visualisation, B.C.; writing—original draft, B.C.; writing—review and editing, E.D. All authors have read and agreed to the published version of the manuscript.
Funding
This research was conducted in part while the corresponding author was at the Department of Economics, Trinity College Dublin. This work has emanated from research conducted with the financial support of Science Foundation Ireland under the SFI Strategic Partnership Programme Grant Number SFI/15/SPP/E3125. The opinions, findings and conclusions or recommendations expressed in this material are those of the authors and do not necessarily reflect the views of the Science Foundation Ireland.
Acknowledgments
The authors wish to acknowledge helpful comments received from faculty on an earlier draft of this paper during presentation in the Department of Economics, Trinity College Dublin.
Conflicts of Interest
The authors declare no conflict of interest.
Abbreviations
| AD | Diffusion scenario with all data centres adopting technology |
| BAU | Business as Usual EirGrid electricity demand scenario |
| CO2 | Carbon dioxide |
| EU | European Union |
| ICT | Information and communications technology |
| IT | Information Technology—often referring to hardware |
| kgCO2/kWh | Kilogramme of carbon dioxide per kilowatt-hour used |
| kWh | Kilowatt-hours—a unit of electricity consumption |
| Mt CO2eq | Million tonnes of carbon dioxide equivalent |
| MVA | Megavolt ampere—a measure of capacity |
| MW | Megawatt—a measure of capacity |
| ND | Diffusion scenario with upcoming (from 2020) data centres adopting |
| PUE | Power Usage Effectiveness—a measure of data centre energy efficiency |
| TWh | Terawatt-hours—a unit of electricity consumption |
| UK | United Kingdom |
References
- European Commission. Europe 2020 Strategy; European Commission: Brussels, Belgium, 2017. [Google Scholar]
- European Commission. Enter the Data Economy: EU Policies for a Thriving Data Ecosystem; European Commission: Brussels, Belgium, 2017. [Google Scholar]
- United Nations. Transforming Our World: The 2030 Agenda for Sustainable Development; United Nations: New York, NY, USA, 2015. [Google Scholar]
- World Economic Forum. Internet for All: A Framework for Accelerating Internet Access and Adoption; World Economic Forum: Cologny, Switzerland, 2016. [Google Scholar]
- European Commission. The European Green Deal; European Commission: Brussels, Belgium, 2019; Volume 53. [Google Scholar] [CrossRef]
- Pradhan, R.P.; Bele, S.; Pandey, S. Internet-growth nexus: Evidence from cross-country panel data. Appl. Econ. Lett. 2013, 20, 1511–1515. [Google Scholar] [CrossRef]
- Koutroumpis, P. The economic impact of broadband on growth: A simultaneous approach. Telecommun. Policy 2009, 33, 471–485. [Google Scholar] [CrossRef]
- Whitacre, B.; Gallardo, R.; Strover, S. Broadbands contribution to economic growth in rural areas: Moving towards a causal relationship. Telecommum. Policy 2014, 38, 1011–1023. [Google Scholar] [CrossRef]
- Lechman, E.; Kaur, H. Social Development and ICT Adoption. Developing World Perspective. Econ. Sociol 2016, 9, 1–14. [Google Scholar] [CrossRef] [PubMed]
- McCarthy, A.; Bohle-Carbonell, K.; Síocháin, T.Ó.; Frost, D. Remote Working during COVID-19: Ireland’s National Survey-Phase II Report; NUI Galway Whitaker Institute & Western Development Commission: Galway, Ireland, 2020; Available online: https://westerndevelopment.ie/wp-content/uploads/2021/05/Remote-Working-National-Survey-Phase-III-Report-final.pdf (accessed on 1 June 2021).
- European Commission. Telework in the EU before and after the COVID-19: Where We Were, Where We Head to; European Commission: Brussels, Belgium, 2020; Volume 2009. [Google Scholar]
- CISCO. The Zettabyte Era: Trends and Analysis; CISCO: San Jose, CA, USA, 2017. [Google Scholar]
- European Commission. Factsheet: Shaping Europe’s Future; European Commission: Brussels, Belgium, 2020. [Google Scholar]
- McKendrick, J. With Internet of Things and Big Data, 92% of Everything We Do will Be in the Cloud. Forbes 2016. Available online: https://www.forbes.com/sites/joemckendrick/2016/11/13/with-internet-of-things-and-big-data-92-of-everything-we-do-will-be-in-the-cloud/#3a4bca6e4ed5 (accessed on 28 October 2020).
- McKinsey. Energy Efficiency: A Compelling Global Resource; McKinsey: Chicago, IL, USA, 2010. [Google Scholar]
- Macauley, M. Driverless Cars and Their Relation to the IoT. IOT J. 2016. Available online: https://www.rfidjournal.com/driverless-cars-and-their-relation-to-the-iot (accessed on 31 June 2019).
- Masanet, E.; Shehabi, A.; Lei, N.; Smith, S.; Koomey, J. Recalibrating global data center energy-use estimates. Science 2020, 367, 984–986. [Google Scholar] [CrossRef] [PubMed]
- European Commission. Ecodesign Preparatory Study on Enterprise Servers and Data Equipment; Publications Office of the European Union: Brussels, Belgium, 2015. [Google Scholar]
- Koomey, J. Growth in Data Center Electricity Use 2005 to 2010; Analytical Press: Stanford, CA, USA, 2011; Available online: https://alejandrobarros.com/wp-content/uploads/old/Growth_in_Data_Center_Electricity_use_2005_to_2010.pdf (accessed on 18 January 2020).
- Ebrahimi, K.; Jones, G.F.; Fleischer, A.S. A review of data center cooling technology, operating conditions and the corresponding low-grade waste heat recovery opportunities. Renew. Sustain. Energy Rev. 2014, 31, 622–638. [Google Scholar] [CrossRef]
- Shehabi, A.; Smith, S.J.; Masanet, E.; Koomey, J. Data center growth in the United States: Decoupling the demand for services from electricity use. Environ. Res. Lett. 2018, 13, 124030. [Google Scholar] [CrossRef]
- Koomey, J.; Taylor, J. New data supports finding that 30 percent of servers are ‘Comatose’, indicating that nearly a third of capital in enterprise data centers is wasted. TSO Logic. 2015. Available online: https://www.anthesisgroup.com/wp-content/uploads/2019/11/Case-Study_DataSupports30PercentComatoseEstimate-FINAL_06032015.pdf (accessed on 15 July 2019).
- Koomey, J.; Taylor, J. Comatose Servers Redux. 2017. Available online: https://www.anthesisgroup.com/wp-content/uploads/2019/11/Comatose-Servers-Redux-2017.pdf (accessed on 17 December 2020).
- Brady, G.A.; Kapur, N.; Summers, J.L.; Thompson, H.M. A case study and critical assessment in calculating power usage effectiveness for a data centre. Energy Convers. Manag. 2013, 76, 155–161. [Google Scholar] [CrossRef]
- Horner, N.; Azevedo, I. Power usage effectiveness in data centers: Overloaded and underachieving. Electr. J. 2016, 29, 61–69. [Google Scholar] [CrossRef]
- Avgerinou, M.; Bertoldi, P.; Castellazzi, L. Trends in Data Centre Energy Consumption under the European Code of Conduct for Data Centre Energy Efficiency. Energies 2017, 10, 1470. [Google Scholar] [CrossRef]
- IERC. EuroHeat: Low-Carbon Heating Strategy Review of Selected European Countries; IERC: Cork, Ireland, 2020. [Google Scholar]
- Data Center Dynamics. Heatworks Breaks Ground on AWS District Heating Scheme in Dublin, Ireland-DCD 2021. Available online: https://www.datacenterdynamics.com/en/news/heatworks-breaks-ground-on-aws-district-heating-scheme-in-dublin-ireland/ (accessed on 22 July 2021).
- Euroheat & Power. From Data Centres to District Heating & Cooling: Boosting Waste Heat Recovery to Support Decarbonization; Euroheat & Power: Brussels, Belgium, 2021. [Google Scholar]
- Garimella, S.V.; Persoons, T.; Weibel, J.; Yeh, L.T. Technological drivers in data centers and telecom systems: Multiscale thermal, electrical, and energy management. Appl. Energy 2013, 107, 66–80. [Google Scholar] [CrossRef] [Green Version]
- Song, Z.; Zhang, X.; Eriksson, C. Data Center Energy and Cost Saving Evaluation. Energy Procedia. Energy Procedia 2015, 75, 1255–1260. [Google Scholar] [CrossRef] [Green Version]
- Greenberg, S.; Mills, E.; Tschudi, B.; Berkeley, L. Best Practices for Data Centers: Lessons Learned from Benchmarking 22 Data Centers. In Proceedings of the ACEEE Summer Study Energy Effic. Build, Pacific Grove, CA, USA, 3 August 2006; pp. 76–87. [Google Scholar] [CrossRef]
- Sickinger, D.; Van Geet, O.; Ravenscroft, C. Energy Performance Testing of Asetek’s RackCDU System at NREL’s High Performance Computing Data Center; NREL: Golden, CO, USA, 2014. Available online: https://www.osti.gov/biblio/1164105. (accessed on 30 September 2020).
- Carbó, A.; Oró, E.; Salom, J.; Canuto, M.; MacÍas, M.; Guitart, J. Experimental and numerical analysis for potential heat reuse in liquid cooled data centres. Energy Convers. Manag. 2016, 112, 135–145. [Google Scholar] [CrossRef] [Green Version]
- Davies, G.F.; Maidment, G.G.; Tozer, R.M. Using data centres for combined heating and cooling: An investigation for London. Appl. Therm. Eng. 2016, 94, 296–304. [Google Scholar] [CrossRef]
- IRBEA. A Technical Guide to District Heating; IRBEA: Dublin, Ireland, 2016. [Google Scholar]
- Codema. South Dublin County Council Tallaght District Heating Scheme; Codema: Bergschenhoek, The Netherlands, 2018. [Google Scholar]
- Zhou, R.; Wang, Z.; Bash, C.E.; McReynolds, A. Modeling and Control for Cooling Management of Data Centers With Hot Aisle Containment. ASME Int. Mech. Eng. Congr. Expo. 2011, 54907, 739–746. [Google Scholar] [CrossRef]
- Garimella, S.V.; Persoons, T.; Weibel, J.A.; Gektin, V. Electronics Thermal Management in Information and Communications Technologies: Challenges and Future Directions. IEEE Trans. Compon. Packag. Manuf. Technol. 2016, 7, 1191–1205. [Google Scholar] [CrossRef]
- OECD. OECD Digital Economy Outlook 2017. Paris: OECD Publishing; OECD: Paris, France, 2017. [Google Scholar] [CrossRef]
- Bitpower. Host in Ireland. Ireland’s Data Hosting Industry; Bitpower: Dublin, Ireland, 2017. [Google Scholar]
- Bitpower. Host in Ireland. Host in Ireland 2019 Q1 Report; Bitpower: Dublin, Ireland, 2019. [Google Scholar]
- Schwab, K. The global competitiveness report 2015–2016. In Proceedings of the World Economic Forum, Geneva, Switzerland, 2015; Available online: https://www3.weforum.org/docs/gcr/2015-2016/Global_Competitiveness_Report_2015-2016.pdf (accessed on 12 November 2019).
- IWEA. Data Centre Implications for Energy Use in Ireland: Irish Data-Centre Load Projections to 2020; IWEA: Naas, Ireland, 2015; Available online: https://windenergyireland.com/images/files/9660bdc9488d1ce95c4f2ba74ce340bfb4831f.pdf (accessed on 1 December 2019).
- IDA Ireland. A Study of the Economic Benefits of Data Centre Investment in Ireland; IDA Ireland: Dublin, Ireland, 2018. [Google Scholar]
- Lillington, K. Data Centre Growth Comes at Price for Irish Infrastructure. The Irish Times 2016. Available online: http://www.irishtimes.com/business/technology/data-centre-growth-comes-at-price-for-irish-infrastructure-1.2759291 (accessed on 28 October 2020).
- European Union. regulation (EU) 2016/679 OF THE EUROPEAN PARLIAMENT AND OF THE COUNCIL of 27 April 2016 on the protection of natural persons with regard to the processing of personal data and on the free movement of such data, and repealing Directive 95/46/EC General Da. Off. J. Eur. Communities 2016, 2014, 1–88. [Google Scholar]
- European Union. Complete Guide to GDPR Compliance. Eur. Union 2017. Available online: https://gdpr.eu/ (accessed on 13 July 2021).
- European Commission. Clean energy for All Europeans; European Commission: Luxembourg, 2019. [Google Scholar] [CrossRef]
- European Parliament. Directive 2018/2002/EU amending Directive 2012/27/EU on Energy Efficiency. Off. J. Eur. Union 2018, 328, 210–230. [Google Scholar]
- DCENR. Maximising Ireland’s Energy Efficiency Action Plan 2009–2020; DCENR: Dublin, Ireland, 2009. [Google Scholar]
- DCCAE. Ireland’s Fourth National Energy Efficiency Action Plan 2017–2020; DCCAE: Dublin, Ireland, 2017. [Google Scholar]
- EirGrid. All-Island Generation Capacity Statement 2019–2028; EirGrid: Dublin, Ireland, 2019. [Google Scholar]
- Oireachtas. Joint Committee on Communications, Climate Action and Environment Debate-9/5/2017. Houses of the Oireachtas 2017. Available online: http://beta.oireachtas.ie/en/debates/debate/joint_committee_on_communications_climate_action_and_environment/2017-05-09/2/ (accessed on 28 October 2020).
- Stern, N. The Economics of Climate Change. Am. Econ. Rev. Pap. Proc. 2008, 98, 1–37. [Google Scholar] [CrossRef] [Green Version]
- Gerarden, T.; Newell, R.G.; Stavins, R.N. Explaining the energy paradox: Deconstructing the Energy-Efficiency Gap: Conceptual Frameworks and Evidence. Am. Econ. Rev. Pap. Proc. 2015, 105, 183–186. [Google Scholar] [CrossRef]
- Jaffe, A.B.; Stavins, R.N. The energy-efficiency gap: What does it mean? Energy Policy 1994, 22, 804–810. [Google Scholar] [CrossRef]
- Newell, R.G.; Jaffe, A.B.; Stavins, R.N. The Induced Innovation Hypothesis and Energy-Saving Technological Change. Q. J. Econ. 1999, 114, 941–975. [Google Scholar] [CrossRef]
- Gompertz, B. On the nature of the function expressive of the law of human mortality, and on a new mode of determining the value of life contingencies. Philos. Trans. R. Soc. Lond. 1825, 115, 513–583. [Google Scholar] [CrossRef]
- Prescott, R.B. Law of Growth in Forecasting Demand. J. Am. Stat. Assoc. 1922, 18, 471–479. [Google Scholar] [CrossRef]
- Bass, F.M. A New Product Growth for Model Consumer Durables. Manag. Sci. 1967, 50, 1825–1832. [Google Scholar] [CrossRef] [Green Version]
- Davies, S.W.; Diaz-Rainey, I. The patterns of induced diffusion: Evidence from the international diffusion of wind energy. Technol Forecast. Soc. Chang. 2011, 78, 1227–1241. [Google Scholar] [CrossRef]
- Wirges, J.; Linder, S.; Kessler, A. Modelling the development of a regional charging infrastructure for electric vehicles in time and space. Eur. J. Transp. Infrastruct. Res. 2012, 12, 391–416. [Google Scholar] [CrossRef]
- Baptista, R. The Diffusion of Process Innovations: A Selective Review. Int. J. Econ. Bus. 1999, 6, 107–129. [Google Scholar] [CrossRef]
- Yamakawa, P.; Rees, G.H.; Salas, J.M.; Alva, N.; Manuel Salas, J.; Alva, N. The diffusion of mobile telephones: An empirical analysis for Peru. Telecommun. Policy 2013, 37, 594–606. [Google Scholar] [CrossRef]
- Yin, X.; Goudriaan, J.; Lantinga, E.A.; Vos, J.; Spiertz, H.J. A flexible sigmoid function of determinate growth. Ann. Bot. 2003, 91, 361–371. [Google Scholar] [CrossRef]
- Government of Ireland. Climate Action Plan 2019; Government of Ireland: Dublin, Ireland, 2019. [Google Scholar]
- Brander, M.; Sood, A.; Wylie, C.; Haughton, A.; Lovell, J. Electricity-specific emission factors for grid electricity. Ecometrica Emiss. Com. 2011. Available online: http://www.ecometrica.com/assets/Electricity-specific-emission-factors-for-grid-electricity.pdf (accessed on 13 May 2019).
- CRU. CRU/21/060-Proposed Direction to the System Operators Related to Data Centre Grid Connection; CRU: London, UK, 2021. [Google Scholar]
- European Commission. 2016 Best Practice Guidelines for the EU Code of Conduct on Data Centre Energy Efficiency; European Commission: Brussels, Belgium, 2016; pp. 1–50. [Google Scholar]

Publisher’s Note: MDPI stays neutral with regard to jurisdictional claims in published maps and institutional affiliations. |
© 2021 by the authors. Licensee MDPI, Basel, Switzerland. This article is an open access article distributed under the terms and conditions of the Creative Commons Attribution (CC BY) license (https://creativecommons.org/licenses/by/4.0/).