Article

Remediation of Annular Gas Migration along Cemented Wellbores Using Reactive Mineral Fluids: Experimental Assessment of Sodium Bicarbonate and Sodium Silicate-Based Solutions

by
Timotheus K. T. Wolterbeek
* and
Suzanne J. T. Hangx
High Pressure and Temperature Laboratory, Earth Simulation Lab, Utrecht University, Princestonlaan 4, 3584 CB Utrecht, The Netherlands
*
Author to whom correspondence should be addressed.
Energies 2021, 14(22), 7507; https://doi.org/10.3390/en14227507
Submission received: 29 September 2021 / Revised: 26 October 2021 / Accepted: 29 October 2021 / Published: 10 November 2021

Abstract

:
Achieving zonal isolation along wellbores is essential for upholding the containment integrity of subsurface reservoirs and preventing fluid seepage to the environment. The sealing performance of Portland cements conventionally used to create barriers can be severely compromised by defects like fractures or micro-annuli along casing–cement–rock interfaces. A possible remediation method would be to circulate reactive fluids through compromised cement sections and induce defect clogging via mineral precipitation. We assess the sealing potential of two prospective fluids: sodium bicarbonate and sodium silicate solutions. Reactive flow-through experiments were conducted on 6-m-long cemented steel tubes, bearing ~20-μm-wide micro-annuli, at 50 °C and 0.3–6 MPa fluid pressure. For the sodium bicarbonate solution (90 g/kg-H2O), reactive flow yielded only a minor reduction in permeability, with values remaining within one order. Injection of sodium silicate solution (37.1 wt.%, SiO2:Na2O molar ratio M = 2.57) resulted in a large decrease in flow rate, effectively reaching the setup’s lower measurement limit in hours. However, this strong sealing effect can almost certainly be attributed to gelation of the fluid through polymerisation, rather than defect clogging via mineral precipitation. For both fluids investigated, the extent of solids precipitation resulting from single-phase injection was less than anticipated. This shortfall is attributed to ineffective/insufficient liberation of Ca-ions from the alkaline phases in the cement.

1. Introduction

Ensuring wellbore integrity and long-term zonal isolation is of utmost importance to many of our activities in the subsurface, such as geothermal energy production [1,2], temporary underground storage of energy carriers, such as hydrogen or compressed air [3], geological sequestration of wastes like CO2 [4], and oil and gas production [5,6,7,8]. While designed to have a low permeability, the Portland cements, typically used to create hydraulic barriers against unwanted fluid seepage along wellbores, may become impaired by permeable defects, such as fractures within the cement or debonding micro-annuli along its interfaces with the casing pipe or rock formations. Such defects can have various causes, including (i) ineffective cement placement [9,10,11], (ii) autogenous shrinkage and debonding upon setting of the cement [12,13,14,15,16,17,18], or (iii) mechanical damage sustained by the set cement [19,20,21,22,23,24,25,26]. The defects offer possible routes for annular gas migration, potentially leading to sustained casing pressure (SCP), surface–casing vent flow (SCVF), or other sealing integrity issues [27,28]. Both SCP and SCVF are relatively prevalent [29,30,31], though statistics vary widely with factors such as wellbore age, design and status, as well as the exploitation and regulatory history of the basin [32]. If the seepage poses a safety or environmental risk in terms of its surface pressure, volume flux or chemical composition, remedial action will generally be required.
Annular fluid migration (i.e., seepage that occurs outside of the innermost casing pipe) is inherently challenging to mitigate. One of the more common approaches is so-called perforate and squeeze cementing [33,34]. During such operations, perforations are made in the casing pipe, after which additional cement is forced through these perforations in an attempt to seal off micro-annuli and other defects or voids in the annulus or adjacent formation [27,35]. Unfortunately, squeeze cementing has a relatively low success rate. Analysis of 137 operations performed on wells in Texas found only 47 (about 34%) were effective on the first attempt, while the compounded success rate of multiple squeezes remained below 60% [36]. Success rates of about 50% have been reported in Alberta [37] and the Gulf of Mexico [38]. While surfactants may improve the effectiveness of squeeze-cementing operations, often multiple attempts are still required [39].
A key challenge for squeeze-/cementing operations is achieving proper cement placement. Portland cement slurries can be relatively viscous, quickly develop a gel (i.e., yield) strength, and contain considerable volume fractions of fine solid particles (for typical water-to-cement mass ratios, 35–60 vol.% at the time of mixing). These properties of cement tend to complicate entry into narrow debonding defects and fractures, e.g., by screening off the solid particles, which can prevent such defects from being sealed effectively [40]. This issue seems especially relevant for micro-annuli, which are typically only 5–100 µm wide [13,41]. Significantly better placement and sealing results have been obtained by instead injecting particle-free fluids of relatively low viscosity, such as thermosetting resins or epoxies [42,43,44,45]. Unfortunately, the long-term stability of these organics-based materials in downhole environments remains rather uncertain [46], especially at high temperature. Such longevity issues severely limit their scope, particularly for wellbore plugging and abandonment (P and A) applications [5], where zonal isolation integrity should ideally be guaranteed for hundreds if not thousands of years.
Given the above, there is clear opportunity for alternative sealant materials that (i) can be reliably injected into micro-annuli and narrow fractures in the cement, and (ii) are confirmed to have long-term durability in downhole wellbore environments. Concentrated aqueous solutions that cause stable solids to form, e.g., via mineral precipitation upon interaction with the cement or resident formation fluids, could, in theory, meet both requirements [47,48,49,50]. In this study, we assess the sealing effectiveness of two prospective fluids, namely sodium bicarbonate and sodium silicate-based solutions. Upon interaction with Portland cement, these fluids may precipitate calcium carbonates and silicates, respectively, i.e., produce solid minerals that are known to be stable in subsurface environments. To assess whether precipitation could form an effective seal, reactive flow-through permeametry tests were conducted on interconnected defects (micro-annuli and channels) in 6-m-long sections of wellbore casing–cement interface, simulated using cemented coils, broadly following the approach of Wolterbeek et al. [48].

2. Rationale for Selected Mineral Fluids

The following sections provide brief motivations for choosing the fluid systems investigated in this study.

2.1. Sodium Bicarbonate

Our incentive for including a sodium bicarbonate solution stems from research evaluating the wellbore seepage risk associated with geological storage of CO2 [4,51]. Substantial experimental work has been directed at understanding how reactive flow of CO2-rich fluids can affect and change the transport properties of damaged cement and micro-annuli along casing–cement and cement–rock interfaces [48,52,53,54,55,56,57,58,59,60,61]. Carbonic acid causes dissolution and leaching of alkaline phases in the cement such as portlandite (calcium hydroxide), ultimately forming semi-crystalline aluminosilicates and calcium carbonates [51,62,63,64]. Under flow conditions, it was found these reactions can lead to effective self-sealing of micro-annuli, provided that the precipitation of carbonates locally outstrips dissolution of cement phases. This prompted several workers to speculate whether CO2-rich fluids could be employed in wellbore seepage remediation [49,50]. Conversely, however, if dissolution dominates, then reactive transport could conceivably lead to extensive cement degradation and self-enhanced seepage, with sealing integrity worsening over time [65]. Numerical models have shown that the conditions under which reactive transport is self-sealing vs. non-sealing can be circumscribed quite well in terms of the initial defect size and fluid residence time [52,60,61,66,67,68,69]. Specifically, sufficient time will be required for dissolution of cement phases to neutralise the carbonic acid and buffer the CO2-rich fluid (initially in the pH 3–4 range [70]) to the more alkaline pH values required for carbonates to precipitate [48,66]. Compared to CO2-saturated brines, sodium bicarbonate solutions are already mildly alkaline (in pH 6–10 range [71]). This may reduce the degree to which cement phases need to be dissolved before pH levels are attained that allow carbonate precipitation to initiate, provided that sufficient Ca-ion concentrations can be generated from the portlandite and cement-pore fluid.

2.2. Sodium Silicate

Sodium silicate-based solutions are already find application in downhole wellbore environments, for example, in achieving the flash-setting of the cement and thereby avoid major losses during squeeze cementing [72]. Sodium silicate solutions have also been used, in the form of microencapsulated admixtures, to enhance the autogenous self-repairing capacity of concrete and other cement-based materials, allowing more effective sealing and healing of microcracks [73]. The aforementioned applications make use of how sodium silicate-based solutions interact chemically with cement phases and resident pore fluids. Presence of solid aluminosilicates in the cement can induce polymerization of the sodium silicate structure in the solution, which, in turn, can lead to gelation and geopolymer formation [74]. Sodium silicate-based solutions also react with the portlandite present in the hydrated cement (or Ca-ions available in the resident cement-pore fluid) to form solid calcium silicate hydrates [73]. This combination of solids precipitation and gelation of the fluid phase make sodium silicate solutions a promising candidate for reactive mineralization and sealing of micro-annuli along wellbores.

3. Materials and Methods

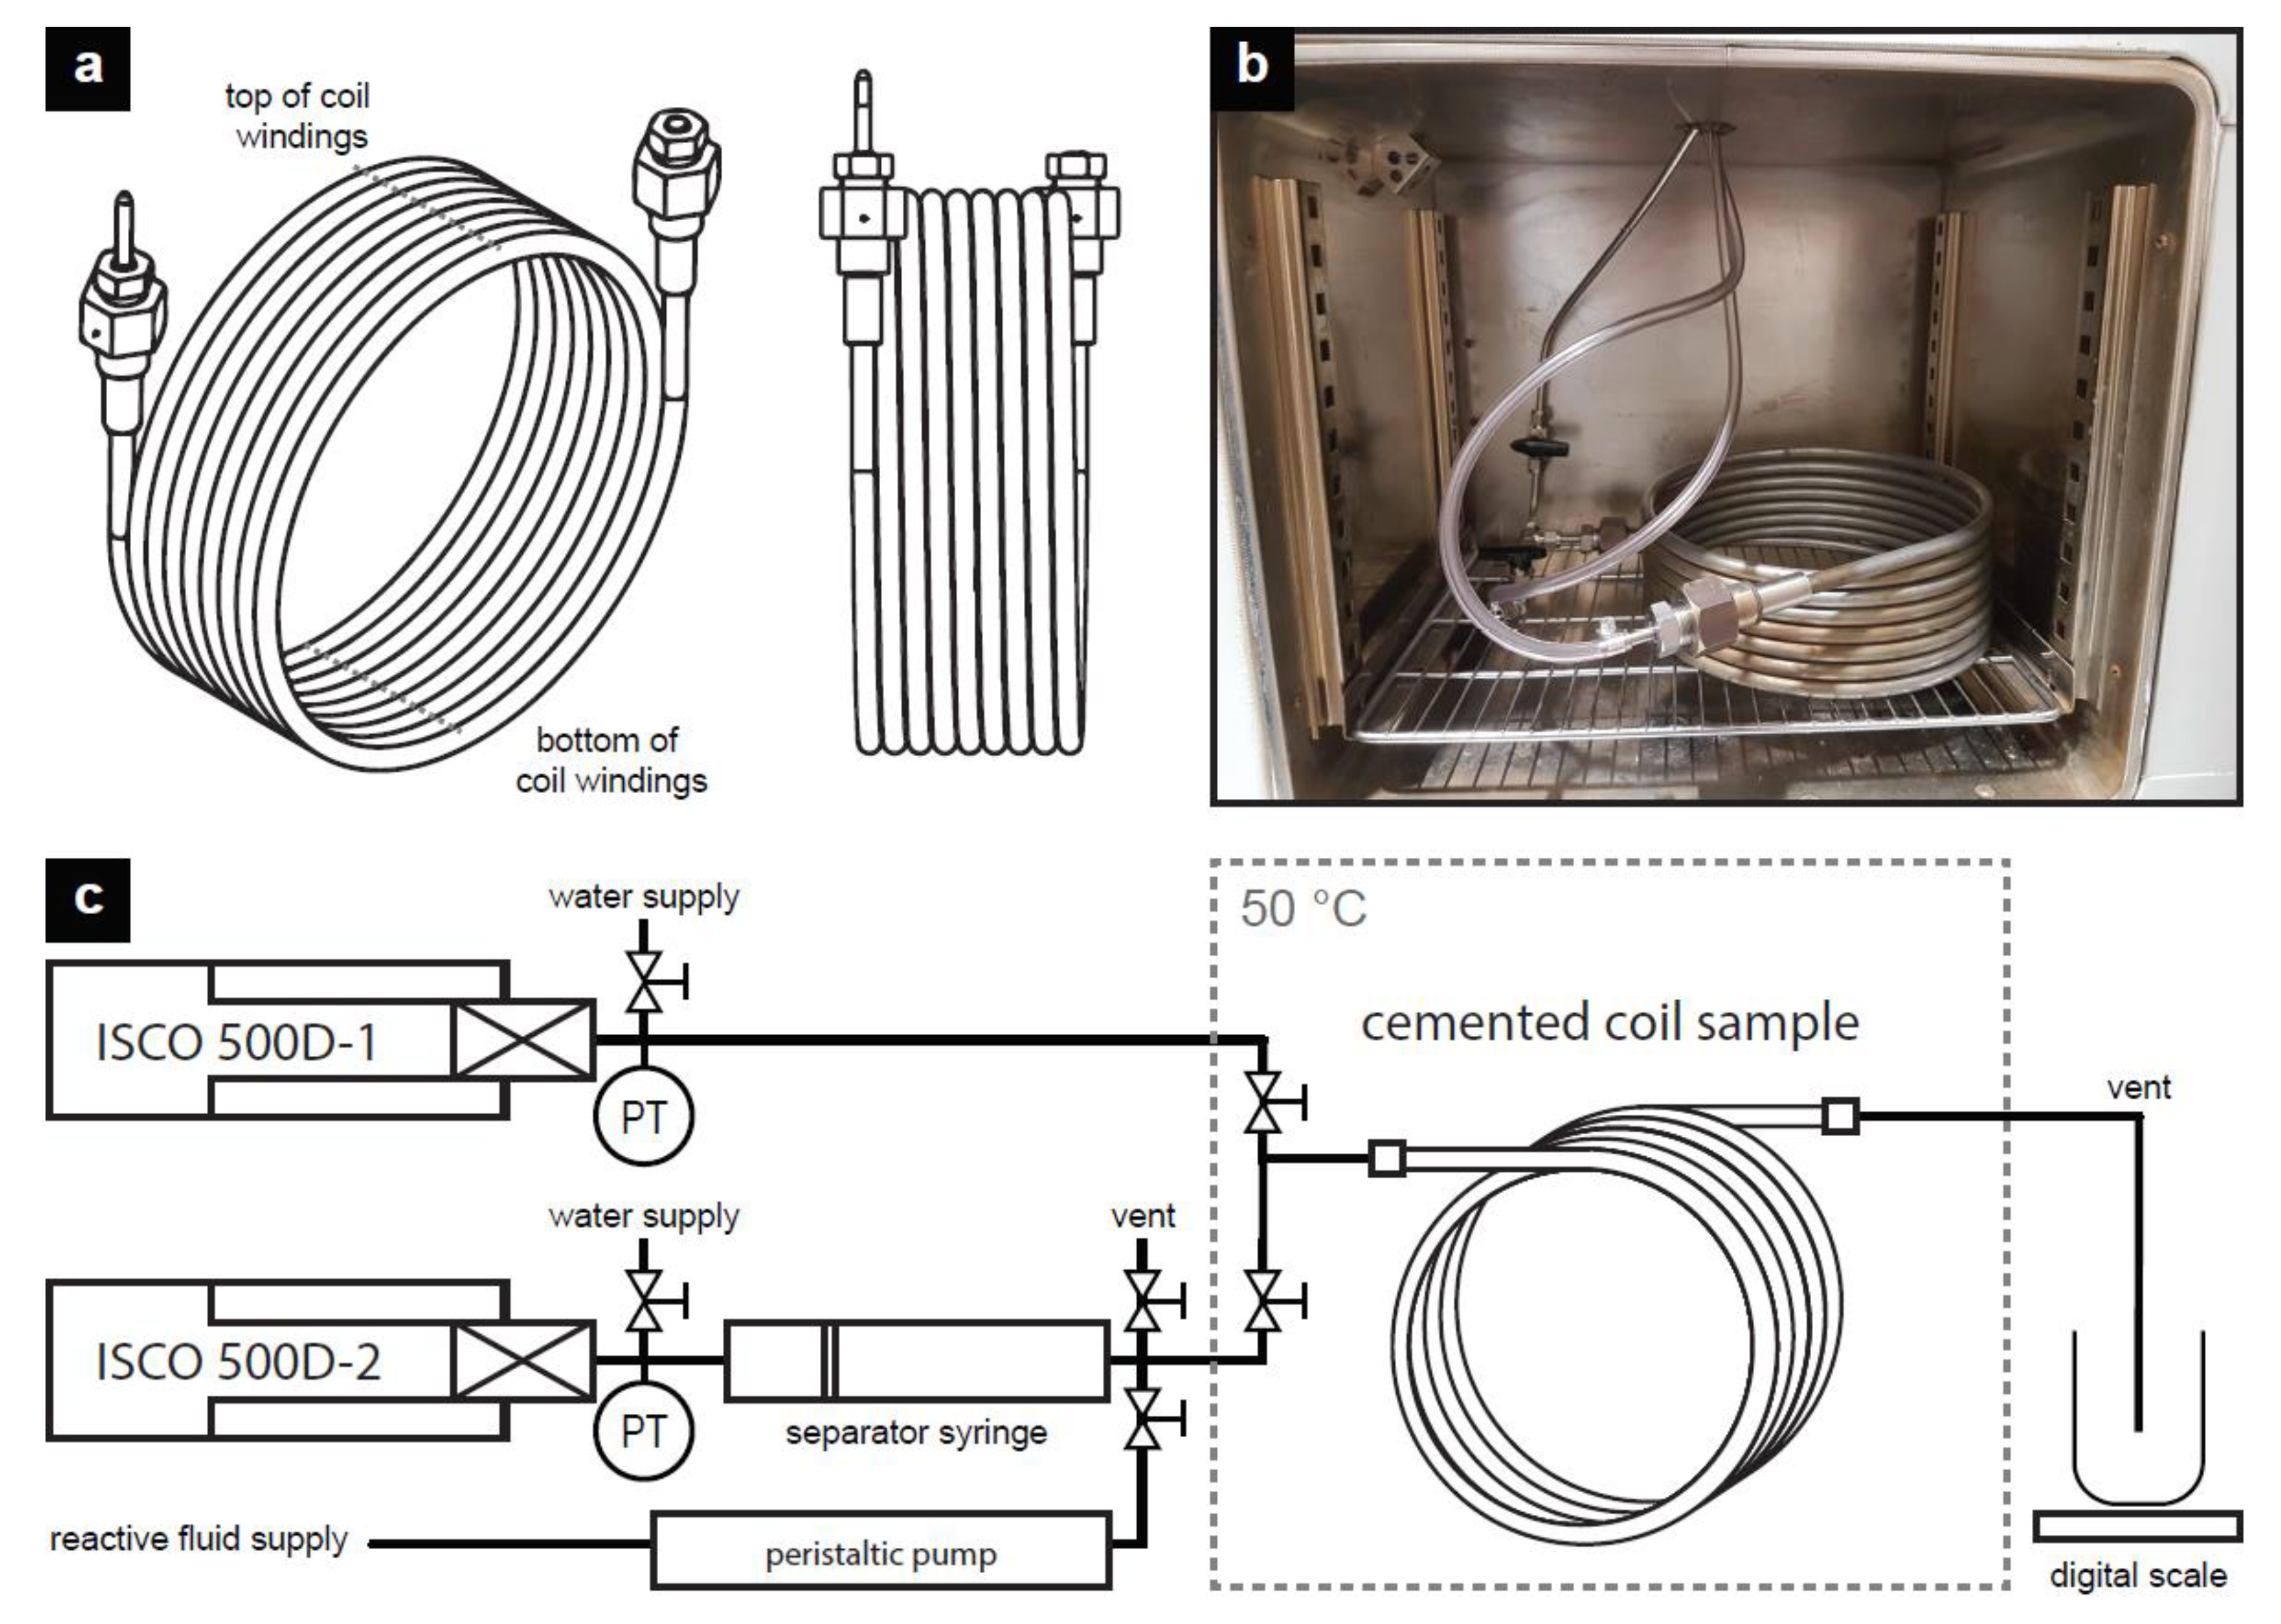
3.1. Materials and Preparation of Cemented Coil Samples

For the reactive flow-through experiments, 6-m-long sections of wellbore casing–cement interface were created by cementing coiled steel tubes (Figure 1a). These Portland cement-filled coils were made from ST.35 steel tubes (EN 10305-3, inner diameter 8 mm, outer diameter 10 mm) fitted with Nova high-pressure connections. The tubes were coiled prior to cementing (diameter ~23 cm, pitch ~1 cm), such that the samples physically fit inside the permeameter setup (Figure 1b).
The cement slurry used to plug the coiled steel tubes was prepared following API Recommended Practice 10B-2 [75] using Class G HSR Portland cement (Dyckerhoff AG, Lengerich) and tap water (0.44 water-to-cement mass ratio). A peristaltic pump was used to inject the cement slurry into the steel tubes, after which one of the tube’s ends was closed off. The other end of the sample was connected to an ISCO 500D syringe pump, used to impose 10 MPa of water pressure during curing at ambient temperature. The cemented samples were allowed to set under pressure for at least two weeks, during which the windings of the samples were oriented vertically. Afterwards, the samples were slowly depressurized and the cement was allowed to hydrate further at atmospheric pressure for at least six months. Reference cement samples were prepared and stored for chemical analysis of the initial materials.
After curing, the first ~7 cm of hardened cement was drilled out of both ends of the samples, to free the connections and ensure that a uniform fluid pressure could be applied on the tube inner wall. Subsequently, a hydraulic method was used to create continuous micro-annuli along the steel–cement interfaces of the samples. This was done by connecting a high-pressure hand-spindle pump to one end of the steel tube, closing off the other end with a pressure gauge. The steel tube was slowly pressurized to ~75 MPa using water, causing the tube wall to yield and permanently inflate, debonding from the cement inside. This procedure was executed very slowly, taking about two weeks, in order to obtain a uniform expansion. The progression and creation of micro-annuli was monitored by intermittent measurement of the outer diameter of the steel tubes.

3.2. Materials and Preparation of Reactive Mineral Fluids

The sodium bicarbonate solution used in this study was prepared by dissolving 90 g reagent grade sodium bicarbonate (Sigma-Aldrich) in 1000 g demineralised water. The Erlenmeyer containing the solution was sealed off to limit interaction with lab air. The solution was maintained at room temperature, stirred using a magnetic stirrer for at least 24 h, and filtered shortly prior to use in the experiment. The reagent grade sodium silicate solution used for this study was acquired from Sigma-Aldrich (Product No. 338443) and had a composition of ~10.6 wt.% Na2O and ~26.5 wt.% SiO2 [76], which corresponds to a SiO2:Na2O molar ratio of M = 2.57. For both solutions, the relatively high concentrations used were selected to maximise the solids precipitation potential.

3.3. Reactive Flow-Through Permeameter System

The reactive flow tests were performed in a permeameter (Figure 1c) that could impose fluid pressure differences of up to 6 MPa across the samples, while their downstream ends were held at atmospheric pressure. The main setup consisted of two model 500D Teledyne ISCO syringe pumps, equipped with Honeywell Model TJE pressure transducers (resolution ~10 kPa) and water ports. One pump was connected to the upstream end of the cemented coil, allowing water-based and sodium bicarbonate solution-based measurements to be performed (ISCO 500D-1, Figure 1c). The other pump (ISCO 500D-2, Figure 1c) was used to pressurize a secondary syringe, which could be charged with sodium silicate solution using a peristaltic pump, allowing the reactive flow-through experiments to be performed without risk of silicate precipitation inside the Teledyne ISCO pumps. An oven was used to keep the sample at 50 °C (±0.2 °C) and preheat injected fluids to experimental temperature during flow-through testing (Figure 1b). Effluent fluid was collected in a container placed on a digital balance.

3.4. Experimental Procedure

The experiments involved a reference flow measurement using water, performed to establish the initial transport properties of the cemented coil samples. This was followed by the introduction of one of the reactive mineral fluids, continuously measuring flow and applied pressure in order to monitor eventual changes in the transport properties of the samples. The sample subjected to sodium silicate solution was subsequently unmounted and exposed to pressurized dry air on its upstream side, in order to assess the possible impact of drying-out effects.
The reference flow-through measurements were made by imposing a controlled fluid pressure difference over the sample ends, deeming the resulting flow rate to be a direct measure for the coiled tubes’ effective permeability. The fluid pressure difference imposed across the cemented coils was varied between 0.2 and 6 MPa in several steps, in order to assess whether the initial flow behaviour could be treated as laminar.
The switch to reactive flow-through testing was made by first isolating the water-filled pump and then connecting the upstream end of the sample to the pressurized syringe containing the sodium bicarbonate or sodium silicate solution. During this procedure, the two pump systems were maintained at equal pressure. Subsequently, the equivalent permeability of the samples was measured following procedures similar to those employed during the reference measurements. Experiments would be terminated either when flow rate became too low for effective measurement or when the transport properties of the sample reached a stable, albeit still permeable state.
Testing with dry air involved direct connection to compressed air facilities, delivering 0.7 MPa pressure to the upstream side of the cemented steel tube. Eventual outflow of gas was monitored using a water displacement method. To this end, a narrow measuring cylinder filled with deaerated water was turned upside down in a larger water basin, with the downstream side of the sample connected such that any gas appearing would be collected in the measuring cylinder. This may be considered roughly comparable to an industry bubble test [77].

3.5. Data Acquisition and Processing

LabView-based software was used to log the flow rate, volume and pressure signals of the ISCO pumps, and the accumulated mass of effluent fluid once every 5 s. The logged data were processed by first removing intervals corresponding to setup maintenance or switching of fluids, offsetting volume and time accordingly. Assuming single-phase flow, the data were subsequently used to calculate the evolving equivalent Darcy permeability of the cemented steel coil samples, here denoted κ e q u i v [m2] [78]:
κ e q u i v = μ Q A L Δ P ,
where Q [m3 s−1] denotes the flow rate, L [m] and A [m2] are the cemented length and inner cross-sectional area of the steel tube, respectively, μ [Pa s] is the fluid viscosity, and Δ P [Pa] denotes the pressure difference imposed over the cemented steel tube. The flow rate was obtained by linear regression of intervals of pump volume data, using adaptive windows of 10 min duration. Corresponding values of the other properties were calculated as moving averages over the same time windows. The data thus obtained are made available via the Yoda data repository [79].
The principal source of uncertainty in the aforementioned calculations is likely to be dynamic viscosity. For both the water-based reference measurements and the subsequent reactive flow tests, a constant μ of 0.55 mPa s was assumed in the calculations (pure water at 50 °C and 5 MPa pressure—NIST Standard Reference Data). For the sodium bicarbonate solution, the actual dynamic viscosity depends on the fluid’s ionic strength and CO2 content [80,81,82], introducing relative errors in our permeability estimates of about 10% [48,82]. For the sodium silicate solution, however, the actual dynamic viscosity is expected to vary significantly, as this property is highly sensitive to the concentration of the solution itself and eventual contamination with other ionic species [72,74,83]. These issues will be addressed in the discussion of the data.
The water-based flow measurements were used to calculate the initial hydraulic aperture of the debonding defects along the steel-cement interface of the samples. Following the approach of Wolterbeek et al. [48,60], the circumferential debonding defects in the cemented steel tube sample were modelled for this purpose as regions between coaxial, cylindrical plates [68,84]. The hydraulic aperture of the micro-annulus, w [m], can then be obtained by solving:
κ e q u i v = 1 8 R 2 ( R 4 ( R w ) 4 + w 2 ( 2 R w ) 2 ln ( 1 w / R ) ) ,
where R [m] is the inner radius of the steel tube. The corresponding defect void volume, V v o i d [m3], was calculated as:
V v o i d = π ( R 2 ( R w ) 2 ) L .
Note that this value, calculated on the basis of the hydraulic aperture, should be considered an underestimate of the actual void volume, as the physical geometry of the defects will be variable and may include hydraulically constricted but volumetrically large domains (e.g., bubbles or short-ranged channels).

3.6. Post-Experiment Microstructural Analysis

After the reactive flow experiments were completed, a microstructural study was performed on the cemented steel tubes. For this purpose, the tubes were cut into segments of 3 cm in length. Subsequently, 2-mm thick discs were taken from the middle of selected segments, yielding a sequence (from the coiled tube inlet to its outlet) of cross-sections oriented perpendicular to the main direction of flow. With respect to the overall orientation of the cemented steel tube, the selected cross-sections corresponded to either the top or bottom of a coil winding (Figure 1a), i.e., locations where gravity worked roughly perpendicular to the main flow direction. These sections were studied using reflected light microscopy to reveal the defect architecture and explore for signs of chemical alteration and mineral precipitation.

4. Results and Analysis

The main data obtained in the two reactive transport tests are summarized in Table 1. Below, we will first provide descriptions of the flow-through permeability results and then give a brief account of the microstructural observations.

4.1. Flow and Equivalent Permeability Evolution

The matrix permeability of wellbore cements, κ c e m [m2], typically attains very low values, in the order of 10−21 to 10−17 m2 [85,86]. Consequently, flow in the reactive transport tests presumably occurred chiefly via the micro-annuli created along the steel–cement interface. However, since the geometry of these defects is insufficiently constrained, the sealing performance of the samples is here described in terms of the apparent Darcy permeability of the samples (Equation (1)), i.e., defined with respect to A [m2]. An advantage of this method is that the values thus obtained can be directly compared to the equivalent Darcy permeability a hypothetical, perfectly bonded and cemented tube, which would approach the cement matrix permeability, κ c e m [m2].

4.1.1. Sample BC-1: Experiment with Sodium Bicarbonate Solution

During initial water-based testing of sample BC-1 (Figure 2a), the measured flow rate increased linearly, from 7 to 71 mL h−1, as the pressure difference was increased from 0.6 to 6 MPa (Figure 2b). This suggests laminar flow behaviour and corresponds to an initial equivalent Darcy permeability of 3.8 × 10⁻¹³ m2 and an initial apparent hydraulic aperture of 17.3 µm, with an associated defect void volume of ~2.6 mL.
Following the pressure-step testing, sample BC-1 was subjected to 45 h of stable flow, under Δ P = 0.3 MPa, during which ~135 mL of water was injected (Figure 3). Over this period, the κ e q u i v of sample BC-1 decreased only very slightly, from 3.5 × 10⁻¹³ m2 to 3.2 × 10⁻¹³ m2 (Figure 3). Subsequently, at t = 0 h (Figure 3a), the permeameter system was switched over to the second syringe pump to initiate flow of sodium bicarbonate solution, still maintaining Δ P = 0.3 MPa. During the first 3.5 h of testing with sodium bicarbonate solution, the permeability of sample BC-1 remained essentially unchanged. Note this period saw the injection of about 10 mL of fluid, which is roughly the dead volume of upstream tubing and thus likely reflected continued water-injection into the sample. From t = 3.5 h onwards, flow rate began to decrease slowly, as illustrated by the proportional κ e q u i v -data shown (Figure 3). While a jump occurred around t = 12 h, the overall trend remained one of slowly decreasing flow rate, at least until t = 40 h. At this point, after injecting about 52 mL of fluid, κ e q u i v attained a value in the range of 4 × 10⁻¹⁴ m2, which constitutes nearly an order of magnitude decrease compared to the initial water-based measurements (Figure 3). For the next 29 h, κ e q u i v remained essentially stable or perhaps showed a slight increase, albeit minor compared to uncertainties in the data. At t = 69 h, after injection of ~63 mL of fluid, the pressure difference acting across sample BC-1 was increased to 0.6 MPa. This produced an immediate upsurge in the flow rate (Figure 3) and a corresponding increase in the equivalent sample permeability, which attained values in the range of 3 × 10⁻¹³ m2 (Figure 3). These changes are probably apparent effects, however, related to sample pressurization (storativity) and other transient phenomena (see [48]). At t = 77 h, after another ~35 mL of fluid was injected, κ e q u i v began to decrease again. At this stage, the data displayed five “peaks”, each consisting of a sudden increase followed by a more gradual lowering of the equivalent permeability. After t = 82 h, the peaks cease to occur, and κ e q u i v attains a more stable value in the range of 1 × 10⁻¹³ m2. The equivalent permeability of sample BC-1 continued to decrease slowly, reaching a value of ~9 × 10⁻¹⁴ m2 after 91.3 h of reactive flow-through measurement (Figure 3). At this stage, the experiment had to be terminated abruptly, because of a mandated lockdown of our lab facilities in March 2020, related to the outbreak of the COVID-19 pandemic.

4.1.2. Sample SIL-1: Experiment with Sodium Silicate Solution

As for sample BC-1, the initial flow behaviour of sample SIL-1 could be characterized as laminar, where measured flow rates changed linearly, between ~0.3 and 103 mL h−1, as the imposed pressure difference was varied between 0.2 and 4.2 MPa (Figure 4). Sample SIL-1 was calculated to have an initial equivalent permeability of 8.3 × 10⁻¹³ m2, which corresponds to a hydraulic aperture of 22.1 µm and defect void volume of ~3.3 mL, but note that the latter is likely an underestimate of the physical void volume.
Following the pressure-step testing to establish the initial transport properties, sample SIL-1 was subjected to 1.1 h of water injection under a constant imposed pressure difference of 0.6 MPa. About 15 mL of water was injected during this period, at a more or less steady flow rate of ~13.2 mL h−1, corresponding to an κ e q u i v -value of ~7 × 10⁻¹³ m2 (Figure 5b). At this point ( t = 0 h, Figure 5a), the permeameter system was switched over to the second syringe pump, in order to initiate flow using sodium silicate solution, while maintaining Δ P = 0.6 MPa. Similar to observations for sample BC-1, the flow rate remained nearly constant during the first ~9 mL of injection, which likely represented inflow of water remaining in the dead volume of tubing upstream of the cemented sample. Subsequently, at t = 0.8 h, the flow rate started to decrease slowly, reaching ~3 mL h−1 at t = 3.2 h. At this point, the decrease in flow intensified, altogether dropping about three orders of magnitude (Figure 5a). Starting at t = 45.5 h, the pressure difference acting across sample SIL-1 was increased in a series of brief steps, reaching Δ P = 3 MPa within two hours. While this pressurization resulted in transiently higher flow rates, these quickly fell back to values below 10 µL h−1. The experiment was terminated after 300 h, injecting ~35 mL of sodium silicate solution in total. Assuming a dynamic viscosity of 0.55 mPa s throughout the experiment, the final equivalent permeability of sample SIL-1 attains values in the range of 10−16–10−19 m2, effectively reaching below the measurement limit of the permeameter for cemented tubes of the dimensions tested (Figure 5). It should be noted, however, that the actual dynamic viscosity of the sodium silicate solution may have varied orders of magnitude, depending on the concentration of the solution and eventual changes due to interactions with the cement. These effects are considered in more detail in the discussion.
Sample SIL-1 was subsequently subjected to 0.7 MPa of compressed dry air, while measuring the outflow of gas at the downstream side of the sample using a water displacement technique. No gas was observed during a two-week period of testing. At this stage, sample SIL-1 was cut in half and the upstream 3 m were tested independently for one week. Subsequently, the cutting process was repeated in order to assess the upstream-most 1.5 m of the sample. In all three cases, no measurable amount of air flow occurred.

4.2. Microstructural Observations

Upon retrieval and cutting of sample SIL-1, the cement inside was visibly still moist, with the wetting fluid appearing somewhat more viscous than water. Cross-sections cut perpendicular to the steel tube axis, hence the flow direction, further revealed the geometry of the micro-annuli, fractures and other defects present, as well as possible chemical alteration of the cement. Figure 6 shows reflected light images of sections obtained at increasingly greater distances from the upstream end of sample SIL-1 (note the azimuthal orientation may differ among the sections).
Sample SIL-1 showed two main defect features, namely (i) crescent-shaped voids and (ii) circumferential micro-annuli (Figure 6). The crescent-shaped voids were present along the top of each coil winding, occupying up to half of the internal cross-sectional area of the tube (Figure 6b). Given their position and limited longitudinal extent, these voids are likely caused by gravitational sagging of the cement before it fully cured and hardened (i.e., sample preparation features). Similar though much smaller voids could be observed along the topside of the cross-sections originating from the bottom of coil windings (Figure 6d). The size of the crescent-shaped voids decreased with distance from the inlet side, almost disappearing about halfway the length of the steel tube (Figure 6j). In addition to the crescent-shaped voids, all cross-sections showed circumferential micro-annuli (debonding defects) between the cement core and inner surface of the steel tube (Figure 6). These casing–cement micro-annuli appeared to have been fairly uniform in size along the length of the coiled tube, mostly showing apertures of 10–50 µm.
Though studied in less detail, the defect geometry of sample BC-1 could be characterized by similar features, with throughgoing micro-annuli along the cement–steel interface, complemented by short-ranged, crescent-shaped voids near the tops and bottoms of the coil windings. In parts of the two coils where the steel tubes were oriented vertically during cement curing, the cross-sections only revealed micro-annuli (not shown).
Regarding chemical alteration, all the cross-sections of sample SIL-1 showed broadly similar features. The cement matrix appeared largely unaltered, though concentric and horizontally layered colour zonations could be observed in some of the cross-sections (Figure 6c,i,l). Based on comparisons with reference samples, however, it is not possible to confirm whether this zonation was the result from chemical interaction with the sodium silicate solution or a pre-existing feature related to cement curing. The micro-annuli were often somewhat obscured by smeared-out steel from the tube wall (polishing artefacts) or due to imbibition by the epoxy glue used to mount the cross-sections. Where reasonably visible, they appeared as an open fracture in some locations (Figure 6m) and filled with fine-grained debris in others (Figure 6n). The nature of these fine deposits could not be determined. Perhaps the most prominent features were growths of up to mm-sized, white, platy crystals, which could be observed in several of the crescent-shaped voids (Figure 6a–c). Based on their morphology (and powder X-ray diffraction analysis of identical crystals obtained from reference cement cured in water), these hexagonal platelets likely represent efflorescence of portlandite from the cement matrix into the defect void space.
Preliminary study of sample BC-1 found chemical alteration in this sample mainly consisted of orange discolouration along the first ~1 m of cement, similar to the reaction zonation seen in the CO2-reacted cement samples [48].

5. Discussion and Conclusions

The results obtained from our cemented steel coil samples showed that, while initial flushing with water did not affect the samples’ transport properties [87], subsequent introduction of a sodium silicate solution into sample SIL-1 caused a decrease in flow rate of several orders, effectively reaching the lower detection limit of the flow setup in a few hours (Figure 5). The introduction of sodium bicarbonate solution, on the other hand, produced only a minor reduction in the equivalent permeability of sample BC-1 (Figure 3). Post-experimental analysis showed the cemented steel coil samples contained circumferential micro-annuli, characterized by apertures of 10–50 µm (Figure 6), in addition to crescent-shaped voids that were presumably created due to free water formation during cement curing (Figure 6). Sample SIL-1 showed some signs of possible solids formation in the micro-annuli and crescent-shaped voids, but the extent of this precipitation was generally limited. In the following subsection, we will first discuss the trends in equivalent permeability observed, and then consider the implications for the applicability of these reactive mineral fluids in seepage remediation along cemented wellbores. While the present study was limited to two experiments, note the discussion below also draws on prior experience with CO2-rich aqueous fluids, providing confidence in the methods used and enabling us to consider the new findings in a broader context.

5.1. Defect Sealing Potential of Sodium Bicarbonate-Based Solutions

Based on the present findings, single-phase reactive flushing with a saturated sodium bicarbonate solution seems to have relatively little sealing potential, at least on timescales relevant to potential engineering applications. While sample BC-1 did show a reduction in the equivalent permeability upon exposure, the magnitude of this effect was noticeably small (Figure 3), especially when compared to the permeability decreases seen in similar experiments using CO2-saturated water [48,88]. To better understand this shortfall, the chemical reactions involved have to be considered more detail.
Experiments have long shown that steel and Portland cements are susceptible to chemical alteration by carbonated fluids [51,57,89,90]. Dissolution of CO2 in aqueous fluids causes the formation and dissociation of carbonic acid, establishing a series of equilibria between various carbonate species:
{ CO 2   ( a q ) + H 2 O   ( l ) CO 3   ( a q ) 2 + 2 H   ( a q ) + H 2 CO 3   ( a q ) CO 3   ( a q ) 2 + 2 H   ( a q ) + HCO 3   ( a q ) CO 3   ( a q ) 2 + H   ( a q ) + H   ( a q ) + + OH   ( a q ) H 2 O   ( l ) .
For CO2 dissolved in water, these equilibria yield acidic conditions, with the fluid pH ranging from 3–5, depending on the temperature and CO2 partial pressure [70]. Focusing on the major components in Portland-based cement, this acidification prompts dissolution of the portlandite (calcium hydroxide) and decalcification of the calcium silicate hydrate (C-S-H) phases, leaving behind a semi-crystalline aluminosilicate residue [62,91]:
Ca ( OH ) 2   ( s ) Ca   ( a q ) + + 2 OH   ( a q ) ,  
C - S - H   ( s ) Ca   ( a q ) + + OH   ( a q ) + SiO 2   ( a m ) .
The above reactions release Ca-ions into solution and buffer the fluid pH to more alkaline values, thereby shifting the carbonic acid equilibria (Equation (4)) towards the right-hand side, producing (bi-)carbonate ions. Once sufficiently high concentrations are attained, this in turn leads to precipitation of calcium carbonates [62,91]:
Ca   ( a q ) + + CO 3   ( a q ) 2 CaCO 3   ( s ) .
The carbonates thus produced can subsequently re-dissolve, however, if the alkaline cement phases that buffer the fluid pH become depleted. Whether the reactions result in self-limiting or self-enhanced reactive flow will depend on whether precipitation or dissolution predominates. Numerical modelling studies have successfully captured this behaviour in terms of the effective transit time of the CO2 in the defect, τ = V v o i d / Q [s], and the defect’s hydraulic aperture, w [m] [52,60,61,66,67,68,69]. Based on their simulations, Brunet et al. [66] defined a critical residence time, τ c r i t [s], which must be exceeded in order to attain self-sealing conditions, leading to the following stability criterion:
τ c r i t = α 1 w 2 + α 2 w ,  
where α 1 = 0.0588 s µm−2 and α 2 = 15.24 s µm−1 are empirical constants.
At this stage, it is interesting to consider the amount of time fluid spent traversing sample BC-1 during our reactive flow-through test. Taking the average flow rate during water injection under a fixed pressure difference of 0.6 MPa ( Q = 1.6 mL h−1) and the calculated defect void volume ( V v o i d = 2.6 mL), we obtain an estimate of τ = 97 min. The actual residence time was probably longer, as V v o i d , does not account for the physical volume of the short-ranged, crescent-shaped voids (cf. Figure 6). Since the micro-annulus in sample BC-1 has a calculated hydraulic aperture of 17.3 µm, the estimated fluid residence time exceeds the critical value by a factor-20 ( τ c r i t = 4.7 min). In other words, the Brunet et al. [66] model predicts that sample BC-1 would have sealed up, had the experiment been conducted using CO2-saturated water.
By contrast, however, flow-through of sodium bicarbonate solution under these residence time conditions resulted in only a minor reduction in the equivalent permeability of sample BC-1 (Figure 3). Similar trends, involving a limited initial reduction, followed by stagnation in a still permeable state, have previously been observed in CO2-based experiments employing either near-static reaction conditions [57,92] or subcritical residence times [60,61]. Especially in the near-static experiments, the only minor decreases in transport properties can likely be attributed to limited extents of reaction, e.g., due to passivation effects [57].
Considering the reactions involved, this shortfall in carbonate precipitation can probably be attributed to a lack of available Ca-ions. Analogous to carbon dioxide, dissolving sodium bicarbonate in aqueous fluid produces a range of carbonate species and establishes the carbonic acid equilibria of Equation (4) via:
NaHCO 3   ( s ) + H 2 O   ( l ) Na   ( a q ) + + HCO 3   ( a q ) Na   ( a q ) + + H   ( a q ) + + CO 3   ( a q ) 2 .  
Unlike CO2-induced acidification, however, dissolution of sodium bicarbonate in water produces mildly alkaline conditions only, with the fluid pH typically ranging from 6–10 depending on temperature and CO2 partial pressure [71]. Since these values remain lower than the equilibrium pH of 11–13 that is typical for cement pore fluids [51,86], buffering through dissolution and decalcification of the cement phases (Equations (5) and (6)) will still occur, albeit to a lesser extent and presumably at a slower rate compared to the response upon exposure to CO2-saturated water.
We envisioned this change in chemistry would have positive effects (see Section 2), because reducing the extent of cement alteration limits the risk of dissolution-enhanced permeability that is associated with CO2-induced cement degradation [93,94]. Moreover, since the initial fluid composition is already mildly alkaline, a smaller extent of buffering would be sufficient to shift the carbonic acid equilibria (Equation (4)) in favour of higher carbonate concentrations. However, the dissolution and decalcification of cement phases serves a second purpose: release of Ca-ions into the solution. Resident pore fluids of sulphate resistant Portland cements like the one used in our experiment have equilibrium Ca-ion concentrations of up to ~12 mM [95], depending on the initial alkalis concentration in the cement pore fluid [96], while ~2 mM is typical for the pore waters inside ordinary Portland cement [95,97]. Even if all Ca-ions initially present in such fluids are precipitated in the form of calcium carbonate, this would constitute <5% reduction in the defect void volume. Whether carbonate precipitation can be sustained beyond this point will be reliant on liberation of additional Ca-ions through dissolution of highly alkaline solid phases in the cement, such as portlandite (Equation (5)). Even though precipitation in all likeliness outstripped dissolution, our observations imply that the overall extent of reaction and the actual volume of solids produced via carbonate precipitation was simply insufficient to effectively clog-up the defects in sample BC-1.

5.2. Defect Sealing Potential of Sodium Silicate-Based Solutions

Based on the present findings, there seems to exist some scope for sodium silicate solutions to be used as reactive sealant in the remediation of micro-annuli and fractures along cemented wellbores. However, the actual potential will likely be contingent on the nature of the seal that is formed upon injection. While the flow rate in sample SIL-1 decreased by several orders and effectively reached the lower measurement limit of the setup within a few hours (Figure 5), post-experiment analysis of the sample microstructure showed only limited evidence for defect clogging by solids precipitation, with the notable exception of portlandite efflorescing from the cement matrix into the crescent-shaped voids (Figure 6). Here it should be noted, however, that these deposits most likely represent a pre-experimental feature, as similar growths of mm-sized portlandite crystals have been observed in reference cement samples cured under similar, submerged conditions [21,60]. With regards to possible precipitation of calcium silicate hydrates, the occurrence of fine-grained material inside the defect in some locations should be mentioned (Figure 6n). In general, however, large domains of the defect geometry appear to have remained open, at least at the locations of the twelve cross-sections studied (Figure 6m). This lack of solids precipitation may have been caused by factors similar to those limiting precipitation in the sodium bicarbonate experiment. Where sodium silicate solutions react vigorously with cement slurries, leading to so-called “flash setting” [27,72,86], their interaction with the much lower Ca-ion concentrations available in pore fluids of already set cement [95] ostensibly produces insufficient solids to achieve effective sealing. Sodium silicate solutions also react with portlandite present in the cement matrix to form a larger volume of calcium silicate hydrates [73], but in the present experiments such processes were probably too slow.
With no microstructural evidence for extensive defect clogging due to mineral precipitation, the most probable explanation for the decrease in flow rate observed in sample SIL-1 is a significant change in the properties of the fluid phase. Recalling that a constant μ of 0.55 mPa s was used in the calculation of κ e q u i v , an increase in the actual viscosity of the fluid would be reflected as an apparent permeability decrease. Based on the viscosity data for 25 °C in Table 1 of Yang et al. [83], the sodium silicate solution used in our experiment (37.1 wt.% concentration, M = 2.57 composition) is estimated to have a dynamic viscosity in the range of 20 to 80 mPa s at room temperature. The temperature dependence can be described using an Arrhenius-type relation [83], yielding about an order-lower values at 50 °C. Taking μ = 5.5 mPa s as a convenient and representative value, replacement of water by sodium silicate solution as the fluid medium in sample SIL-1 would explain about a tenfold decrease in the apparent transport properties, i.e., less than was observed. However, uncertainties with respect to the actual evolution of the fluid viscosity are compounded by possible influences of ionic species derived from the resident cement pore fluid. While gelation of sodium silicate solutions occurs chiefly upon acidification [98,99,100], which is unlikely for our experiment, interactions with solid aluminosilicates present in the cement can lead to geopolymerization [74]. The Ca-ion concentration, for example, may have been insufficient for solid calcium silicate hydrates to precipitate, but high enough to bring about significant gelation [73]. Given the foregoing, it is likely that the apparent decrease in the equivalent permeability of sample SIL-1 was caused by a change in the effective viscosity of the fluid, rather than solids precipitation in the micro-annulus and other defects. Subsequent application of pressurized air was probably insufficient to displace the viscous fluid (potentially aided by capillary entry pressure effects).

5.3. Conclusions and Implications for Applicability to Wellbores

The aim of this study was to evaluate the sealing potential of aqueous solutions that may induce mineral precipitation and thereby seal wellbore defects such as micro-annuli along casing–cement–rock interfaces or fractures in cement sheaths. As prospective fluids, the impact of sodium bicarbonate and sodium silicate solutions has been assessed in reactive flow-through experiments performed on 6-m-long cemented steel tube samples with about 20-μm-wide interfacial debonding defects. For both fluid systems investigated, the amount of mineral precipitation resulting from single-phase injection was less than anticipated. In the case of sodium bicarbonate-based solution (sample BC-1), reactive flow translated into a minor decrease of the equivalent permeability of the sample only. In the case of sodium silicate-based solution (sample SIL-1), injection brought about a significant reduction in the flow rate, hence the apparent permeability of the wellbore sample. Sample SIL-1 also passed subsequent zonal isolation integrity tests using 0.7 MPa of compressed dry air, demonstrating that sodium silicate solutions could act as a sealant in the remediation of micro-annuli. It is critical to note here, however, that the microstructural analysis of sample SIL-1 suggests this strong sealing effect stems from gelation of the fluid phase, e.g., via polymerisation of the sodium silicate (hydrates), rather than from induced crystal growth. While viscous silicate gels could even offer certain advantages compared to mineralogical seals, for example in terms of their mechanical flexibility [101], large uncertainties remain regarding the long-term fate of such gelled materials. Chemical interaction with formation fluids could perhaps facilitate a progressive transformation into new, stable solid phases over time. On the other hand, the gradual loss of bound-water or crystallization of the gel phase (typically involving densification) could also lead to undesirable shrinkage effects [102]. Analogous to the drawbacks identified for organics-based sealants [46], confident use of silicate(hydrate)-based gels in wellbore P and A applications would therefore require further research with respect to their longevity in downhole environments.
For both the sodium bicarbonate and sodium silicate solutions investigated, the lack of solids precipitation could be attributed to insufficient availability of Ca-ions. A possible way to solve this issue is to source the Ca-ions needed for precipitation directly, for example in the form of a second mineral solution (e.g., calcium chloride). The downside of such multiple-fluid approaches would be the increased complexity of placement procedures, which will have to involve either pre-flushing or co-injection. On the other hand, it would allow consideration of a wider range of fluid systems. Inducing precipitation of calcium (alumino-)sulphates, for example, could be a promising option, based on learnings from wastewater treatment [103,104,105,106]. Mechanical remediation methods, such as localized casing expansion [107,108], might nonetheless prove more effective.

Author Contributions

Conceptualization, T.K.T.W. and S.J.T.H.; investigation, formal analysis, writing—original draft preparation, T.K.T.W.; writing—review and editing, S.J.T.H. All authors have read and agreed to the published version of the manuscript.

Funding

This research was funded by Shell Global Solutions International B.V. under Amended Contract PT63253.

Institutional Review Board Statement

Not applicable.

Informed Consent Statement

Not applicable.

Data Availability Statement

Flow measurement data obtained and used for this study are accessible through the Yoda data repository at: https://public.yoda.uu.nl/UU01/K3B1IB.html.

Acknowledgments

We would like to thank Thony van der Gon-Netscher, Gerard Kuijper, Floris van Oort and Leonard Bik for assistance in the laboratory. Figure 1a is modified after an image kindly provided by Floris van Oort. We would like to thank two anonymous reviewers for their useful feedback and suggestions. We thank Shell Global Solutions International B.V. for their permission to publish this work.

Conflicts of Interest

The authors declare no conflict of interest.

References

  1. Allahvirdizadeh, P. A review on geothermal wells: Well integrity issues. J. Clean. Prod. 2020, 275, 124009. [Google Scholar] [CrossRef]
  2. Huan, X.; Xu, G.; Zhang, Y.; Sun, F.; Xue, S. Study on Thermo-Hydro-Mechanical Coupling and the Stability of a Geothermal Wellbore Structure. Energies 2021, 14, 649. [Google Scholar] [CrossRef]
  3. Bo, Z.; Zeng, L.; Chen, Y.; Xie, Q. Geochemical reactions-induced hydrogen loss during underground hydrogen storage in sandstone reservoirs. Int. J. Hydrogen Energy 2021, 46, 19998–20009. [Google Scholar] [CrossRef]
  4. Zhang, M.; Bachu, S. Review of integrity of existing wells in relation to CO2 geological storage: What do we know? Int. J. Greenh. Gas Control 2011, 5, 826–840. [Google Scholar] [CrossRef]
  5. Vrålstad, T.; Saasen, A.; Fjær, E.; Øia, T.; Ytrehus, J.D.; Khalifeh, M. Plug & abandonment of offshore wells: Ensuring long-term well integrity and cost-efficiency. J. Pet. Sci. Eng. 2019, 173, 478–491. [Google Scholar]
  6. Barclay, I.; Pellenbarg, J.; Tettero, F.; Pfeiffer, J. The beginning of the end: A review of abandonment and decommissioning practices. Oilf. Rev. 2001, 13, 28–41. [Google Scholar]
  7. Kiran, R.; Teodoriu, C.; Dadmohammadi, Y.; Nygaard, R.; Wood, D.; Mokhtari, M.; Salehi, S. Identification and evaluation of well integrity and causes of failure of well integrity barriers (A review). J. Nat. Gas Sci. Eng. 2017, 45, 511–526. [Google Scholar] [CrossRef]
  8. Ahmed, S.; Salehi, S.; Ezeakacha, C. Review of gas migration and wellbore leakage in liner hanger dual barrier system: Challenges and implications for industry. J. Nat. Gas Sci. Eng. 2020, 78, 103284. [Google Scholar] [CrossRef]
  9. Dusseault, M.B.; Gray, M.N.; Nawrocki, P.A. Why Oilwells Leak: Cement Behavior and Long-Term Consequences. In Proceedings of the SPE International Oil and Gas Conference and Exhibition, SPE 64733, Beijing, China, 7–10 November 2000; p. 8. [Google Scholar]
  10. Agbasimalo, N.; Radonjic, M. Experimental Study of the Impact of Drilling Fluid Contamination on the Integrity of Cement–Formation Interface. J. Energy Resour. Technol. 2014, 136, 42908. [Google Scholar] [CrossRef] [Green Version]
  11. Tao, C.; Rosenbaum, E.; Kutchko, B.G.; Massoudi, M. A Brief Review of Gas Migration in Oilwell Cement Slurries. Energies 2021, 14, 2369. [Google Scholar] [CrossRef]
  12. Jandhyala, S.R.K.; Pangu, G.; Deshpande, A.; Wolterbeek, T.; Cornelissen, E.; van Eijden, J. Volume Change of Cement Plugs: Spotlight on the Role of Boundary Conditions Using an Improved Testing Method. In Proceedings of the SPE Asia Pacific Oil and Gas Conference and Exhibition; Society of Petroleum Engineers, Brisbane, Australia, 23–25 October 2018. [Google Scholar]
  13. Van Eijden, J.; Cornelissen, E.; Ruckert, F.; Wolterbeek, T. Development of Experimental Equipment and Procedures to Evaluate Zonal Isolation and Well Abandonment Materials. In Proceedings of the SPE/IADC Drilling Conference and Exhibition, The Hague, The Netherlands, 14–16 March 2017; SPE-184640-MS; Society of Petroleum Engineers: Hague, The Netherlands, 2017; pp. 14–16. [Google Scholar]
  14. Reddy, B.R.; Xu, Y.; Ravi, K.; Gray, D.W.; Pattillo, P. Cement Shrinkage measurement in oilwell cementing—A comparative study of laboratory methods and procedures. SPE Drill. Complet. 2009, 24, 104. [Google Scholar] [CrossRef]
  15. Chenevert, M.E.; Shrestha, B.K. Chemical Shrinkage Properties of Oilfield Cements (includes associated paper 23477). SPE Drill. Eng. 1991, 6, 37–43. [Google Scholar] [CrossRef]
  16. Wolterbeek, T.K.T.; Cornelissen, E.K.; Hangx, S.J.T.; Spiers, C.J. Impact of downhole pressure and fluid-access on the effectiveness of wellbore cement expansion additives. Cem. Concr. Res. 2021, 147, 106514. [Google Scholar] [CrossRef]
  17. Agofack, N.; Ghabezloo, S.; Sulem, J.; Garnier, A.; Urbanczyk, C. Experimental investigation of the early-age mechanical behaviour of oil-well cement paste. Cem. Concr. Res. 2019, 117, 91–102. [Google Scholar] [CrossRef]
  18. Meng, M.; Frash, L.P.; Carey, J.W.; Li, W.; Welch, N.J.; Zhang, W. Cement stress and microstructure evolution during curing in semi-rigid high-pressure environments. Cem. Concr. Res. 2021, 149, 106555. [Google Scholar] [CrossRef]
  19. Orlic, B. Some geomechanical aspects of geological CO2 sequestration. KSCE J. Civ. Eng. 2009, 13, 225–232. [Google Scholar] [CrossRef]
  20. Lecampion, B.; Bunger, A.; Kear, J.; Quesada, D. Interface debonding driven by fluid injection in a cased and cemented wellbore: Modeling and experiments. Int. J. Greenh. Gas Control 2013, 18, 208–223. [Google Scholar] [CrossRef]
  21. Wolterbeek, T.K.T.; Hangx, S.J.T.; Spiers, C.J. Effect of CO2-induced reactions on the mechanical behaviour of fractured wellbore cement. Geomech. Energy Environ. 2016, 7, 26–46. [Google Scholar] [CrossRef]
  22. De Andrade, J.; Sangesland, S.; Todorovic, J.; Vrålstad, T. Cement Sheath Integrity during Thermal Cycling: A Novel Approach for Experimental Tests of Cement Systems. In Proceedings of the SPE bergen one day seminar; Society of Petroleum Engineers, Bergen, Norway, 22 April 2015. [Google Scholar]
  23. Heathman, J.F.; Beck, F.E. Finite Element Analysis Couples Casing and Cement Designs for HTHP Wells in East Texas. In Proceedings of the IADC/SPE Drilling Conference; Society of Petroleum Engineers, Miami, FL, USA, 21–23 February 2006. [Google Scholar]
  24. Goodwin, K.J.; Crook, R.J. Cement sheath stress failure. SPE Drill. Eng. 1992, 7, 291–296. [Google Scholar] [CrossRef]
  25. Torsæter, M.; Todorovic, J.; Lavrov, A. Structure and debonding at cement–steel and cement–rock interfaces: Effect of geometry and materials. Constr. Build. Mater. 2015, 96, 164–171. [Google Scholar] [CrossRef]
  26. Dou, H.; Dong, X.; Duan, Z.; Ma, Y.; Gao, D. Cement Integrity Loss due to Interfacial Debonding and Radial Cracking during CO2 Injection. Energies 2020, 13, 4589. [Google Scholar] [CrossRef]
  27. Nelson, E.B.; Guillot, D. (Eds.) Well Cementing, 2nd ed.; Schlumberger: Sugar Land, TX, USA, 2006; ISBN 978-097885300-6. [Google Scholar]
  28. Lackey, G.; Rajaram, H. Modeling gas migration, sustained casing pressure, and surface casing vent flow in onshore oil and gas wells. Water Resour. Res. 2019, 55, 298–323. [Google Scholar] [CrossRef] [Green Version]
  29. Natural Resources Canada. Technology Roadmap to Improve Wellbore Integrity: Summary Report; Natural Resources Canada: Ottawa, ON, Canada, 2019; ISBN 978-0-660-29598-5.
  30. Ingraffea, A.R.; Wells, M.T.; Santoro, R.L.; Shonkoff, S.B.C. Assessment and risk analysis of casing and cement impairment in oil and gas wells in Pennsylvania, 2000–2012. Proc. Natl. Acad. Sci. USA 2014, 111, 10955–10960. [Google Scholar] [CrossRef] [Green Version]
  31. Brufatto, C.; Cochran, J.; Conn, L.; Power, D.; El-Zeghaty, S.Z.A.A.; Fraboulet, B.; Griffin, T.; James, S.; Munk, T.; Justus, F. From mud to cement—Building gas wells. Oilf. Rev. 2003, 15, 62–76. [Google Scholar]
  32. Davies, R.J.; Almond, S.; Ward, R.S.; Jackson, R.B.; Adams, C.; Worrall, F.; Herringshaw, L.G.; Gluyas, J.G.; Whitehead, M.A. Oil and gas wells and their integrity: Implications for shale and unconventional resource exploitation. Mar. Pet. Geol. 2014, 56, 239–254. [Google Scholar] [CrossRef] [Green Version]
  33. Slater, H.J. The Recommended Practice for Surface Casing Vent Flow and Gas Migration Intervention. In Proceedings of the SPE Annual Technical Conference and Exhibition; Society of Petroleum Engineers, Florence, Italy, 20–22 September 2010. [Google Scholar]
  34. Toor, I.A. Problems in Squeeze Cementing. In Proceedings of the Middle East Oil Technical Conference and Exhibition; Society of Petroleum Engineers, Manama, Bahrain, 14–17 March 1983. [Google Scholar]
  35. Fuller, G.A.; Mercado, S.; Mead, C. Engineered Solutions to Address Deepwater Remedial Cementing Challenges. In Proceedings of the IADC/SPE Drilling Conference and Exhibition; Society of Petroleum Engineers, Fort Worth, TX, USA, 1–3 March 2016. [Google Scholar]
  36. Cowan, M. Field Study Results Improve Squeeze Cementing Success. In Proceedings of the Production and Operations Symposium, Oklahoma City, OK, USA, 31 March–3 April 2007; Society of Petroleum Engineers: Richardson, TX, USA, 2007. [Google Scholar]
  37. Saponja, J. Surface casing vent flow and gas migration remedial elimination-new technique proves economic and highly successful. J. Can. Pet. Technol. 1999, 38, PETSOC-99-13-06. [Google Scholar] [CrossRef]
  38. Wojtanowicz, A.K.; Nishikawa, S.; Rong, X. Diagnosis and Remediation of Sustained Casing Pressure in Wells, Final Report Submitted to the US Department of Interior, Minerals Management Service; Louisiana State University: Baton Rouge, LA, USA, 2001. [Google Scholar]
  39. Winarga, K.; Dewanto, C.W. Surfactant Treatment Has Amazingly Improved Squeeze Cementing Result. In Proceedings of the Nigeria Annual International Conference and Exhibition; Society of Petroleum Engineers, Calabar, Nigeria, 31 July–7 August 2010. [Google Scholar]
  40. Clarke, W.J.; McNally, A.C. Ultrafine Cement for Oilwell Cementing. In Proceedings of the Low Permeability Reservoirs Symposium, Denver, CO, USA, 26–28 April 1993. [Google Scholar]
  41. Moghadam, A.; Castelein, K.; ter Heege, J.; Orlic, B. A study on the hydraulic aperture of microannuli at the casing–cement interface using a large-scale laboratory setup. Geomech. Energy Environ. 2021, 100269, 100269. [Google Scholar] [CrossRef]
  42. Al-Houti, N.; Al-Othman, M.; Al-Qassar, K.; Al-Ebrahim, A.; Matar, K.; Al Hamad, A. An Alternative Method for Cement Squeeze in North Kuwait: Case Study. In Proceedings of the SPE/ICoTA Coiled Tubing and Well Intervention Conference and Exhibition, Houston, TX, USA, 21–22 March 2017. [Google Scholar]
  43. Sanders, G.S.; Chambers, M.J.; Lane, R.H. Successful Gas Shutoff with Polymer Gel Using Temperature Modeling and Selective Placement in the Prudhoe Bay Field. In Proceedings of the SPE Annual Technical Conference and Exhibition, New Orleans, LO, USA, 25–28 September 1994. [Google Scholar]
  44. Todorovic, J.; Raphaug, M.; Lindeberg, E.; Vrålstad, T.; Buddensiek, M.-L. Remediation of Leakage through Annular Cement Using a Polymer Resin: A Laboratory Study. Energy Procedia 2016, 86, 442–449. [Google Scholar] [CrossRef] [Green Version]
  45. Genedy, M.; Kandil, U.F.; Matteo, E.N.; Stormont, J.; Taha, M.M.R. A new polymer nanocomposite repair material for restoring wellbore seal integrity. Int. J. Greenh. Gas Control 2017, 58, 290–298. [Google Scholar] [CrossRef] [Green Version]
  46. Beharie, C.; Francis, S.; Øvestad, K.H. Resin: An Alternative Barrier Solution Material. In Proceedings of the SPE Bergen One Day Seminar, Bergen, Norway, 22 April 2015. [Google Scholar]
  47. Wasch, L.J.; Wollenweber, J.; Tambach, T.J. Intentional salt clogging: A novel concept for long-term CO2 sealing. Greenh. Gases Sci. Technol. 2013, 3, 491–502. [Google Scholar] [CrossRef]
  48. Wolterbeek, T.K.T.; Peach, C.J.; Raoof, A.; Spiers, C.J. Reactive transport of CO2-rich fluids in simulated wellbore interfaces: Flow-through experiments on the 1–6 m length scale. Int. J. Greenh. Gas Control 2016, 54, 96–116. [Google Scholar] [CrossRef]
  49. Chavez Panduro, E.A.; Torsæter, M.; Gawel, K.; Bjørge, R.; Gibaud, A.; Yang, Y.; Bruns, S.; Zheng, Y.; Sørensen, H.O.; Breiby, D.W. In-Situ X-ray Tomography Study of Cement Exposed to CO2 Saturated Brine. Environ. Sci. Technol. 2017, 51, 9344–9351. [Google Scholar] [CrossRef]
  50. Wasch, L.; Koenen, M. Injection of a CO2-Reactive Solution for Wellbore Annulus Leakage Remediation. Minerals 2019, 9, 645. [Google Scholar] [CrossRef] [Green Version]
  51. Carey, J.W. Geochemistry of wellbore integrity in CO2 sequestration: Portland cement-steel-brine-CO2 interactions. Rev. Mineral. Geochem. 2013, 77, 505–539. [Google Scholar] [CrossRef]
  52. Cao, P.; Karpyn, Z.T.; Li, L. Self-healing of cement fractures under dynamic flow of CO2-rich brine. Water Resour. Res. 2015, 51, 4684–4701. [Google Scholar] [CrossRef]
  53. Vecchia, F.D.; Santos, V.H.J.M.; Schütz, M.K.; Ponzi, G.G.D.; Stepanha, A.S.d.e.; Malfatti, C.d.; da Costa, E.M. Wellbore integrity in a saline aquifer: Experimental steel-cement interface degradation under supercritical CO2 conditions representative of Brazil’s Parana basin. Int. J. Greenh. Gas Control 2020, 98, 103077. [Google Scholar] [CrossRef]
  54. Abdoulghafour, H.; Luquot, L.; Gouze, P. Characterization of the mechanisms controlling the permeability changes of fractured cements flowed through by CO2-rich brine. Environ. Sci. Technol. 2013, 47, 10332–10338. [Google Scholar] [CrossRef]
  55. Luquot, L.; Abdoulghafour, H.; Gouze, P. Hydro-dynamically controlled alteration of fractured Portland cements flowed by CO2-rich brine. Int. J. Greenh. Gas Control 2013, 16, 167–179. [Google Scholar] [CrossRef]
  56. Newell, D.L.; Carey, J.W. Experimental evaluation of wellbore integrity along the cement-rock boundary. Environ. Sci. Technol. 2012, 47, 276–282. [Google Scholar] [CrossRef] [PubMed]
  57. Wolterbeek, T.K.T.; Peach, C.J.; Spiers, C.J. Reaction and transport in wellbore interfaces under CO2 storage conditions: Experiments simulating debonded cement–casing interfaces. Int. J. Greenh. Gas Control 2013, 19, 519–529. [Google Scholar] [CrossRef]
  58. Jung, H.B.; Kabilan, S.; Carson, J.P.; Kuprat, A.P.; Um, W.; Martin, P.; Dahl, M.; Kafentzis, T.; Varga, T.; Stephens, S.; et al. Wellbore cement fracture evolution at the cement–basalt caprock interface during geologic carbon sequestration. Appl. Geochem. 2014, 47, 1–16. [Google Scholar] [CrossRef]
  59. Bachu, S.; Bennion, D.B. Experimental assessment of brine and/or CO2 leakage through well cements at reservoir conditions. Int. J. Greenh. Gas Control 2009, 3, 494–501. [Google Scholar] [CrossRef]
  60. Wolterbeek, T.K.T.; Ruckert, F.; van Moorsel, S.G.; Cornelissen, E.K. Reactive transport and permeability evolution in wellbore defects exposed to periodic pulses of CO2-rich water. Int. J. Greenh. Gas Control 2019, 91, 102835. [Google Scholar] [CrossRef]
  61. Nguyen, P.; Guthrie, G.D., Jr.; Carey, J.W. Experimental validation of self-sealing in wellbore cement fractures exposed to high-pressure, CO2-saturated solutions. Int. J. Greenh. Gas Control 2020, 100, 103112. [Google Scholar] [CrossRef]
  62. Mason, H.E.; Du Frane, W.L.; Walsh, S.D.C.; Dai, Z.; Charnvanichborikarn, S.; Carroll, S.A. Chemical and mechanical properties of wellbore cement altered by CO2-rich brine using a multianalytical approach. Environ. Sci. Technol. 2013, 47, 1745–1752. [Google Scholar] [CrossRef]
  63. Barlet-Gouédard, V.; Rimmele, G.; Porcherie, O.; Quisel, N.; Desroches, J. A solution against well cement degradation under CO2 geological storage environment. Int. J. Greenh. Gas Control 2009, 3, 206–216. [Google Scholar] [CrossRef]
  64. Jahanbakhsh, A.; Liu, Q.; Hadi Mosleh, M.; Agrawal, H.; Farooqui, N.M.; Buckman, J.; Recasens, M.; Maroto-Valer, M.; Korre, A.; Durucan, S. An Investigation into CO2–Brine–Cement–Reservoir Rock Interactions for Wellbore Integrity in CO2 Geological Storage. Energies 2021, 14, 5033. [Google Scholar] [CrossRef]
  65. Cao, P.; Karpyn, Z.T.; Li, L. Dynamic alterations in wellbore cement integrity due to geochemical reactions in CO2-rich environments. Water Resour. Res. 2013, 49, 4465–4475. [Google Scholar] [CrossRef]
  66. Brunet, J.-P.L.; Li, L.; Karpyn, Z.T.; Huerta, N.J. Fracture opening or self-sealing: Critical residence time as a unifying parameter for cement–CO2–brine interactions. Int. J. Greenh. Gas Control 2016, 47, 25–37. [Google Scholar] [CrossRef] [Green Version]
  67. Iyer, J.; Walsh, S.D.C.; Hao, Y.; Carroll, S.A. Incorporating reaction-rate dependence in reaction-front models of wellbore-cement/carbonated-brine systems. Int. J. Greenh. Gas Control 2017, 59, 160–171. [Google Scholar] [CrossRef]
  68. Wolterbeek, T.K.T.; Raoof, A. Meter-Scale Reactive Transport Modeling of CO2-Rich Fluid Flow along Debonded Wellbore Casing-Cement Interfaces. Environ. Sci. Technol. 2018, 52, 3786–3795. [Google Scholar] [CrossRef] [PubMed] [Green Version]
  69. Guthrie, G.D.; Pawar, R.J.; Carey, J.W.; Karra, S.; Harp, D.R.; Viswanathan, H.S. The mechanisms, dynamics, and implications of self-sealing and CO2 resistance in wellbore cements. Int. J. Greenh. Gas Control 2018, 75, 162–179. [Google Scholar] [CrossRef]
  70. Duan, Z.; Sun, R.; Zhu, C.; Chou, I. An improved model for the calculation of CO2 solubility in aqueous solutions containing Na+, K+, Ca2+, Mg2+, Cl, and SO42−. Mar. Chem. 2006, 98, 131–139. [Google Scholar] [CrossRef]
  71. Haynes, W.M. CRC Handbook of Chemistry and Physics; CRC Press: Boca Raton, FL, USA, 2014; ISBN 1482208687. [Google Scholar]
  72. Garba, M.D.; Petitt, I.; MacPhee, D.E. Sodium Silicate Cement Squeeze Best Practice. In Proceedings of the SPE Nigeria Annual International Conference and Exhibition, Victoria Island, Lagos, 5–7 August 2014. [Google Scholar]
  73. Giannaros, P.; Kanellopoulos, A.; Al-Tabbaa, A. Sealing of cracks in cement using microencapsulated sodium silicate. Smart Mater. Struct. 2016, 25, 84005. [Google Scholar] [CrossRef]
  74. Dimas, D.; Giannopoulou, I.; Panias, D. Polymerization in sodium silicate solutions: A fundamental process in geopolymerization technology. J. Mater. Sci. 2009, 44, 3719–3730. [Google Scholar] [CrossRef]
  75. ISO 10426-2 Petroleum and Natural Gas Industries—Cements and Materials for Well Cementing—Part. 2: Testing of Well Cements (ANSI/API Recommended Practice 10B-2); International Organization for Standardization: Geneva, Switzerland, 2005.
  76. Sigma-Aldrich Product No. 338443 (Reagent Grade Sodium Silicate Solution). Available online: https://www.sigmaaldrich.com/catalog/product/sigald/338443 (accessed on 4 April 2020).
  77. Energy Safety Canada. Wellbore Remediation; An. Industry Recommended Practice (IRP) for the Canadian Oil and Gas. Industry; Energy Safety Canada: Calgary, AB, Canada, 2020. [Google Scholar]
  78. Guéguen, Y.; Palciauskas, V. Introduction to the Physics of Rocks; Princeton University Press: Princeton, NJ, USA, 1994; ISBN 0691034524. [Google Scholar]
  79. Wolterbeek, T.K.T.; Hangx, S.J.T. Supporting Data Set for Manuscript “Remediation of Annular Gas. Migration Along Cemented Wellbores Using Reactive Mineral. Fluids: Experimental Assessment of Sodium Bicarbonate And Sodium Silicate-Based Solutions”; Yoda Data Repository, Utrecht University: Utrecht, The Netherlands, 2021; Available online: https://public.yoda.uu.nl/UU01/K3B1IB.html (accessed on 30 July 2021). [CrossRef]
  80. Fleury, M.; Deschamps, H. Electrical conductivity and viscosity of aqueous NaCl solutions with dissolved CO2. J. Chem. Eng. Data 2008, 53, 2505–2509. [Google Scholar] [CrossRef]
  81. Islam, A.W.; Carlson, E.S. Viscosity models and effects of dissolved CO2. Energy Fuels 2012, 26, 5330–5336. [Google Scholar] [CrossRef]
  82. Mao, S.; Duan, Z. The Viscosity of Aqueous Alkali-Chloride Solutions up to 623 K, 1000 bar, and High Ionic Strength. Int. J. Thermophys. 2009, 30, 1510–1523. [Google Scholar] [CrossRef]
  83. Yang, X.; Zhu, W.; Yang, Q. The viscosity properties of sodium silicate solutions. J. Solut. Chem. 2008, 37, 73–83. [Google Scholar] [CrossRef]
  84. Bird, R.B.; Stewart, W.E.; Lightfoot, E.N. Transport. Phenomena, 2nd ed.; John Wiley & Sons, Inc.: Hoboken, NJ, USA, 2002. [Google Scholar]
  85. Montgomery, C.T. Implications of cementing for well production and performance. In Well Cementing; Nelson, E.B., Guillot, D., Eds.; Schlumberger: Sugar Land, TX, USA, 2006; p. 773. ISBN 978-097885300-6. [Google Scholar]
  86. Taylor, H.F.W. Cement Chemistry; Academic Press Limited: London, UK, 1992; ISBN 0-12-683900-X. [Google Scholar]
  87. Engkvist, I.; Albinsson, Y.; Johansson Engkvist, W. The Long-Term Stability of Cement: Leaching Tests; Swedish Nuclear Fuel and Waste Management Co.: Stockholm, Sweden, 1996. [Google Scholar]
  88. Huerta, N.J.; Hesse, M.A.; Bryant, S.L.; Strazisar, B.R.; Lopano, C. Reactive transport of CO2-saturated water in a cement fracture: Application to wellbore leakage during geologic CO2 storage. Int. J. Greenh. Gas Control 2016, 44, 276–289. [Google Scholar] [CrossRef] [Green Version]
  89. Choi, Y.-S.; Young, D.; Nešić, S.; Gray, L.G.S. Wellbore integrity and corrosion of carbon steel in CO2 geologic storage environments: A literature review. Int. J. Greenh. Gas Control 2013, 16, S70–S77. [Google Scholar] [CrossRef]
  90. Steiger, M. Crystal growth in porous materials—I: The crystallization pressure of large crystals. J. Cryst. Growth 2005, 282, 455–469. [Google Scholar] [CrossRef]
  91. Kutchko, B.G.; Strazisar, B.R.; Dzombak, D.A.; Lowry, G.V.; Thaulow, N. Degradation of well cement by CO2 under geologic sequestration conditions. Environ. Sci. Technol. 2007, 41, 4787–4792. [Google Scholar] [CrossRef] [PubMed]
  92. Liteanu, E.; Spiers, C.J. Fracture healing and transport properties of wellbore cement in the presence of supercritical CO2. Chem. Geol. 2011, 281, 195–210. [Google Scholar] [CrossRef]
  93. Duguid, A.; Radonjic, M.; Scherer, G.W. Degradation of cement at the reservoir/cement interface from exposure to carbonated brine. Int. J. Greenh. Gas Control 2011, 5, 1413–1428. [Google Scholar] [CrossRef]
  94. Duguid, A.; Radonjic, M.; Bruant, R.; Mandecki, T.; Scherer, G.; Celia, M. The Effect of CO2 Sequestration on Oil Well Cements. In Proceedings of the Greenhouse Gas Technologies Conference (GHGT–7), Vancouver, BC, Canada, 5–9 September 2004. [Google Scholar]
  95. Andersson, K.; Allard, B.; Bengtsson, M.; Magnusson, B. Chemical composition of cement pore solutions. Cem. Concr. Res. 1989, 19, 327–332. [Google Scholar] [CrossRef]
  96. Poyet, S.; Sellier, A.; Capra, B.; Foray, G.; Torrenti, J.-M.; Cognon, H.; Bourdarot, E. Chemical modelling of alkali silica reaction: Influence of the reactive aggregate size distribution. Mater. Struct. 2007, 40, 229–239. [Google Scholar] [CrossRef]
  97. Vollpracht, A.; Lothenbach, B.; Snellings, R.; Haufe, J. The pore solution of blended cements: A review. Mater. Struct. 2016, 49, 3341–3367. [Google Scholar] [CrossRef] [Green Version]
  98. Kouassi, S.S.; Tognonvi, M.T.; Soro, J.; Rossignol, S. Consolidation mechanism of materials obtained from sodium silicate solution and silica-based aggregates. J. Non-Cryst. Solids 2011, 357, 3013–3021. [Google Scholar] [CrossRef]
  99. Nasr-El-Din, H.A.; Taylor, K.C. Evaluation of sodium silicate/urea gels used for water shut-off treatments. J. Pet. Sci. Eng. 2005, 48, 141–160. [Google Scholar] [CrossRef]
  100. Knoblich, B.; Gerber, T. Aggregation in SiO2 sols from sodium silicate solutions. J. Non-Cryst. Solids 2001, 283, 109–113. [Google Scholar] [CrossRef]
  101. Parcevaux, P.A.; Sault, P.H. Cement Shrinkage and Elasticity: A New Approach for A Good Zonal Isolation. In Proceedings of the SPE Annual Technical Conference and Exhibition, Houston, TX, USA, 16–19 September 1984. [Google Scholar]
  102. Kawaguchi, T.; Hishikura, H.; Iura, J. Shrinkage behavior of silica gels during drying. J. Non-Cryst. Solids 1988, 100, 220–225. [Google Scholar] [CrossRef]
  103. Álvarez-Ayuso, E.; Nugteren, H.W. Synthesis of ettringite: A way to deal with the acid wastewaters of aluminium anodising industry. Water Res. 2005, 39, 65–72. [Google Scholar] [CrossRef] [PubMed]
  104. Silva, R.; Cadorin, L.; Rubio, J. Sulphate ions removal from an aqueous solution: I. Co-precipitation with hydrolysed aluminum-bearing salts. Miner. Eng. 2010, 23, 1220–1226. [Google Scholar] [CrossRef]
  105. Ronquim, F.M.; Cotrim, M.E.B.; Guilhen, S.N.; Bernardo, A.; Seckler, M.M. Improved barium removal and supersaturation depletion in wastewater by precipitation with excess sulfate. J. Water Process. Eng. 2018, 23, 265–276. [Google Scholar] [CrossRef]
  106. Dou, W.; Zhou, Z.; Jiang, L.-M.; Jiang, A.; Huang, R.; Tian, X.; Zhang, W.; Chen, D. Sulfate removal from wastewater using ettringite precipitation: Magnesium ion inhibition and process optimization. J. Environ. Manag. 2017, 196, 518–526. [Google Scholar] [CrossRef] [PubMed]
  107. Wolterbeek, T.K.T.; Cornelissen, E.K.; Nolan, S.; Todea, F.; Stam, W.; Roggeband, S.M.; Dam, L.; van Riet, E.J.; Ruckert, F.; Keultjes, W.J.G. Restoration of annular zonal isolation using localized casing expansion (LCE) technology: A proof of concept based on laboratory studies and field trial results. J. Pet. Sci. Eng. 2021, 197, 108103. [Google Scholar] [CrossRef]
  108. Green, C.; Evans, R.; Fry, B.; Wruck, W.S. New Technology Closes Micro-Annular Flow Paths in the Wellbore, Stopping Downhole Gas from Escaping to the Surface. In Proceedings of the SPE/AAPG/SEG Unconventional Resources Technology Conference, Houston, TX, USA, 26–28 July 2021. [Google Scholar]
Figure 1. Sample design and experimental setup; (a) schematic drawing of a cemented steel tube coil sample, where the top and bottom of the coil windings during cement curing are indicated. Note post-experimental cross-sections were obtained from these locations; (b) photograph of sample SIL-1 mounted inside the permeameter setup, (c) schematic illustration of the experimental permeameter setup, where PT denotes pressure transducer. See main text for detailed descriptions.
Energies 14 07507 g001
Figure 2. Results of initial, water-based flow measurements on sample BC-1; (a) flow rate (in blue) and applied pressure difference (in black) versus time, (b) flow rate versus applied pressure difference, showing a roughly linear dependence; the slope of a linear best fit line through these data has been used to calculate the initial equivalent permeability of the sample.
Energies 14 07507 g002
Figure 3. Equivalent Darcy permeability of sample BC-1 versus (a) elapsed time and (b) injected fluid volume. Run time and volume are shifted such that they equal zero at the moment when injection of sodium bicarbonate solution was started (water-based reference results are thus plotted on negative domains of the x-axes).
Energies 14 07507 g003
Figure 4. Results of initial, water-based flow measurements on sample SIL-1; (a) flow rate (in blue) and applied pressure difference (in black) versus time, (b) flow rate versus applied pressure difference, showing a linear dependence confirming laminar flow; the slope of a least squares fit line through these data has been used to estimate the initial permeability of the cemented coil sample.
Energies 14 07507 g004
Figure 5. Reactive flow-through results for sample SIL-1. Equivalent Darcy permeability versus (a) elapsed time and (b) injected fluid volume. Run time and volume are shifted such that they equal zero at the moment when injection of sodium silicate solution was initiated (water-based reference results are thus plotted on the negative domains of the x-axes).
Energies 14 07507 g005
Figure 6. Photographs of cross-sections made through sample SIL-1 after completing the reactive flow-through experiment. Panels (al) show cross-sections obtained at progressively greater distances from the fluid inlet—the location of the origin, with respect to the coil windings. is indicated (see also Figure 1a); (m) example of an open micro-annulus, visible as a black line along the circumference of the cement; (n) example of a clogged up micro-annulus, visible as a white band along the circumference of the cement. Wall thickness of the steel tube = 1 mm, for scale.
Energies 14 07507 g006
Table 1. Overview of performed experiments and results.
PropertiesSample BC-1Sample SIL-1
steel   tube   length   ( L ) [m]66
steel   tube   inner   diameter   ( 2 R ) [mm]88
internal defect geometryinternal structure presumably similar to sample SIL-1micro-annulus plus short-ranged, crescent-shaped voids
sample   temperature   ( T ) [°C]5050
reactive flow experiment duration [h]91.3300
initial   pressure   difference   ( Δ P 0 ) [MPa]0.30.6
max .   pressure   difference   ( Δ P m a x ) [MPa]0.66.0
initial   stable   fluid   flux   ( Q 0 ) [mL h−1]1.613.2
total volume of reactive fluid injected [mL]13335
assumed   fluid   viscosity   1   ( μ ) [mPa s]0.550.55
initial   equivalent   permeability   1   ( κ e q u i v 0 ) [m2]3.8 × 10−138.3 × 10⁻¹³
lowest   equivalent   permeability   1   ( κ e q u i v m i n ) [m2]9.0 × 10⁻¹⁴in range of 10−17–10−19
initial   hydraulic   aperture   ( w ) [μm]17.322.1
initial   defect   void   volume   ( V v o i d ) [mL]2.63.3
1 Note the actual dynamic viscosity may have changed over the course of the experiments. However, the constant value listed here has been assumed for the equivalent (apparent) sample permeability calculations. See main text for discussion.
Publisher’s Note: MDPI stays neutral with regard to jurisdictional claims in published maps and institutional affiliations.

