Article

Visual Exploration of Energy Use in EU 28: Dynamics, Patterns, Policies

1
Laboratory of Operations Research, Department of Economics, School of Economics and Business, University of Thessaly, 38333 Volos, Greece
2
Department of Business Administration, School of Social Sciences, Hellenic Open University, 26335 Patras, Greece
*
Author to whom correspondence should be addressed.
Energies 2021, 14(22), 7532; https://doi.org/10.3390/en14227532
Submission received: 8 October 2021 / Revised: 29 October 2021 / Accepted: 5 November 2021 / Published: 11 November 2021
(This article belongs to the Section B: Energy and Environment)

Abstract

:
The paper places emphasis on primary energy resources, their covariation, and their correlation with socioeconomic factors and aims to provide a systematic analysis of their development over time. The analysis uses evidence from European Union (EU) country-level data and is based on visual analytics techniques. Different results from the same territories show that energy consumption does not always reflect or is due to climatological or meteorological conditions. Extensive use of visualization is adopted as a means of contributing to the understanding of energy use, some involved problems and concepts, and energy consumption trends over time. We present an approach that addresses the informatics challenges based on the integration of visualization software, data integration, and cluster analysis. Our cross-sectional energy review advocates that EU energy leaders are moving towards a low-carbon economy. The correlations of energy variables with economic and pollution effects are stronger in greater levels of energy use, which means that energy use has an obvious impact on economic growth and the environment. Visual and automated methods employed for the analysis, reveal the direction, the strength, and the nature of the dependence structure, in clusters covering the range of energy use in EU 28 countries.

1. Introduction

Energy use is an important part of everyday life and is necessary for the satisfaction of basic human needs, while it ensures socio-economic development and welfare and has been linked with the eradication of poverty and with higher living standards [1,2]. Sustainable energy use has become the most critical challenge of the world today. The relationship between the consumption of different energy resources and socioeconomic issues is an important topic in the regulatory and environmental literature.
The seventh Sustainable Development Goal (SDG) recognizes the importance of energy use and aims to “ensure access to affordable, reliable, sustainable and modern energy for all”. Even in 2019, 759 million people were lacking access to electricity and 75% of them lived in sub-Saharan Africa. The seventh SDG aims to ensure access to energy services for everyone by 2030, as well as to increase the share of renewables in the energy mix in the world [3].
The use of fossil fuels, which are still highly used in the world, is beneficial for the economy but has severe environmental costs, while the pollution from their burning has also an impact on human health [4]. Therefore, the transition to alternative sustainable energy sources to cover the world’s needs is significantly important, especially when facing the impacts of fossil fuels and global climate change [5]. The promotion of energy transition and the use of renewable energy sources will also lead to decoupling economic growth from the growth of carbon dioxide emissions [6].
This transition from fossil fuels will require the development of new ways of using energy to produce, live, and work [7]. The highest share of renewables will have to be combined with flexibility instruments, such as network capacity and storage [8]. In addition to the technological innovation, the transition will also require social innovation [9]. The COVID-19 pandemic has also raised new challenges and all the energy-related policies should be adapted in the new situation and circumstances [10].
The Intergovernmental Panel on Climate Change (IPCC) Reports highlight the fact that the lack of actions regarding the mitigation of climate change can have severe consequences for the economy and the society [11]. On the other hand, energy transition might also have a negative impact on society since it could lead to disparities in benefits and burdens distribution. Therefore, it is important to ensure that an equitable transition is taking place [12]. With the promotion of the appropriate policies, such a transition would not only lead to a high reduction of carbon dioxide emissions that are related to energy use but could also have a positive impact on global GDP and employment, and other welfare gains in general [13].
The use of fossil fuels has been proven to have many socio-economic benefits. Fossil fuels were a major factor of industrialization and are the main source of fuel for electricity in the world [14], while electricity is found to be an important driver of economic growth [15]. At the same time, a plethora of studies are linking the use of renewable energy sources with economic growth [16,17,18], but there is still the question of how much can renewables lead to an increase in economic growth, compared to non-renewable energy consumption. As Adams et al. [19] have found in their study for 30 sub-Saharan countries, if non-renewable energy consumption is increased by 10%, economic growth will increase by 2.11%, while if renewable energy consumption is increased by 10%, economic growth will increase by 0.27%.
In addition to the environmental and economic impact that the different energy sources have, the impact of energy on other socioeconomic issues should also be considered when discussing energy transition. Fossil fuels extraction might have several socioeconomic impacts, including the direct impacts on employment and income, the indirect impact on employment, migration, and services strain, while it could lead to demographic changes and changes to income distribution, new infrastructure, increases in housing values and costs as well as potential increased conflicts [20]. Renewable energy could have an impact on various social factors, including employment, health, infrastructure development, and public perceptions [21]. It has been found that some of the social benefits that come with the use of renewables include energy supply security, new job positions, and new income sources, improvements in education and health, technological advances, and benefits for rural areas. On the other hand, impacts on the landscape, impacts on the cultural heritage, and potential smell, noise, or even displacement are some of the negative impacts that might come with the use of renewables [22].
Sustainable energy use has become the most critical challenge of the world today. The relationship between the consumption of different energy resources and socioeconomic issues is an important topic in the regulatory and environmental literature. Emphasis may be given on primary energy resources, their covariation, and their correlation with socioeconomic factors.
The aim of this paper is to present the existing situation in Europe, the dynamics, patterns, policies of the EU-28 countries. This work is a data-driven research approach, with self-explanatory outcomes. A data-driven approach ensures that solutions and plans are supported by sets of factual information. It permits to make strategic decisions based on data analysis and interpretation. Similar existing research (indicatively [23,24,25,26,27]) that employs econometric modelling contains the risk of making false assumptions and being swayed by biased opinions. A certain extend of bias in the results is always present in such cases.
A key hallmark of this research is the clustering by every energy variable. Clustering and the empirical evidence we take per cluster, proves that each cluster of countries has to be tackled differently.
The official information for Energy Consumption and Energy Efficiency trends in the EU-28, 2000–2018, is publicly reported by the European Commission [28], International Energy Agency [29], in aggregated results (sum of annual data from each Member State). Eurostat also provides aggregated (global) energy statistics by source (fuel) (https://ec.europa.eu/eurostat/statistics-explained/index.php?title=Energy_statistics_-_an_overview, accessed on 9 November 2021). Other related work focuses on selected EU countries [30].
In the sections that follow, visual exploration includes plotting energy variables with layering information on graphics (concerning geographical zones, GDP levels faceting grouped data, selected energy-use clusters) to produce effective comparative plots. We produce visual summaries of data on graphs such as bubble charts, motion charts, and boxplots, and we visualize confidence intervals for means of energy use; we create maps and correlation matrices. The goal is to develop a global, national, and regional view of energy use and its impacts in the European region supported by processing, interpretation, integration, and visualization of time-critical data.
Different results from the same territories show that energy consumption does not always reflect or is due to climatological or meteorological conditions. For the analysis, countries are grouped in clusters to examine energy use in a general context and avoid the bias caused by the country-level circumstances.
We employ visual analytics [31] to capture the leading trends, patterns, policies of energy use in EU-28. The critical impact of visualization techniques on analytical reasoning has been analyzed among others by Kielman et al. [32], Keim et al. [33], Yao et al. [34].
In the visual data exploration that follows, box plots are utilized to determine the energy data distributions and the outliers in each cluster of countries. The outliers are determined using the following rule: the outliers are the values 1.5 times greater than the difference between the third percentile and the first percentile. The box plots for clusters of countries according to the energy use/consumption classification show the differentiation between clusters. It is also a way to pinpoint the extreme values of energy consumption on the graph.
In this direction, a circle packing graphic is created with countries being represented by circles. The area of each circle is proportional to the value of the selected energy variable. The variables under study are energy use per capita, fossil fuel consumption per capita, renewable energy per capita.
A motion chart is a dynamic bubble chart that allows efficient and interactive exploration and visualization of longitudinal multivariate data. Here, with dynamic bubble charts, four dimensions are represented simultaneously (namely CO2 emissions, energy variables per capita, time, and in color, GDP per capita).
To highlight the relationship between the values observed of X (variable expressing the energy consumption: total, fossil fuel, renewables) and Y (CO2 emissions per capita, GDP per capita) we plot X versus Y on a Cartesian graph detecting for each one of the four clusters evidence about the form of the function g connecting the variables. Next, we provide a graphical display of the correlation matrix to illustrate the linear associations of the energy variables with pollution and social variables.
This article is structured into five sections, including this introduction. In Section 2 the methodological approach and the empirical implementation are given. Section 3 presents the EU 28 policies considered based on the relationship among energy consumption, CO2 pollution, economic growth, and time. Section 4 reports the software infrastructure employed in the visual analysis. Finally, the last section concludes the analyses.

2. Materials and Methods

2.1. Data Acquisition and Regional Overview

We gathered information involving 19 years to investigate the dynamics of the consumption of different energy resources in EU 28 and their association with CO2 pollution and economic growth. We base our conclusions on the analysis of a balanced panel dataset consisting of 28 European countries from 2000 to 2018. It is important to note that the countries in our study belong to four geographical regions (defined by the United Nations Geoscheme, see below), which guarantees a high level of variation in the national contexts that we consider.
Data were obtained from the World Bank database (Data include valid measurements of direct and sustainable energy use per country and geographical region, according to the geographical clustering proposed by the UN. Specifically, we deal with collections of time series on annual energy use per capita (measured in kg of oil equivalent per capita) [35], annual fossil fuel energy consumption (% of total) [36], and annual renewable energy consumption (% of total final energy consumption) [37]. Pollution data involve annual CO2 emissions (measured in metric tons per capita) [38] and social data concern gross domestic product per capita (in current US$) [39] and population density (people per sq. km of land area) [40] for the same period. Time series for fossil fuel consumption per capita (resp. renewable energy consumption per capita) was calculated by multiplying annual energy use per capita by the percentage of fossil fuel energy consumption (resp. the percentage of renewable energy consumption) and dividing by 100.
The UN Statistics Division has created the UN Geoscheme for Europe that subdivides the continent into four divisions for statistical convenience. These divisions put European countries in one of four groups: Eastern Europe, Western Europe, Northern, and Southern Europe. The UN Geoscheme (https://en.wikipedia.org/wiki/United_Nations_geoscheme_for_Europe, accessed on 9 November 2021, https://www.worldatlas.com/articles/the-four-european-regions-as-defined-by-the-united-nations-geoscheme-for-europe.html, accessed on 9 November 2021) specifies the countries included in each of these divisions. Although one could assume that regional circumstances strongly modulate the development of energy use attitudes, no similarities or uniformity within geographical regions is observed. According to the UN, Eastern Europe is the largest and most populous subregion of Europe. However, no energy use differentiation is observed between the geographical regions (see Figure 1a–c). For that reason, all the analyses that follow consider countries’ classification based on cluster analysis as described in Section 2.2.

2.2. Visualization Tools

The framework for building data-driven decision models consists of the following visualization software.
Graphs to summarize and organize data with Figures 1 and 3 were created in the open-source data visualization framework RawGraphs [41] and Figures 4 and 5 in IBM SPSS [42].
Dynamic charts to explore the relation of energy consumption variables vs. CO2 pollution (Figures 6a–c, 7a–c and 8a–c) were realized in the free offline tool Gapminder [43]. Correlation analysis (Figures 9–11) was conducted with R packages “Hmisc” [44] and “corrplot” ([45]) in statistical programming language R [46]. Trend analysis (Figures 6d, 7d, 8d and 12–14) was conducted in Tableau (v. 2021.2.1) [47]. Through Tableau Academic Programs, free Tableau Desktop licenses [48] are provided to instructors and university students all over the world.

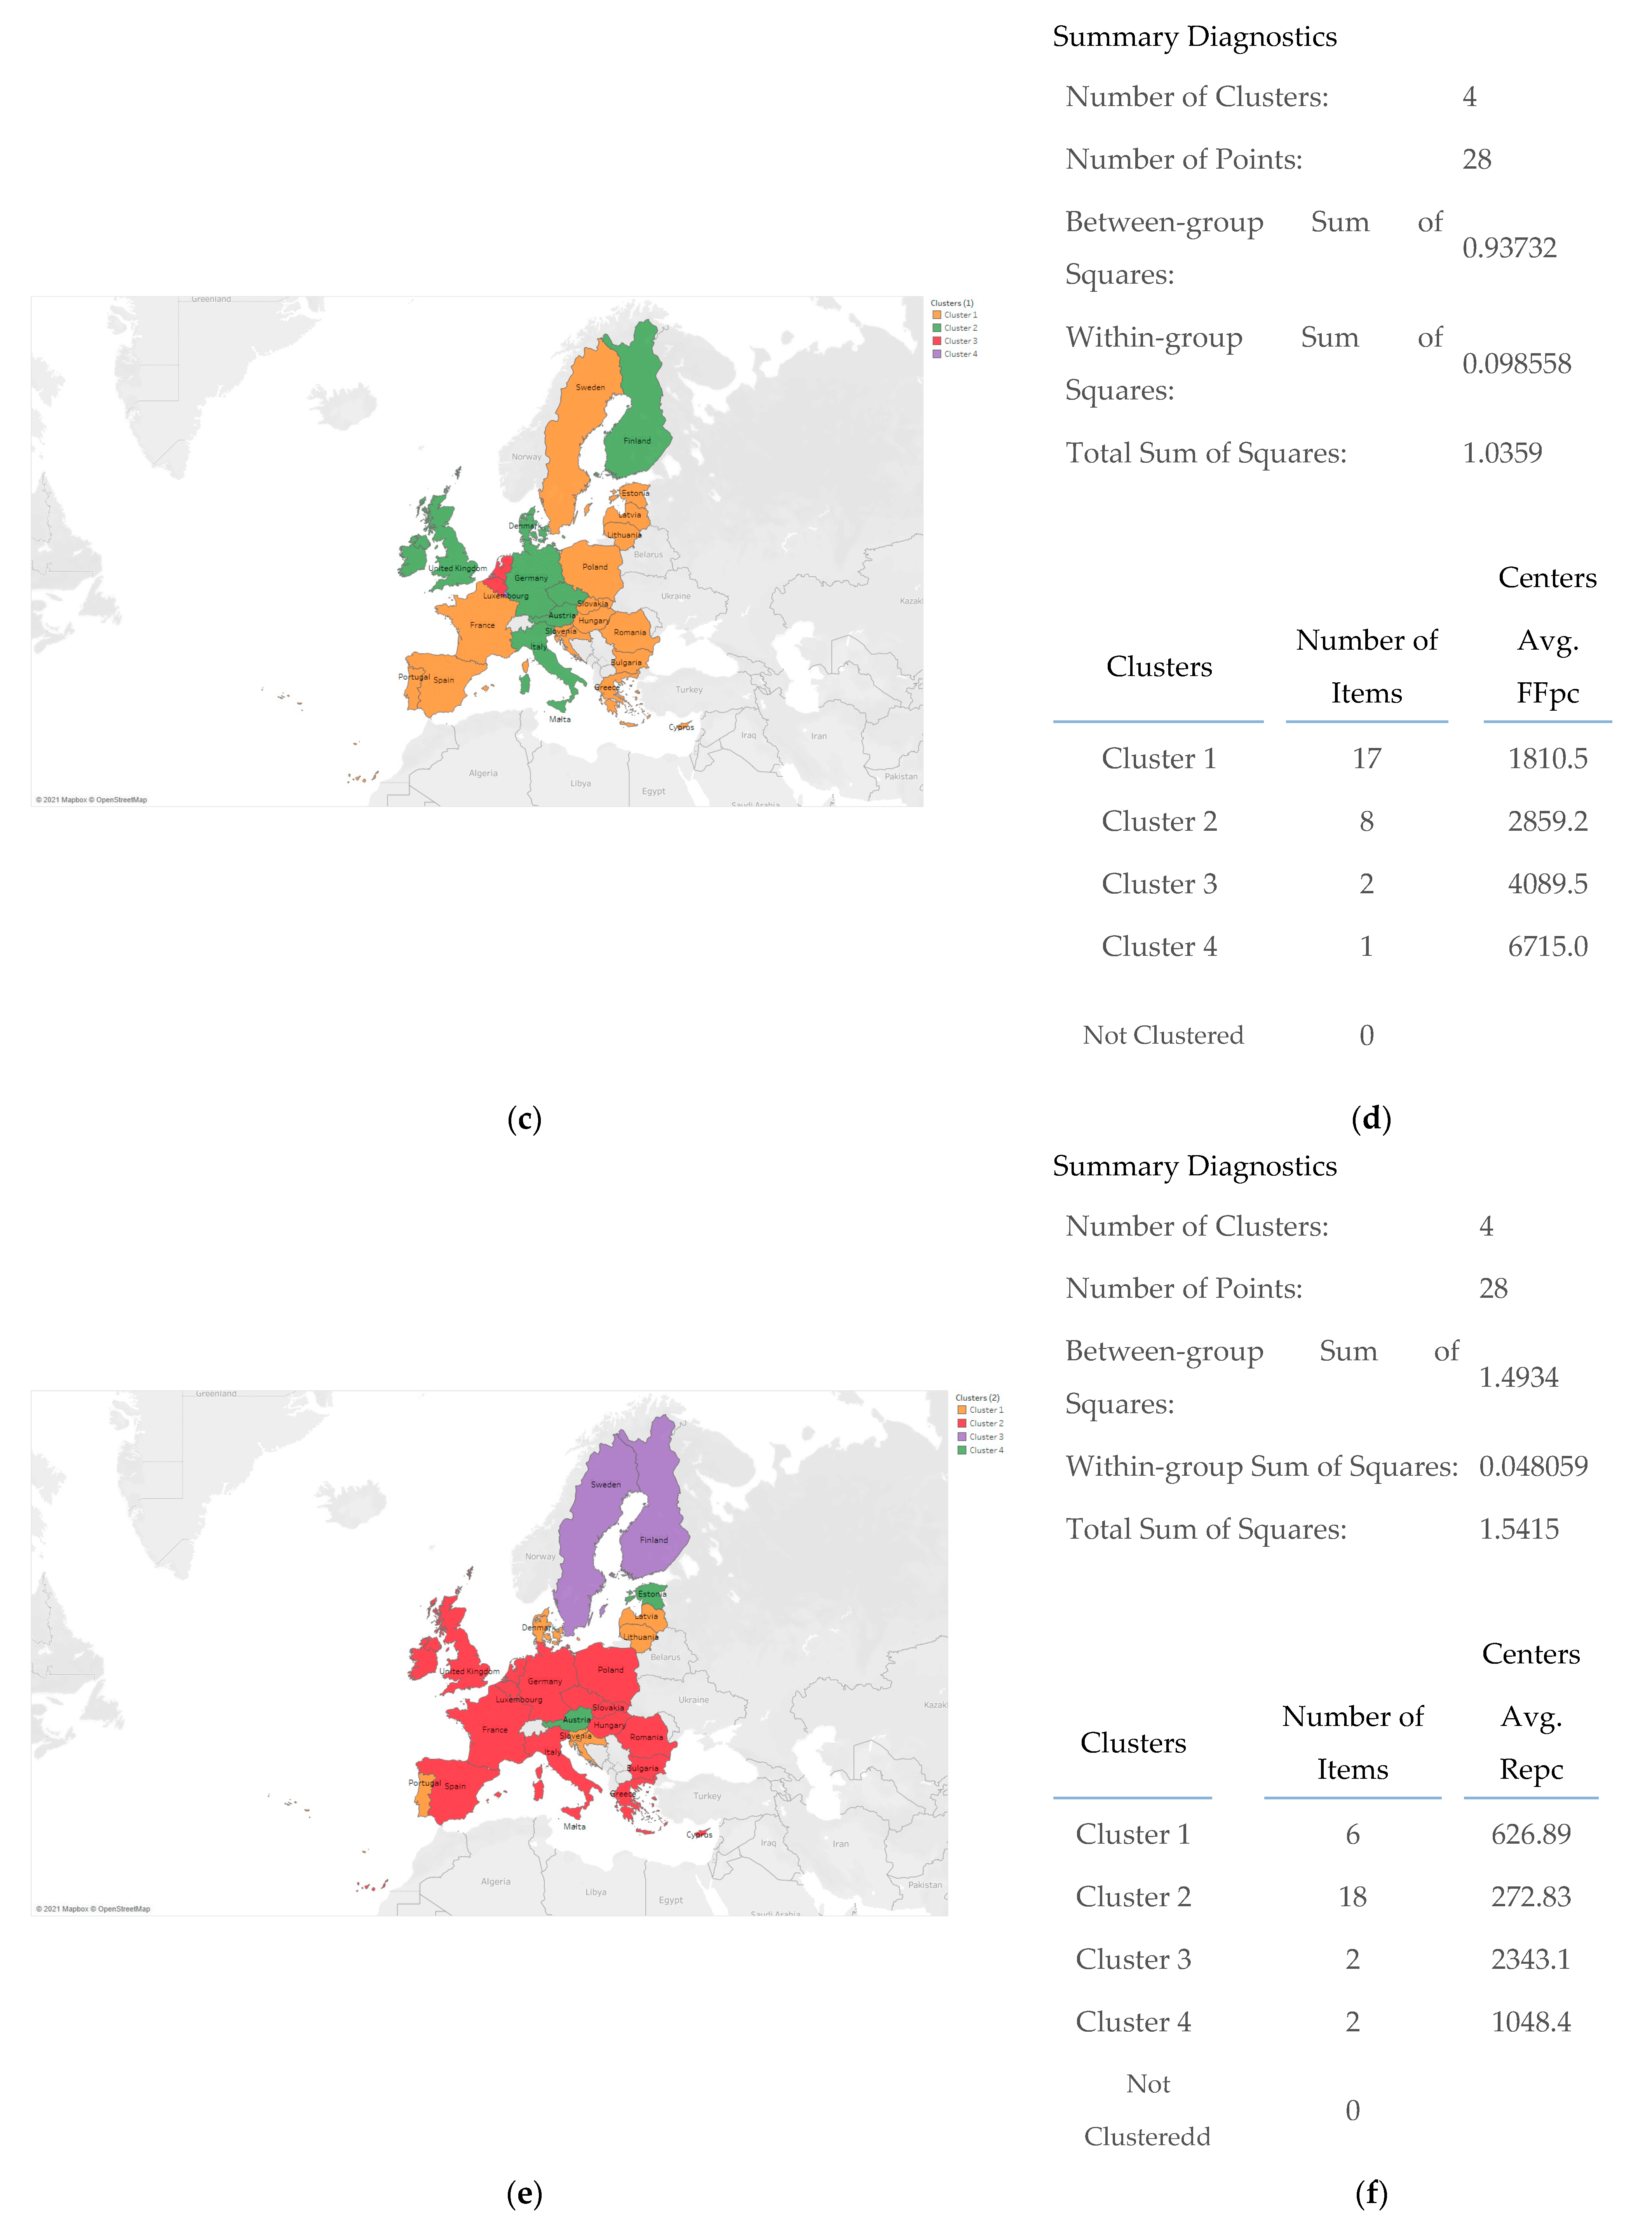
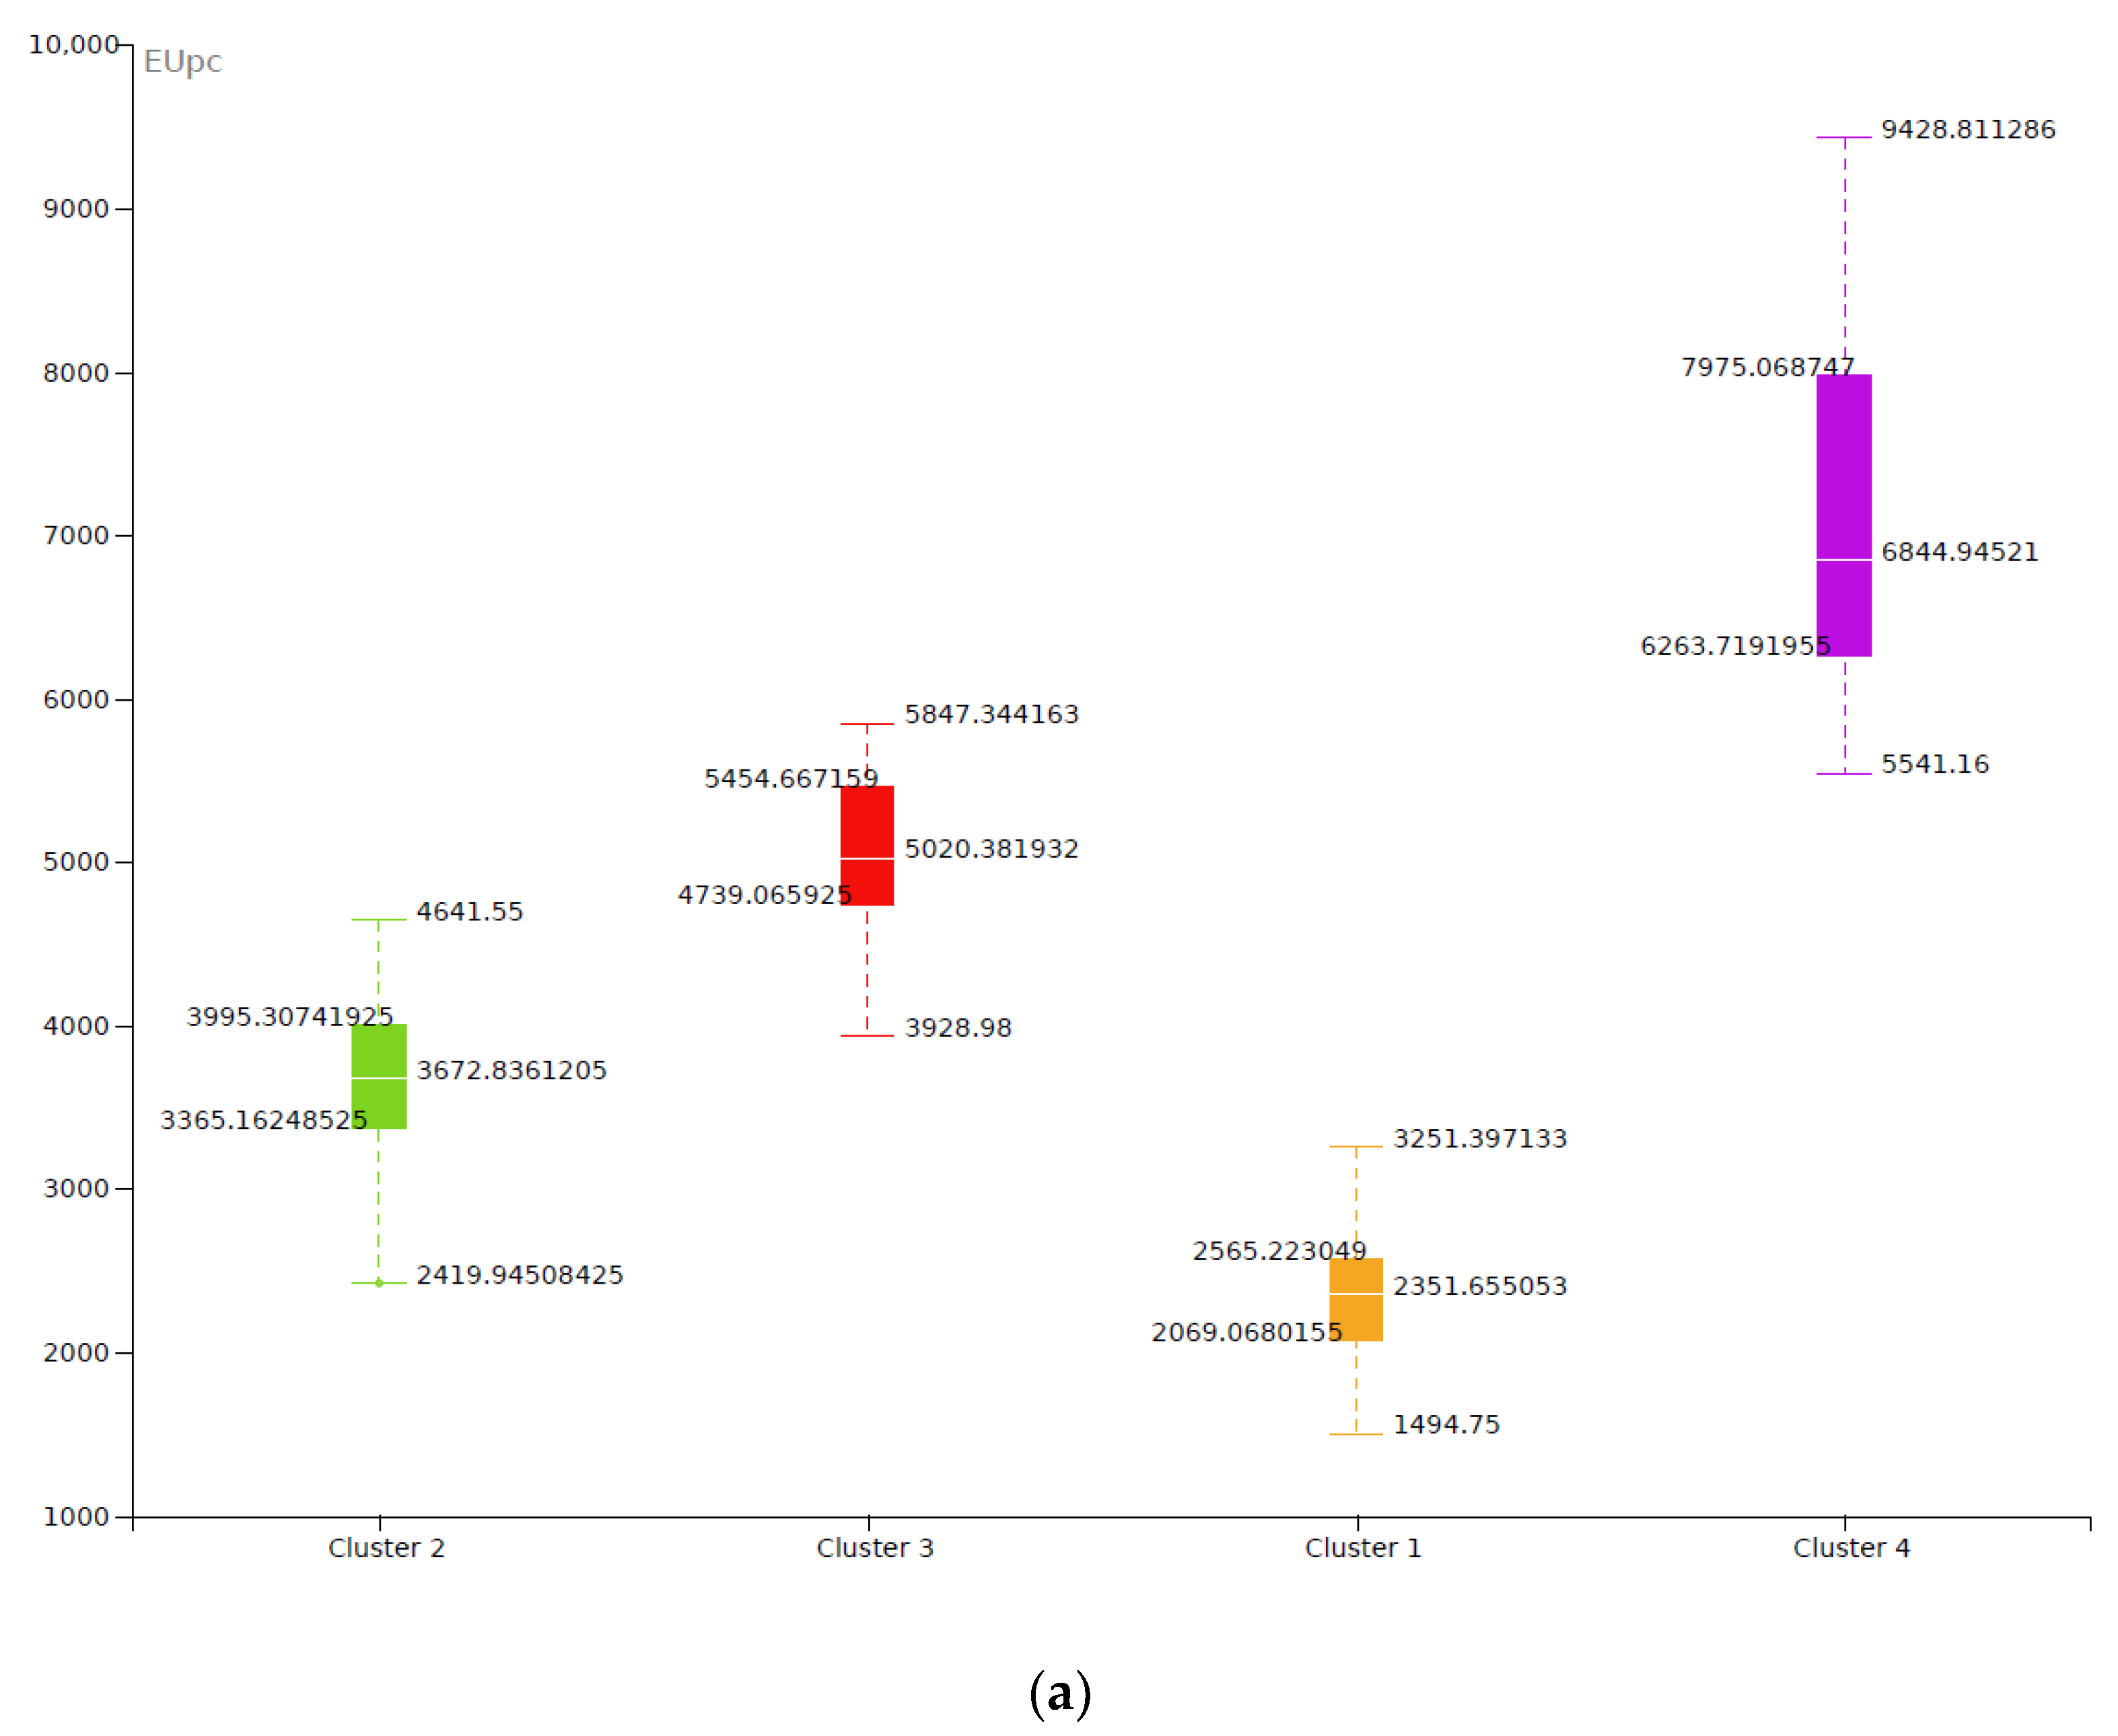
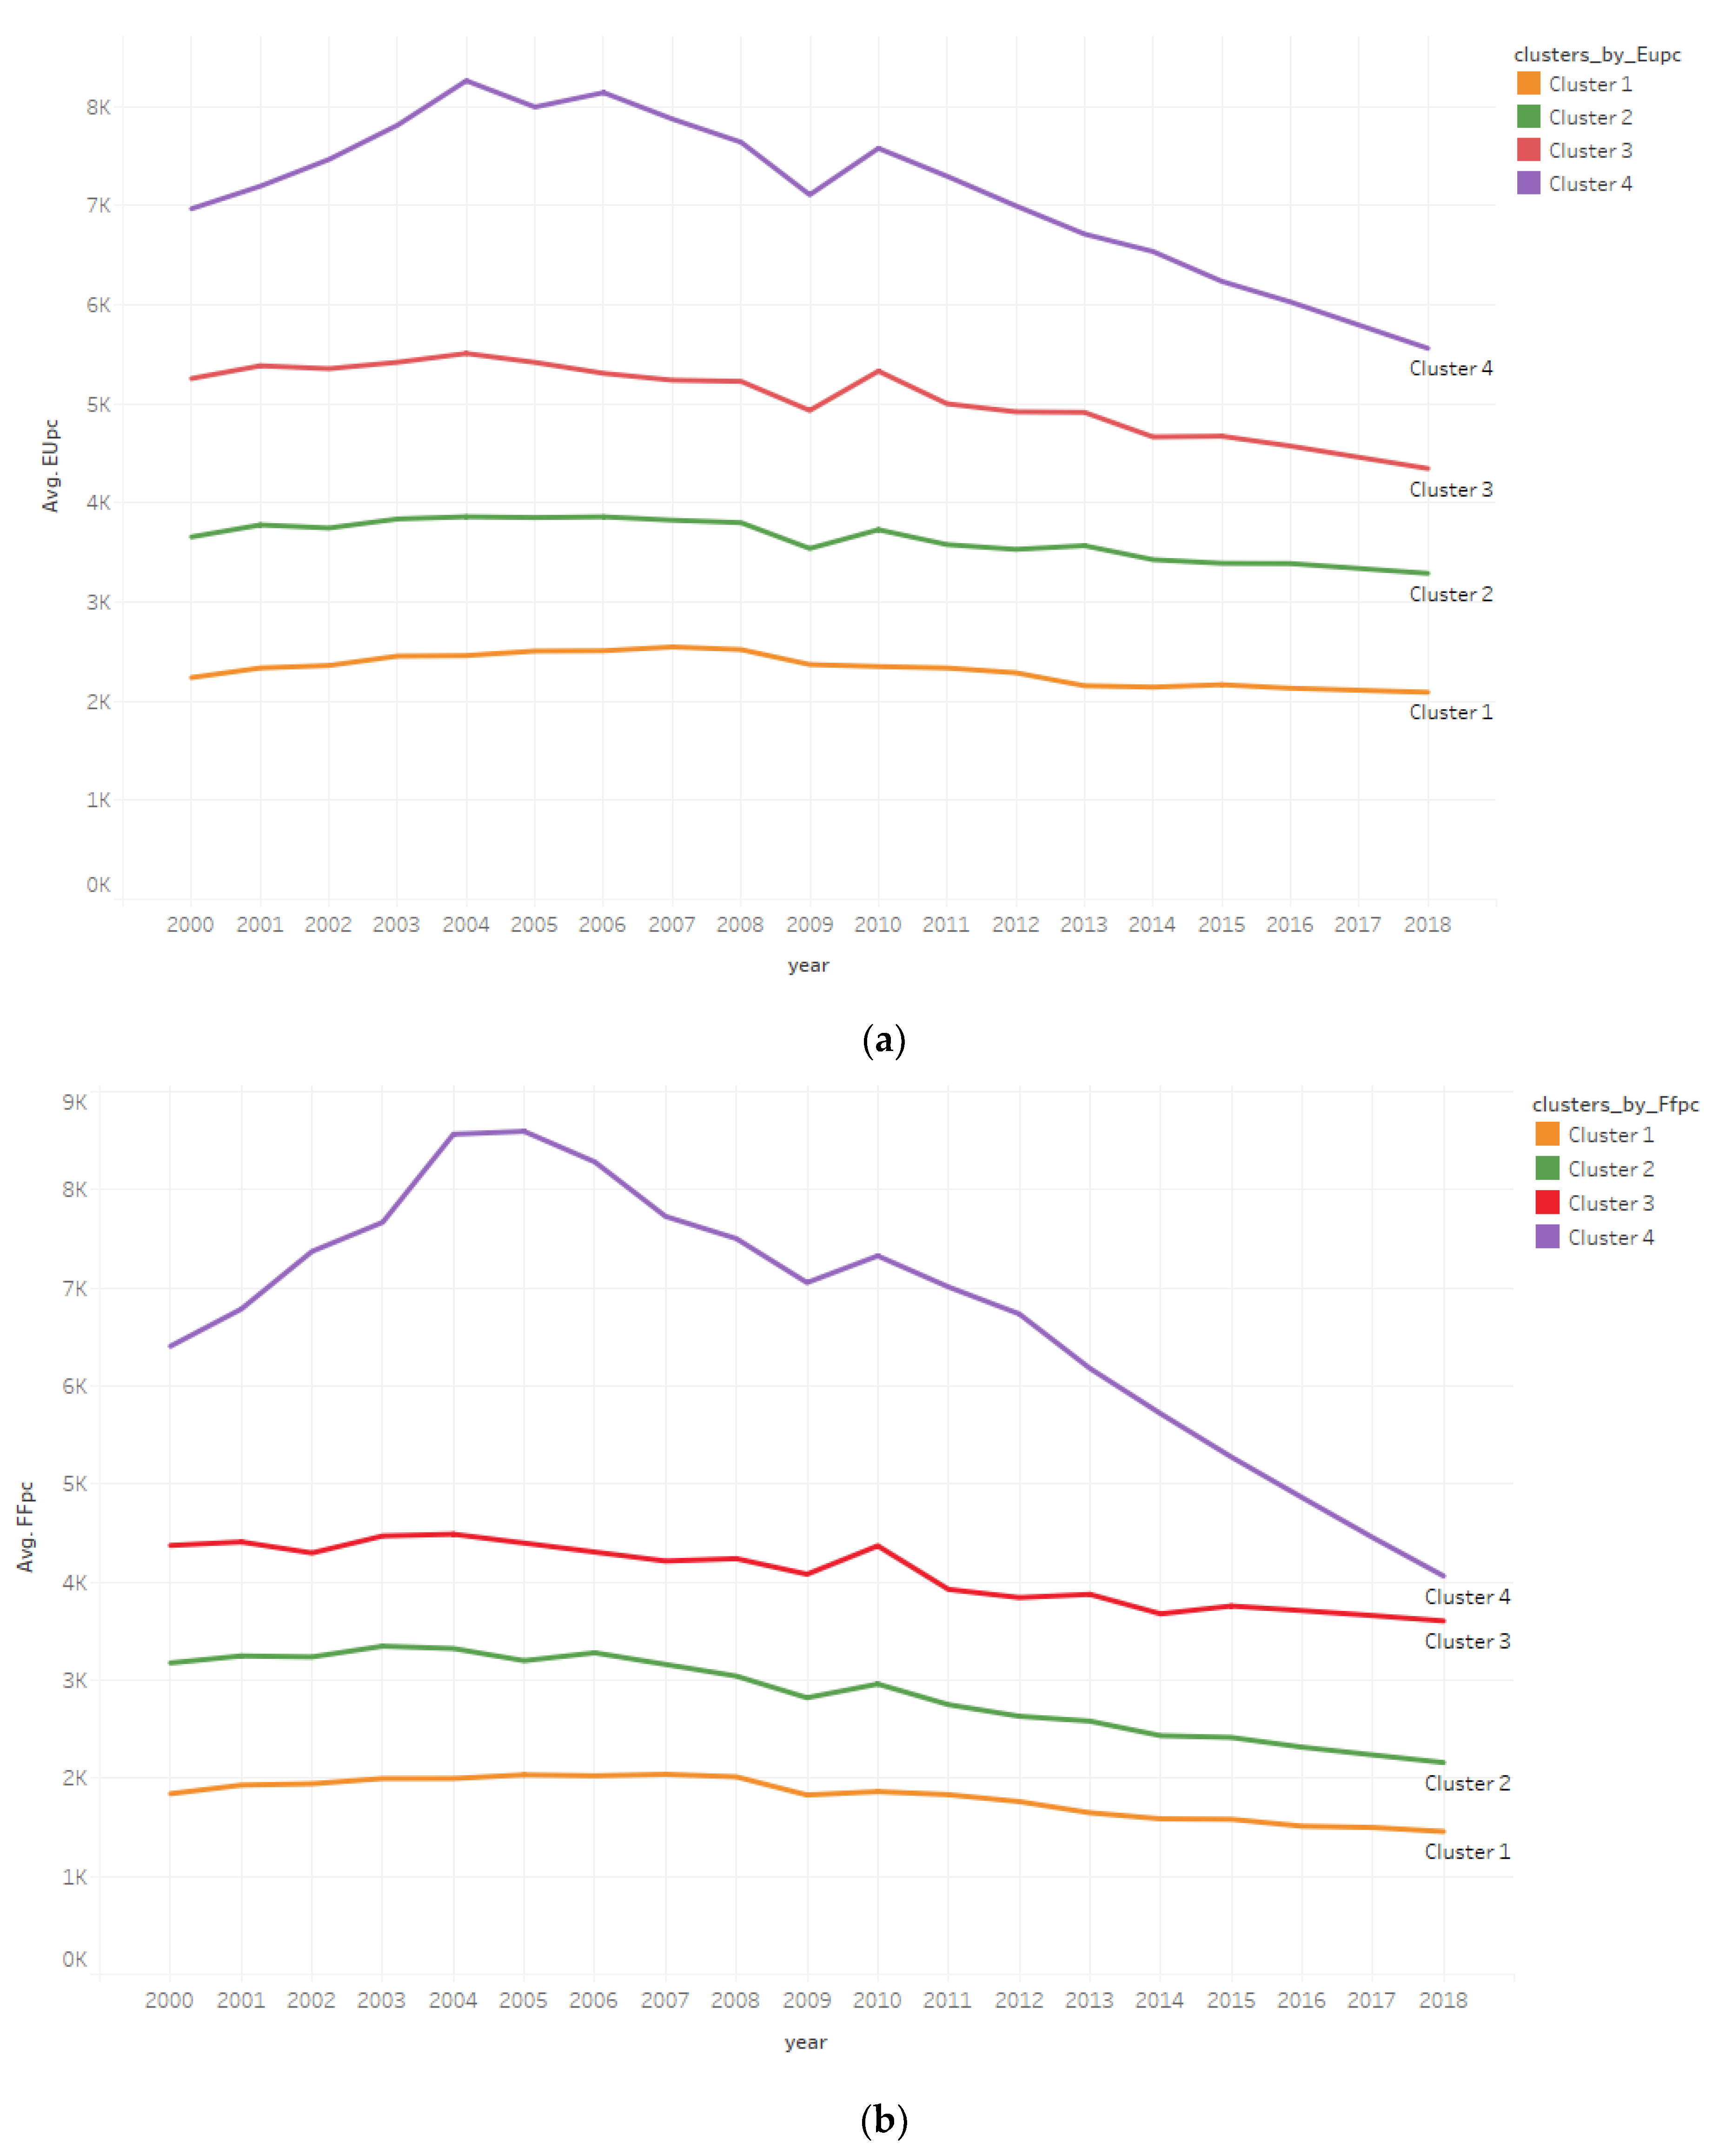
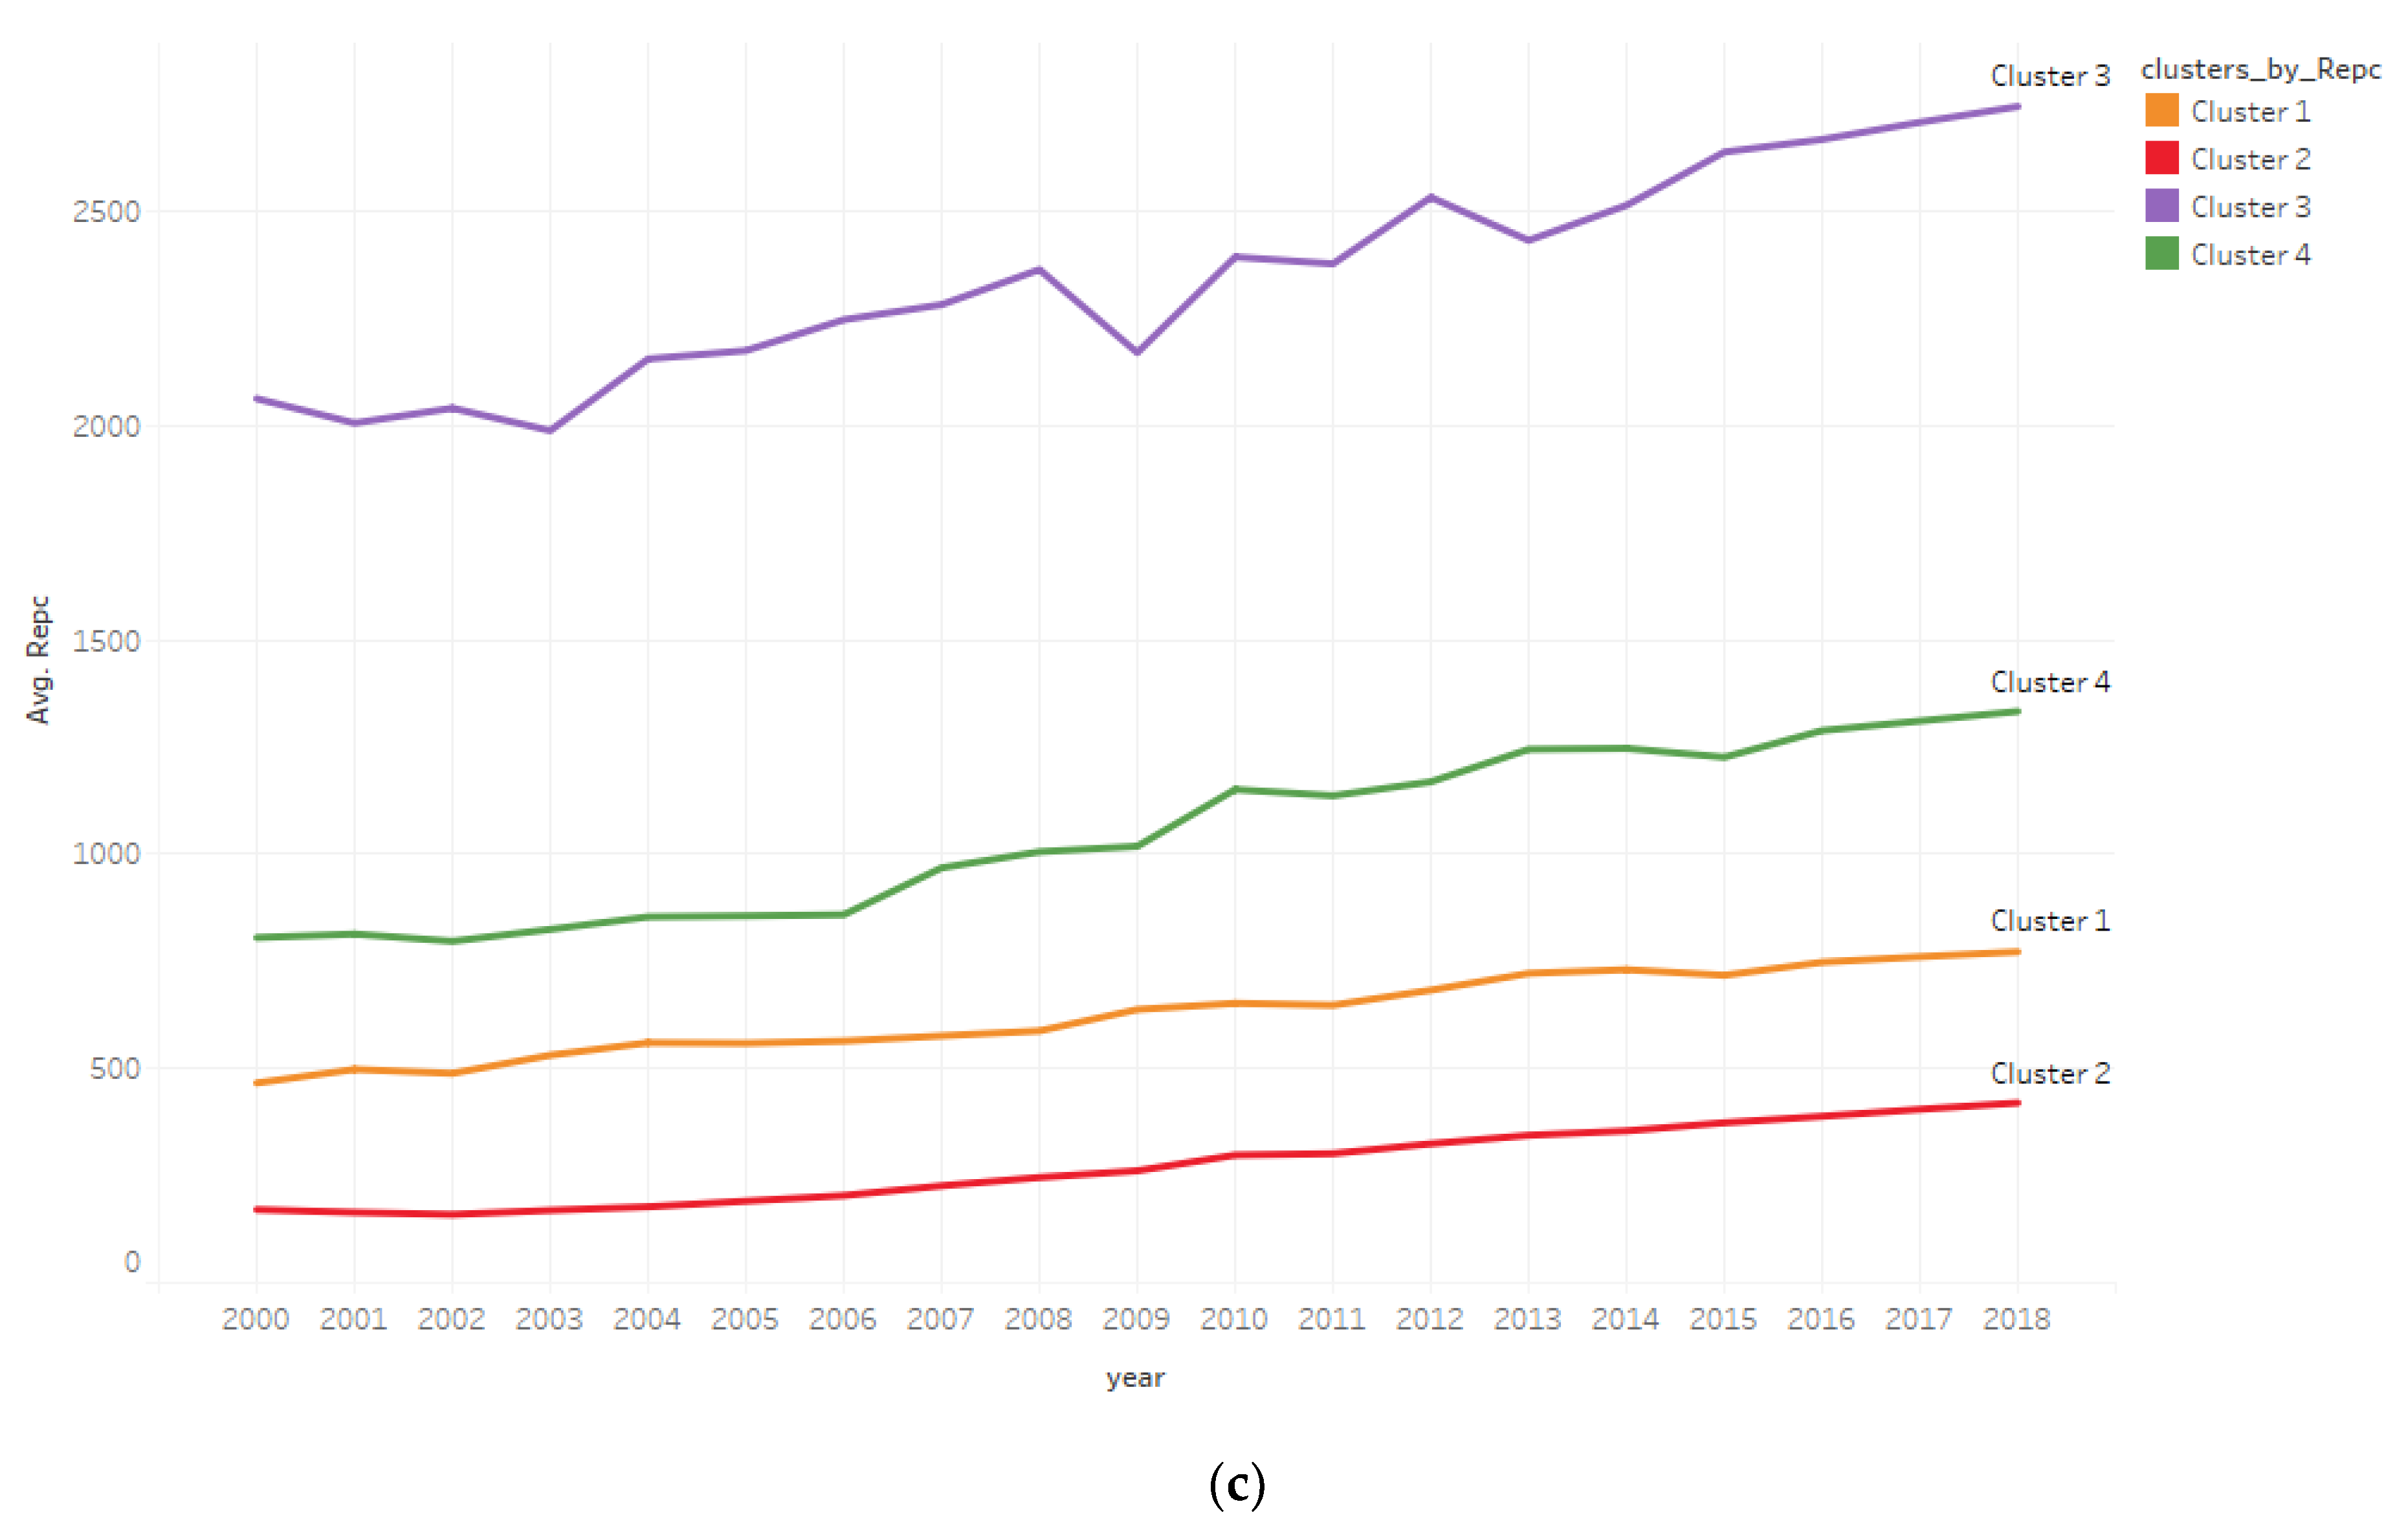
2.3. Country Clusters

Cluster analysis partitions countries into clusters, where countries within each cluster are more similar to one another than they are to countries in other clusters. In the European district, we identify four clusters of countries which classify separately (a) average energy use pc, (b) average fossil fuel consumption pc, (c) average renewable energy consumption pc (averages of the annual measurements are taken over the 2000–2018 study period). The four groups of countries in all maps are denoted with numbers from 1 to 4, corresponding to different levels of average energy variable pc. Clusters classify countries in ascending order of their average energy use. The present classification aims to indicate the effects of energy consumption. A spatial representation of energy clusters in the EU-28 is in Figure 2. For each energy variable, a map was created in Tableau software [47,48,49] to visualize the four clusters (Tableau uses the K Means clustering algorithm. K-means algorithm is an iterative algorithm that separates the dataset into distinctive non-intersecting sets (clusters) where each data point resides in only one set (cluster). It appoints data to a cluster so that the sum of the squared distance between the data points and the cluster’s centroid is at the minimum. The smaller the variation within the clusters the more homogeneous are the data points within the cluster. This algorithm groups together the most similar intra-cluster data points while also keeping the clusters as separable as possible.) of countries according to the energy use pc (Figure 2a), fossil fuel consumption pc (Figure 2b), renewable energy pc (Figure 2c), based on average levels through 2000–2018.
In the sections and the analyses that follow the K-Means clustering method is used.
Energy inequality is measured by the range spread, a percentage that the maximum is greater than the minimum, using the maximum as a base. This simply shows in percentage form how much higher the maximum is from the minimum. The data from the sample period 2000–2018 shows that renewable energy consumption has the highest range spread (100%), followed by total energy use (95.05%) and fossil fuel energy consumption (84.15%). Energy data distributions per cluster are illustrated in boxplots of Figure 3a–c.

3. Results

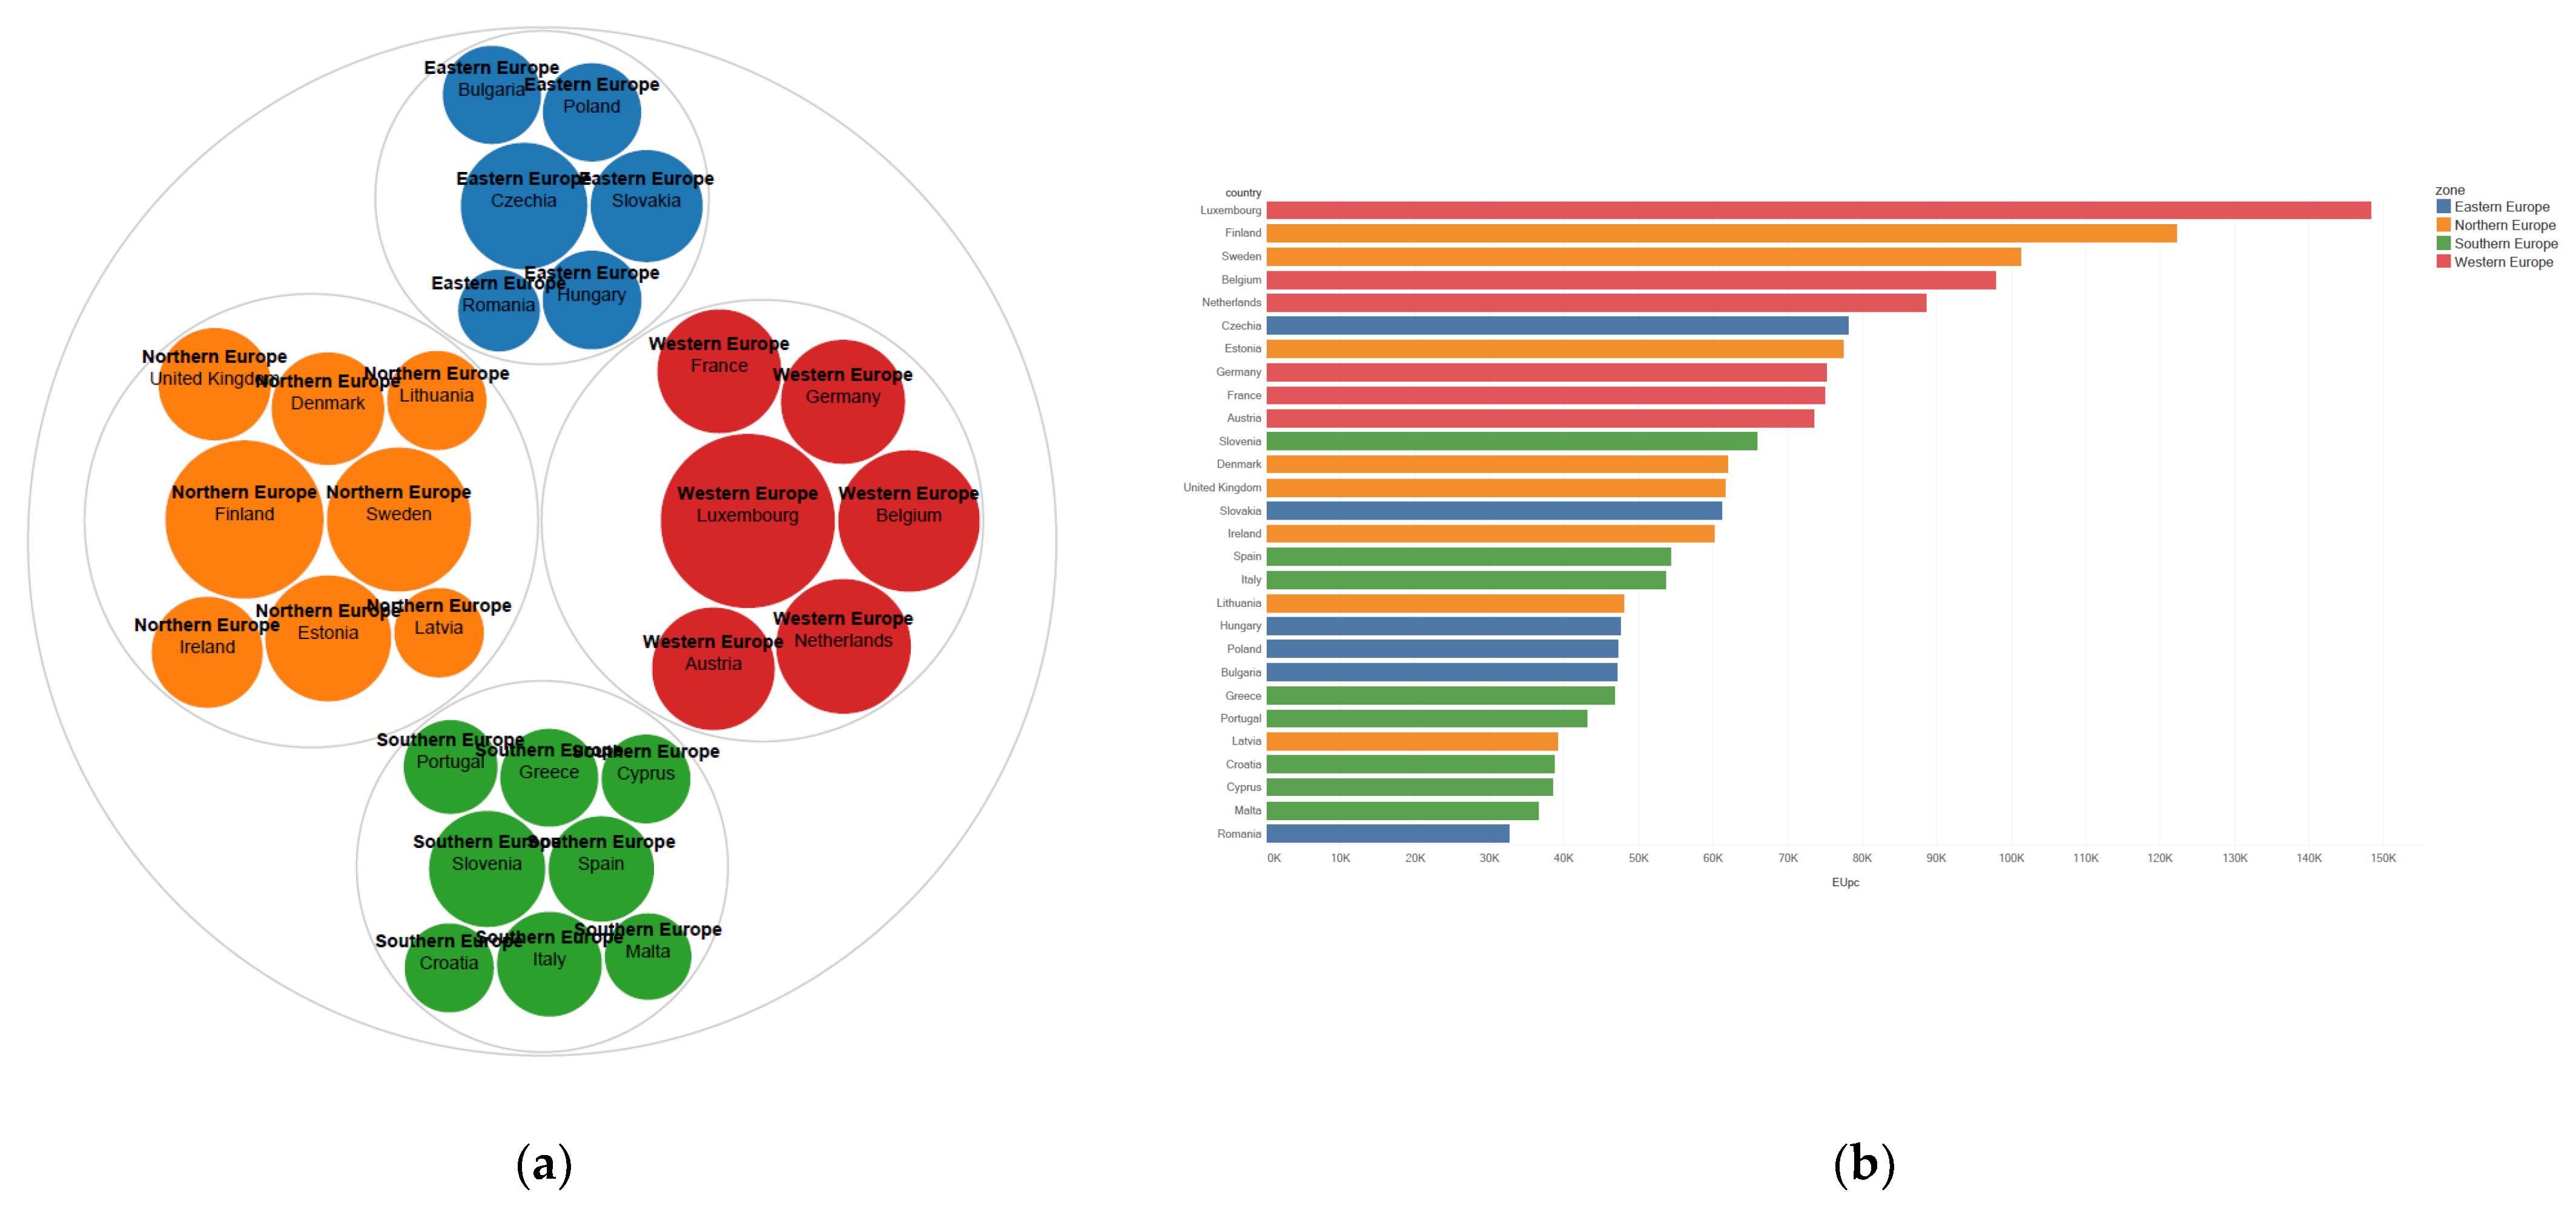
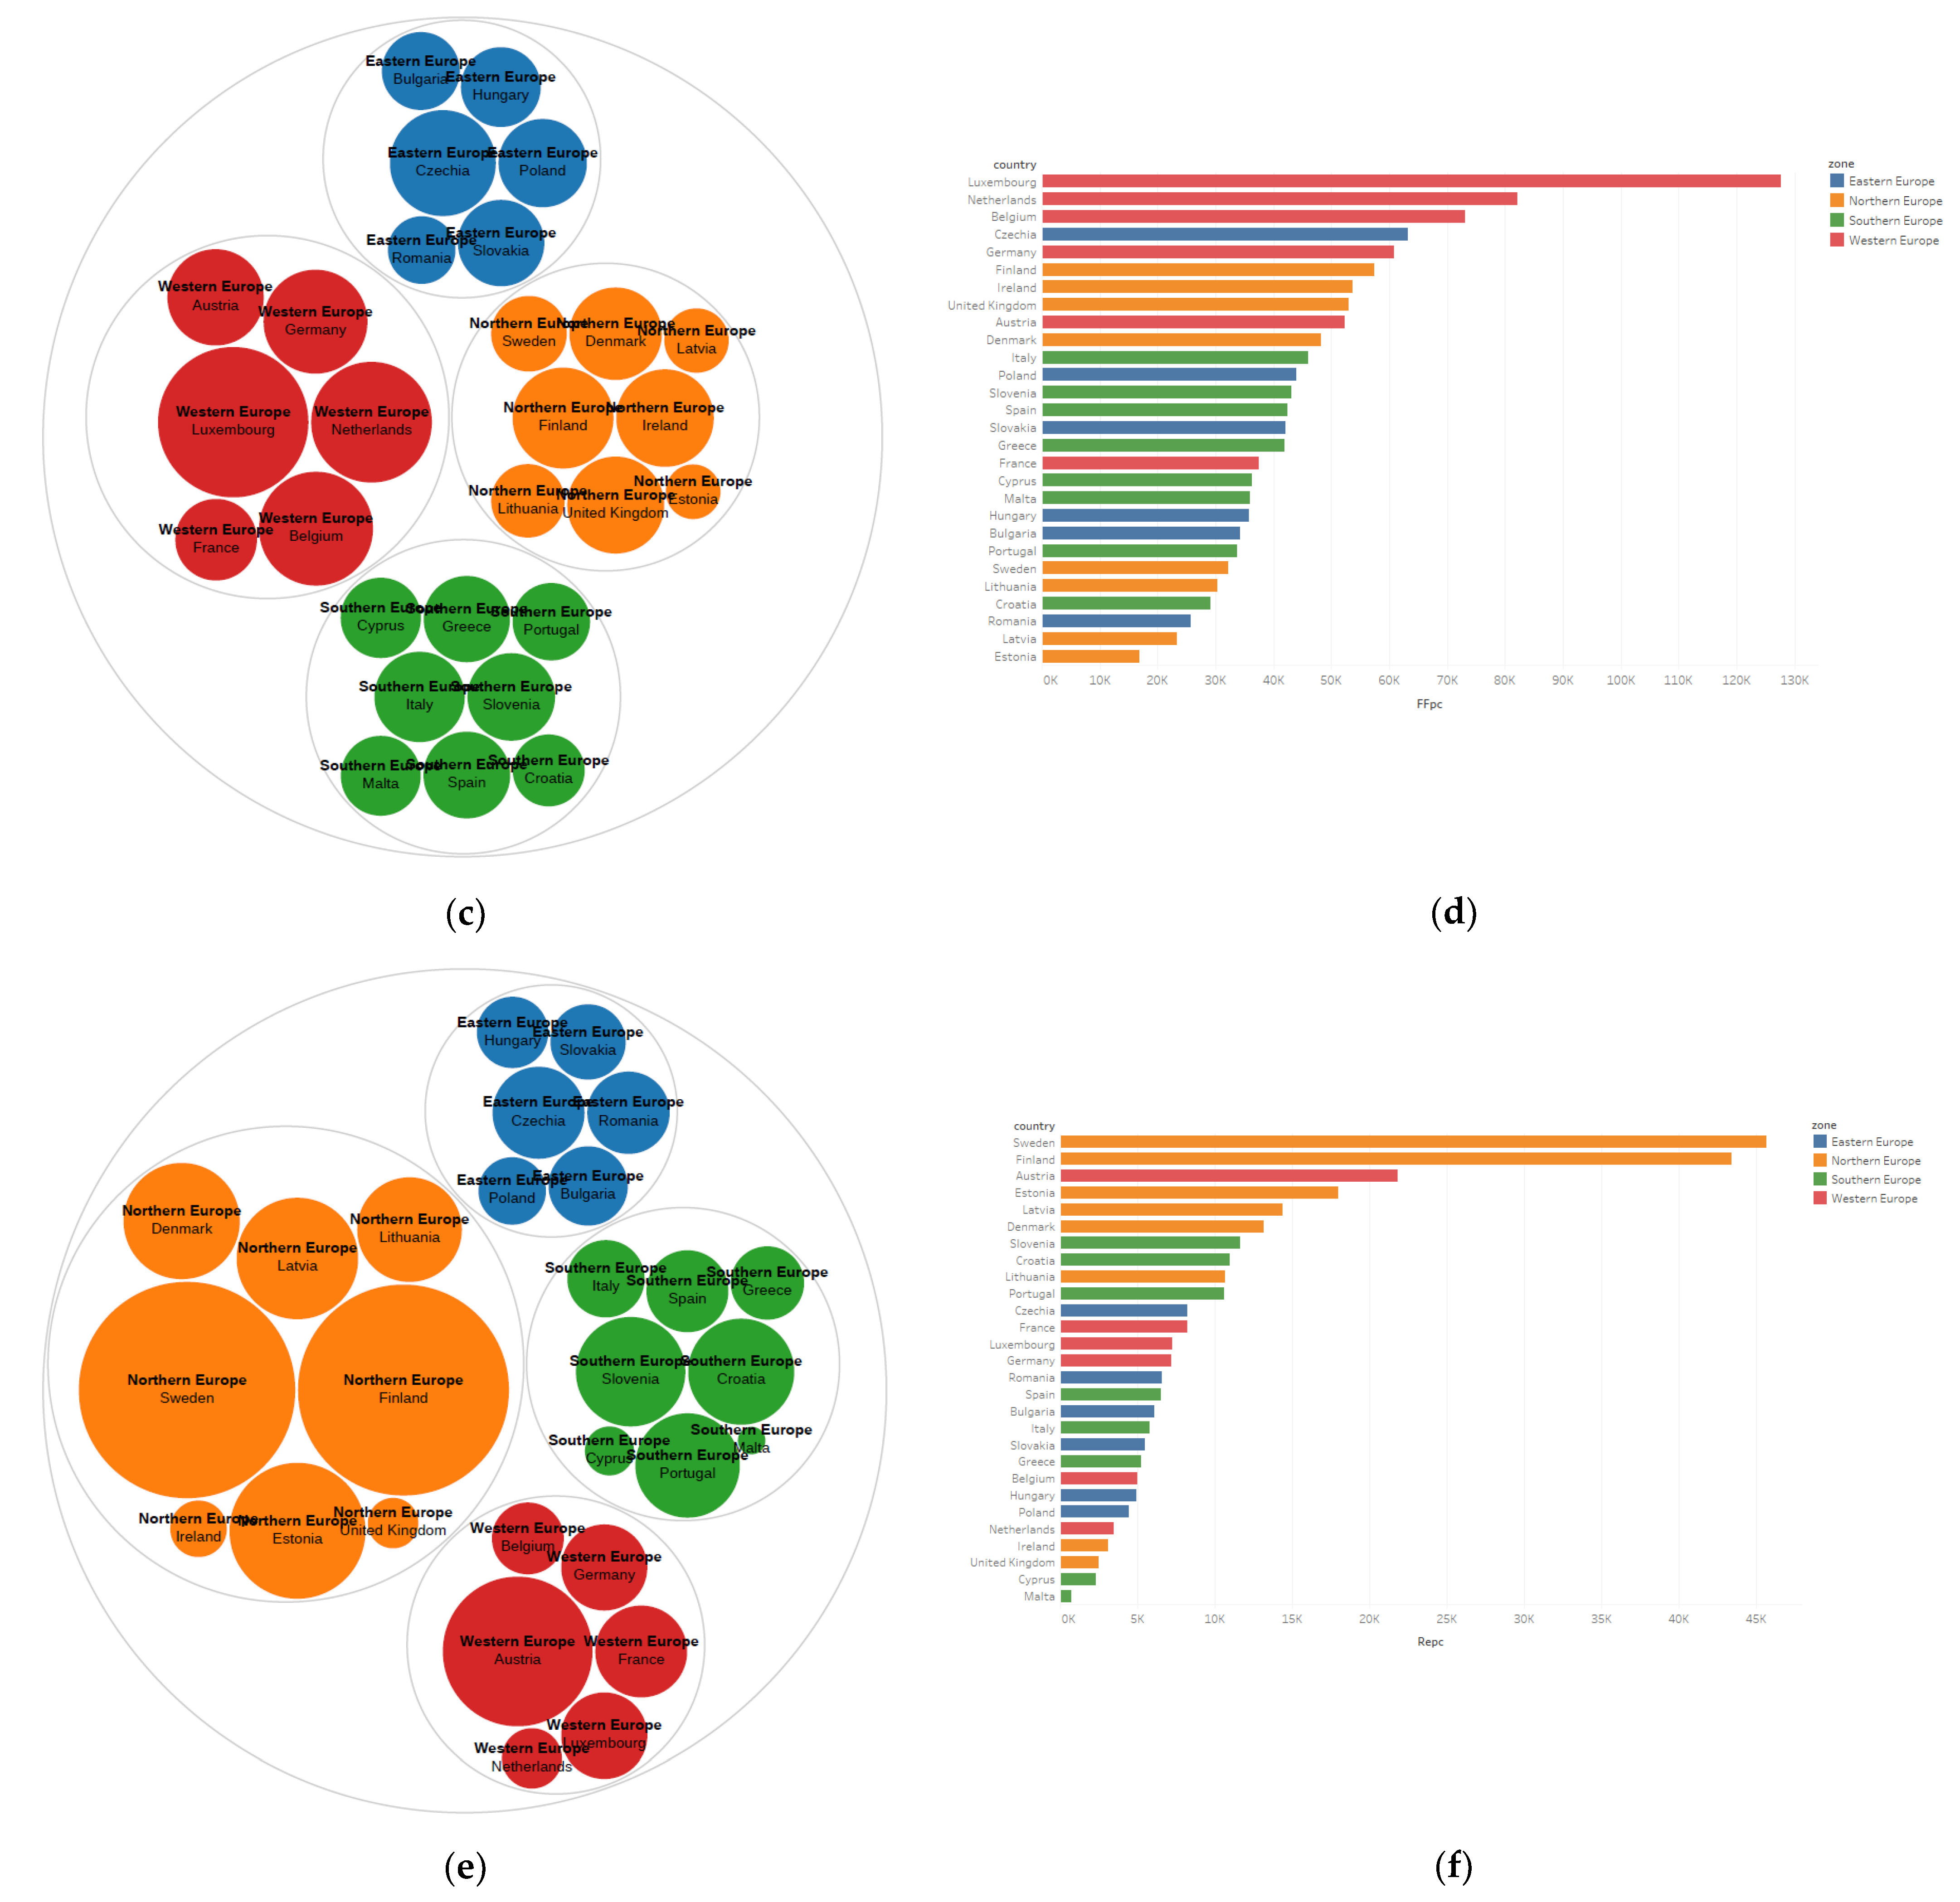
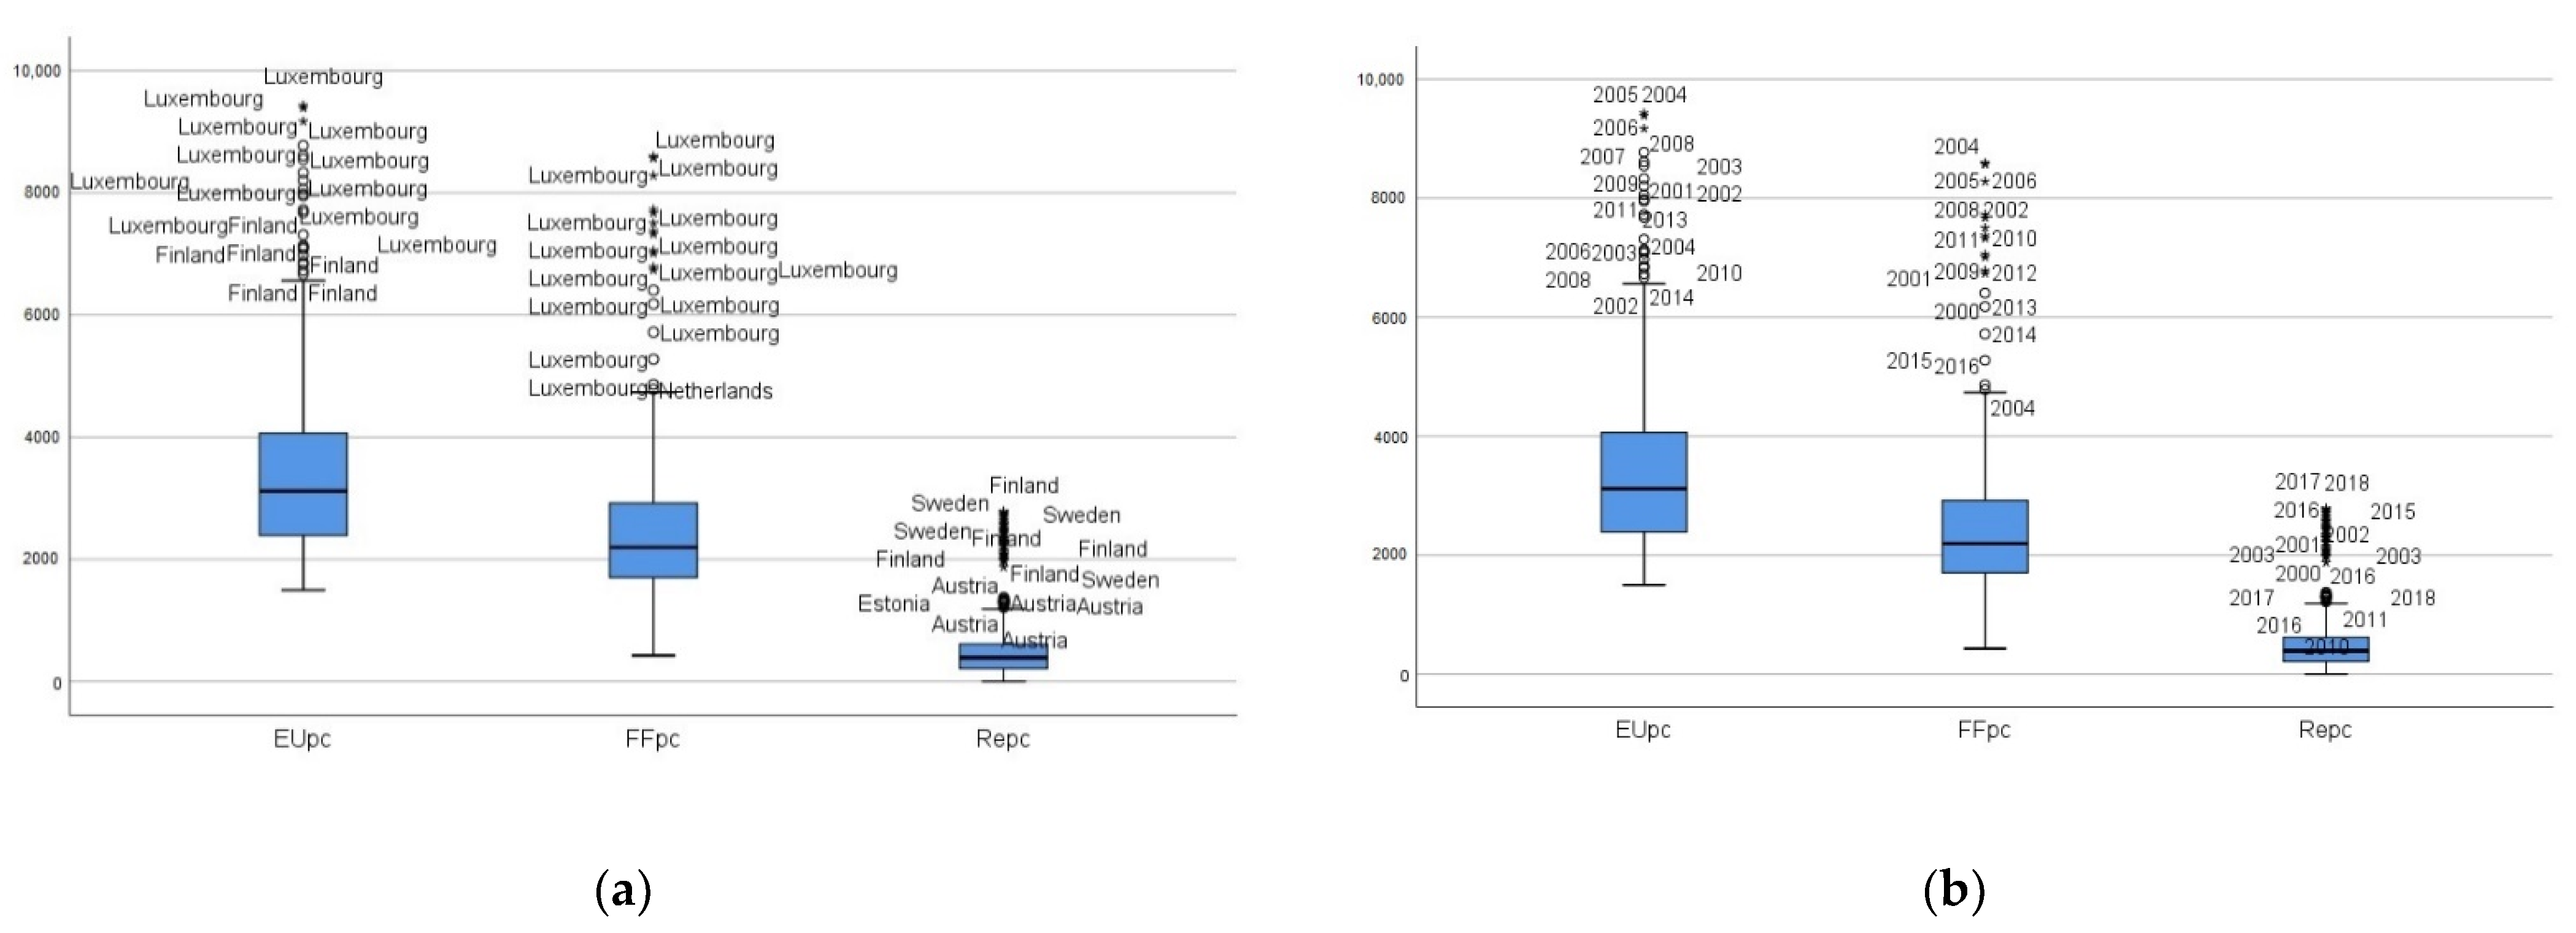
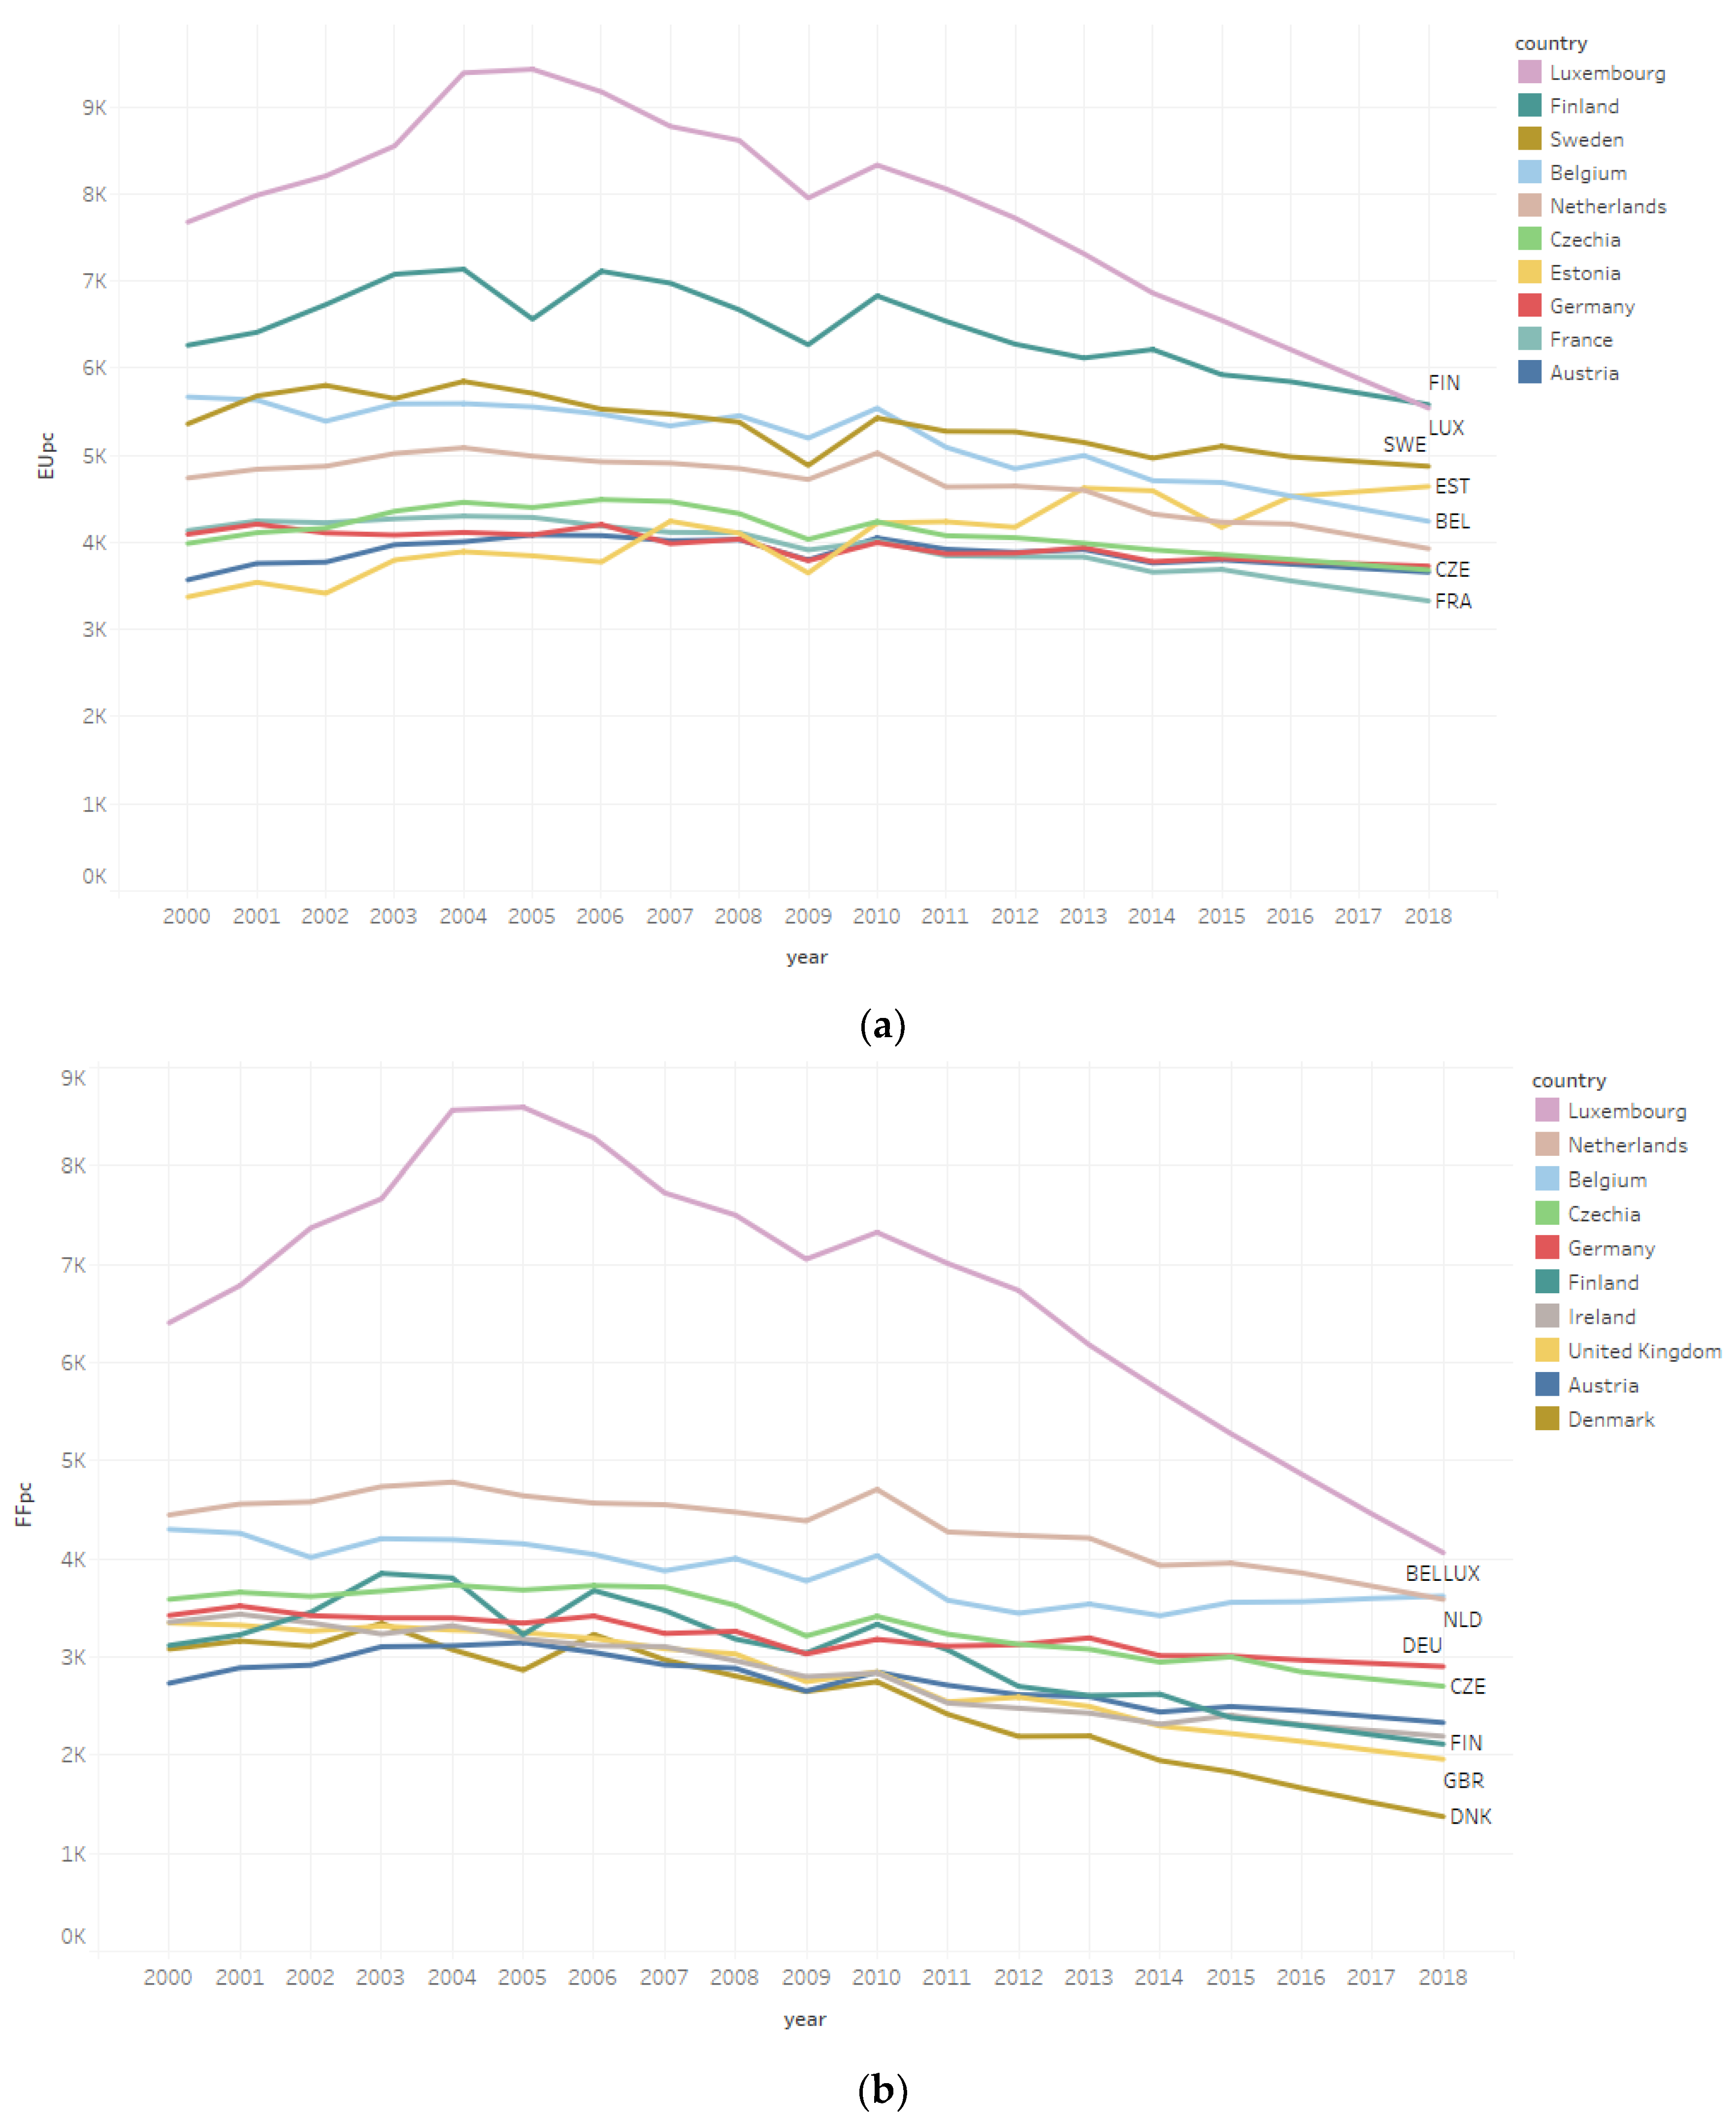
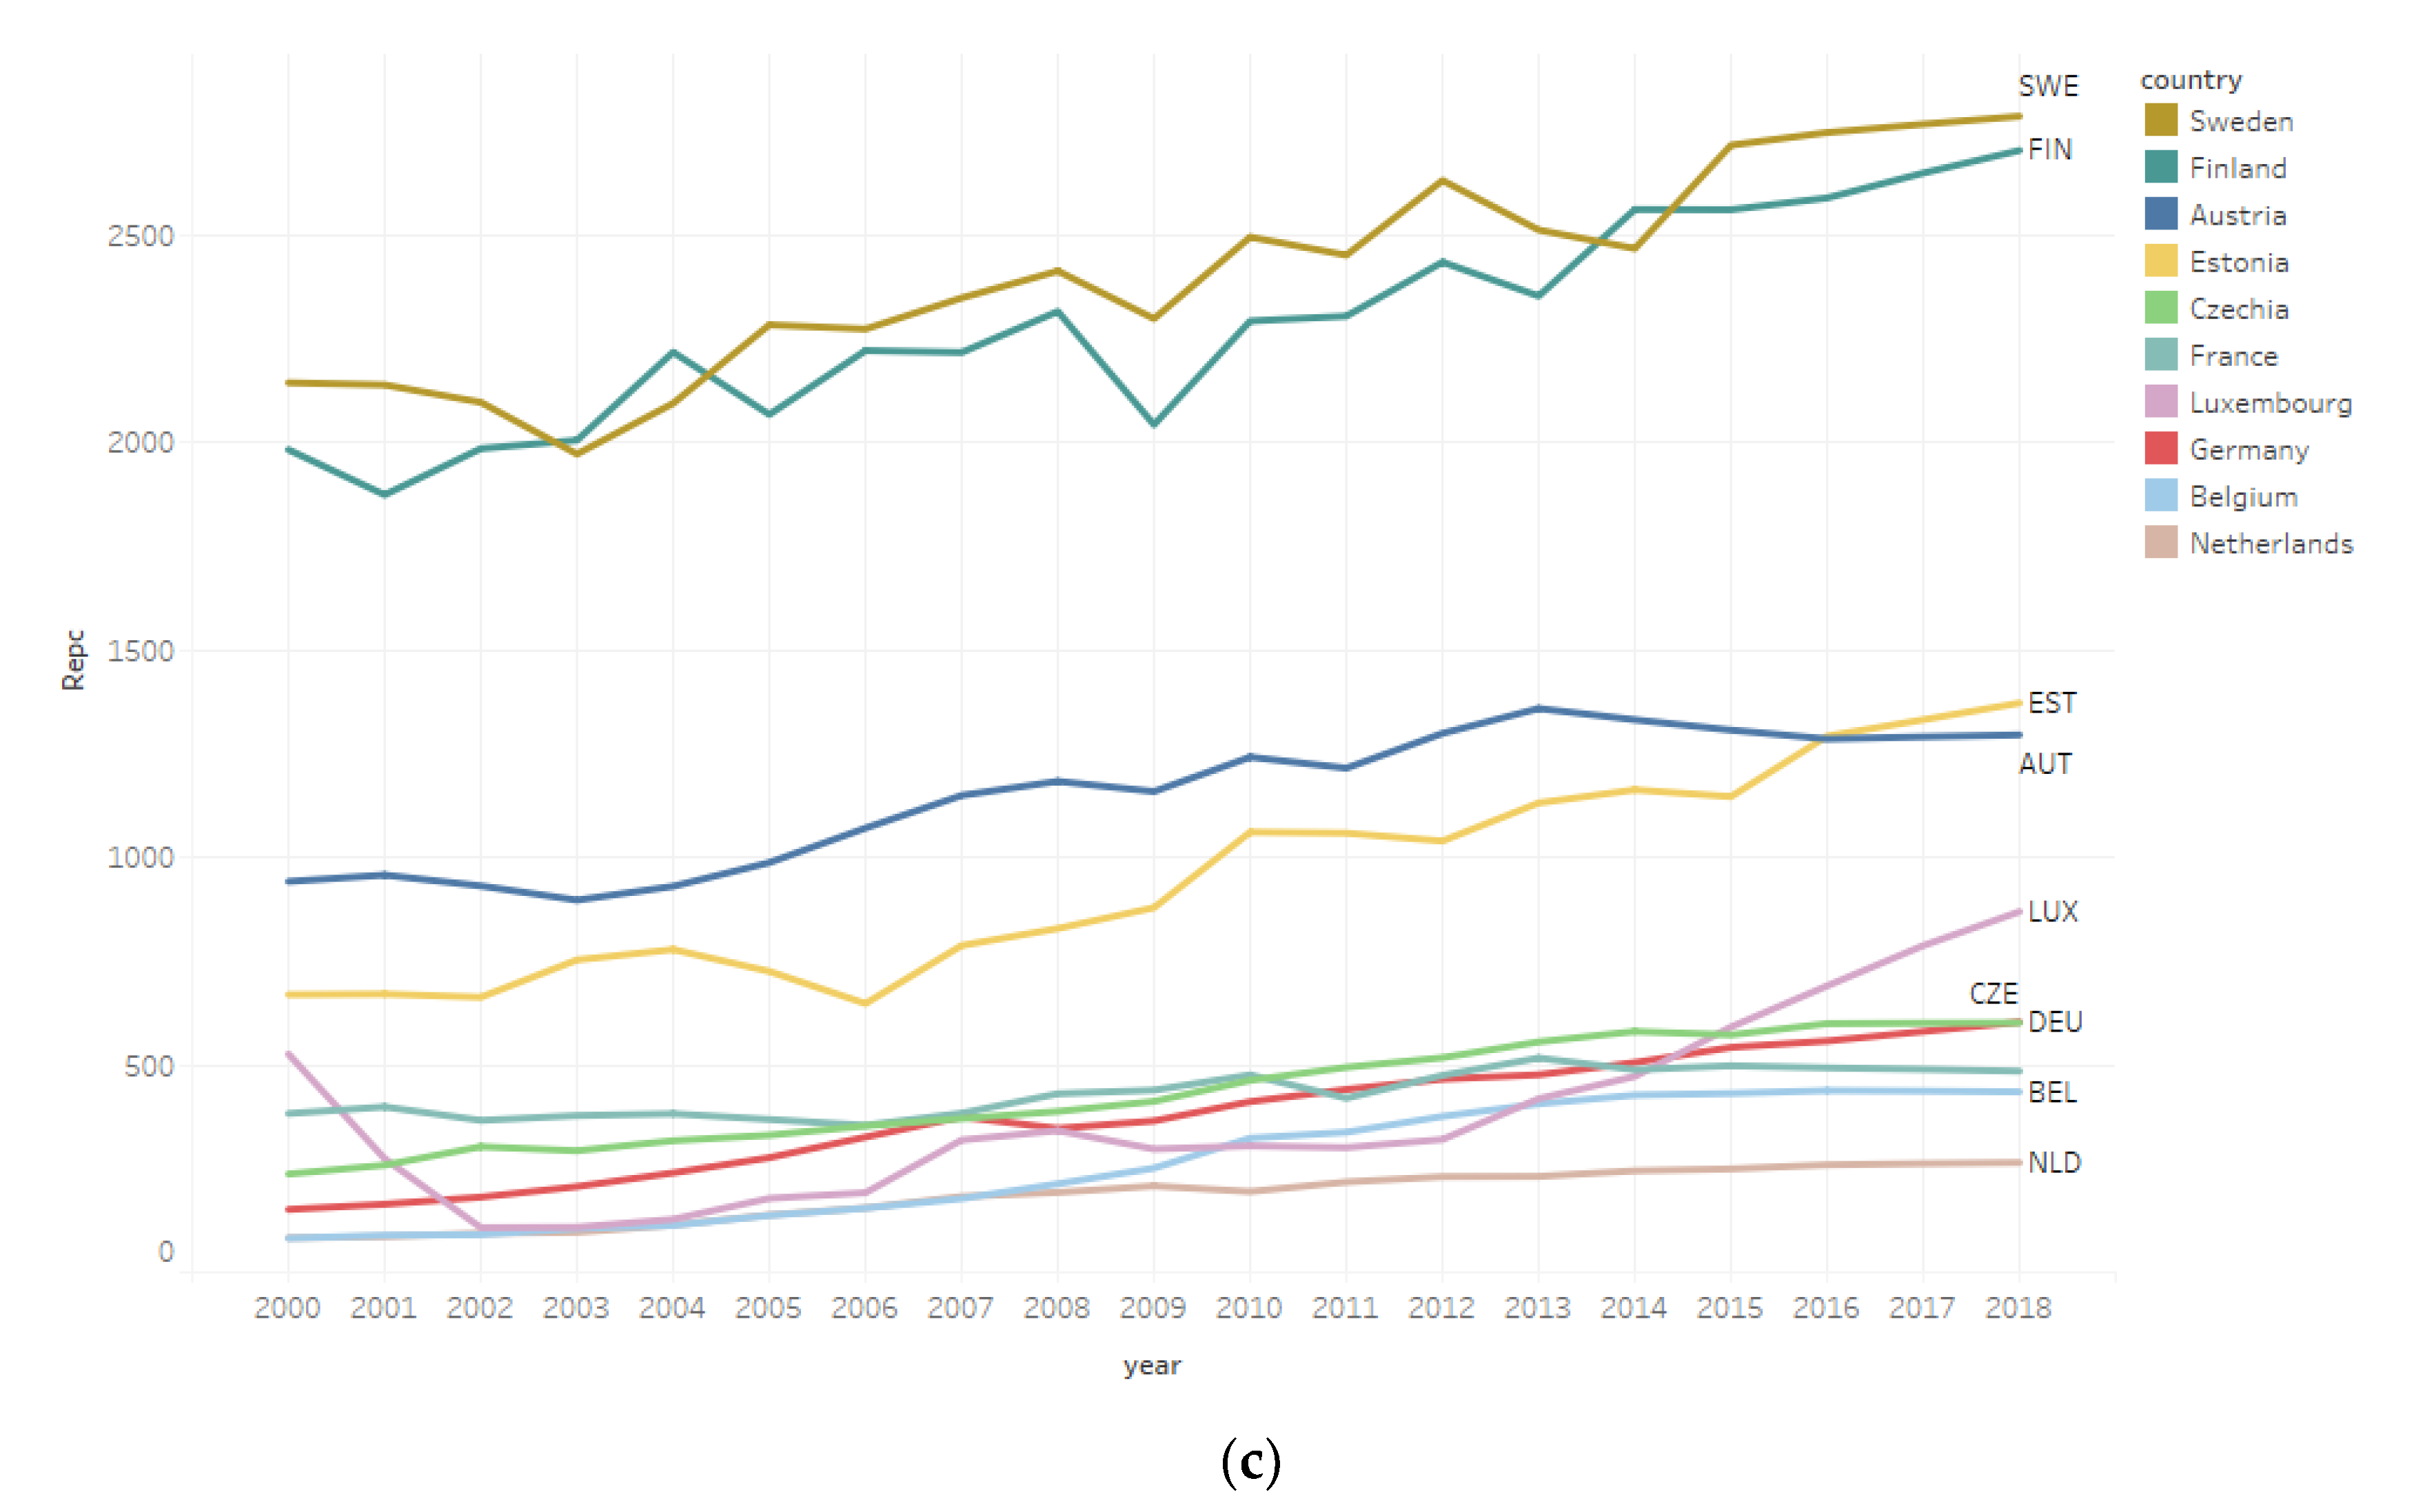
3.1. The Situation at a Country Level

To present the situation at a national level, two views are adopted in Figure 4 and Figure 5. Error bars in Figure 4 are a graphical enhancement to visualize the variability of energy data on a comparative graph. Bars represent confidence intervals for the mean of energy variables (namely energy use pc, fossil fuel consumption pc, renewable energy consumption pc, which correspond to EUpc, FFpc, Repc variables). The main observation is that renewable energy consumption is significantly low in all countries and only in Finland and Sweden reaches the levels of fossil fuel consumption pc of most countries.
To identify which countries are leading the race to energy use, the boxplots of Figure 5a indicate energy use outliers, that is countries with higher values than the quartiles of energy use pc, fossil fuel consumption pc, and renewable energy pc among EU 28. This way we demonstrate that the use of different energy sources leads to different outliers, indicating the way that the policies have to be implemented in such cases. In Figure 5b the year of occurrence of these exceptional situations is noted.

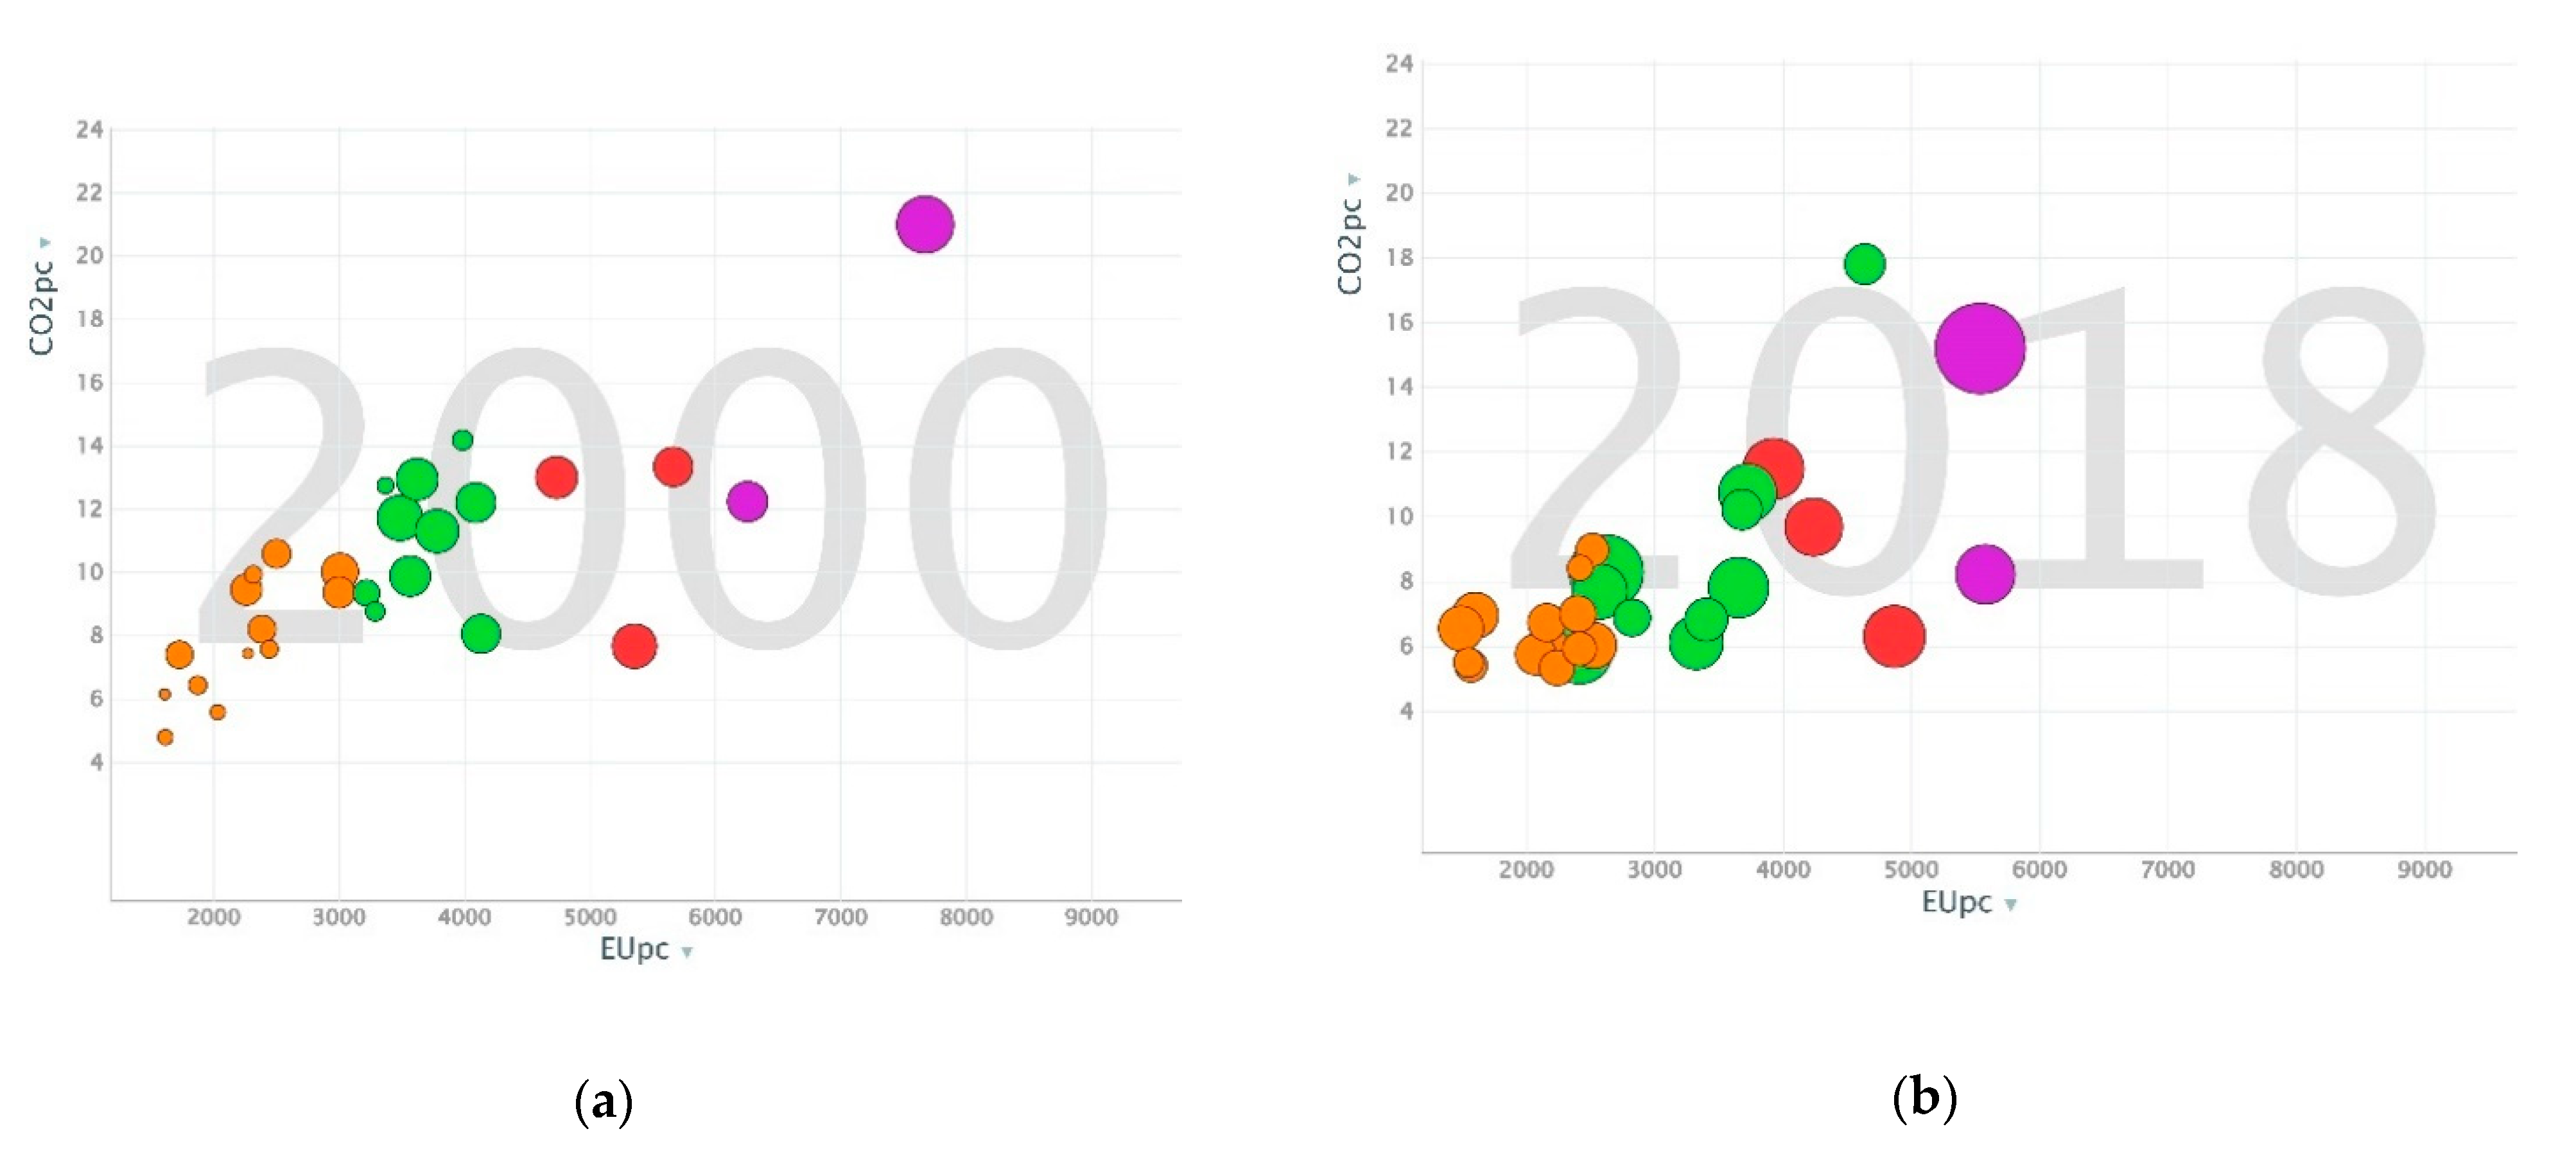
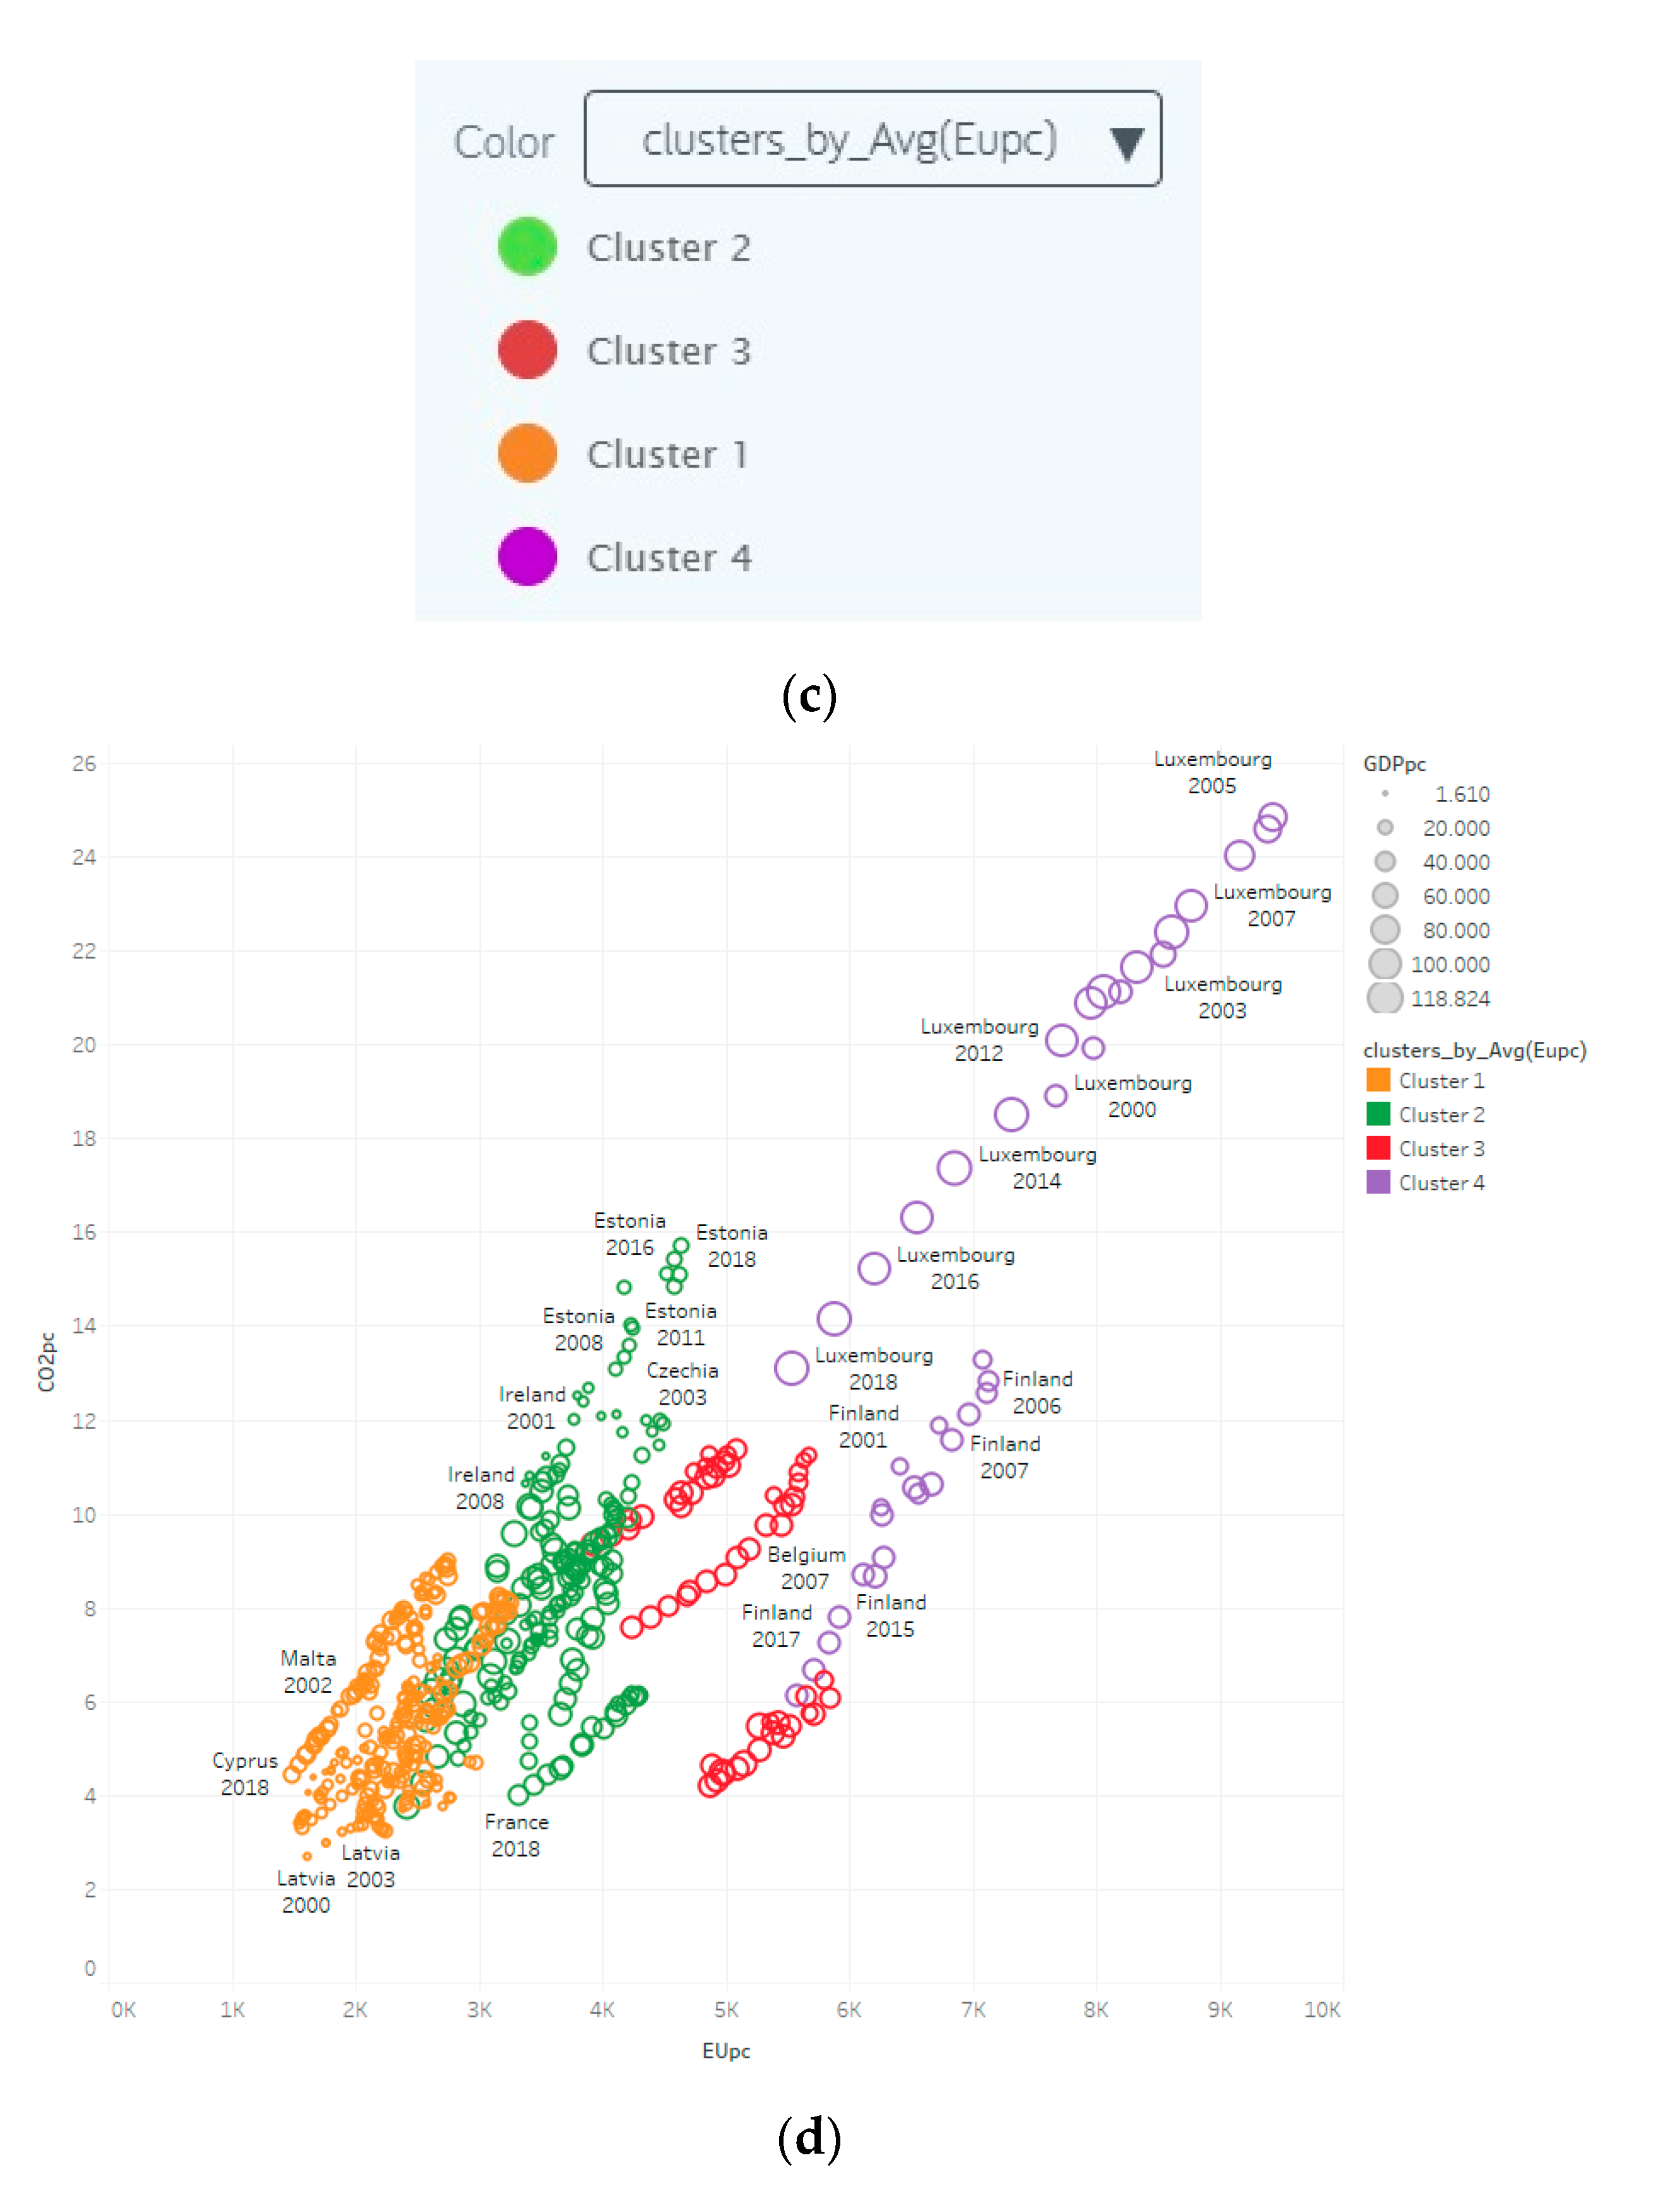
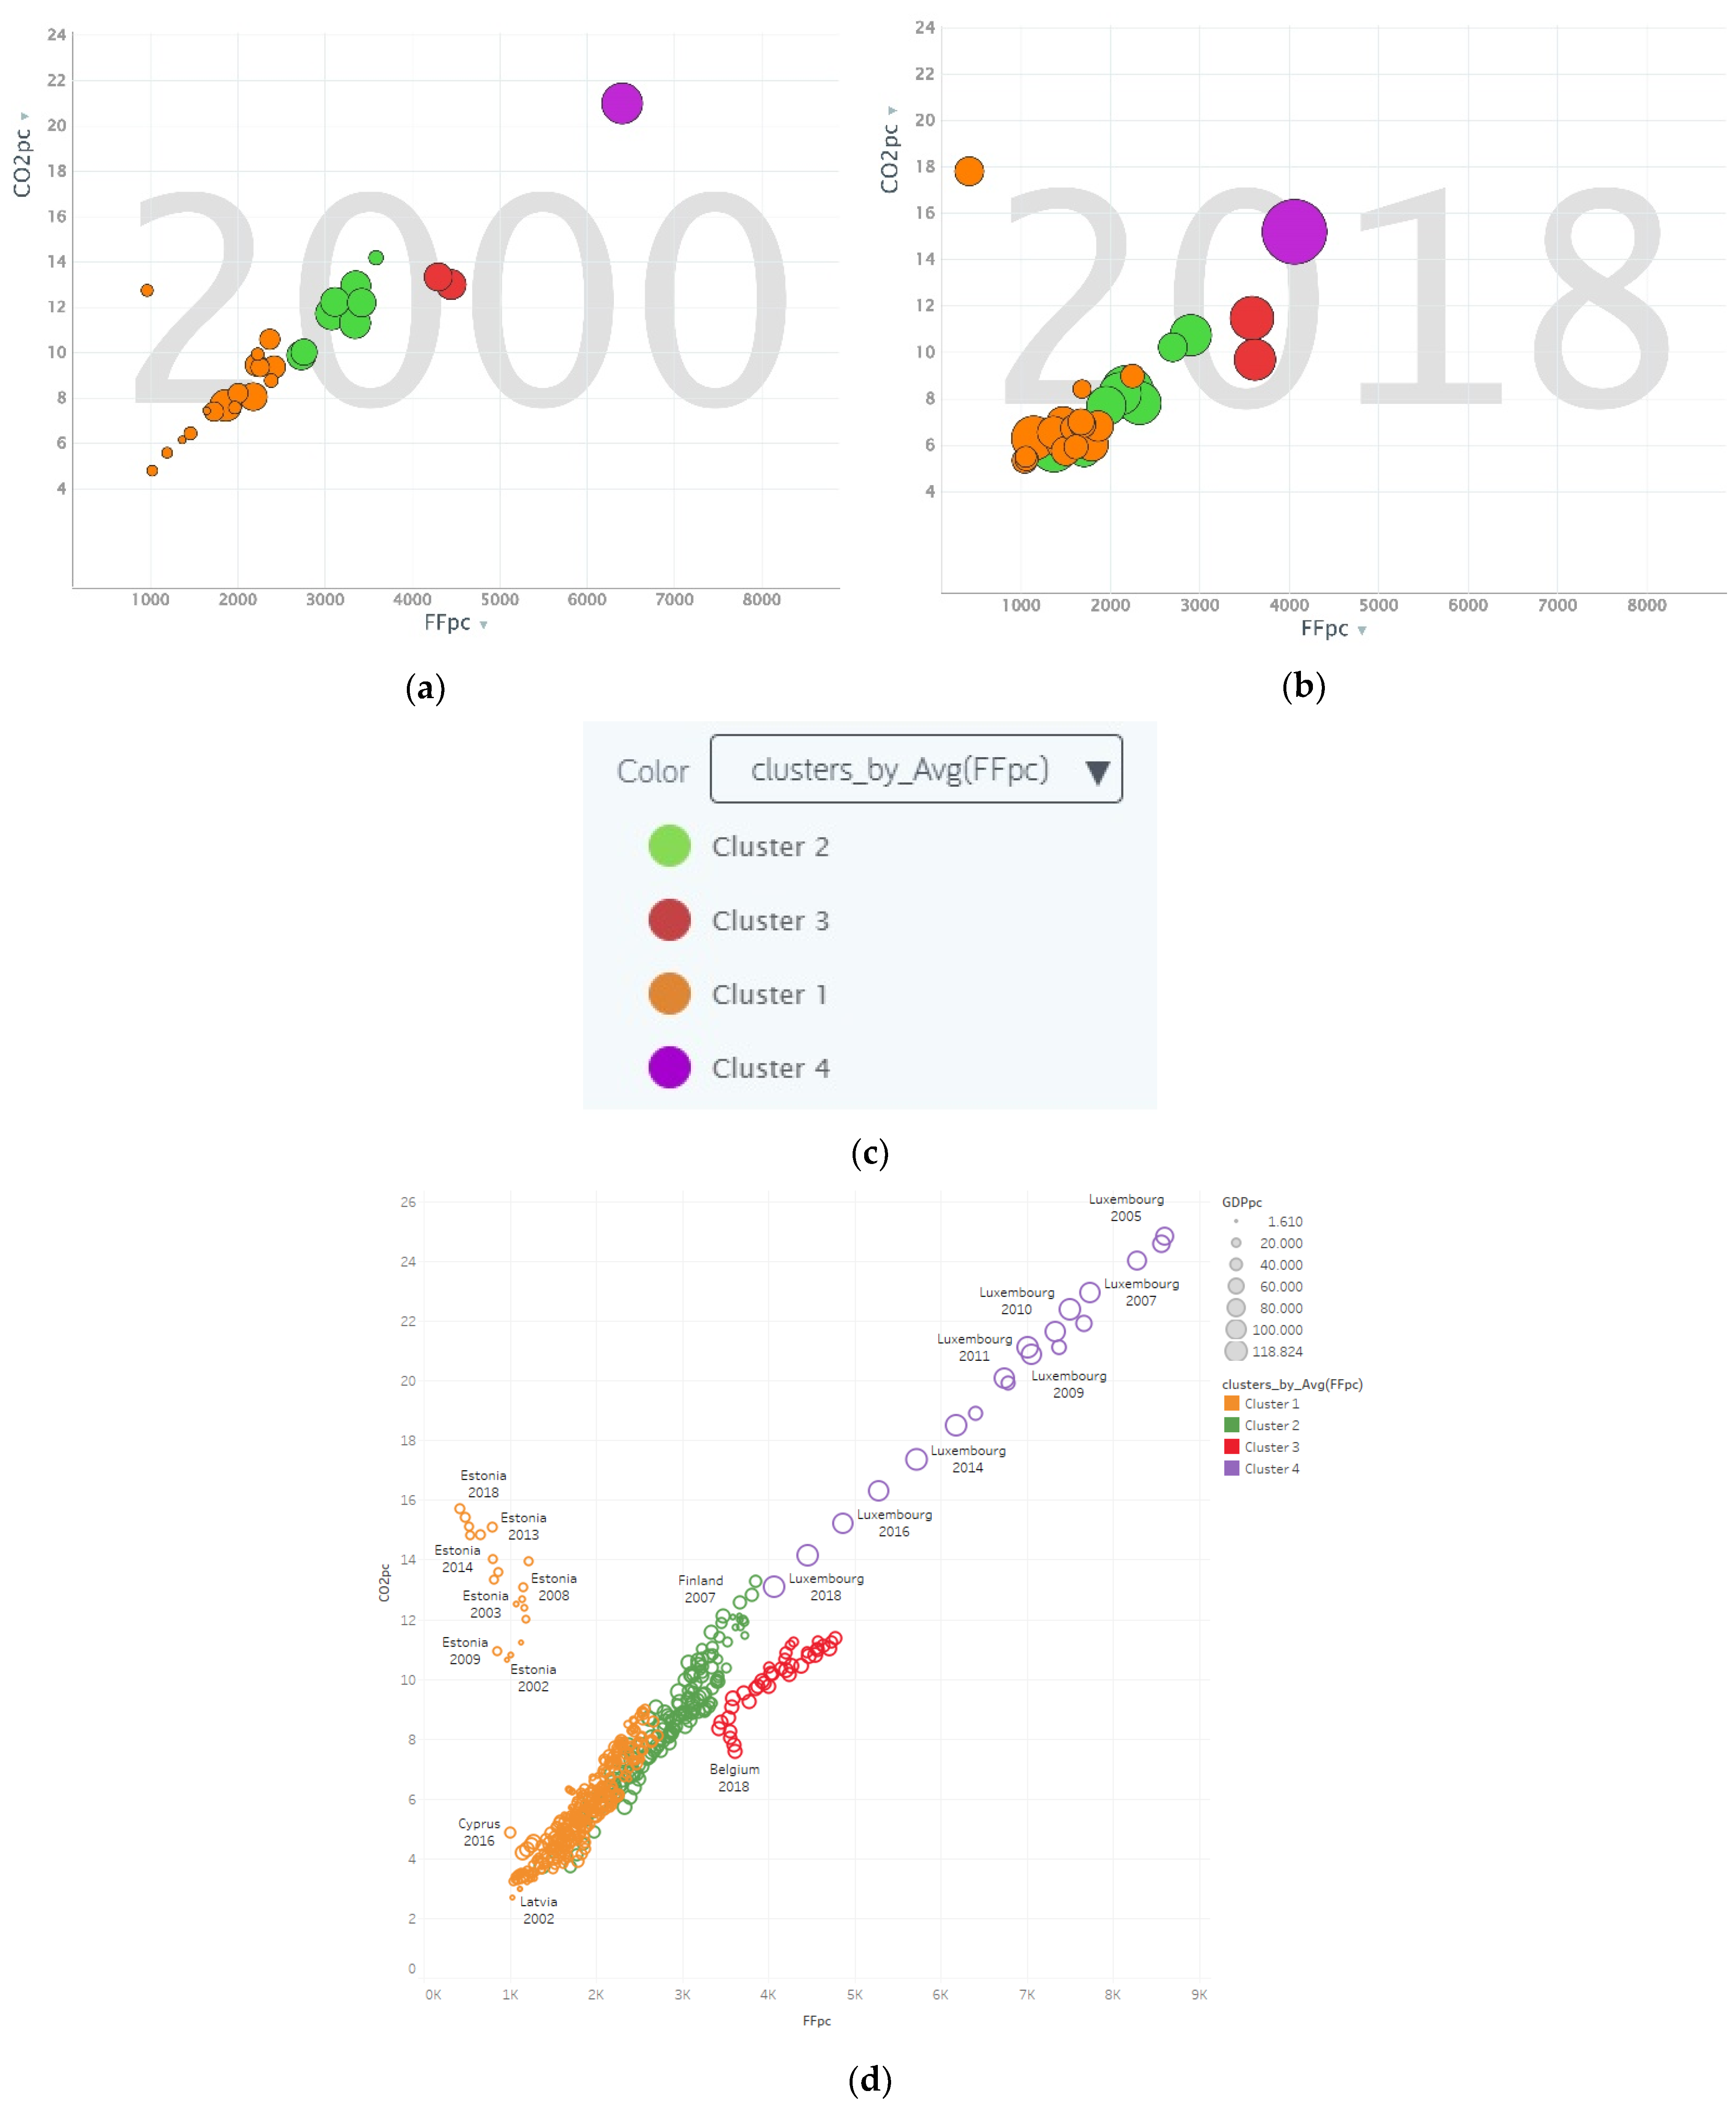
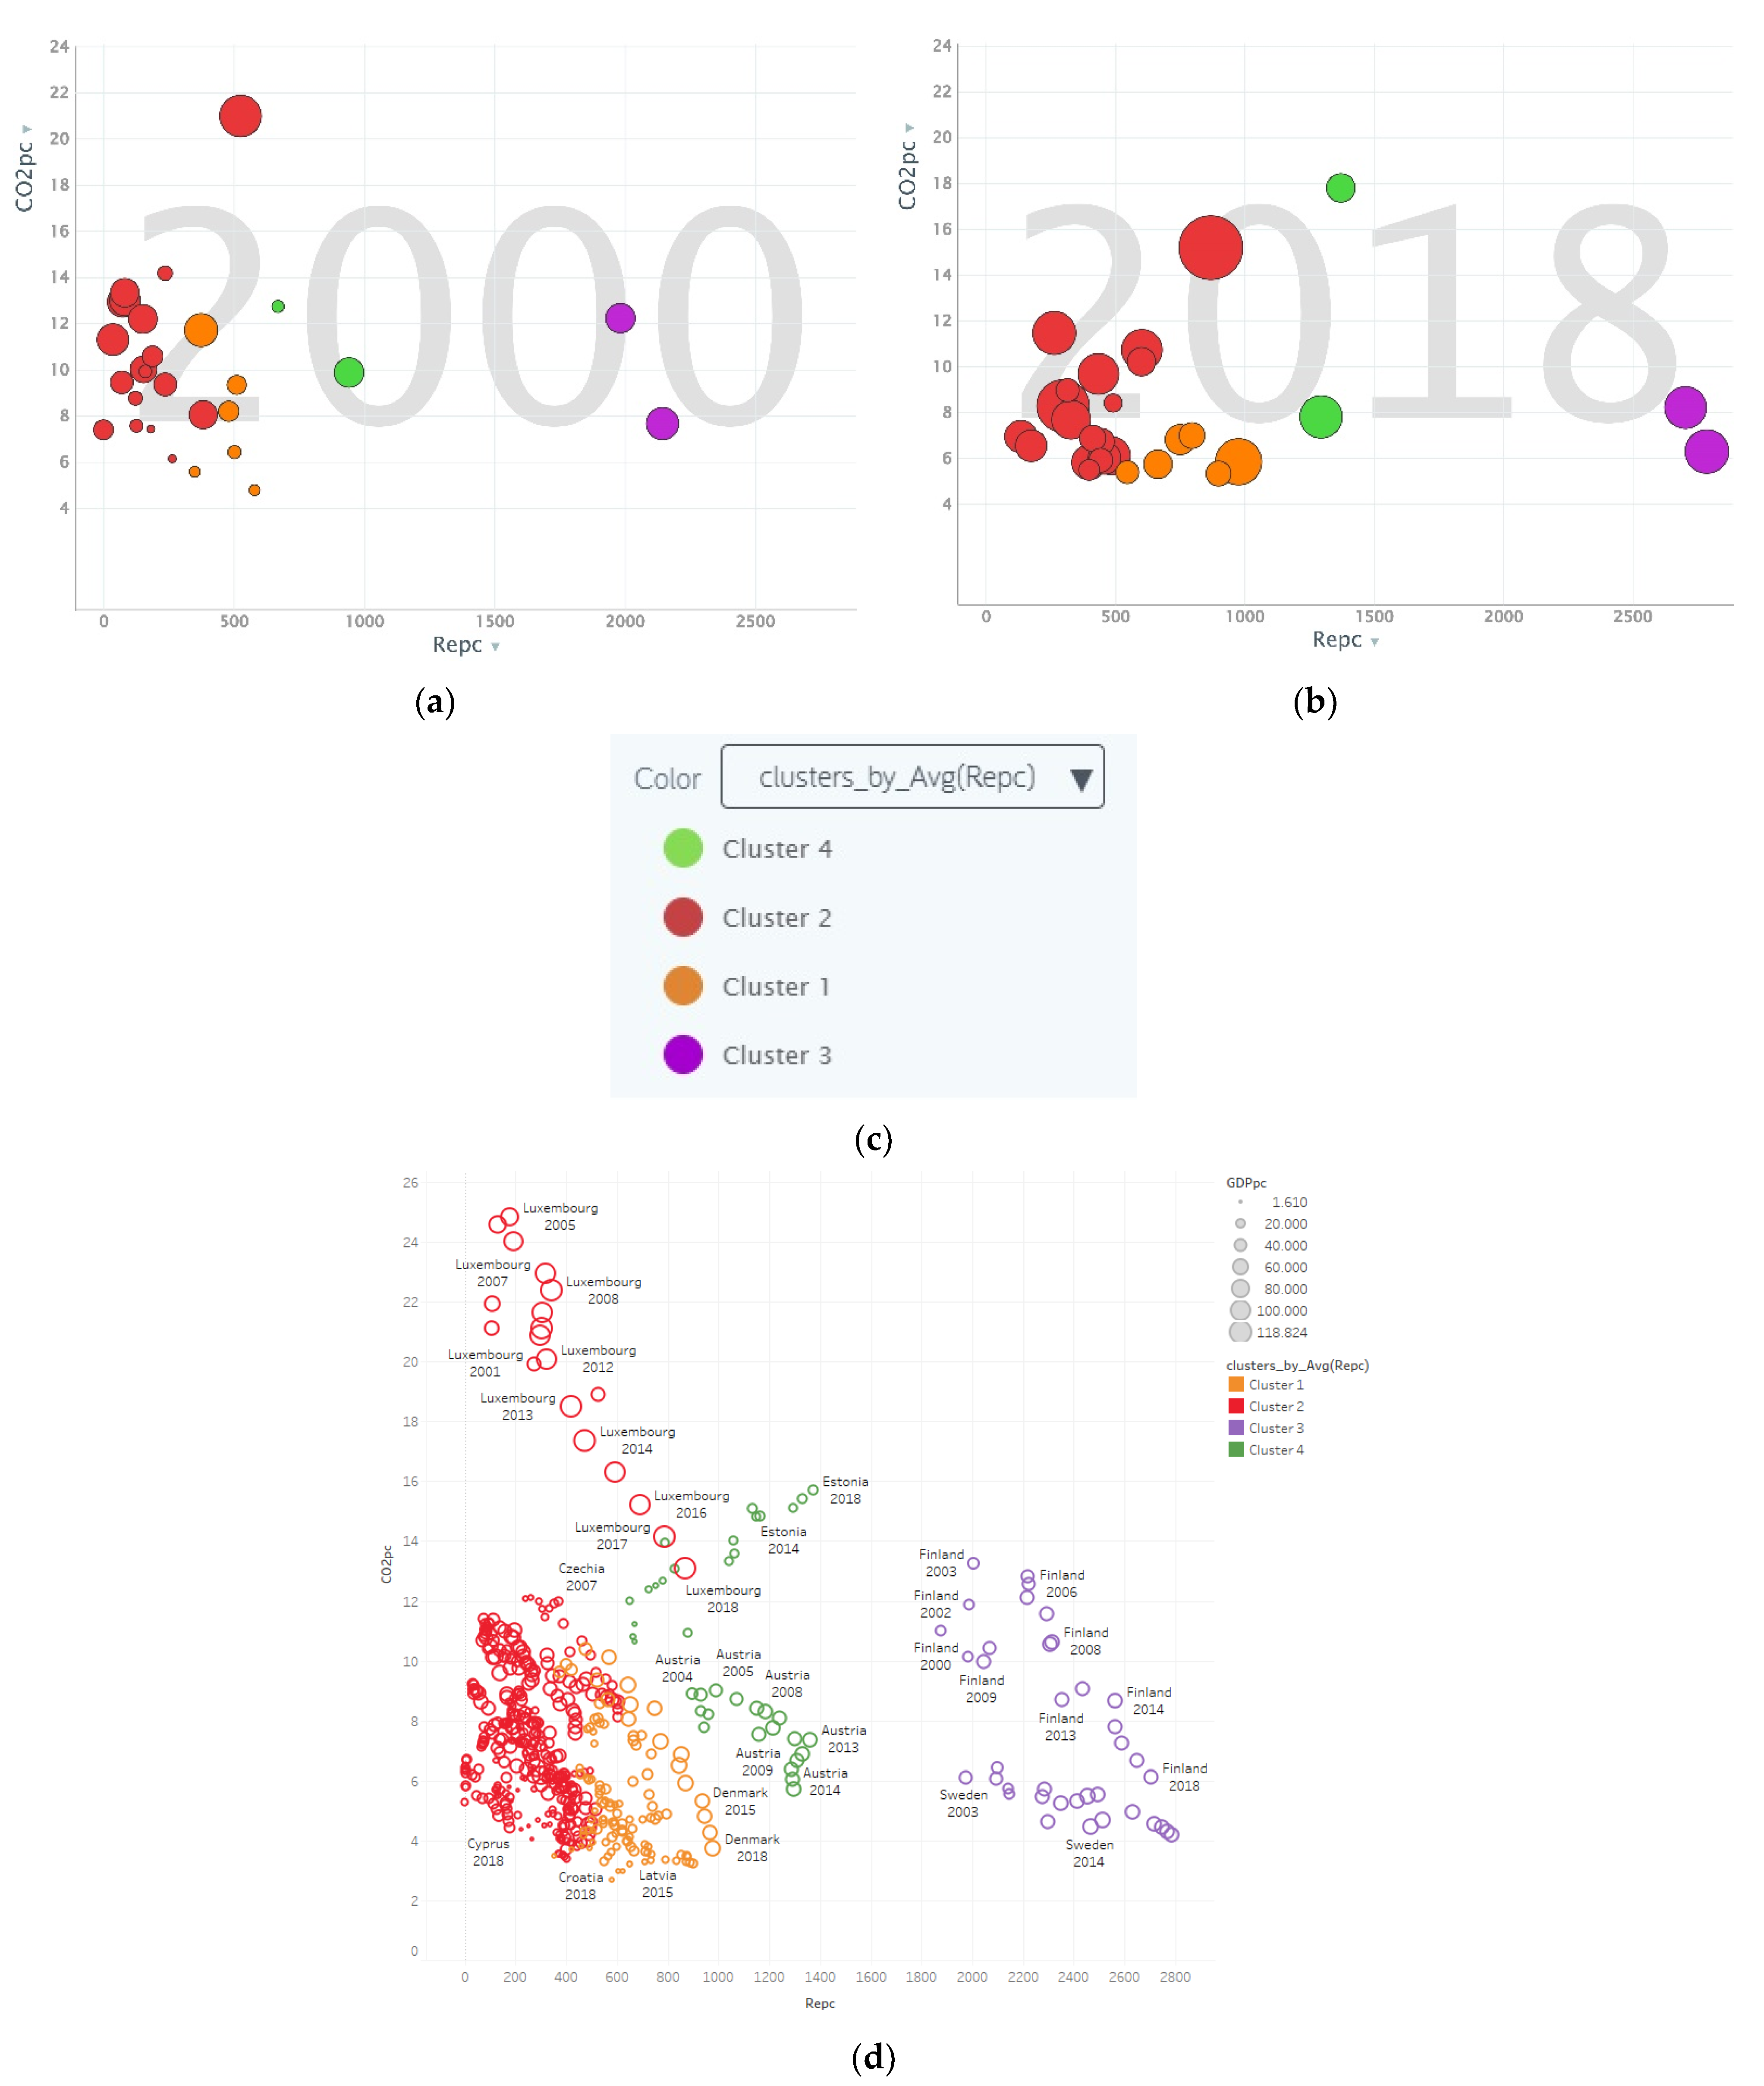
3.2. Energy Use Associated with CO2 Emissions

Let us now examine in more detail the relationship between the values of energy variables and CO2 emissions over time. To achieve this, we use bubble charts to represent four dimensions simultaneously (corresponding to variables CO2, EUpc, time, GDPpc in the charts). Figure 6b suggests a strong correlation between CO2 emissions and energy use pc for all clusters. Comparing the situation in EU 28 in 2000 and 2018, Figure 6a suggest a weaker correlation of the two variables in 2018.
By observing the bubble chart in motion (Figure 6a,b), we can monitor the dynamic evolution of the biggest energy-consuming countries (which are Luxembourg and Finland). Although we recognize the special features of Luxembourg as a country (strategic location in Europe, social and political stability, long-standing tradition of innovation, industrial excellence etc.), we include it in the analysis. Luxembourg energy bubble reaches its highest position in 2005 and ends at the lowest position in 2018. Finland’s energy bubble reaches its highest position in 2003 and ends at the lowest position in 2018. The motion cart reveals an upward trend in the first years of study and a downward trend after the turning point of 2004, 2005. The size of the bubbles is analogous to the GDP pc in the bubble charts of Figure 6; since energy use is fully related with growth, economic growth is a parameter that must be illustrated as well.
In Figure 7a, the initial and the final situation for the fossil fuel consumption pc is depicted. Both fossil fuel pc- and CO2 pc levels have decreased in 2018. The bubble chart in Figure 7b suggests a strong correlation between CO2 emissions and fossil fuel consumption pc for all clusters.
In the motion chart, we highlight the leaders in fossil fuel consumption pc: Luxembourg and The Netherlands. Luxembourg energy bubble reaches its highest position in 2005 and ends at the lowest position in 2018. Netherlands’ energy bubble reaches its highest position in 2004 and ends at the lowest position in 2018. The motion cart reveals an upward trend in the first years of study and a downward trend after 2005. It seems that in 2005, an era of change starts, possibly reflecting the ratification of the Kyoto Protocol.
In the comparative scheme of Figure 8a, all bubbles of the chart have moved to the right, indicating increased levels of renewable energy use in later years. Figure 8b is the first chart to present an inverse relationship between energy use and CO2 emissions (with the exception of Estonia), in all clusters.

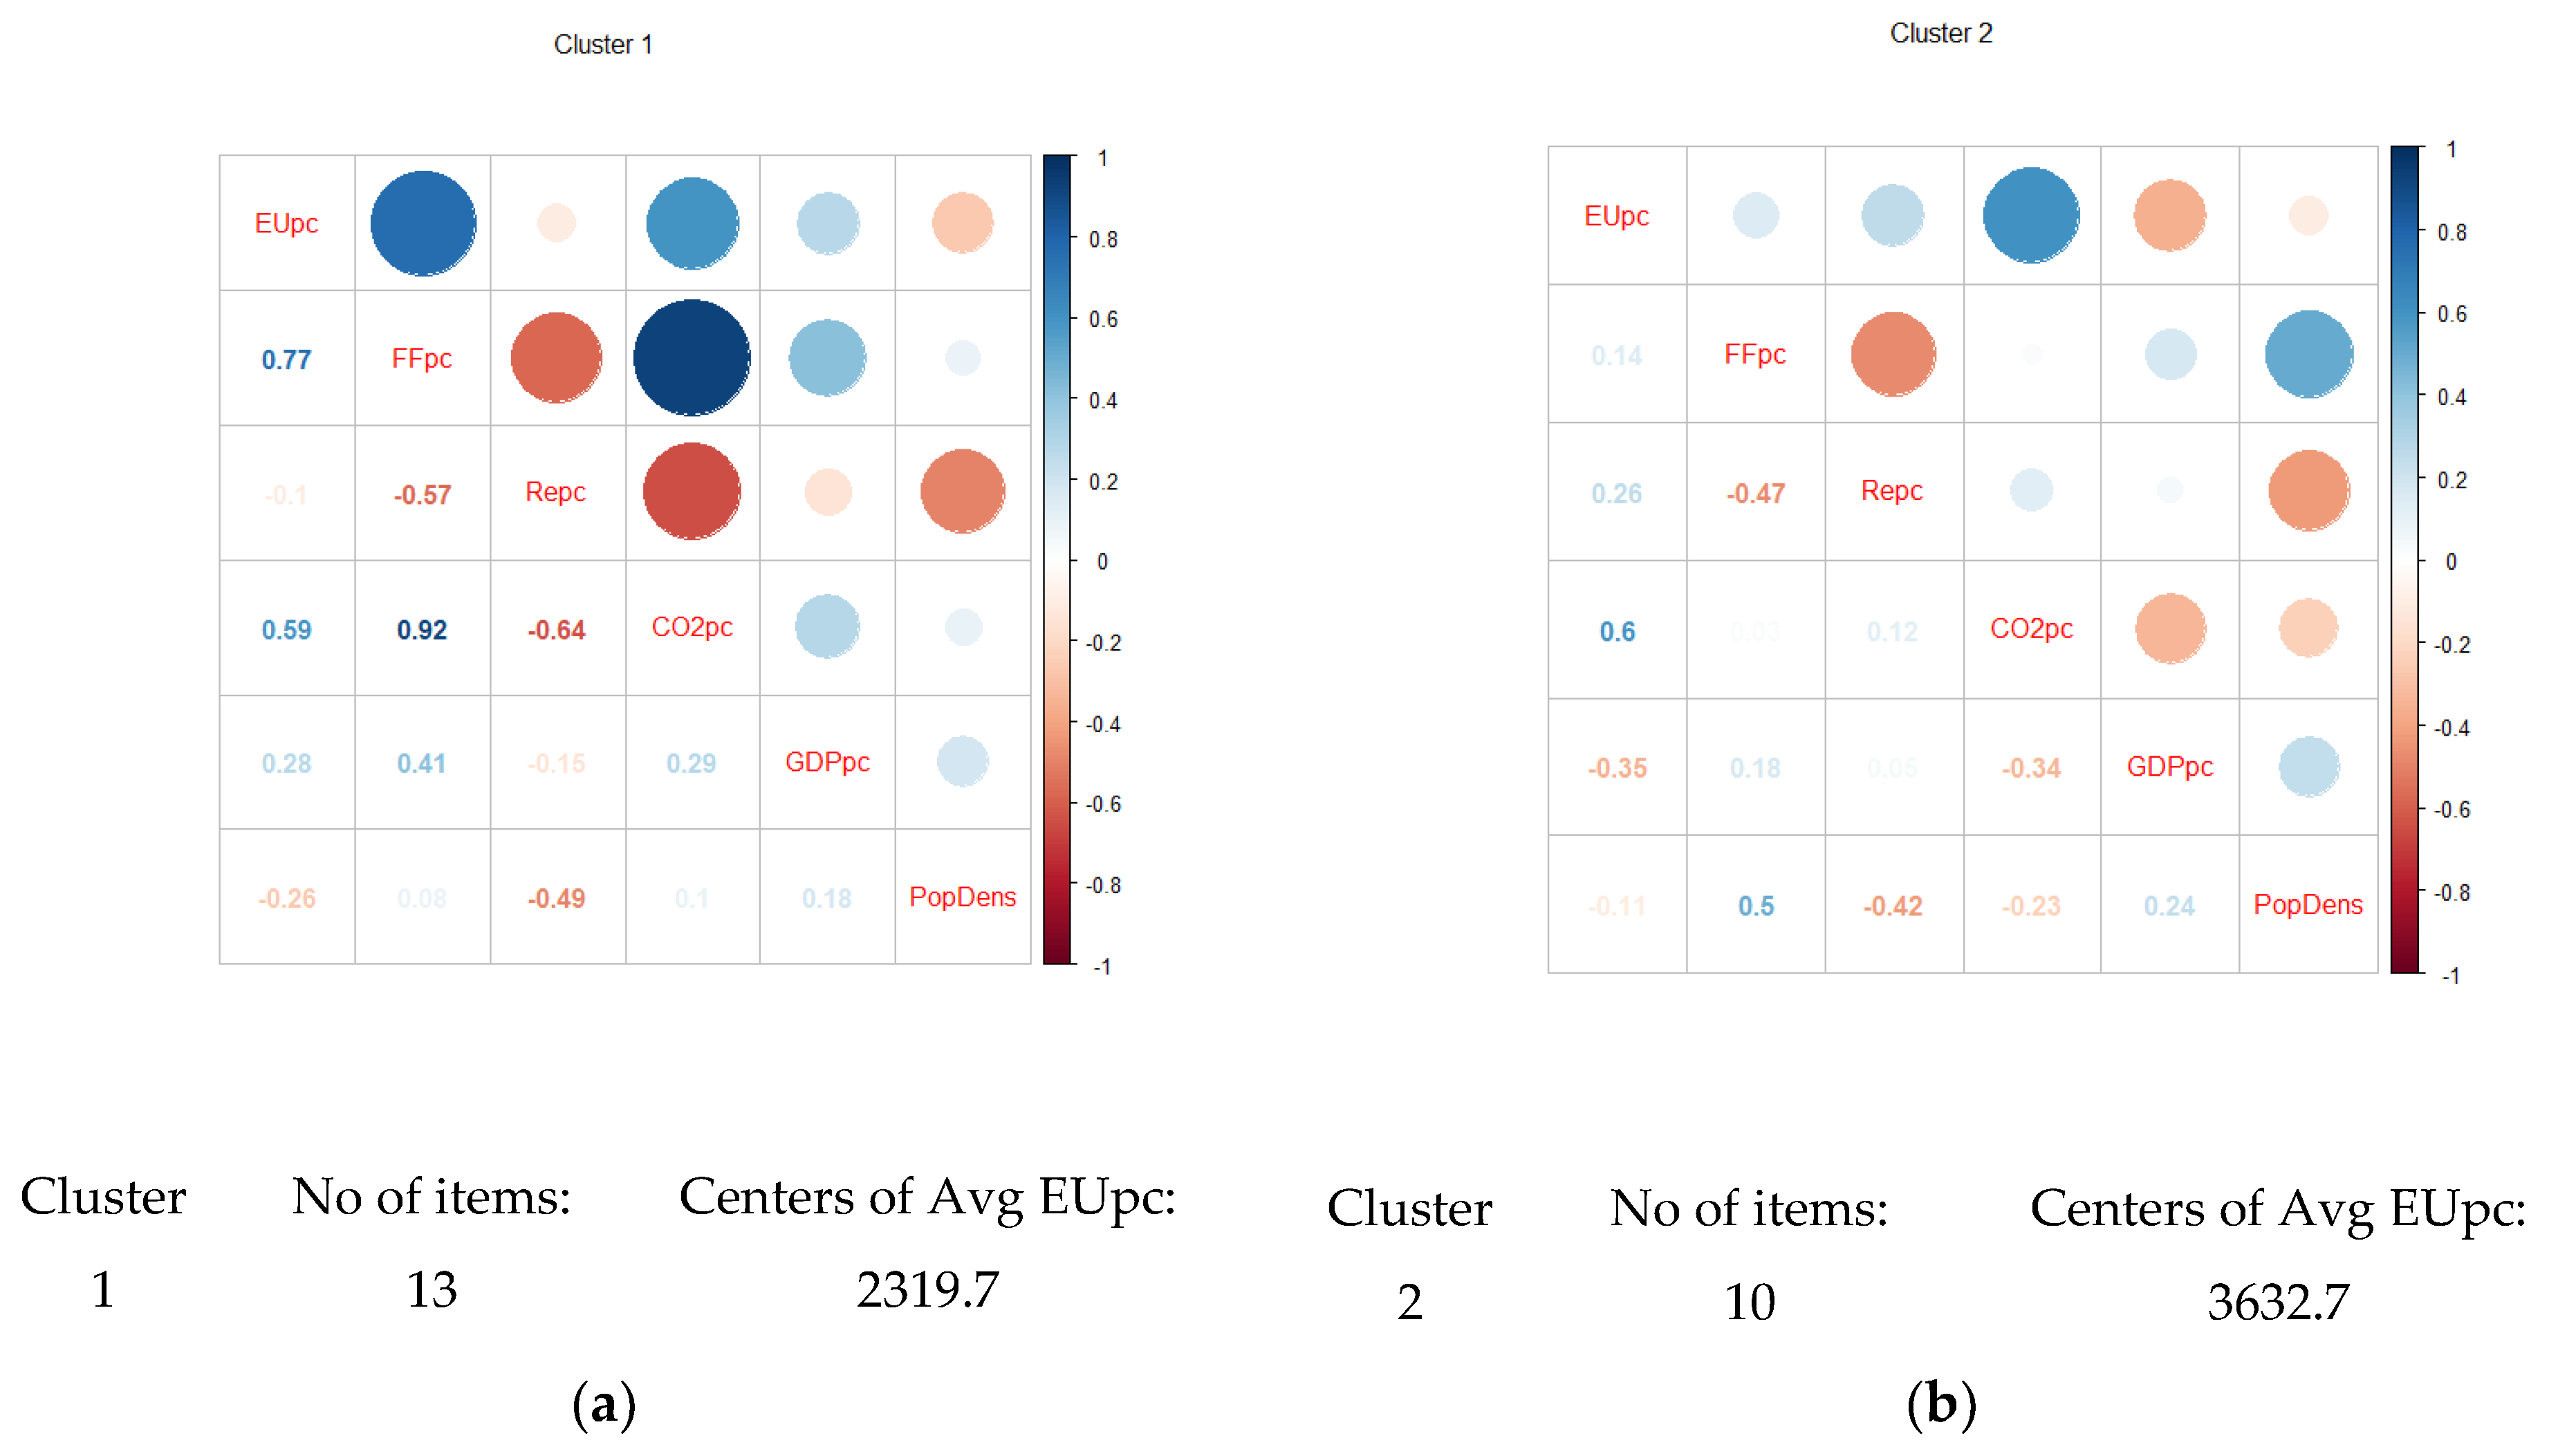
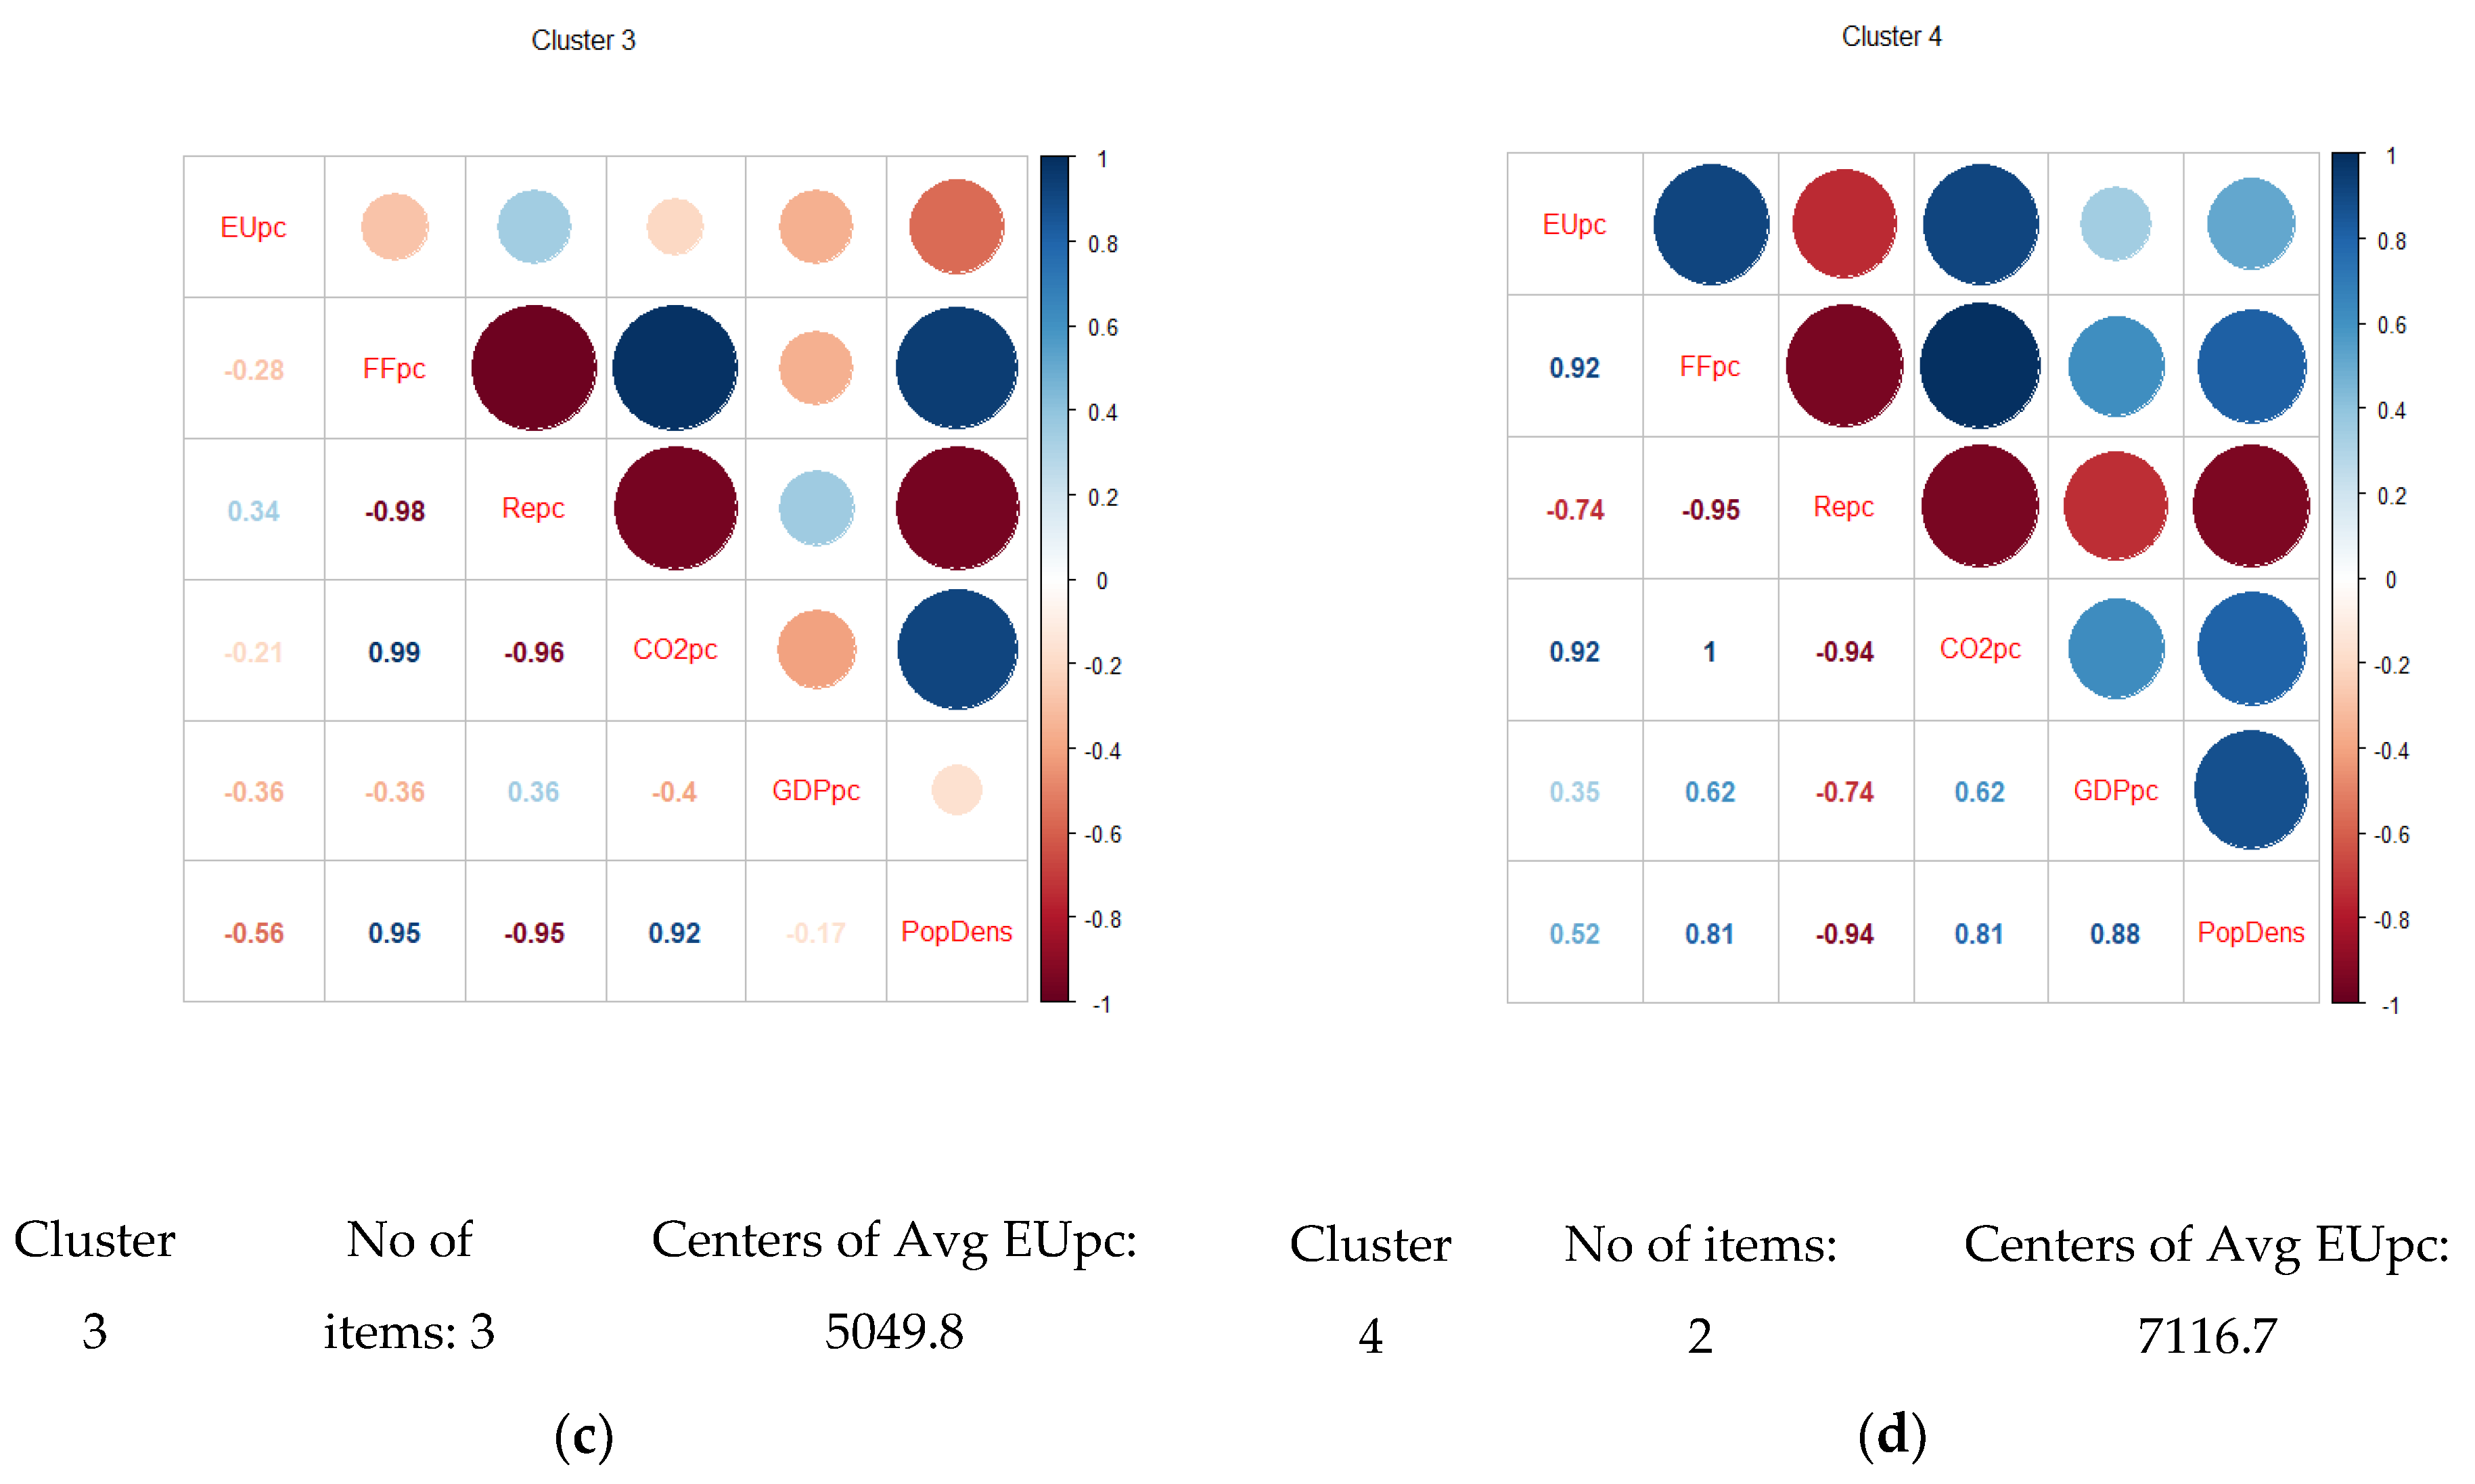
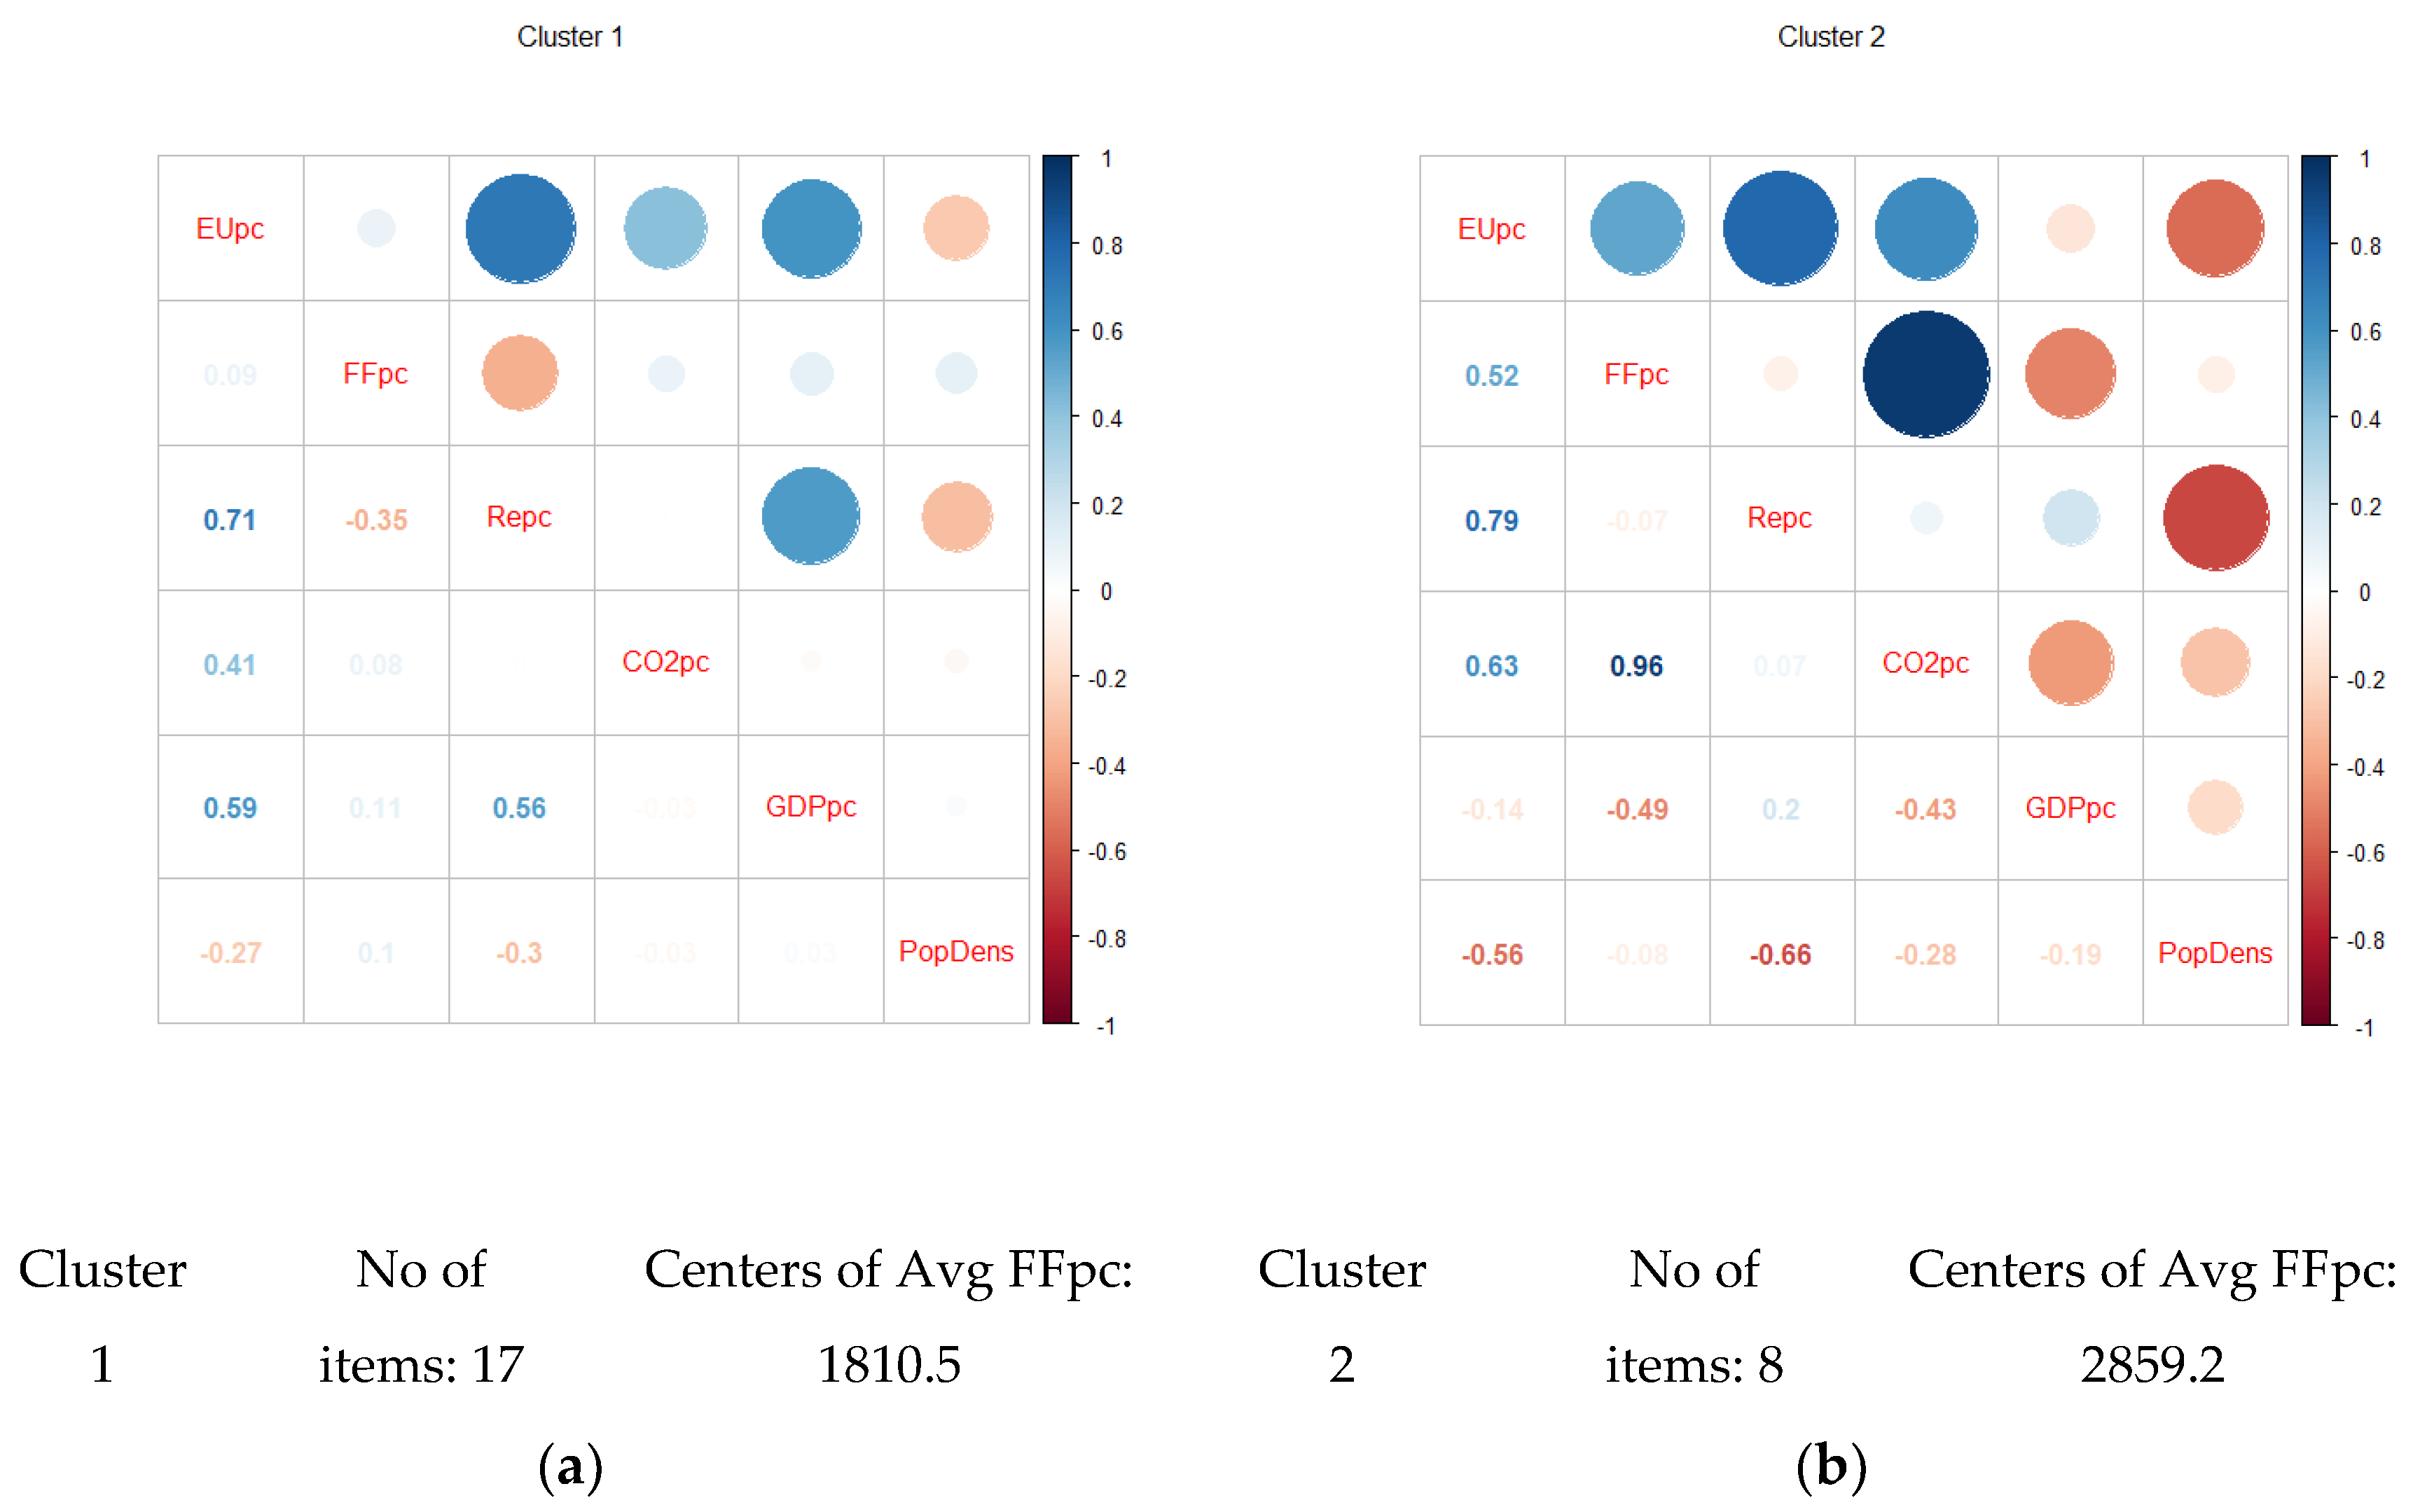
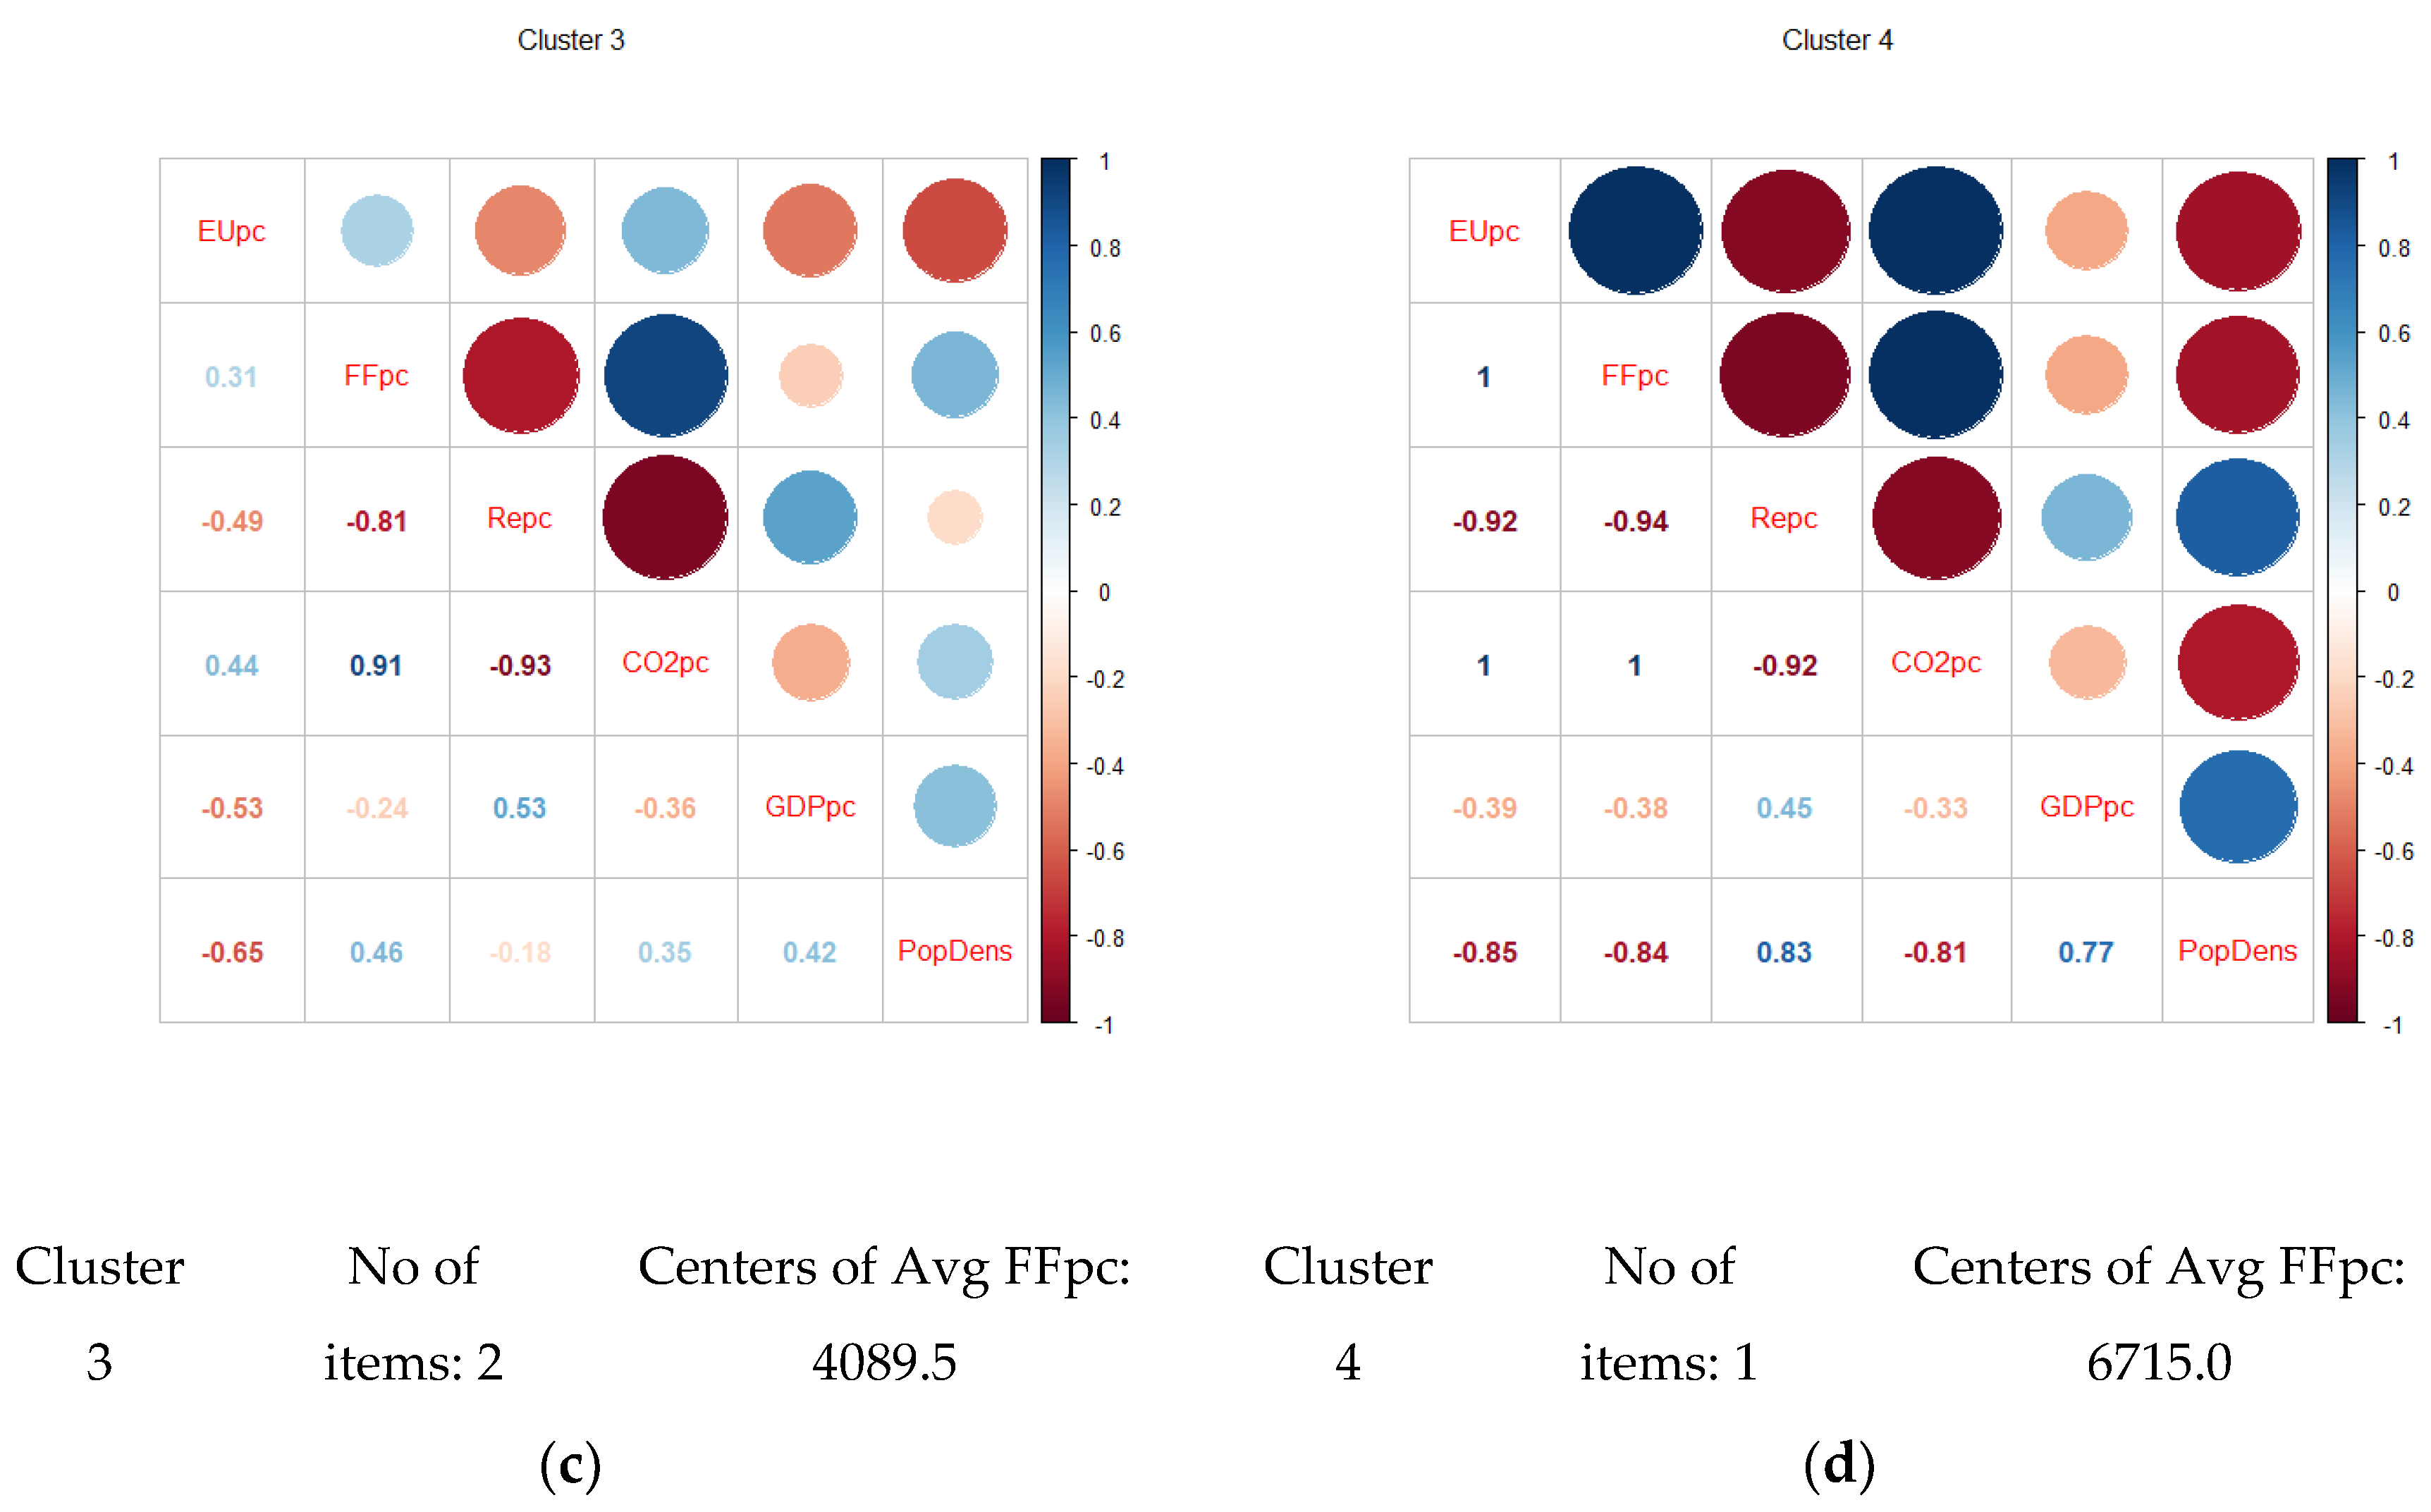
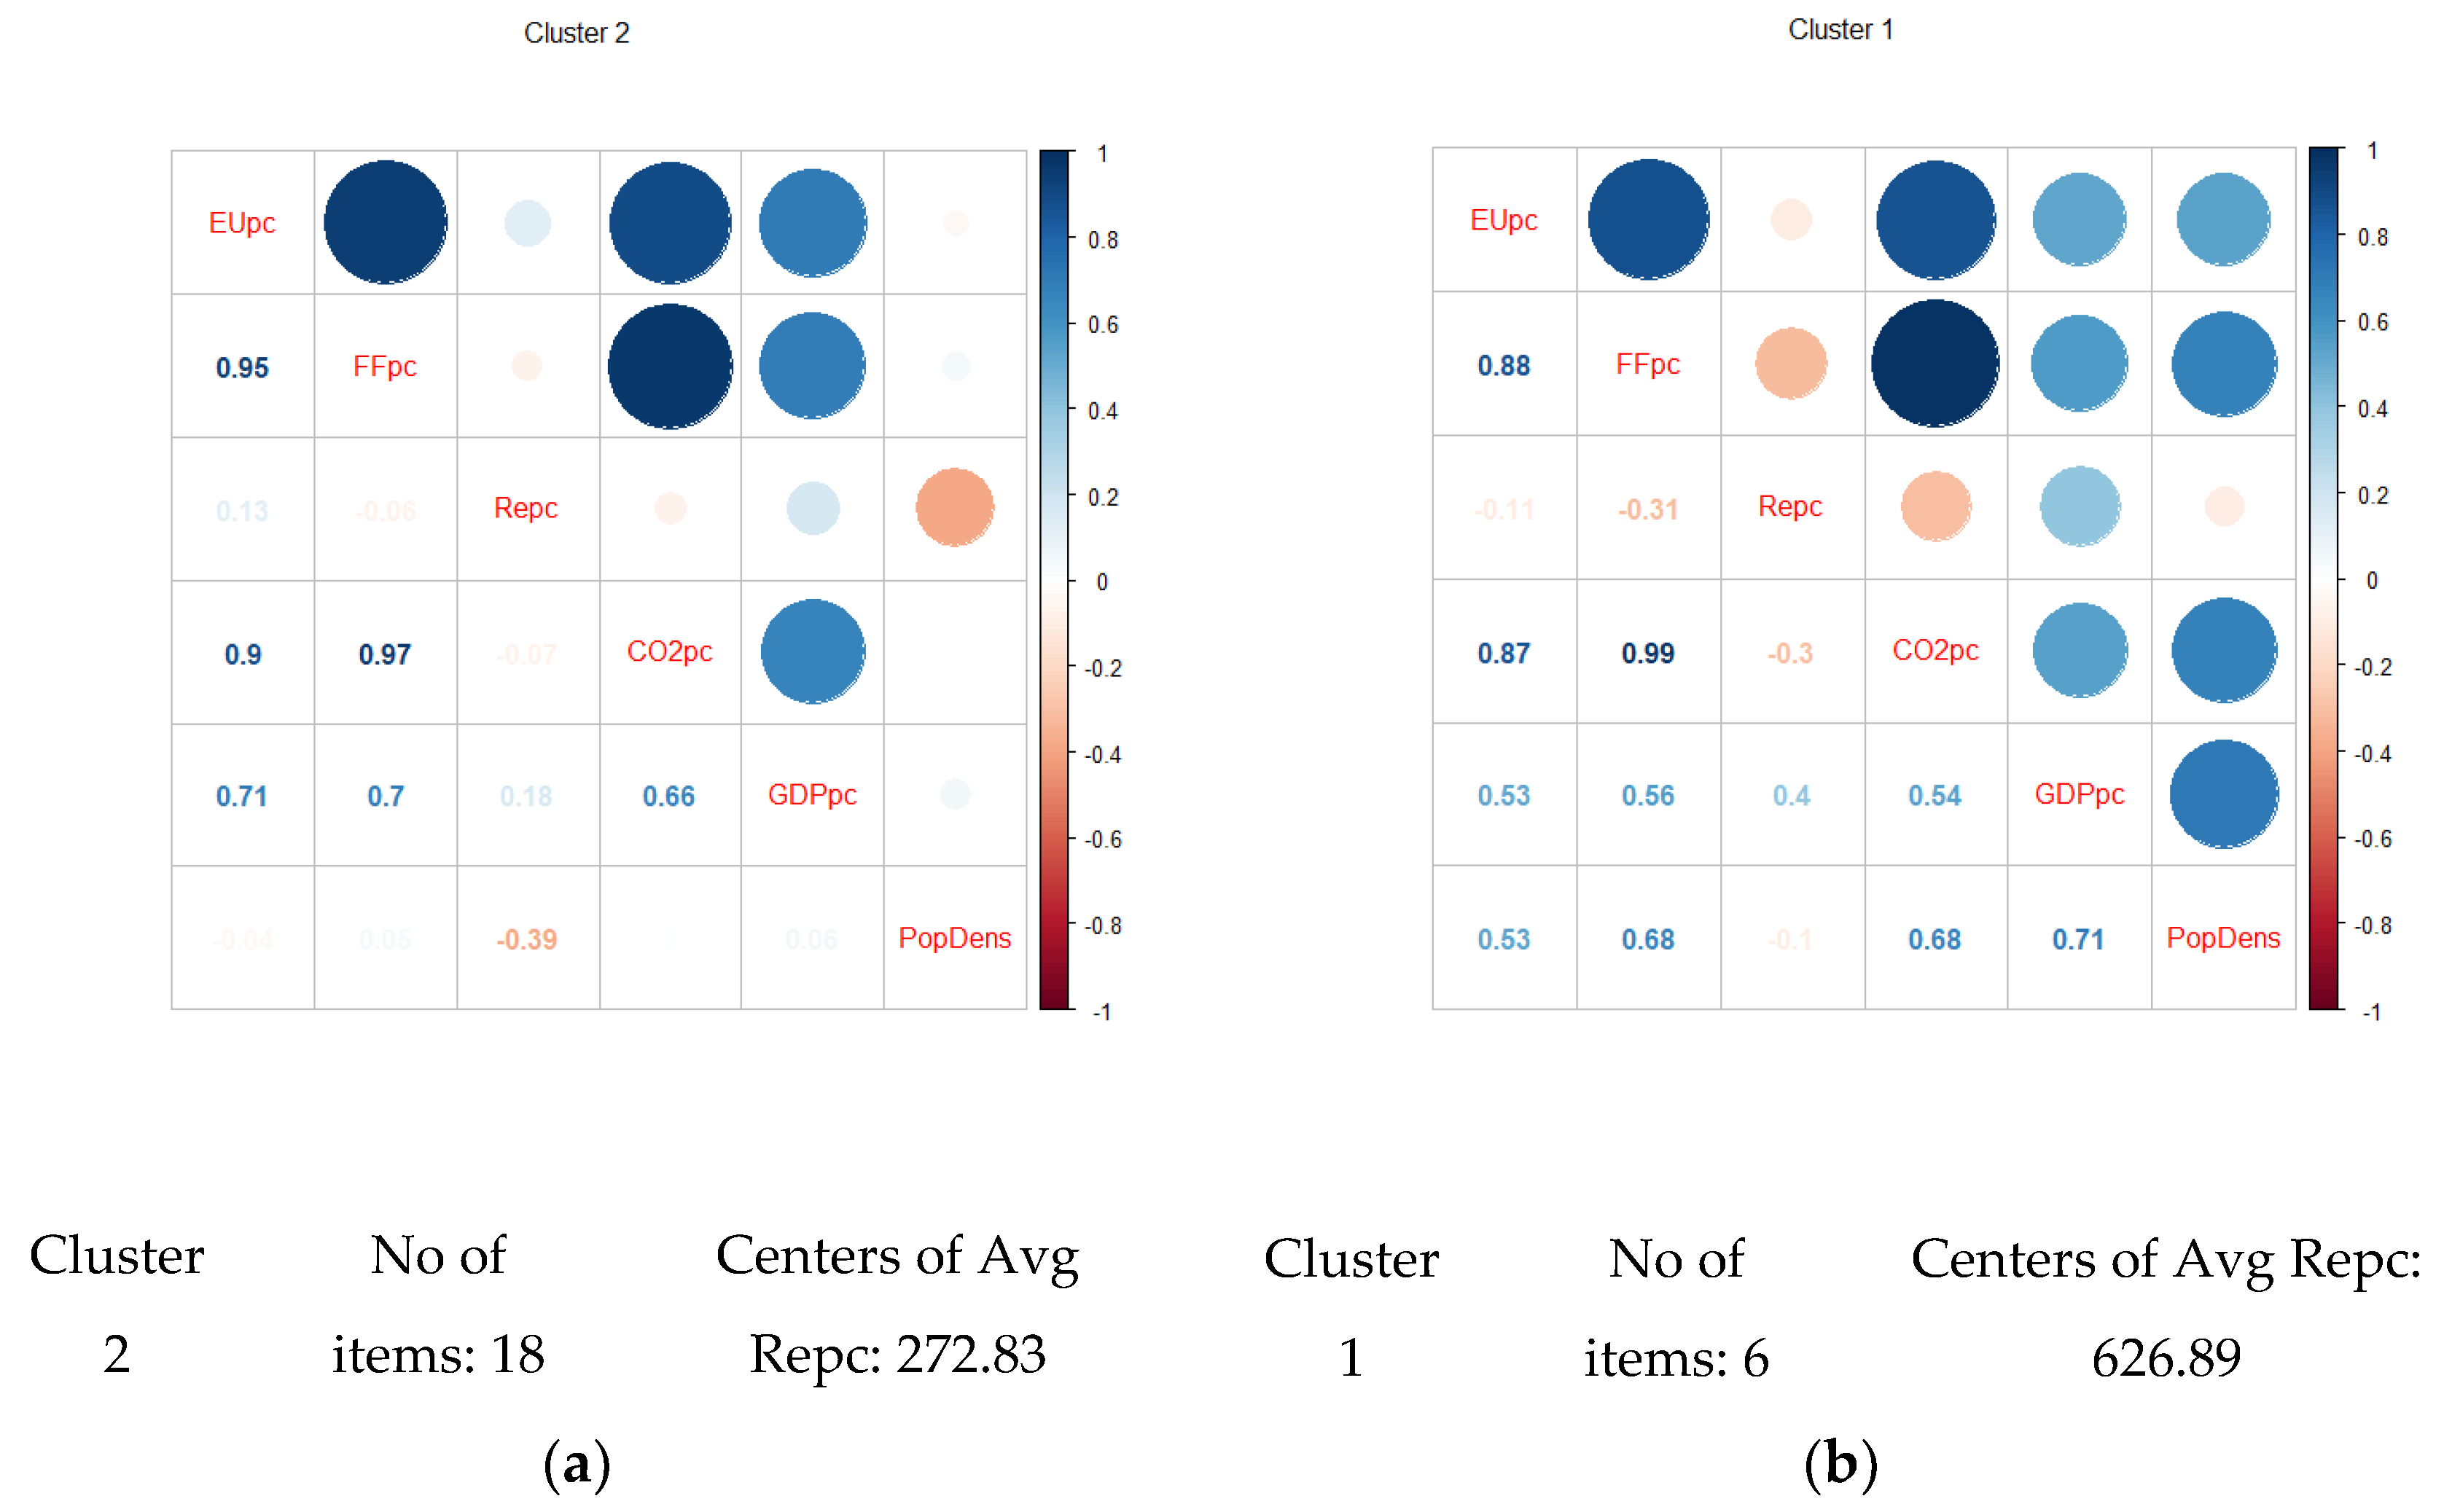
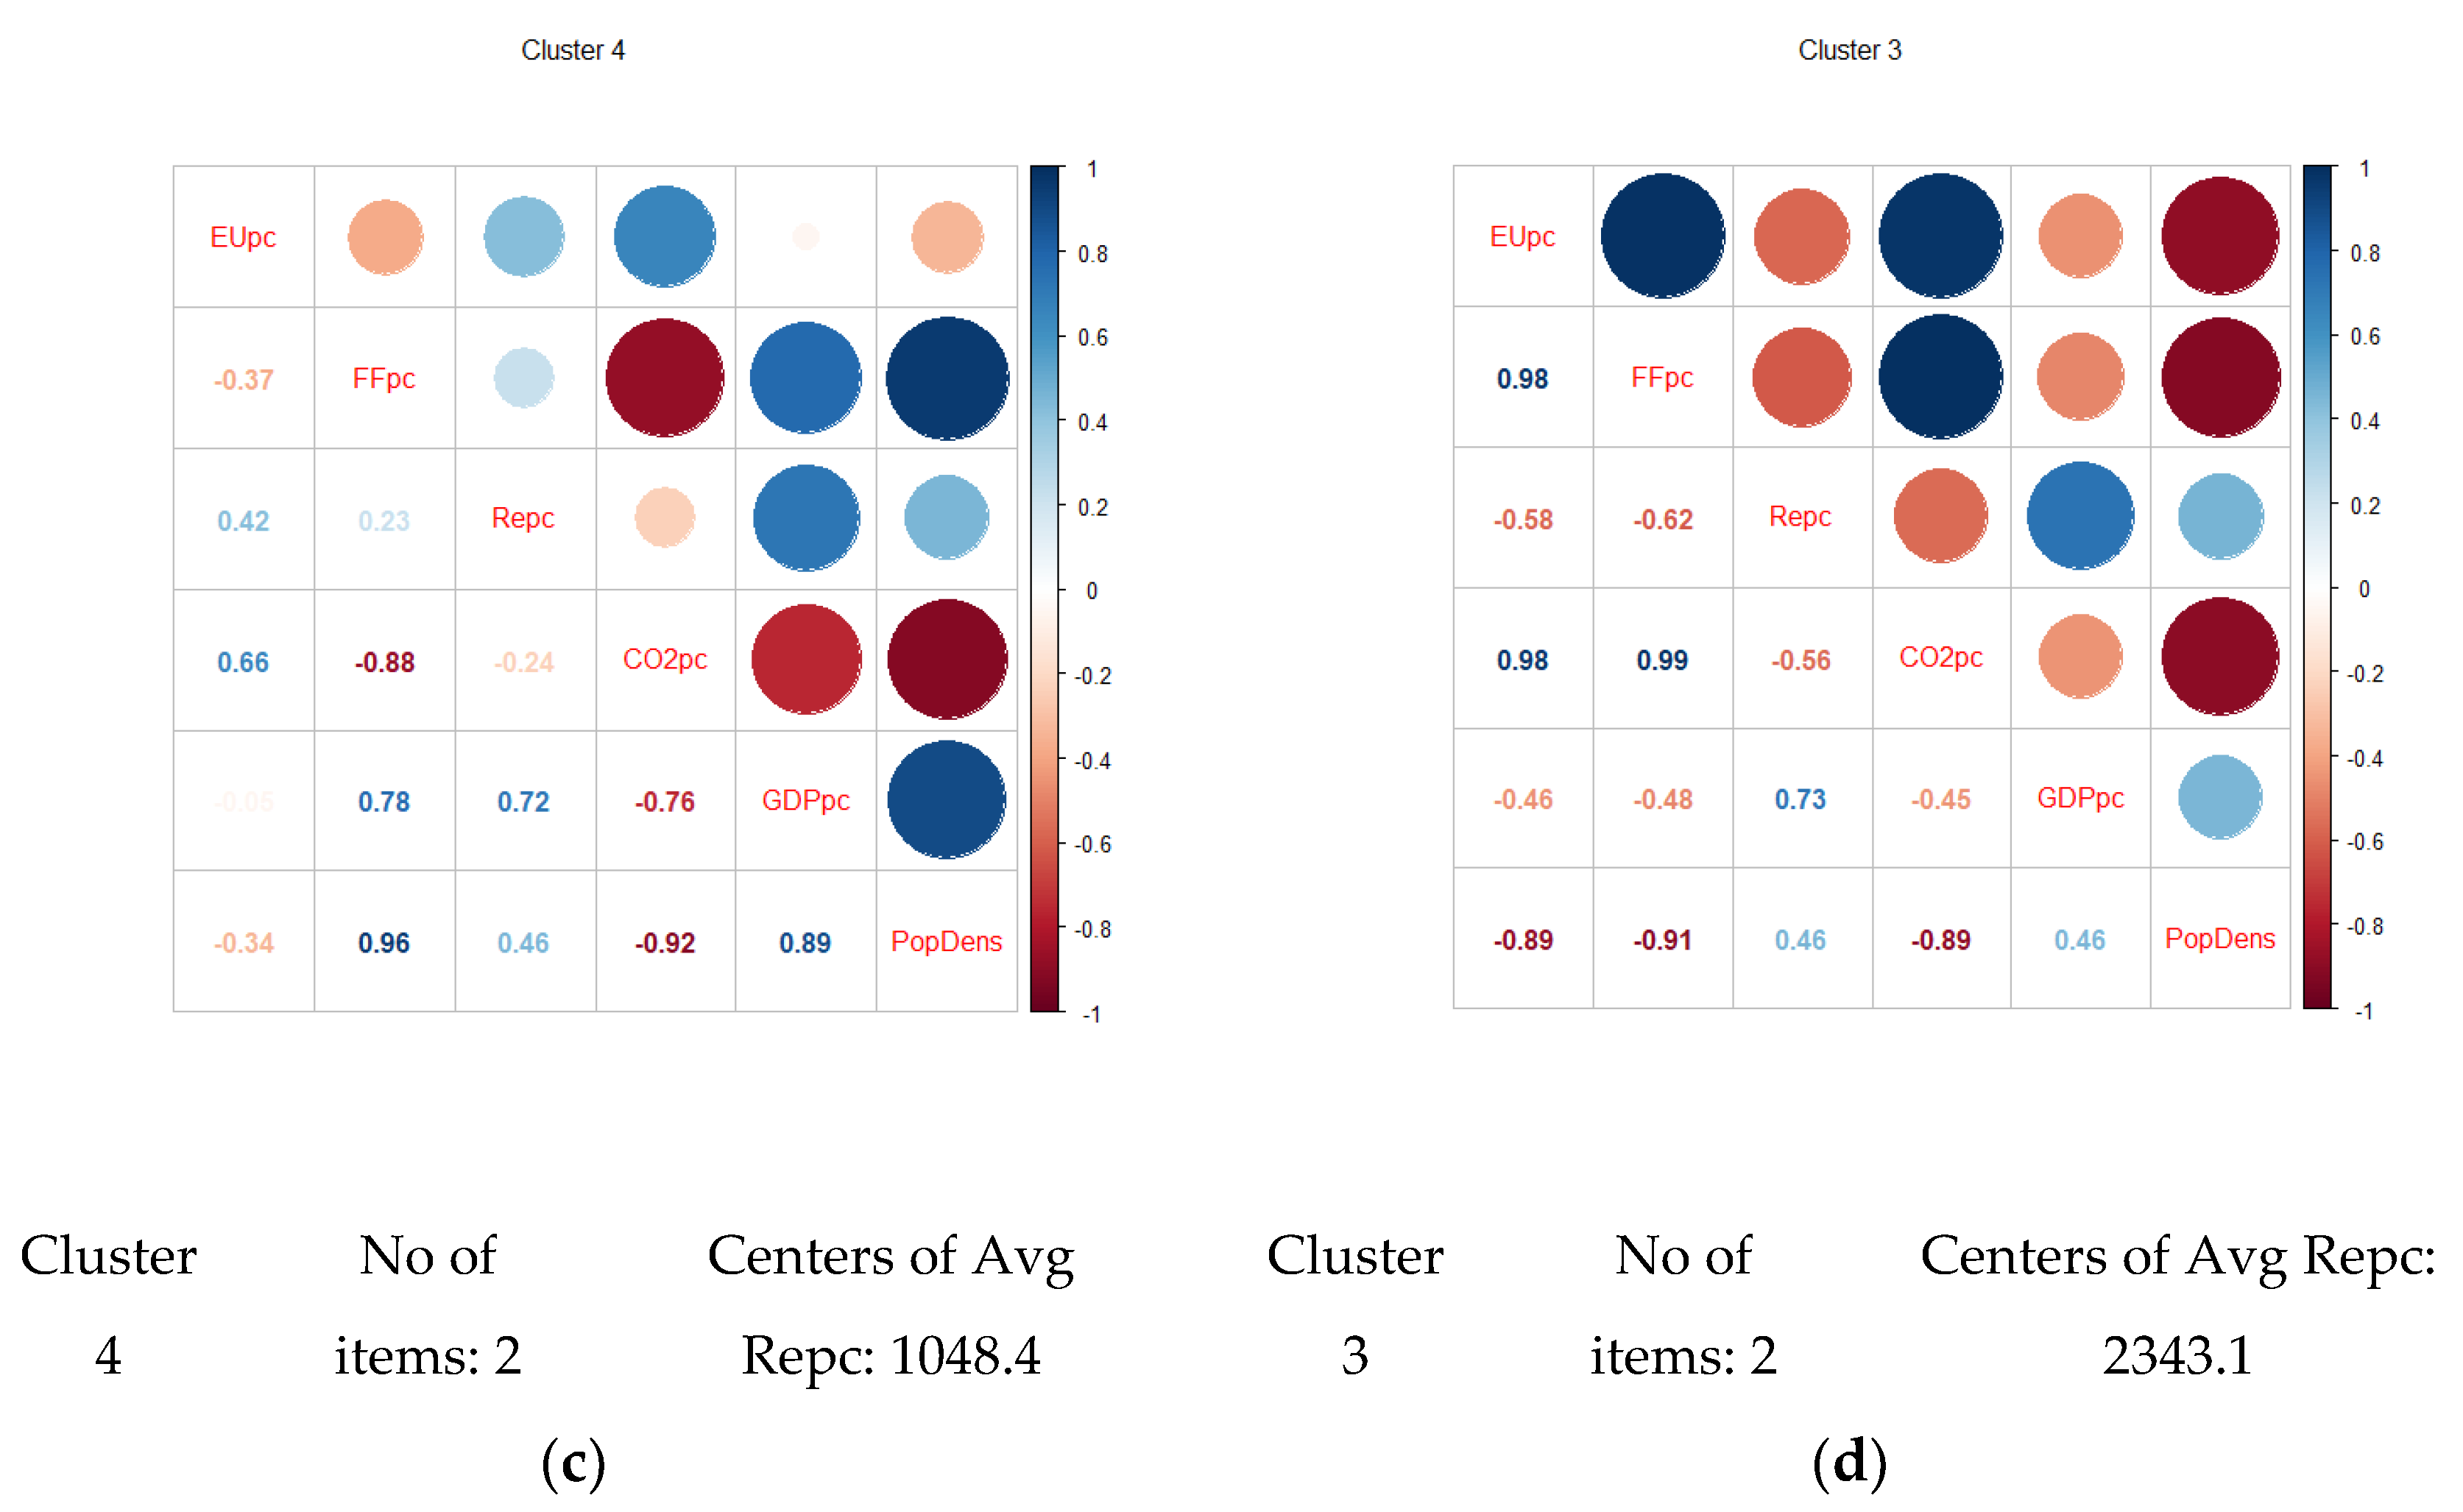
3.3. Correlation Analysis

In the present section, we assess the dependence structures between energy variables (resp. EUpc, FFpc, Repc variables) and pollution (expressed with CO2pc variable), growth variable (expressed with GDPpc variable), and population density (expressed with PopDens variable), for each one of the four clusters of countries, in correlation matrices. Pearson correlation coefficients (r) were calculated for each cluster, based on the annual data values of energy, pollution, growth variables, and population density from 2015 to 2018 (Figure 9, Figure 10 and Figure 11). The color legends indicate that positive correlation coefficients appear in shades of blue while negative correlation coefficients appear in shades of red. The sign of the correlation coefficient indicates whether the direction of the relationship is positive (direct) or negative (inverse).
In all cases of clusters, we notice strong correlations of energy variables per capita with CO2 pollution pc, GDPpc, population density. It is impressive that in all cases, correlations are stronger in clusters of higher levels of energy use. The higher the level of average energy use during the study period, the more intense the correlation among energy, pollution, and growth variables. Correlations in clusters of high energy consumption pc levels predict the actual dependence between energy use and socio-economic variables.
Figure 9, Figure 10 and Figure 11 suggest that levels of energy consumption (total energy use, fossil fuel consumption pc, renewable energy use pc correspond to EUpc, FFpc, and Repc variables in the correlation matrices respectively) and CO2 emissions per capita (CO2pc variable) are negatively correlated only in the case of renewable energy consumption pc. Specifically, in all clusters by energy variable classification (average value used over 2000–2018) a direct relationship between the energy use pc/fossil fuel consumption pc and CO2 emissions pc is observed, except for cluster 4 in classification by renewable energy consumption pc (Figure 11c), where fossil fuel consumption pc and CO2 emissions pc are having a reverse relationship. In clusters with the higher levels of energy variables (i.e., clusters 3 and 4 in Figure 9, Figure 10 and Figure 11) renewable energy pc and CO2 emissions are negatively correlated, revealing the effect of renewable energy on CO2 emissions.
Negative correlations are observed for GDP pc with energy use pc/fossil fuel pc for cluster 3 in classification by average energy use pc (Figure 9), for clusters 2, 3, and 4 in classification by average fossil fuel consumption pc (Figure 10), and strong negative correlation for cluster 3—the cluster of highest average renewable energy consumption pc—in classification by average renewable energy pc (Figure 11). It is worth noticing that many dependencies between variables in cluster 3 appear in cluster 4 reversed.

3.4. Sustainable Development and Energy Trends

Figure 12a–c depicts the evolution of the consumption of different energy resources in the top 10 energy-consuming countries in a comparative time series plot for 2000–2018. The same top energy-consuming countries are present in both non-renewable and renewable energy categories (with different rankings within each category).
Annual energy use pc and fossil fuel consumption pc of top 10 consuming countries have experienced a downward or slight downward trend from 2004 to 2018. The only upward trend observed is reported in Estonia in energy use pc consumption. Annual renewable energy consumption pc of top 10 consuming countries has experienced a constant upward or slight upward trend from 2003 to 2018. Years 2004–2006 seem to signal the change in the non-renewable energy consumption trend.
Moving towards renewable energy directives for 2020 and 2030, seven countries have already exceeded the 2030 target for renewable energy consumption which is at least a 32% share for renewable energy [50] (Figure 13). Twelve countries are well above 2020 renewable energy target (Figure 13). The European Union’s current target is for a 32% share of renewable energy across the bloc by 2030, and 20% in 2020. In Figure 14a–c, the aggregated scheme of energy trends for energy clusters reveals that the latest policy efforts reinforce the pathways towards green energy.

4. Policy Implications

Energy use is related to all main environmental problems. Acid rain, climate change and all other environmental issues of transboundary nature are close related to the proper use of energy and to the encouragement of renewable energy sources. Energy mix strongly affects environmental problems of transboundary nature. As an economy grows, obviously these issues become more urgent.
In this paper, the indication of energy clusters sets the directions for the design and application of targeted environmental policies and campaigns to raise awareness addressing countries on quality energy control. Policies can be implemented uniformly when they are applied in countries of the same cluster.
In all cases, policy choices are determined by historical, economic, social, demographic, environmental and geopolitical factors. Co-evolution, substitutivity, and intersection are effects to be considered to succeed at the optimization of energy mix. Therefore, it is practically significant to reveal the groups of countries with similar levels of energy use to differentiate accordingly air pollution control policies, energy motives, and adapt legislative and regulatory activities. All these, with the additional consideration of the economic growth of each country, the energy needs to be met, the progress on the elimination and replacement of nonrenewable energy sources. A special treatment should be placed on countries with abnormal energy consumption, i.e., the outliers of each energy variable.
Cluster analysis, correlation analysis and illustration of the dynamics of primary energy sources as presented in the previous sections, are expected to contribute to the single EU policy planning (within the European Green Deal, Energy Efficiency Directive, other EU energy and climate rules) at becoming the first climate-neutral continent by 2050.

5. Discussion and Conclusions

In this paper, we employ the infrastructure based on visual analytics technology and data integration to discuss the dynamics of energy consumption and its correlation to economic and environmental development in EU 28 territory for the period from 2000 to 2018.
Clustering is a key component of our analysis. Clustering offers the opportunity to determine which countries are similar and explore the relationships between variables driving cluster membership. In the geographical clustering proposed by the UN, no similarities or uniformity per geographical region is observed. Thus, we grouped countries into clusters according to the level of their reported renewable and nonrenewable energy use, to observe patterns and policies exempt from national legislation, tax policies, environmental motives, competitors, regulatory obstacles, market failures, energy demand, etc. K-means clustering is applied to evaluate energy inequalities among EU 28 countries. The patterns of inequality between the clusters for energy use, fossil fuel consumption, and renewable energy consumption over time are thoroughly investigated. Correlations in clusters of high energy consumption pc levels predict the actual dependence between energy use and socio-economic variables. Trends in clusters of high energy consumption pc levels may function as pathways to reveal the asymptotic situation concerning energy use.
Exploratory data analysis indicated as outlier countries (i.e., nations with very high levels of energy consumption) Luxembourg and Finland in terms of energy use pc, Luxembourg, and The Netherlands in terms of fossil fuel consumption pc, Finland, Sweden, Austria, and Estonia in terms of renewable energy pc.
One main finding is the existence of strong correlations of energy variables with CO2 emissions, repeated consistently in all energy variables in all classifications. We consider carbon dioxide emissions an environmental degradation indicator. Correlation analysis showed that the higher the level of nonrenewable energy use pc, the more intense the CO2 emissions pc. On the contrary, CO2 emissions pc demonstrate an inverse relationship with renewable energy consumption pc. An inverse relation is constantly observed between fossil fuel consumption pc and renewable energy pc, with stronger negative correlations in high-level energy consumption clusters. Our data-based visual outputs indicate that top energy-consuming countries promote sustainable global development. It is surprising to notice that in many clusters there is a contrary relation between GDP pc and energy consumption pc. This makes the evidence that rational use of energy is a key factor to socio-economic prosperity and sustainability.
The illustration of the dynamic evolution of energy consumption at national level through 2000–2018 revealed that in 2005 an era of change starts for top energy-consuming countries. Energy leaders in the European Union are moving towards a low-carbon economy since a rising trend in renewable energy consumption pc and a declining trend in fossil fuel consumption pc are evident. Nevertheless, many EU countries are way behind in meeting their 2020 or 2030 renewable energy obligations.

Supplementary Materials

The following are available online at https://www.mdpi.com/article/10.3390/en14227532/s1, Video S1: EUpc implementing and supporting Figure 6a,b, Video S2: FFpc implementing and supporting Figure 7a,b, Video S3: Repc implementing and supporting Figure 8a,b.

Author Contributions

Conceptualization, G.H. and K.T.; methodology, K.T.; software, K.T.; validation, G.H. and K.T.; data curation, G.H.; writing—original draft preparation, G.H. and K.T.; writing—review and editing, G.H. and K.T.; visualization, K.T. All authors have read and agreed to the published version of the manuscript.

Funding

This research received no external funding.

Data Availability Statement

Data are publicly available from the World Bank database (https://data.worldbank.org/, accessed on 9 November 2021). Citations of all the data are in Section 2.1 of the manuscript.

Conflicts of Interest

The authors declare no conflict of interest.

References

  1. Owusu, P.A.; Asumadu-Sarkodie, S. A review of renewable energy sources, sustainability issues and climate change mitigation. Cogent Eng. 2016, 3, 1167990. [Google Scholar] [CrossRef]
  2. Vera, I.A.; Langlois, L.M.; Rogner, H.H.; Jalal, A.I.; Toth, F.L. Indicators for sustainable energy development: An initiative by the International Atomic Energy Agency. Nat. Resour. Forum 2005, 29, 274–283. [Google Scholar] [CrossRef]
  3. United Nations. “The 17 Goals”, United Nations. 2015. Available online: https://sdgs.un.org/goals (accessed on 24 August 2021).
  4. Covert, T.; Greenstone, M.; Knittel, C.R. Will we ever stop using fossil fuels? J. Econ. Perspect. 2016, 30, 117–138. [Google Scholar] [CrossRef] [Green Version]
  5. Solomon, B.D.; Krishna, K. The coming sustainable energy transition: History, strategies, and outlook. Energy Policy 2011, 39, 7422–7431. [Google Scholar] [CrossRef]
  6. Wang, Q.; Wang, S. Is energy transition promoting the decoupling economic growth from emission growth? Evidence from the 186 countries. J. Clean. Prod. 2020, 260, 120768. [Google Scholar] [CrossRef]
  7. Bridge, G.; Bouzarovski, S.; Bradshaw, M.; Eyre, N. Geographies of energy transition: Space, place and the low-carbon economy. Energy Policy 2013, 53, 331–340. [Google Scholar] [CrossRef]
  8. Defeuilley, C. Energy transition and the future(s) of the electricity sector. Util. Policy 2019, 57, 97. [Google Scholar] [CrossRef]
  9. Hoppe, T.; de Vries, G. Social innovation and the energy transition. Sustainability 2018, 11, 141. [Google Scholar] [CrossRef] [Green Version]
  10. Steffen, B.; Egli, F.; Pahle, M.; Schmidt, T.S. Navigating the Clean Energy Transition in the COVID-19 Crisis. Joule 2020, 4, 1137–1141. [Google Scholar] [CrossRef]
  11. Ram, M.; Aghahosseini, A.; Breyer, C. Job creation during the global energy transition towards 100% renewable power system by 2050. Technol. Forecast. Soc. Chang. 2020, 151, 119682. [Google Scholar] [CrossRef]
  12. Carley, S.; Konisky, D.M. The justice and equity implications of the clean energy transition. Nat. Energy 2020, 5, 569–577. [Google Scholar] [CrossRef]
  13. Garcia-Casals, X.; Ferroukhi, R.; Parajuli, B. Measuring the socio-economic footprint of the energy transition. Energy Transit. 2019, 3, 105–118. [Google Scholar] [CrossRef] [Green Version]
  14. Patel, N. Environmental and Economical Effects of Fossil Fuels. J. Recent Res. Eng. Technol. ISSN 2014, 1, 1–12. [Google Scholar]
  15. Marques, A.C.; Fuinhas, J.A.; Pereira, D.A. Have fossil fuels been substituted by renewables? An empirical assessment for 10 European countries. Energy Policy 2018, 116, 257–265. [Google Scholar] [CrossRef]
  16. Apergis, N.; Payne, J.E. Renewable energy consumption and economic growth: Evidence from a panel of OECD countries. Energy Policy 2010, 38, 656–660. [Google Scholar] [CrossRef]
  17. Inglesi-Lotz, R. The impact of renewable energy consumption to economic growth: A panel data application. Energy Econ. 2016, 53, 58–63. [Google Scholar] [CrossRef] [Green Version]
  18. Bhattacharya, M.; Paramati, S.R.; Ozturk, I.; Bhattacharya, S. The effect of renewable energy consumption on economic growth: Evidence from top 38 countries. Appl. Energy 2016, 162, 733–741. [Google Scholar] [CrossRef]
  19. Adams, S.; Klobodu, E.K.M.; Apio, A. Renewable and non-renewable energy, regime type and economic growth. Renew. Energy 2018, 125, 755–767. [Google Scholar] [CrossRef]
  20. Measham, T.G.; Fleming, D.A.; Schandl, H. A conceptual model of the socioeconomic impacts of unconventional fossil fuel extraction. Glob. Environ. Chang. 2016, 36, 101–110. [Google Scholar] [CrossRef] [Green Version]
  21. Sheikh, N.J.; Kocaoglu, D.F.; Lutzenhiser, L. Social and political impacts of renewable energy: Literature review. Technol. Forecast. Soc. Chang. 2016, 108, 102–110. [Google Scholar] [CrossRef]
  22. Karytsas, S.; Mendrinos, D.; Karytsas, C. Measurement methods of socioeconomic impacts of renewable energy projects. IOP Conf. Ser. Earth Environ. Sci. 2020, 410, 012087. [Google Scholar] [CrossRef]
  23. Bogmans, C.; Kiyasseh, L.; Matsumoto, A.; Pescatori, A.; Milesi Ferretti, G.M. Energy, Efficiency Gains and Economic Development: When Will Global Energy Demand Saturate? IMF Work. Pap. 2020, 253, A001. [Google Scholar] [CrossRef]
  24. Saint Akadiri, S.; Alola, A.A.; Akadiri, A.C.; Alola, U.V. Renewable energy consumption in EU-28 countries: Policy toward pollution mitigation and economic sustainability. Energy Policy 2019, 132, 803–810. [Google Scholar] [CrossRef]
  25. Topolewski, Ł. Relationship between Energy Consumption and Economic Growth in European Countries: Evidence from Dynamic Panel Data Analysis. Energies 2021, 14, 3565. [Google Scholar] [CrossRef]
  26. Saidi, K.; Hammami, S. The impact of CO2 emissions and economic growth on energy consumption in 58 countries. Energy Rep. 2015, 1, 62–70. [Google Scholar] [CrossRef] [Green Version]
  27. Osobajo, O.A.; Otitoju, A.; Otitoju, M.A.; Oke, A. The impact of energy consumption and economic growth on carbon dioxide emissions. Sustainability 2020, 12, 7965. [Google Scholar] [CrossRef]
  28. Tsemekidi-Tzeiranaki, S.; Bertoldi, P.; Paci, D.; Castellazzi, L.; Serrenho, T.; Economidou, M.; Zangheri, P. Energy Consumption and Energy Efficiency Trends in the EU-28, 2000–2018; EUR 30328 EN. Available online: https://www.iea.org/reports/european-union-2020 (accessed on 9 November 2021).
  29. International Energy Agency. European Union 2020. In Energy Policy Review; Elsevier: Amsterdam, The Netherlands, 2020. [Google Scholar]
  30. Olkuski, T.; Suwała, W.; Wyrwa, A.; Zyśk, J.; Tora, B. Primary energy consumption in selected EU Countries compared to global trends. Open Chem. 2021, 19, 503–510. [Google Scholar] [CrossRef]
  31. Keim, D.A.; Mansmann, F.; Thomas, J.; Keim, D. Visual Analytics: How Much Visualization and How Much Analytics? ACM SIGKDD Explor. Newsl. 2010, 11, 5–8. [Google Scholar] [CrossRef]
  32. Kielman, J.; Thomas, J.; May, R. Introduction: Foundations and frontiers in visual analytics. Inf. Vis. 2009, 8, 239–246. [Google Scholar] [CrossRef]
  33. Keim, D.A.; Mansmann, F.; Schneidewind, J.; Thomas, J.; Ziegler, H. Visual Analytics: Scope and Challenges. In Lecture Notes in Computer Science; Simoff, S.J., Böhlen, M.H., Mazeika, A., Eds.; Springer: Berlin/Heidelberg, Germany, 2008; Volume 4404. [Google Scholar]
  34. Yao, X.; Yasmeen, R.; Padda, I.U.H.; Shah, W.U.H.; Kamal, M.A. Inequalities by energy sources: An assessment of environmental quality. PLoS ONE 2020, 15, e0230503. [Google Scholar] [CrossRef] [Green Version]
  35. World Bank. Energy Use (kg of Oil Equivalent per Capita). Atlas Method [Data File], World Development Indicators, The World Bank Group. 2021. Available online: https://data.worldbank.org/indicator/EG.USE.PCAP.KG.OE (accessed on 24 August 2021).
  36. World Bank. Fossil Fuel Energy Consumption (% of Total). Atlas Method [Data File], World Development Indicators, The World Bank Group. 2021. Available online: https://data.worldbank.org/indicator/EG.USE.COMM.FO.ZS (accessed on 24 August 2021).
  37. World Bank. Renewable Energy Consumption (% of Total Final Energy Consumption). Atlas Method [Data File], World Development Indicators, The World Bank Group. 2021. Available online: https://data.worldbank.org/indicator/EG.FEC.RNEW.ZS (accessed on 24 August 2021).
  38. World Bank. CO2 Emissions (Metric Tons per Capita). Atlas Method [Data File], World Development Indicators, The World Bank Group. 2021. Available online: https://data.worldbank.org/indicator/EN.ATM.CO2E.PC (accessed on 24 August 2021).
  39. World Bank. GDP (Current US$). Atlas Method [Data File], World Development Indicators, The World Bank Group. 2021. Available online: https://data.worldbank.org/indicator/NY.GDP.MKTP.CD (accessed on 24 August 2021).
  40. World Bank. Population Density (People per sq. km of Land Area). Atlas Method [Data File], World Development Indicators, The World Bank Group. 2021. Available online: https://data.worldbank.org/indicator/EN.POP.DNST (accessed on 24 August 2021).
  41. Mauri, M.; Elli, T.; Caviglia, G.; Uboldi, G.; Azzi, M. RAWGraphs: A Visualisation Platform to Create Open Outputs. In Proceedings of the 12th Biannual Conference on Italian SIGCHI Chapter, Cagliari, Italy, 18–20 September 2017. [Google Scholar] [CrossRef] [Green Version]
  42. IBM Corp. Released, IBM SPSS Statistics for Windows; IBM Corp: Armonk, NY, USA, 2019. [Google Scholar]
  43. Gapminder. Available online: https://www.gapminder.org/tools-offline/ (accessed on 9 November 2021).
  44. Harrell, F.E. With Contributions from Charles Dupont and Many Others. Hmisc: Harrell Miscellaneous. R Package Version 4.4-1. Resource Document. 2020. Available online: https://cran.r-project.org/web/packages/Hmisc/Hmisc.pdf (accessed on 9 November 2021).
  45. Wei, T.; Simko, V. R Package ‘Corrplot’: Visualization of a Correlation Matrix (Version 0.84). Available online: https://cran.rstudio.com/web/packages/corrplot/corrplot.pdf (accessed on 9 November 2021).
  46. R Core Team. R: A Language and Environment for Statistical Computing. R Foundation for Statistical Computing, Vienna, Austria. Available online: https://www.R-project.org/ (accessed on 9 November 2021).
  47. Veglis, A. Tableau Software; Encyclopedia of Big Data; Schintler, L., McNeely, C., Eds.; Springer: Cham, Switzerland, 2020. [Google Scholar] [CrossRef]
  48. Tableau Software. Big Data-TRENDS FÜR 2017; Tableau: Seattle, WA, USA, 2017. [Google Scholar]
  49. Mackinlay, J.D.; Winslow, K. Designing Great Visualizations; Tableau: Seattle, WA, USA, 2015. [Google Scholar]
  50. European Commission. 2030 Climate & Energy Framework. Available online: https://ec.europa.eu/clima/eu-action/climate-strategies-targets/2030-climate-energy-framework_en (accessed on 9 November 2021).
Figure 1. Different views for clusters of countries in Europe according to energy variables (clustering according to the United Nations Geoscheme). Sums over 2000–2018 period: (a) energy use pc (sums over 2000–2018) in circle packing; (b) energy use pc (sums over 2000–2018) in bar chart; (c) fossil fuel consumption pc (sums over 2000–2018) in circle packing; (d) fossil fuel consumption pc (sums over 2000–2018) in bar chart; (e) renewable energy consumption pc (sums over 2000–2018) in circle packing; (f) renewable energy consumption pc (sums over 2000–2018) in bar chart.
Energies 14 07532 g001aEnergies 14 07532 g001b
Figure 2. Clusters of countries in Europe according to energy variables: (a) energy use pc (average of 2000–2018); (b) deScheme 2000. (c) fossil fuel consumption pc (average of 2000–2018); (d) description of clusters according to fossil fuel consumption pc (average of 2000–2018); (e) renewable energy pc (average of 2000–2018); (f) description of clusters according to renewable energy pc (average of 2000–2018).
Energies 14 07532 g002aEnergies 14 07532 g002b
Figure 3. Range of values for: (a) clusters of countries according to energy use pc (average of 2000–2018); (b) clusters of countries according to fossil fuel consumption pc (average of 2000–2018); (c) clusters of countries according to renewable energy pc (average of 2000–2018).
Energies 14 07532 g003aEnergies 14 07532 g003b
Figure 4. Energy use in EU 28 (confidence intervals for means over 2000–2018)—disaggregated results.
Energies 14 07532 g004
Figure 5. Outlier countries (from left to right) in energy use pc, fossil fuel consumption pc, and renewable energy pc of EU 28. (a) National identification of outliers; (b) Year information for outliers.
Energies 14 07532 g005
Figure 6. The relationship between energy use pc and CO2 emissions pc in EU-28 (2000–2018). Bubble color is categorized by clusters of average energy use pc level. Bubble size is analogous to the corresponding economy’s gross domestic product per capita: (a) energy use pc vs. CO2 emissions pc in 2000; (b) energy use pc vs. CO2 emissions pc in 2018 (see the motion chart in Video S1 in Supplementary Materials); (c) color legend for clusters of countries according to energy use pc (average of 2000–2018); (d) energy use pc vs. CO2 emissions pc over 2000–2018.
Energies 14 07532 g006aEnergies 14 07532 g006b
Figure 7. The relationship between fossil fuel energy consumption pc and CO2 emissions pc in EU-28 (2000–2018). Bubble color is categorized by clusters of average fossil fuel energy consumption pc level. Bubble size is analogous to the corresponding economy’s gross domestic product per capita: (a) fossil fuel energy consumption pc vs. CO2 emissions pc in 2000; (b) fossil fuel energy consumption pc vs. CO2 emissions pc in 2018 (see the motion chart in Video S2 in Supplementary Materials); (c) color legend for clusters of countries according to fossil fuel energy consumption pc (average of 2000–2018); (d) fossil fuel energy consumption pc vs. CO2 emissions pc over 2000–2018.
Energies 14 07532 g007
Figure 8. The relationship between renewable energy consumption pc and CO2 emissions pc in EU-28 (2000–2018). Bubble color is categorized by clusters of average renewable energy consumption pc level. Bubble size is analogous to the corresponding economy’s gross domestic product per capita: (a) renewable energy consumption pc vs CO2 emissions pc in 2000; (b) renewable energy consumption pc vs. CO2 emissions pc in 2018 (see the motion chart in Video S3 in Supplementary Materials); (c) color legend for clusters of countries according to renewable energy consumption pc (average of 2000–2018); (d) renewable energy consumption pc vs. CO2 emissions pc over 2000–2018.
Energies 14 07532 g008
Figure 9. Correlation matrices. Clusters of countries are defined according to energy use pc level (average of 2000–2018): (a) cluster 1; (b) cluster 2; (c) cluster 3; (d) cluster 4. Shown are correlation coefficients, with color and size defining the direction and the strength of the relationship accordingly.
Energies 14 07532 g009aEnergies 14 07532 g009b
Figure 10. Correlation matrices. Clusters of countries are defined according to fossil fuel energy consumption pc level (average of 2000–2018): (a) cluster 1; (b) cluster 2; (c) cluster 3; (d) cluster 4. Shown are correlation coefficients, with color and size defining the direction and the strength of the relationship accordingly.
Energies 14 07532 g010aEnergies 14 07532 g010b
Figure 11. Correlation matrices. Clusters of countries are defined according to renewable energy consumption pc level (average of 2000–2018): (a) cluster 2; (b) cluster 1; (c) cluster 4; (d) cluster 3. Shown are correlation coefficients, with color and size defining the direction and the strength of the relationship accordingly.
Energies 14 07532 g011aEnergies 14 07532 g011b
Figure 12. Energy trends for top 10 energy-consuming countries: (a) energy use pc; (b) fossil fuel consumption pc; (c) renewable energy consumption pc.
Energies 14 07532 g012aEnergies 14 07532 g012b
Figure 13. Renewable energy targets 2020 and 2030: 20% final energy consumption from renewable sources by 2020 and at least 32% by 2030.
Energies 14 07532 g013
Figure 14. Energy trends for energy clusters: (a) energy use pc; (b) fossil fuel consumption pc; (c) renewable energy consumption pc.
Energies 14 07532 g014aEnergies 14 07532 g014b
Publisher’s Note: MDPI stays neutral with regard to jurisdictional claims in published maps and institutional affiliations.

