Article

A Small-Town Economic Revitalisation Conundrum: Focus on Tourism, Manufacturing, or Both?

Centre for Environmental Management, University of the Free State, P.O. Box 339, Bloemfontein 9300, South Africa
Energies 2021, 14(22), 7568; https://doi.org/10.3390/en14227568
Submission received: 9 October 2021 / Revised: 31 October 2021 / Accepted: 6 November 2021 / Published: 12 November 2021
(This article belongs to the Special Issue Integrated Approaches for Enterprise Sustainability)

Abstract

:
The decline in small towns is a concern in many countries. The manufacturing and tourism sectors are considered to be important in the revitalisation of towns but could be subject to ‘Dutch disease’. This is a malady in which success in one sector leads to a decline in the other. The importance of, and relationships between, the manufacturing and tourism sectors of more than 500 United States micropolitan statistical areas (micropolitans) were extensively investigated by following settlement scaling theory. Publicly available 2016 datasets were used to test a hypothesis that Dutch disease between the two sectors is important. Both sectors are present and important in virtually all of the micropolitans. Regression analyses, including log–log (power-law) analyses, were used to examine the population-based and enterprise-based orderliness in the micropolitan demographic–socioeconomic–entrepreneurial nexus. There is much orderliness, and non-linear relationships are prevalent. No evidence of the presence of Dutch disease was recorded except in one case. When the strengths of the two sectors (as a percentage of their enterprise numbers in relation to total enterprise numbers) are compared, a weak negative relationship is observed. The hypothesis that Dutch disease is important was rejected. A focus on both sectors is recommended to build resilience and to contribute to the revitalisation/development of small towns.

1. Introduction

Populations in many rural communities in the United States are declining as a result of decreasing employment in agriculture and mining, the globalisation of manufacturing, and economic growth in urban areas [1]. Migration, rather than natural increases or decreases in population, has largely driven population change across rural America [2]. Between 2000 and 2010, rural populations in the US grew by just over half as much as their population growth in the 1990s [3].
Small towns are essential in rural areas but are often neglected [4]. They serve as market nodes for the provision of services, goods, and non-farm employment [4]. At the start of the previous century, most small US towns were important collection, processing, shipping, distribution, and service centres for the surrounding rural areas [5]. Later, larger places became more readily accessible because of increasing numbers of automobiles and the provision of better roads [5]. Many of the traditional agricultural towns began to wither. As a result, many small US towns transformed into minor participants in a nationwide network of manufacturing centres [5].
Manufacturing became strong in the US economy after World War II [6]. There were 19.4 million manufacturing jobs in 1979, but a decline started thereafter. By 1987, there were only 17.6 million. The slow decline in manufacturing employment accelerated after 2000 and especially during the Great Recession [6]. In early 2010, manufacturing payrolls decreased to fewer than 11.5 million employees [6]. Overall, employment in manufacturing in 2017 was at its lowest level since before the US entered World War II. This was despite the fact that more than 900,000 manufacturing jobs had been added to the workforce after 2010 [6].
Two observations about the economic dynamics of US micropolitan statistical areas (hereafter called micropolitans) deserve further consideration. Firstly, despite the reduction in manufacturing activities mentioned above, in 2018, manufacturing was still listed as one of seven major attributes of micropolitan success in rural America [7]. For instance, manufacturing was the dominant industry and represented more than 20 percent of all jobs in the cities of Findlay and Jasper compared with 7.9 percent for the US overall [7]. Secondly, combinations of tourism, recreation, and the attraction of lifestyle amenities drove economic success in a majority of the top 20 most dynamic micropolitans [8]. Tourism and manufacturing are both apparently important economic sectors in micropolitans. However, can this occur concurrently?
This question requires consideration of certain aspects of the traded and non-traded economic sectors. Export growth of traded products and services contributes to the economic strength of countries [9,10]. The traded sector is also important in the creation of jobs and prosperity in local economies [11]. The geographical ranges of the markets for traded and non-traded goods and/or services differ and should be considered [12]. The products and services of the traded sector sell in external (non-local) markets and enhance the inflow of external money into local economies. These products and services originate in business sectors such as agriculture, fishing, manufacturing, and mining [12]. On the other hand, non-tradable products and services sell mostly in local markets [12]. The non-tradable sector tends to circulate money in economies and does not generate the inflow of much external money. Manufacturing has been identified as part of the traded sector. Is this also true for the tourism sector?
Tourism is an important economic sector in the world [13]. By 2018, the world had nine consecutive years of sustained tourism growth [13]. Tourism products and services are not considered to be exportable because their prices are determined in local rather than international markets [14]. However, when tourists from elsewhere visit a tourism destination, the money they spend originates from external sources [15,16]. Therefore, tourism transforms non-traded goods and services into traded goods. Tourism is one of the major export sectors of developing countries [13,17] and is also considered to be a traded service by the United Nations World Tourism Organisation [13]. Accordingly, for the purposes of this contribution, tourism and manufacturing are both considered to be part of the traded sector.
A malady called ‘Dutch disease’ could impact the relationship between the manufacturing and tourism sectors in local economies. When some traded sectors in an economy contract as a result of the rapid expansion of another traded sector in the same economy, the phenomenon is called Dutch disease [18,19,20,21]. This disease is one of the causes of what is called the ‘natural resource curse’, i.e., the process whereby the extraction of a resource leads to a decrease in long-term community welfare [19]. Dutch disease can result in the appreciation of real exchange rates and cause factor reallocations triggered by the resultant windfall incomes [22,23,24,25]. This was illustrated when natural gas extraction in Holland was expanded. The extraction adversely affected other sectors of the Dutch economy, hence the name ‘Dutch disease’. A boom in exports of Australian minerals to China and Asian economies strengthened the Australian currency substantially against other leading currencies, and tourism was negatively impacted [16]. Dutch disease is, therefore, an economic illness that (i) involves the movement factors of production to extraction activities, (ii) leads to increases in aggregate demands, and (iii) contributes to losses of positive externalities associated with large non-resource traded goods sectors [19]. With Dutch disease, traded goods sectors that are exposed to international or local competition can shrink or disappear. The manufacturing sector is sometimes at risk due to Dutch disease [25].
Dutch disease is not confined to resource-rich countries only. Causal links between tourism and Dutch disease are increasingly observed [20,26,27]. The presence of Dutch disease in countries dependent on tourism was empirically examined by Holzner [28]. He concluded that such countries do not exhibit significant exchange rate distortions and deindustrialisation. However, Copeland [18] suggested that a tourist boom could negatively influence traded sectors such as manufacturing and cause deindustrialisation. Should Dutch disease between the manufacturing and tourism sectors be present in small rural human settlements in the United States, success in the tourism sector might lessen their success in the manufacturing sector or vice versa. The primary purpose of this contribution is to examine a hypothesis that Dutch disease is important in the interaction between the tourism and manufacturing sectors of micropolitans.
There are several reasons for a focus on micropolitans. Firstly, micropolitans provide a lens through which to view small-town America [29]. Micropolitans are central to the understanding of the dynamics of rural economic forces [7]. A micropolitan is a core-based geographic area [30]. It might contain one or more counties, and one city must have at least 10,000 but fewer than 50,000 people [30]. In 2017, approximately 8.4 percent of the US population (i.e., 27.2 million people) resided in micropolitans [29]. In September 2018, there were 542 micropolitans that included 660 counties [29]. Micropolitans are, therefore, an important part of human settlements in the United States.
Secondly, studies of the demographic, socioeconomic, and entrepreneurial nexus of US counties revealed extensive socioeconomic orderliness [31,32,33]. Orderliness was also detected in the demographic, socioeconomic, and entrepreneurial nexus of cities [34,35]. Since 2000, the systemic orderliness of human settlements received increasing research attention [36]. This led to the proposal of a settlement scaling theory (SST), in which human settlements are described as complex systems [36] exhibiting scale-invariant demographic, socioeconomic, and entrepreneurial relationships over a range extending from small towns to large cities [37].
Many population-based relationships have been revealed by research in urban economics and geography [38]. These involve relationships in urban settlements between population and (i) urbanisation, (ii) economic activities, (iii) rates of innovation, (iv) the use of energy, and (v) infrastructure needs. Scaling research demonstrated how physical, biological, and social properties of urban systems change with population size. SST proposes that in human settlements, (i) infrastructure and the use of space in modern cities exhibit systematic economies of scale. More populous metropolitan areas require less space and less urban infrastructure per capita [34]; (ii) there are increasing returns to scale for a wide range of socioeconomic outputs [38,39]. More populous metropolitan areas generally have a higher per capita productivity [38,39]; (iii) with more people, individuals generally have more social connections than individuals in cities with fewer people [40]; (iv) there is, on average, a more extensive division of labour and more productive specialisation in more populous settlements [41].
The relationships mentioned above have characteristic elasticities. The functional form of these relationships is usually described by a power law as follows:
X = X0Nβ
where N represents the city population [42]. The exponent β is typically about 5/6 (approximately 0.85) when X is a measure of infrastructure and about 7/6 (approximately 1.15) when X is a measure of socioeconomic outputs [42]. As modern cities grow, their socioeconomic rates increase faster than population growth. On the other hand, material infrastructural needs increase more slowly than population growth. These elasticities appear to be open ended. In other words, the relative benefits of scale are consistent over wide differences in city population sizes [38]. Scaling has also been detected in the tourism domain of micropolitans [43]. Therefore, non-linear scaling phenomena need to be taken into account in an investigation of the relationship between tourism and manufacturing activities in micropolitans.
Thirdly, complex systems such as agricultural regions, natural ecosystems, cities, and communities need to be managed [44]. Resilience is the ability to cope with shocks without having to change the way a system is managed [44]. In other words, resilience is a measure of how much a complex system can change before crossing a tipping point into a new state in which it then tends to stay [44]. The most common misinterpretation of resilience is possibly a concept of ‘bouncing back’. In fact, resilience involves the ability to adapt, change, and reorganise in order to cope with disturbance [44]. Could tourism and/or manufacturing form part of the resilience of micropolitans? This needs to be investigated.
The hypothesis that Dutch disease plays an important role in the relationship between the tourism and manufacturing sectors of small human settlements, requires answers to a number of questions: (i) are tourism and manufacturing activities in micropolitans (representing small-town America) part of the demographic–socioeconomic–entrepreneurial orderliness of micropolitans? (ii) are they subject to Dutch disease? (iii) do they singly, or in combination, offer potential to strengthen the resilience of micropolitans (and small towns)? (iv) do they detract from one another? These questions are addressed in this contribution.
The flow of the contribution is as follows: The methods are presented next and include descriptions of the analytic strategy followed, the datasets used, and the different analyses employed. Thereafter, the results are presented. The discussion and conclusions then follow.

2. Methods

2.1. Introduction

Settlement scaling theory [38] explains scale-invariant orderliness in the demographic–socioeconomic–entrepreneurial nexus of human settlements. This orderliness must be considered when the relationships between different enterprise sectors, such as manufacturing and tourism, are examined. Increasing public availability of micropolitan datasets enables examination of the questions posed above. The 2016 datasets were specifically used because 2016 is long after the 2008–2010 Great Recession and before the onset of the COVID-19 pandemic. Therefore, 2016 datasets reflect conditions not influenced by abnormal events, a requirement for the investigation of manufacturing–tourism sector interactions.

2.2. Analytic Strategy

The analytic strategy consists of four parts. The first question that was considered is whether tourism and manufacturing enterprises are important in micropolitans. These two economic sectors are potentially important sources of external monetary inflows into micropolitans. However, are they important components of the enterprise domains of the micropolitans? First, an analysis of their enterprise strengths was needed.
As proportionalities have been recorded between population numbers and the number of enterprises of human settlements, e.g., for South African towns [45,46], United States counties [43,47], and United States metropolitans [35], the second step in the investigation was to establish if population-based orderliness is also present in the group of micropolitans studied here. This step allowed the determination of whether population strength (i.e., a higher percentage of a total micropolitan population) is associated with higher tourism or manufacturing sector strengths. In other words, does population strength increase or decrease the potential for Dutch disease?
As scale-invariant orderliness has been detected in the enterprise dynamics of US counties [32,33], the third part of the analysis examined if enterprise-based orderliness is present in the micropolitans. If present, its nature can be determined. Particular attention was given to manufacturing-based and tourism-based socioeconomic relationships.
The fourth part of the analysis dealt with the combined enterprise dynamics of the manufacturing and tourism sectors in order to determine if one influences the other. Linear regression analysis was followed by comparisons of the enterprise dynamics of micropolitans with the strongest manufacturing sectors with those with the strongest tourism sectors.
The results were finally considered in context.

2.3. Basic Datasets

The investigation used publicly available datasets of United States micropolitans. As explained earlier, the year 2016 was chosen for the analyses. The 2016 SUSB annual data table that is available on the internet [48] presents the establishment composition of micropolitans in 2016. It was, therefore, used. It includes the number of establishments (here called enterprises) of micropolitans. The enterprises are classified into 17 different business sectors using the two-digit subdivisions (Table 1) of the six-digit classifications of the North American Industry Classification System (NAICS) [49]. The employment numbers and annual payrolls of micropolitan sector enterprises were also extracted. A dataset of the US Census Bureau [50] provided 2016 estimates of micropolitan populations.

2.4. Non-Linear and Linear Regression Analyses

Power-law (log–log) regression analyses were used to detect scale-invariant and linear relationships between various micropolitan characteristics. The exponent of a power law indicates the universality class to which the association belongs: super-linear, sub-linear, or linear associations [51]. Some socioeconomic characteristics of human settlements increase faster than the size of another characteristic and thus exhibit increasing returns to scale. These characteristics scale super-linearly. In other words, the characteristics are denser in larger settlements. Some exponential coefficients of power laws are less than unity. These sub-linear coefficients indicate economies of scale in larger human settlements. In other words, such characteristics are denser in smaller settlements. Linear exponents indicate that some characteristics increase or decrease in step with one another. Microsoft Excel software was used for all the regression analyses.
Graphical analyses and comparisons were also used. These procedures were carried out in cases where the behaviour of one characteristic was examined in relation to that of another (e.g., a manufacturing characteristic in relation to a tourism characteristic). Ranking of one of the micropolitan characteristics according to its size and then graphically examining the behaviour of the other enabled detection of potential negative relationships and the presence of Dutch disease.

3. Results

As regards the enterprise strength of the tourism and manufacturing sectors, the combined 2016 tourism and manufacturing enterprise numbers of micropolitans comprise on average just over 16% of the total enterprise numbers of the investigated micropolitans. This varied from a minimum of 7.4% to a maximum of 28.8%. These sectors generate monetary inflows from external sources into local economies and are important components of the micropolitan enterprise domains.

3.1. Population-Based Orderliness

Population-based power law (log–log) scale-invariant relationships are prevalent in micropolitans. Figure 1 illustrates the relationship between population numbers and enterprise numbers. Table 1 presents additional power laws recorded. It is noteworthy that the exponents of the power laws differ in size. Enterprise numbers are sub-linearly (exponent = 0.91) associated with population numbers, indicating that enterprise numbers are disproportionately higher in less populated micropolitans (Figure 1). Such an association is also true for the micropolitan gross domestic product (GDP) and tourism enterprises (Table 2). Total payrolls are linearly related to population numbers (exponent approximately 1.0) (Table 2). Payrolls apparently increase in size in step with population numbers. Manufacturing enterprises are slightly super-linearly related to population numbers (exponent 1.04) (Table 2). There is a slightly disproportionately greater density of manufacturing enterprises in larger micropolitans. On the other hand, tourism enterprise numbers are sub-linearly (exponent = 0.92) associated with population numbers. The numbers of tourism and manufacturing enterprises are in scale-invariant ways associated with the population numbers of micropolitans but in distinctly different manners.
Does this mean that micropolitans with higher population strengths (i.e., with higher percentages of the total micropolitan population) are associated with higher tourism of manufacturing enterprise strengths? This is not the case, as shown by comparisons of the ranked (from highest to lowest) proportional population strengths of micropolitans with (i) the strengths of their tourism enterprises (Figure 2A) and the strengths of their manufacturing enterprises (Figure 2B) and (ii) the proportional strengths of their tourism employment (Figure 3A) and the strength of their manufacturing employment (Figure 3B). In all cases, there were no discernible relationships between population strength and the strengths of tourism or manufacturing characteristics.
Should Dutch disease between the tourism and manufacturing sectors be a factor in micropolitans, the sizes of micropolitan populations appear not to play a role in the phenomenon.

3.2. Enterprise-Based Orderliness

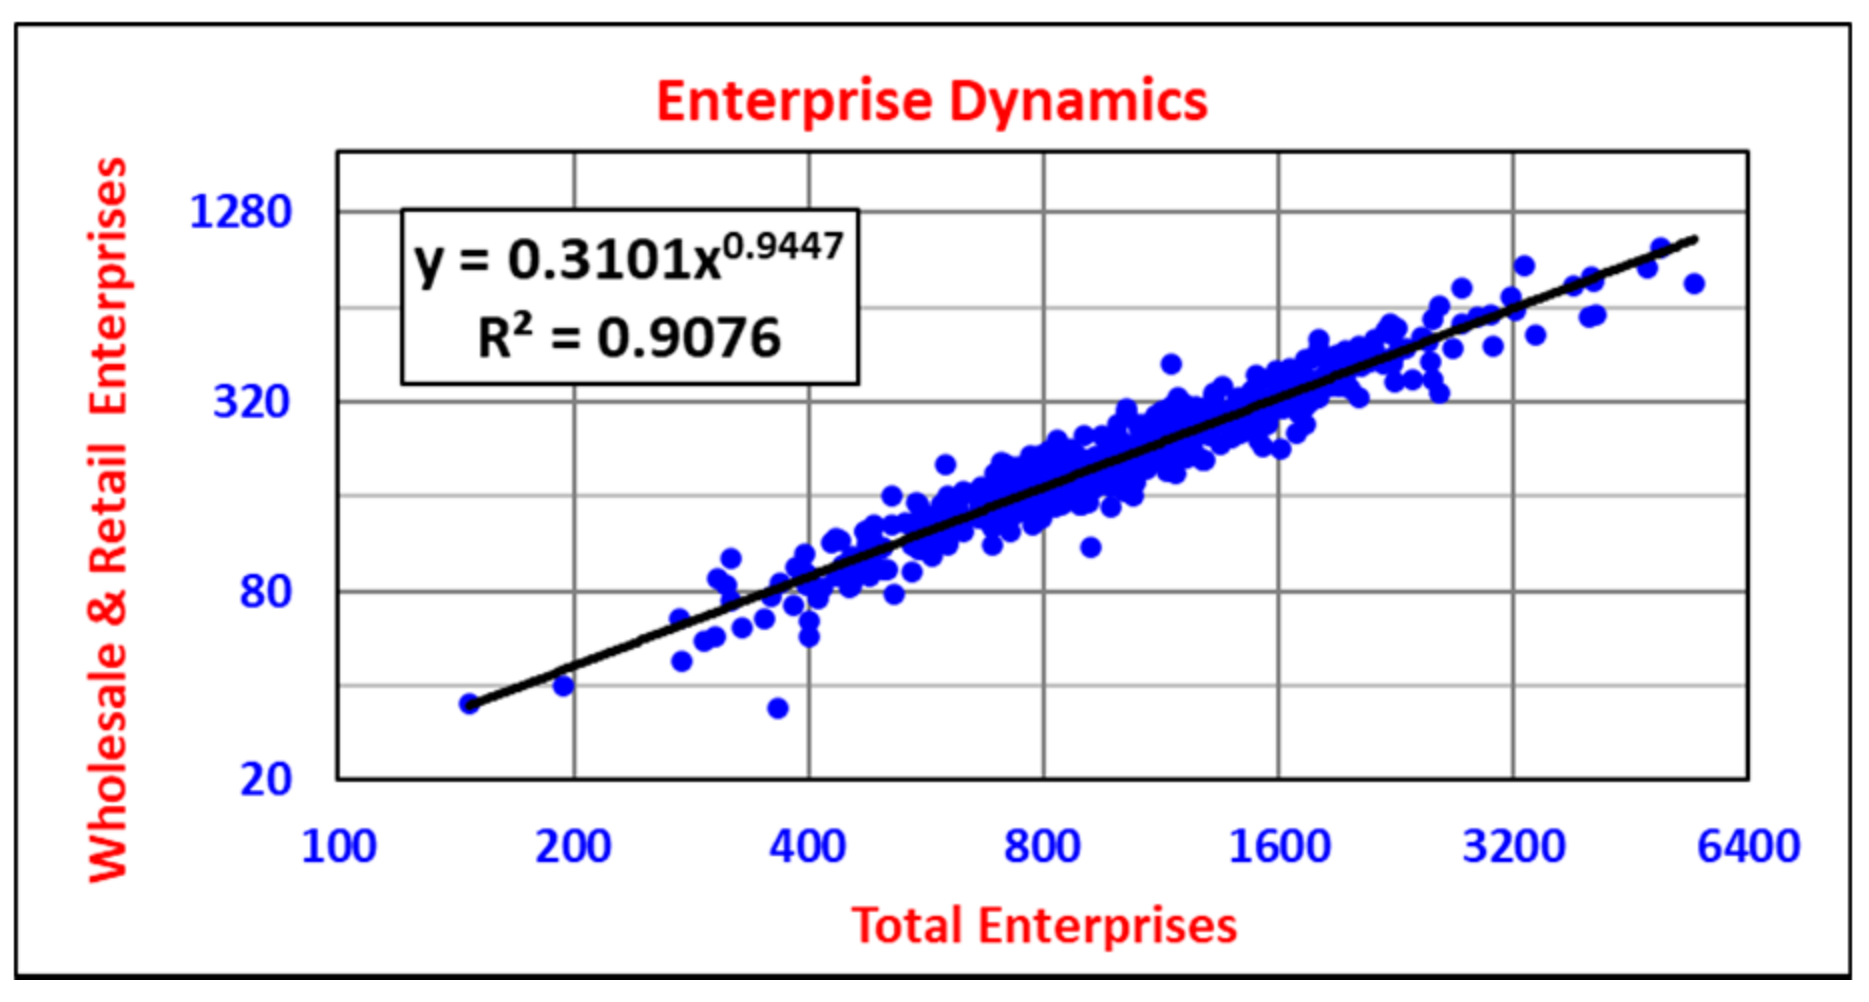
Previous research has identified orderliness in the enterprise dynamics of US counties [32,33]. Such orderliness is also present in US micropolitans. For example, Figure 4 illustrates the strong scale-invariant association between total enterprise numbers and the combined number of wholesale and retail enterprises in the micropolitans. The power law has a sub-linear exponent (exponent = 0.94), and there are slightly disproportionately more wholesale and retail enterprises in smaller micropolitans. Table 3 illustrates that the enterprise numbers of many other business sectors of micropolitans also scale non-linearly with total enterprise numbers. The exponents of these power laws vary from sub-linear (financial and insurance services; transport and warehousing services; information services) through slightly super-linear (tourism and manufacturing enterprises) to strongly super-linear (construction services). Importantly, although tourism and manufacturing enterprises have orderly associations with total enterprises, the ways in which these associations are expressed differ slightly. Manufacturing enterprises are slightly more super-linearly related to total enterprise numbers. Overall, tourism and manufacturing enterprises are disproportionately and slightly more prevalent in larger micropolitans than in smaller ones.
Do the different associations between the manufacturing or tourism sectors and total enterprise numbers signify that their different impacts are expressions of potential Dutch disease? This question necessitated the evaluation of the employment and payroll impacts of the enterprises of these sectors.

3.3. Manufacturing Enterprise-Based Impacts

Employment in the manufacturing sector is invariantly and strongly super-linearly associated with the number of manufacturing enterprises in micropolitans (Figure 5). Table 4 indicates that manufacturing employment increases by 135% for every doubling (100% increase) of manufacturing enterprise numbers. With only 10 manufacturers in a micropolitan, there are about 28 employees per enterprise. With 160 manufacturers in a micropolitan, there are about 53 employees per enterprise.
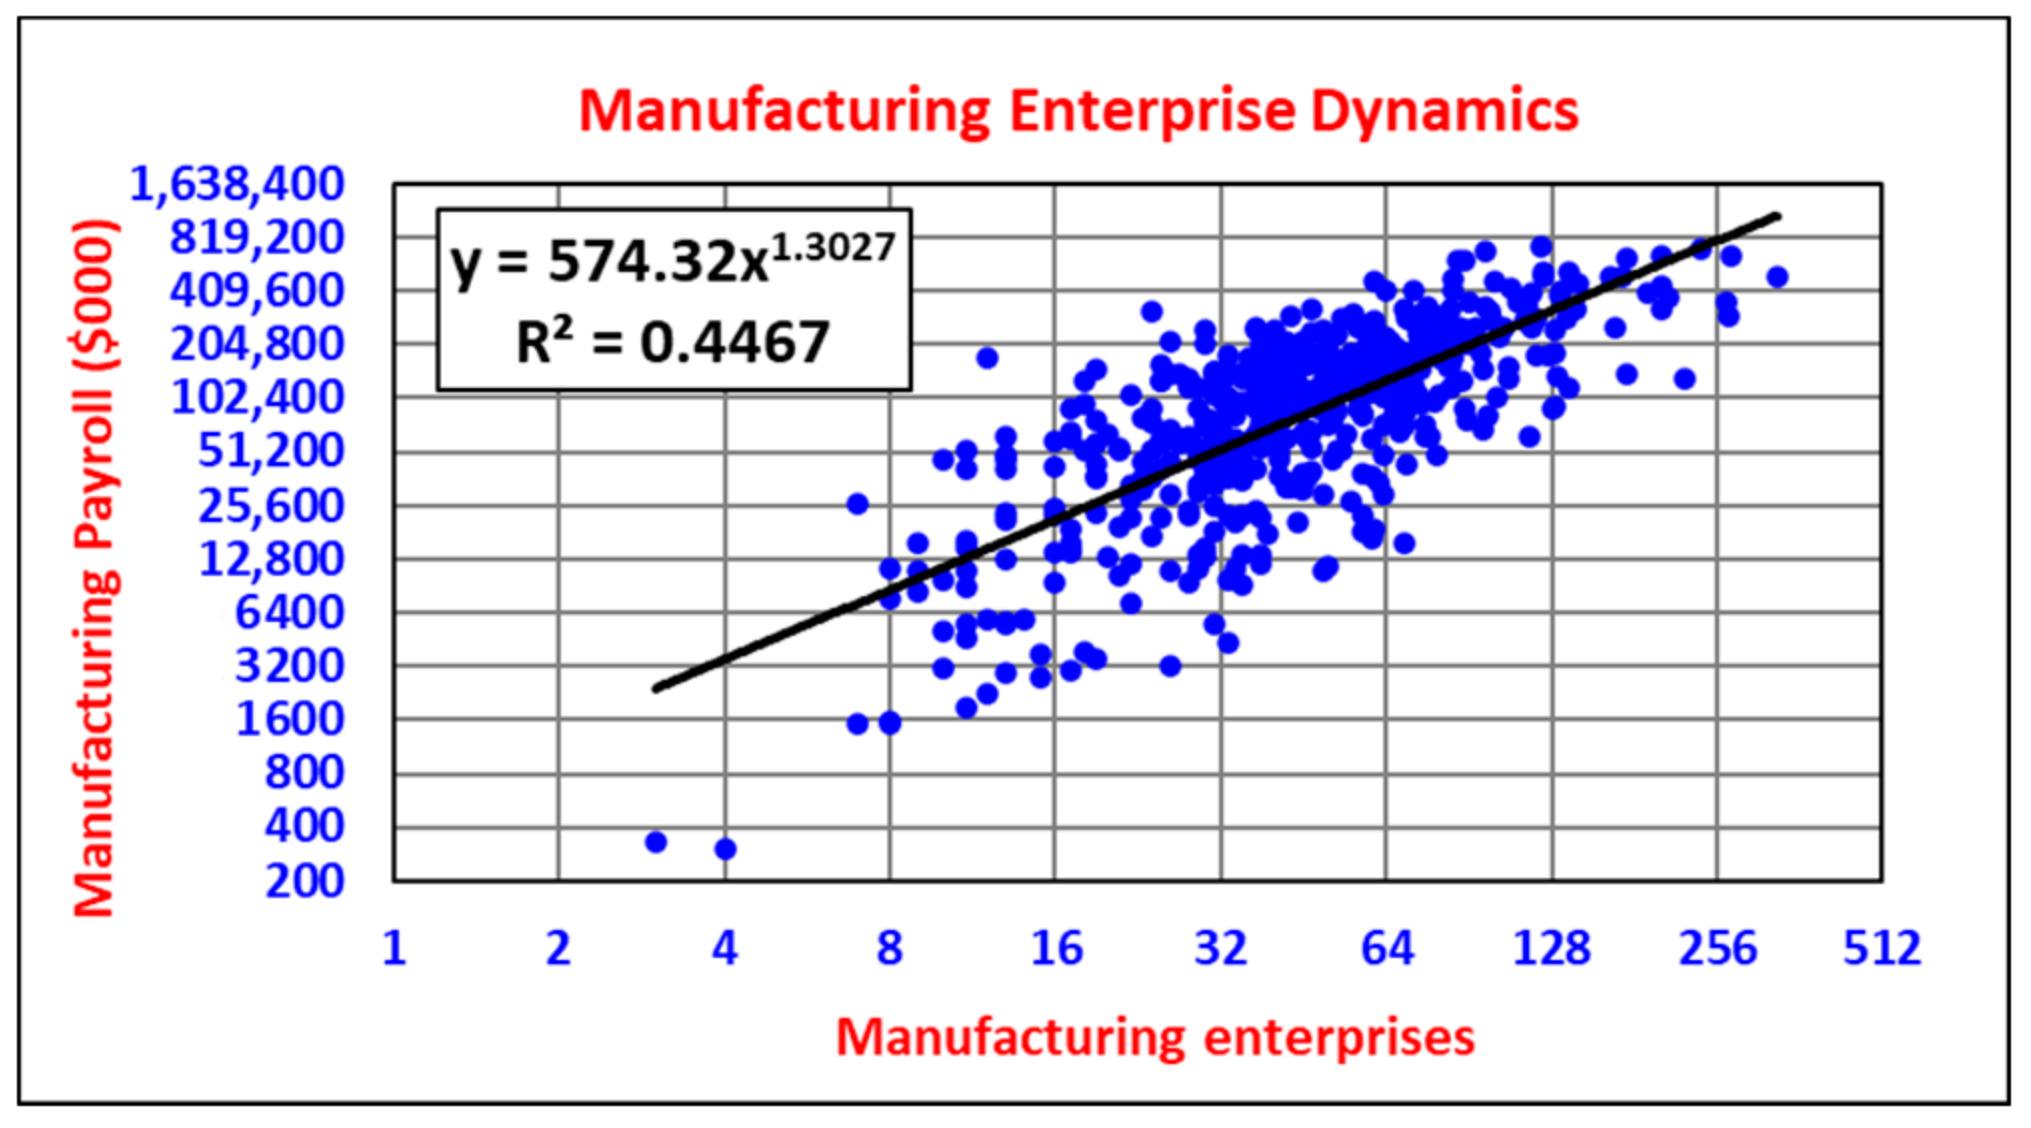
Manufacturing payrolls are also invariantly related to the number of manufacturing enterprises in micropolitans (Figure 6). The power law is also strongly super-linearly associated with the number of manufacturing enterprises. Table 5 indicates that manufacturing payrolls increase by about 150% for every doubling (100% increase) of manufacturing enterprise numbers. With only 10 manufacturers in a micropolitan, the payroll per enterprise is approximately USD 1.15 million. With 160 manufacturers in a micropolitan, the payroll per enterprise increases to approximately USD 2.7 million (Table 5).

3.4. Tourism Enterprise-Based Impacts

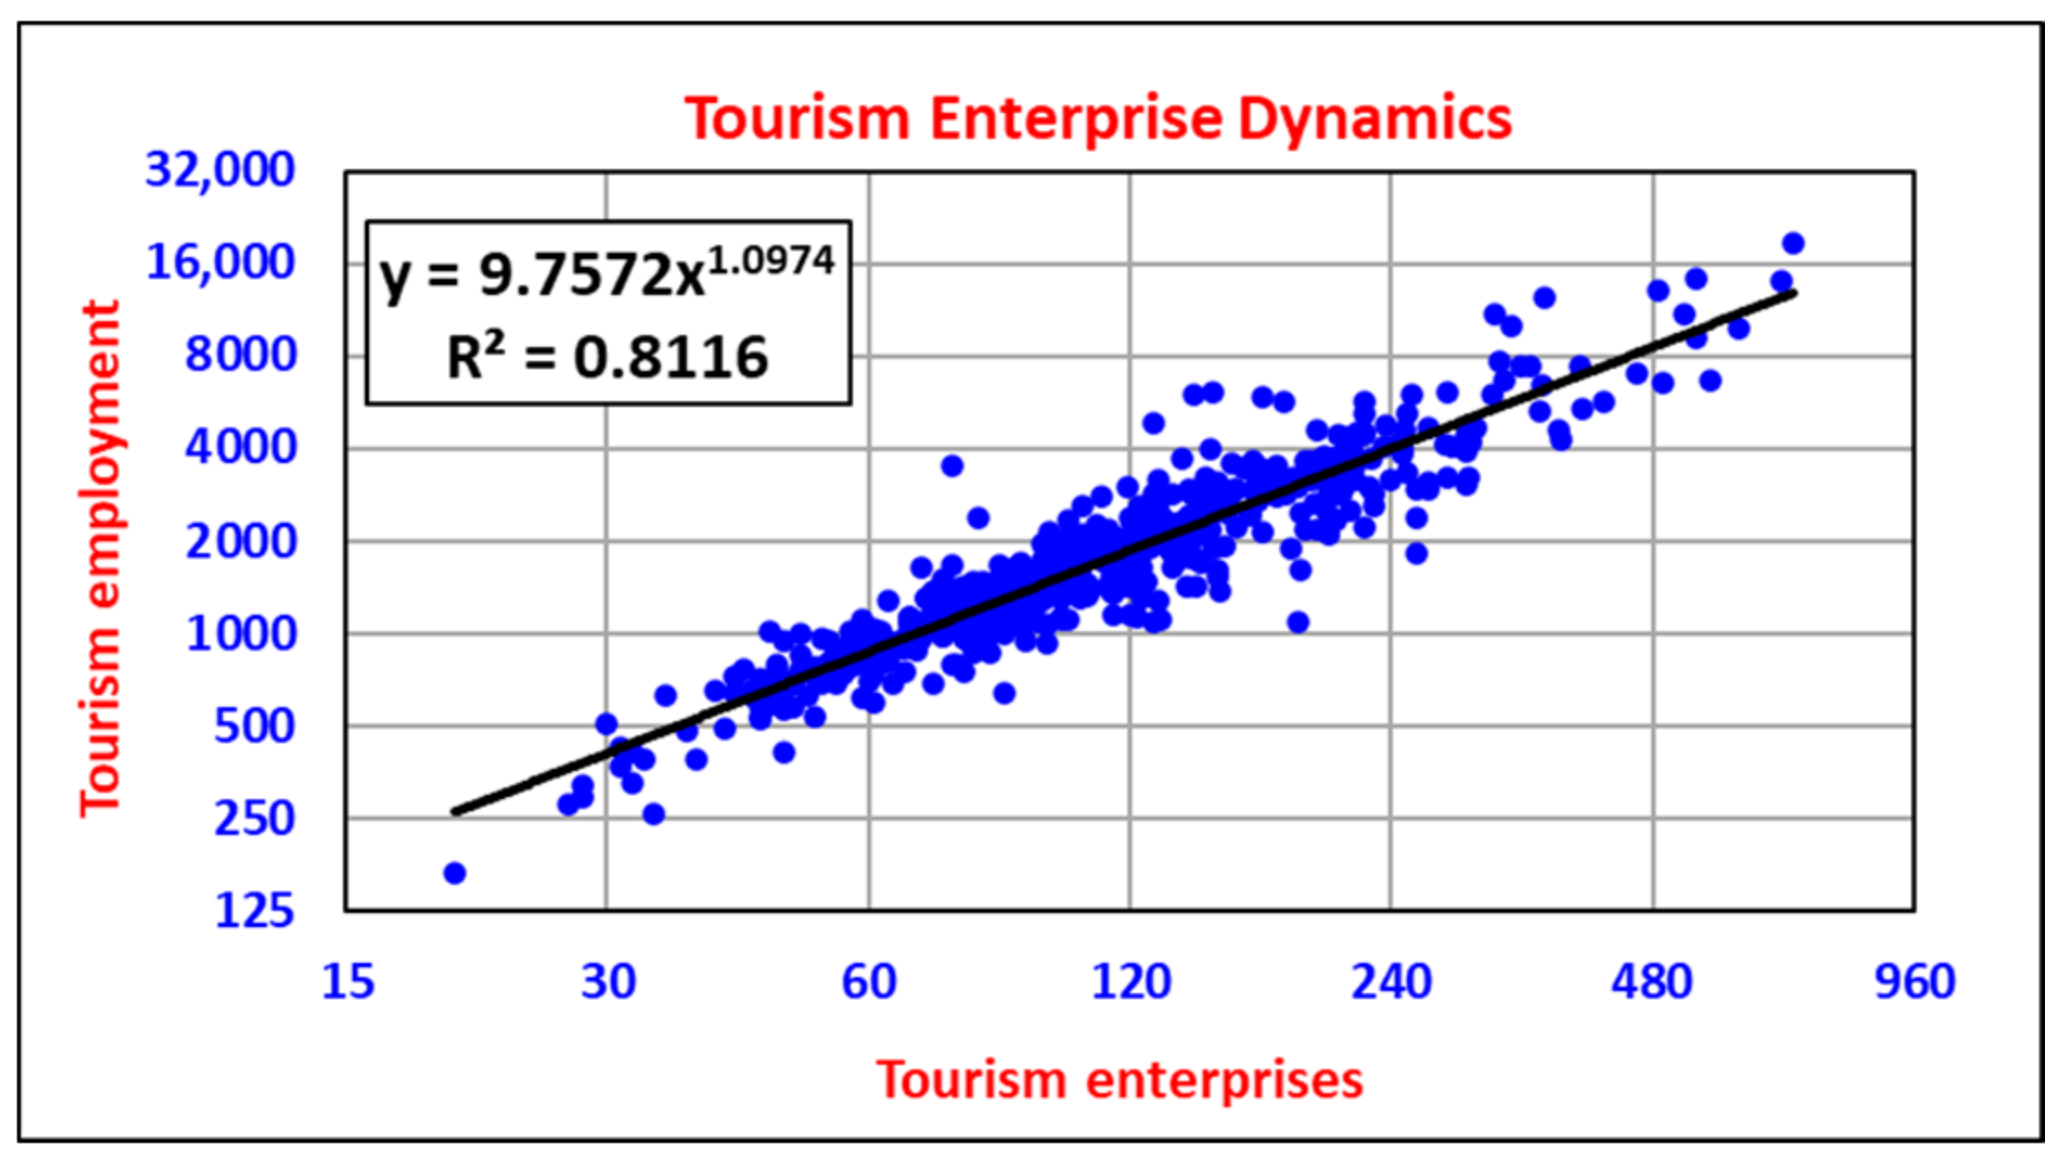
Employment in the tourism sector is also associated, in a scale-invariant manner, with the number of tourism enterprises in micropolitans. Tourism employment is slightly super-linearly associated with the number of tourism enterprises (Figure 7). Table 6 indicates that tourism employment increases by 114% for every doubling (100% increase) of tourism enterprise numbers. With only 30 tourism enterprises in a micropolitan, there are about 14 employees per enterprise. With 480 tourism enterprises in a micropolitan, there are about 18 employees per enterprise.
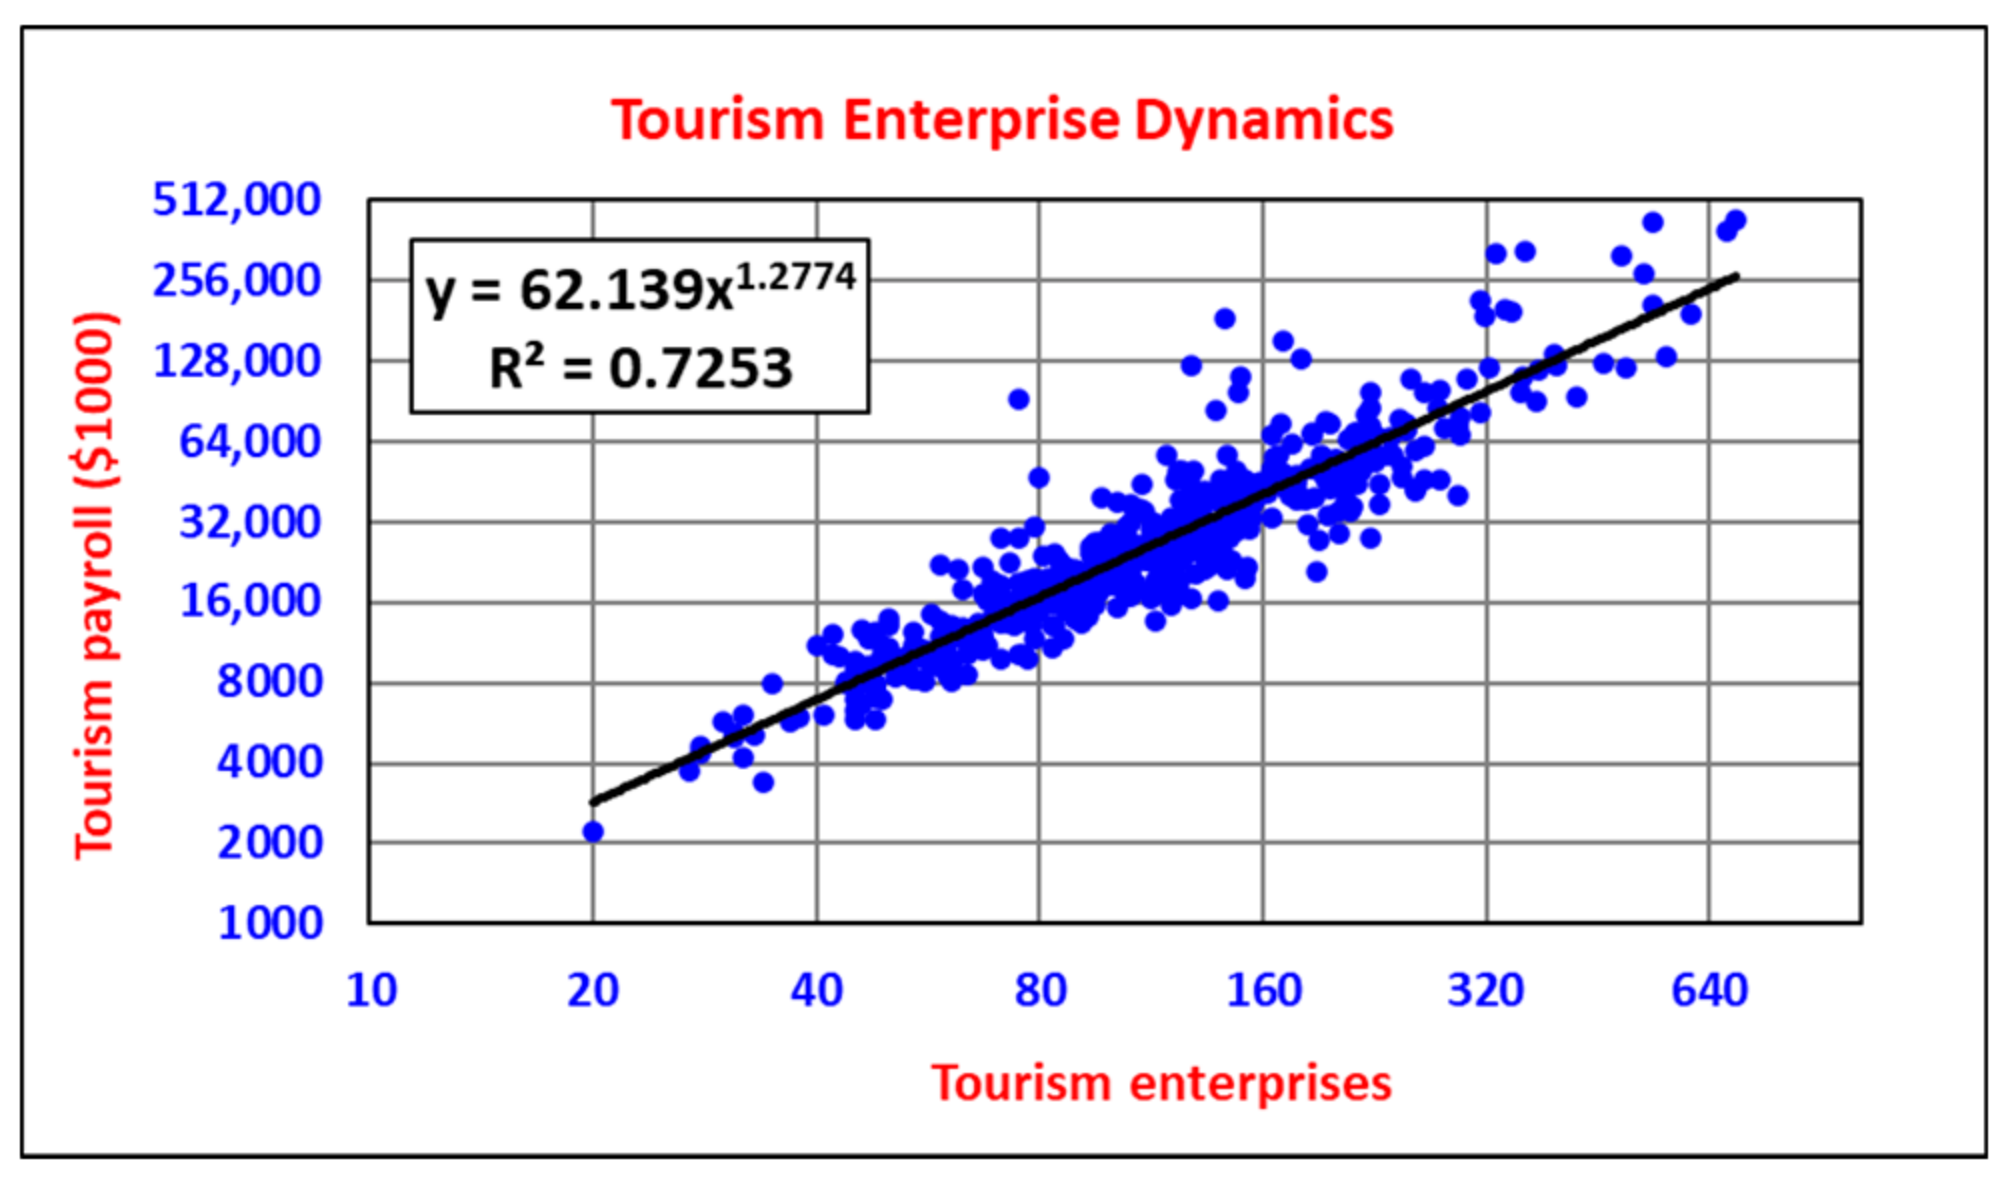
Tourism payrolls are also strongly super-linearly associated with the number of tourism enterprises (Figure 8). Table 7 indicates that tourism payrolls increase by about 140% for every doubling (100% increase) of tourism enterprises. With only 30 tourism enterprises per micropolitan, the payroll per enterprise is approximately USD 160,000. With 480 tourism enterprises per micropolitan, the payroll increases to approximately USD 345,000 per enterprise (Table 7).
There is much orderliness and differences in the ways in which different tourism characteristics and different manufacturing characteristics interact with micropolitan size. Tourism enterprises are disproportionately denser in smaller micropolitans and manufacturing enterprises are somewhat disproportionately denser in micropolitans with more enterprises (see power laws in Table 2). Manufacturing enterprises tend to have more employees and larger payrolls than tourism enterprises (Figure 5, Figure 6, Figure 7 and Figure 8, Table 3, Table 4, Table 5 and Table 6). Could these differences be the source of a potential Dutch disease? To examine this possibility, it was necessary to consider the dynamics between tourism and manufacturing enterprises.

3.5. Combined Enterprise Dynamics of Manufacturing and Tourism Sectors

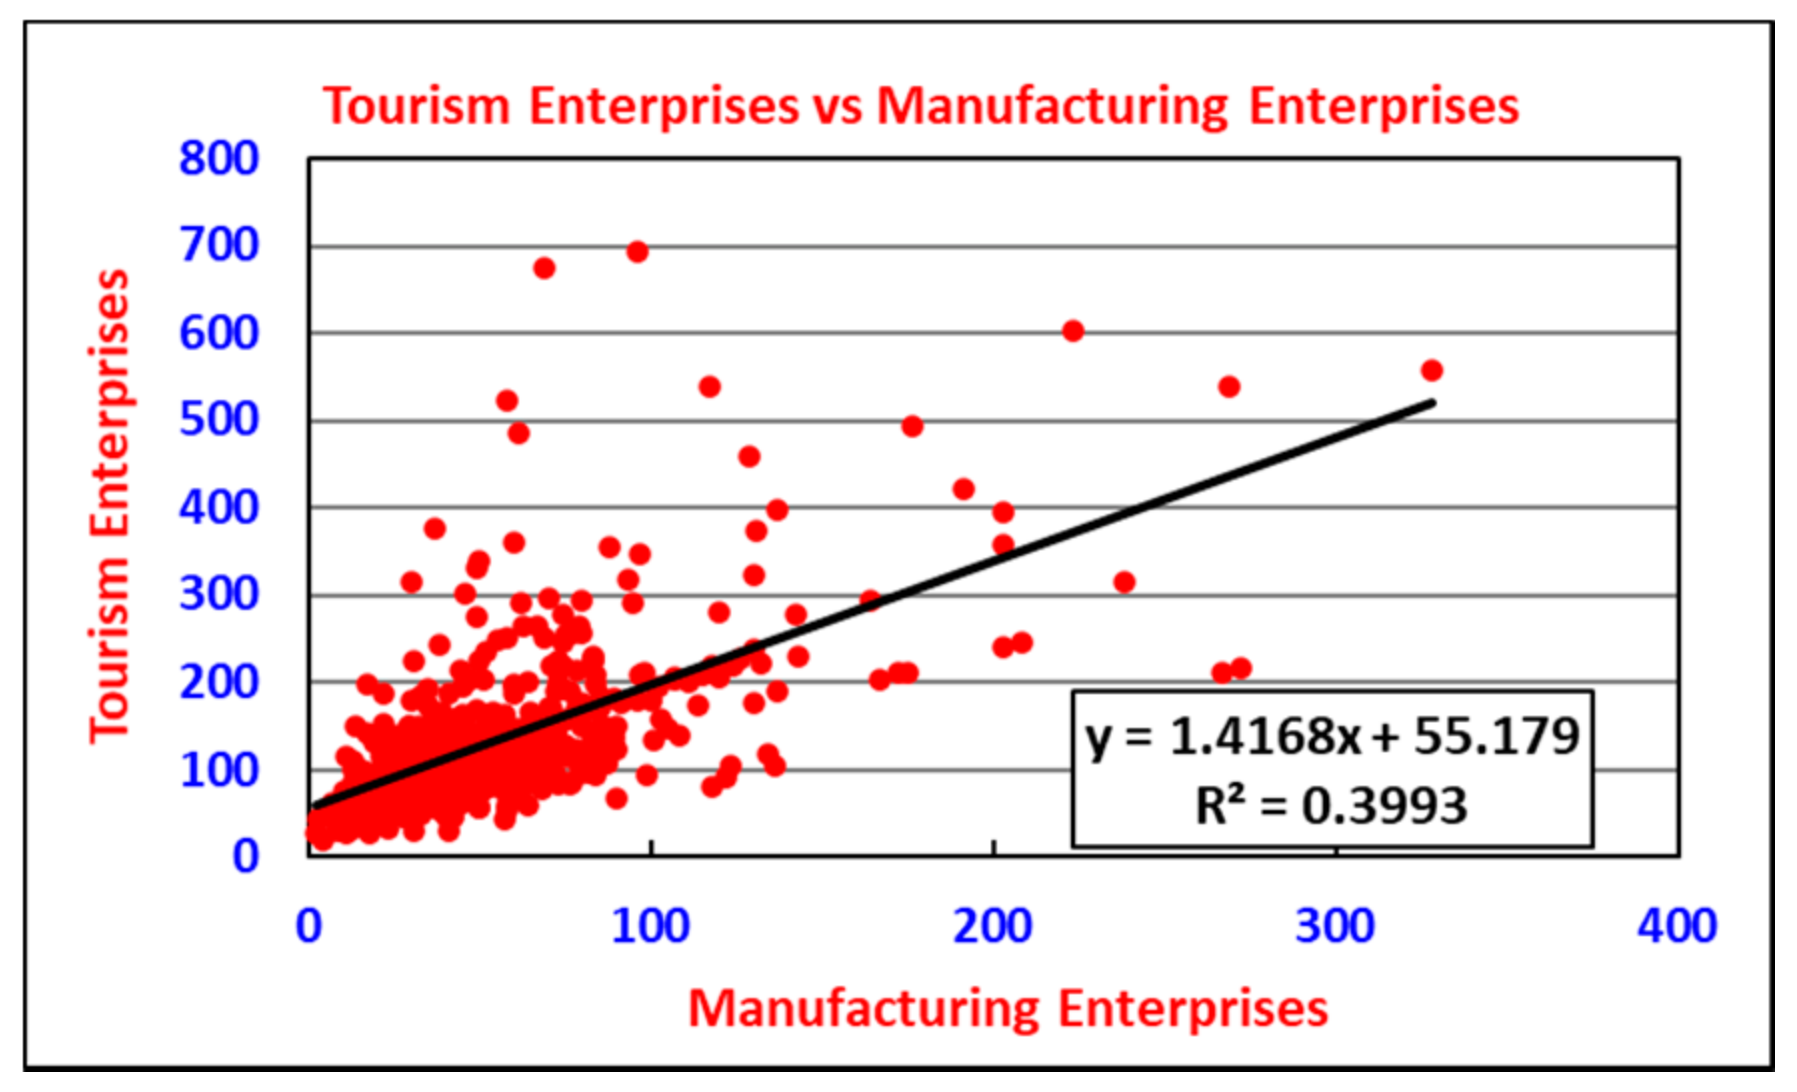
There is a statistically significant (p < 0.01) but a weak linear association between the number of manufacturing and tourism enterprises in the micropolitans (Figure 9). In general, micropolitans with more manufacturing enterprises also have more tourism enterprises. Tourism enterprises outnumber manufacturing enterprises by about 40% (see regression coefficient in Figure 9). This numerical analysis presents no evidence of the potential presence of Dutch disease.
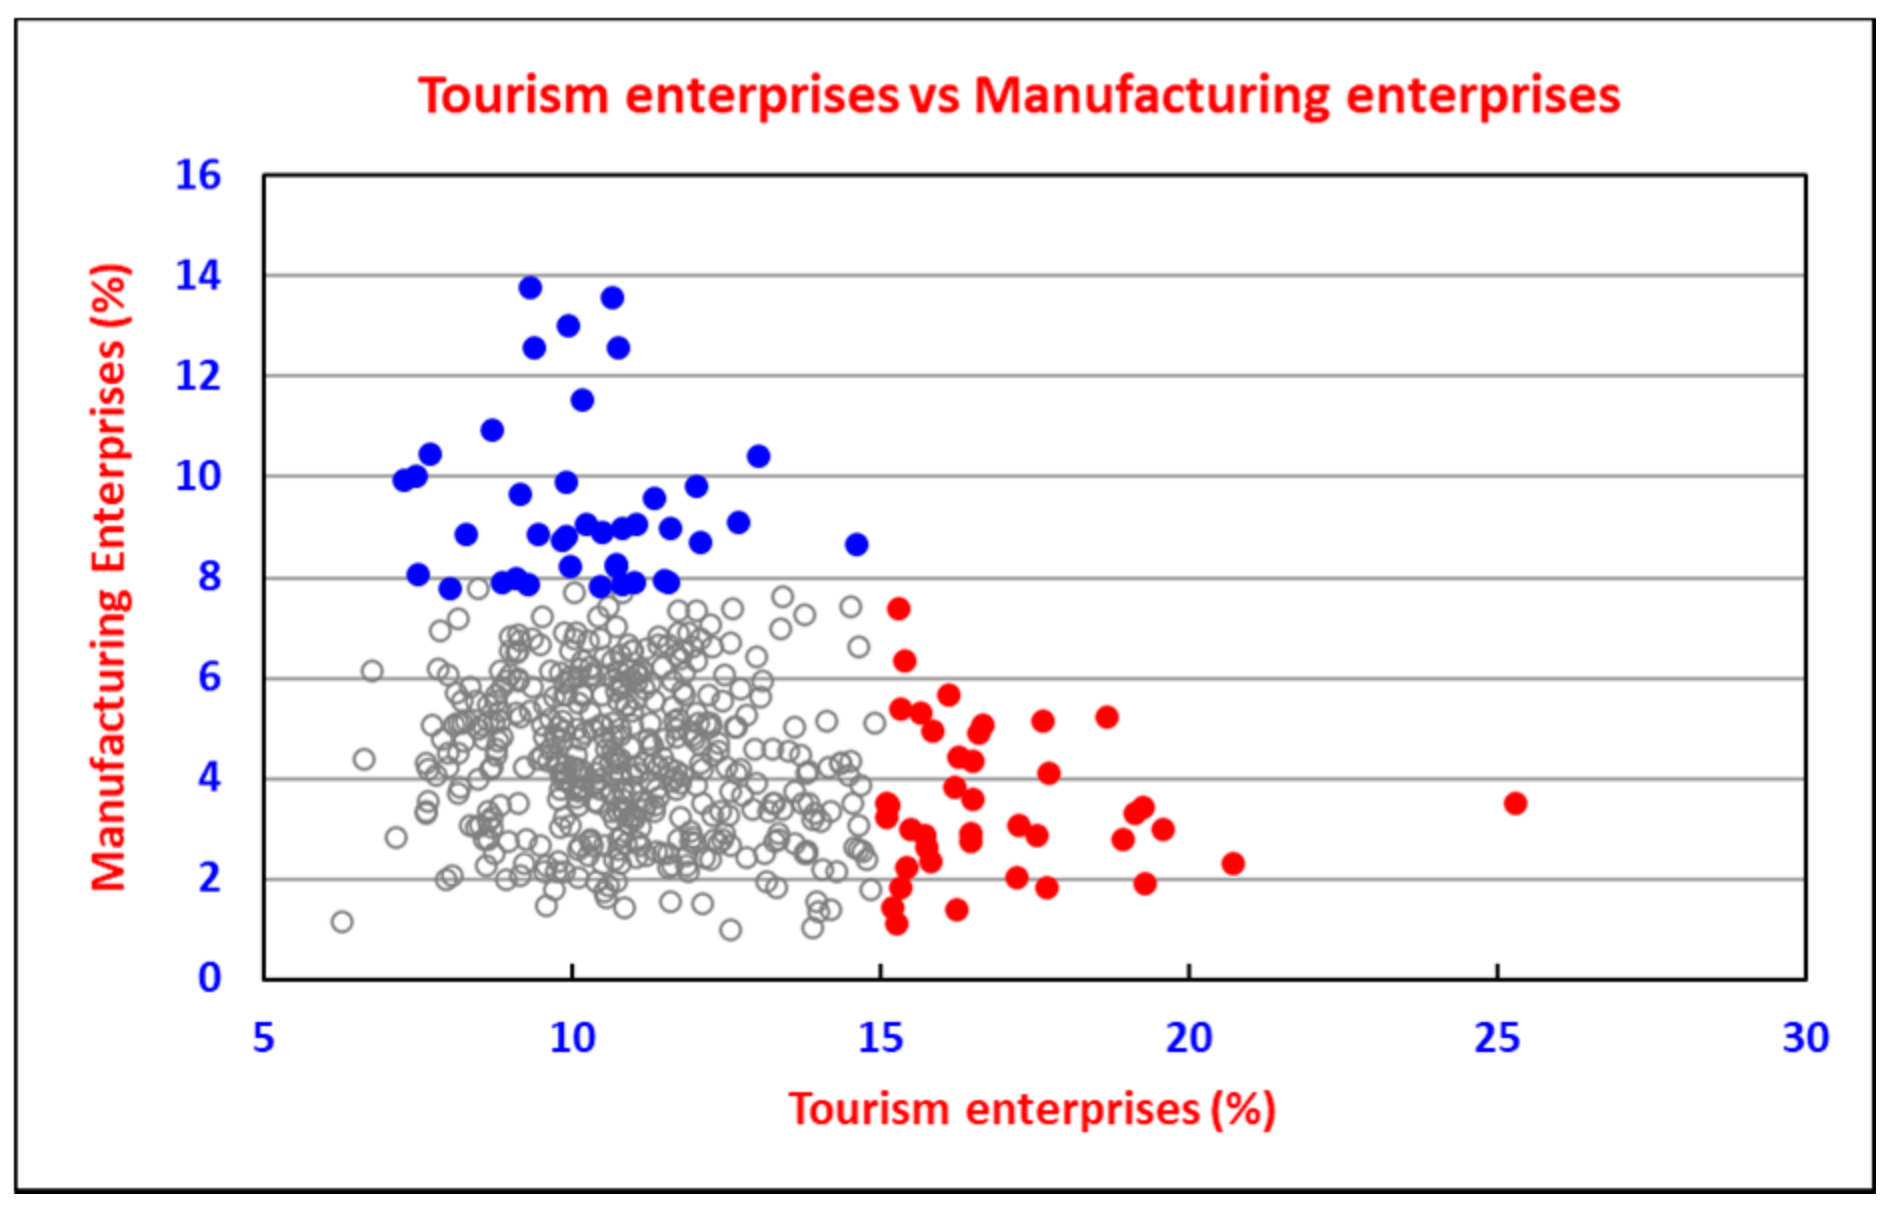
As the regression line in Figure 9 explains only about 40% of the variation (see R2-value in Figure 9), it was necessary to consider if the relative strengths of the tourism and manufacturing sectors could play a role in a potential Dutch disease. A comparison of the relative strengths (as percentages of total enterprise numbers) of the tourism and manufacturing sectors is presented in Figure 10. A large group of micropolitans has comparatively low strengths in both sectors. However, micropolitans with the highest strength in either the tourism or manufacturing sectors tended to have lower strengths in the other sector. This suggested that the micropolitans might be subject to Dutch disease.
The 40 micropolitans with the strongest tourism sectors were, therefore, compared with the 40 micropolitans with the strongest manufacturing sectors (see groups in Figure 11), using enterprise strength (fraction of total enterprises) as the measure. The tourism enterprise strength of a selected tourism group was more than 15%, and the strength of a selected manufacturing group was more than 7.8%. Notably, the largest group of approximately 430 micropolitans had less than 15% tourism enterprises and less than 7.8% manufacturing enterprises (grey dots in Figure 11).
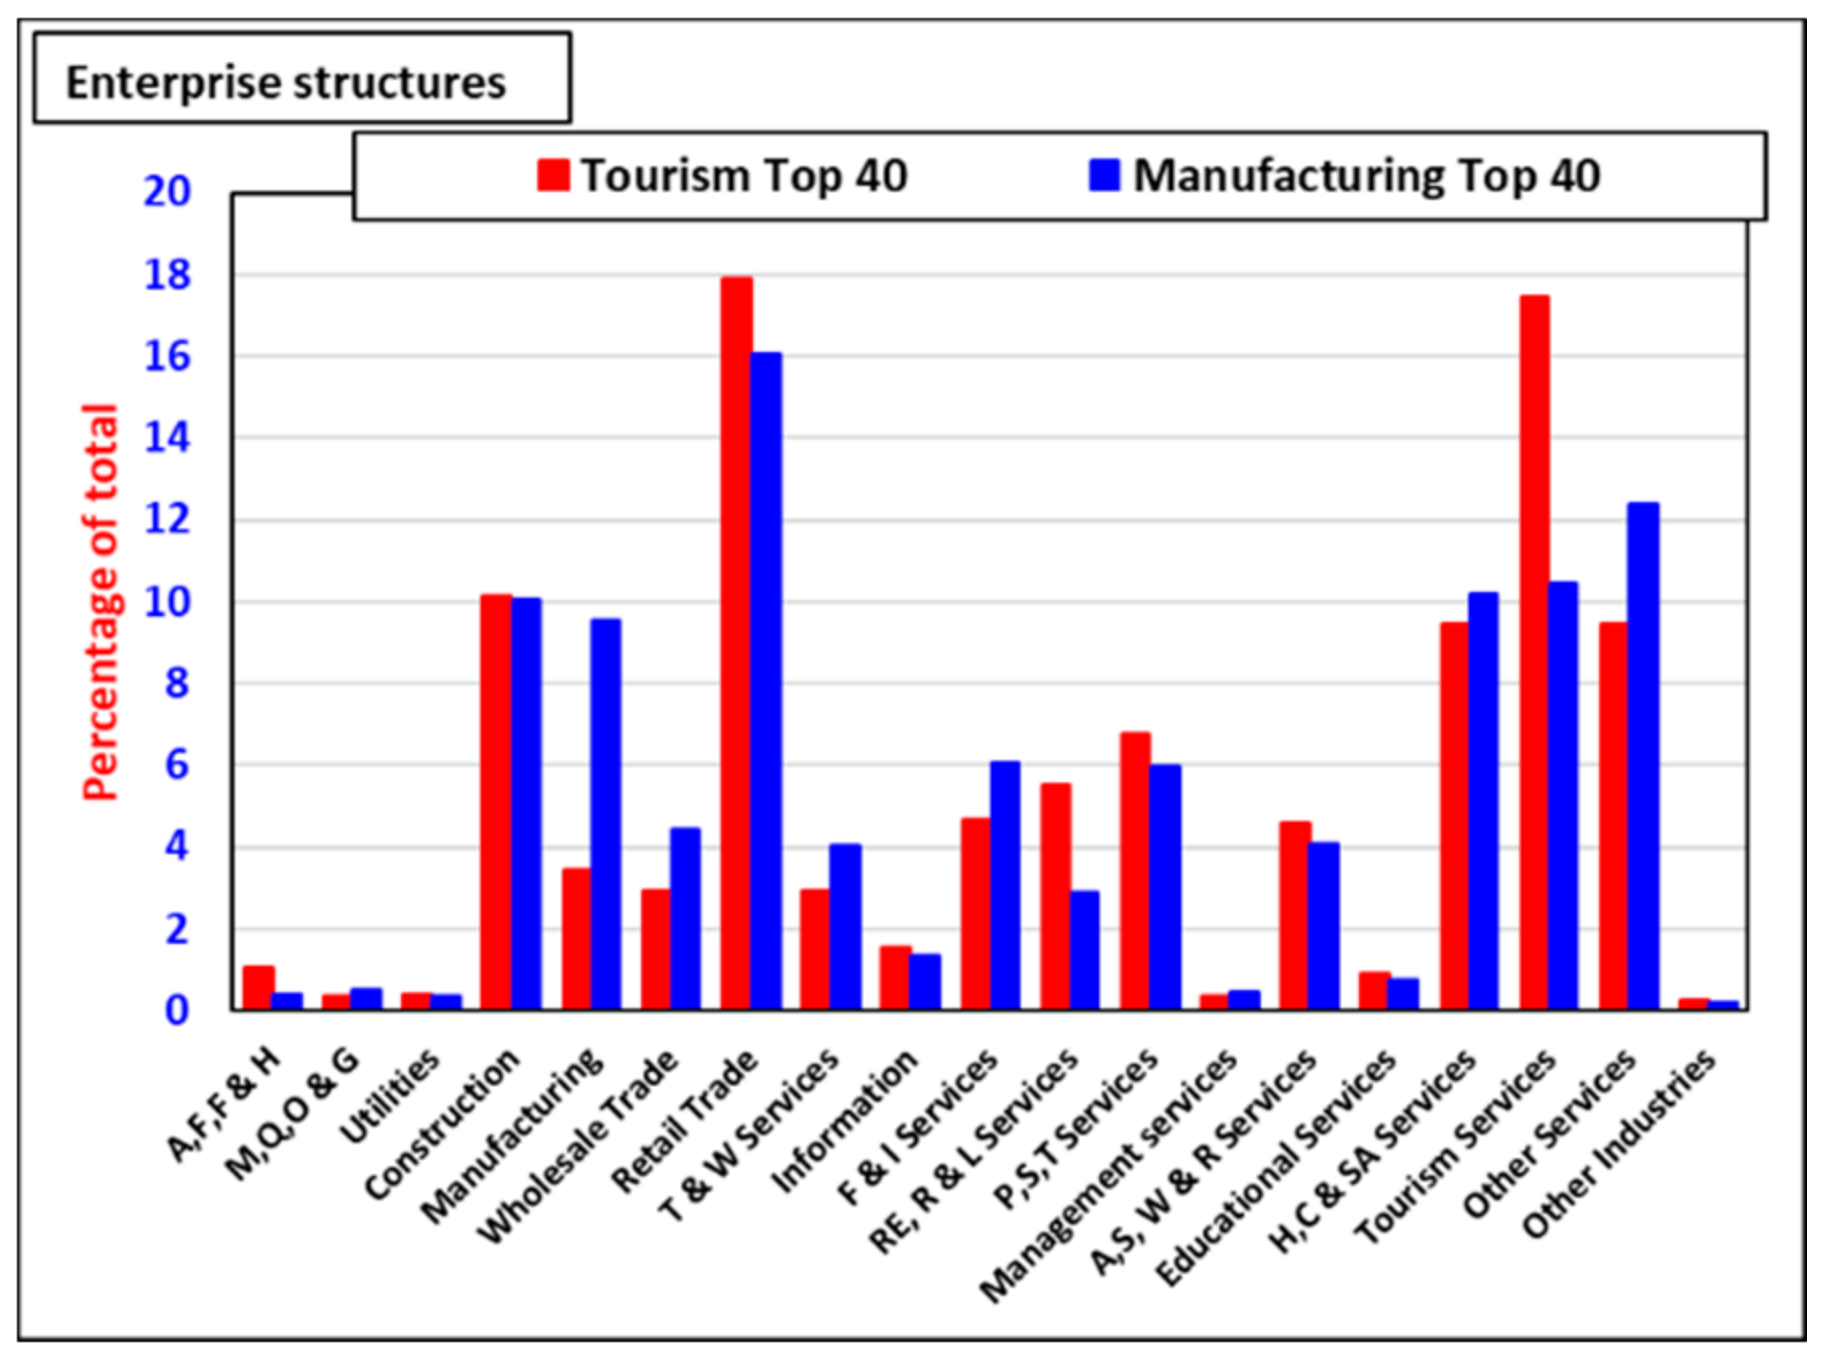
The enterprise structures (each sector expressed as a percentage of total enterprises) of the two groups are compared in Figure 12. As could be expected from Figure 11, the top 40 tourism micropolitans had a much higher tourism sector strength, and the top 40 manufacturing micropolitans had a much higher manufacturing strength. There were slight additional differences: somewhat higher retail trade, real estate services, and professional and scientific services sector strengths in the top 40 tourism micropolitans, and higher wholesale, transport, financial and insurance, and other services sector strengths in the top 40 manufacturing micropolitans. These differences did not indicate the presence of Dutch disease. A further analysis was required.
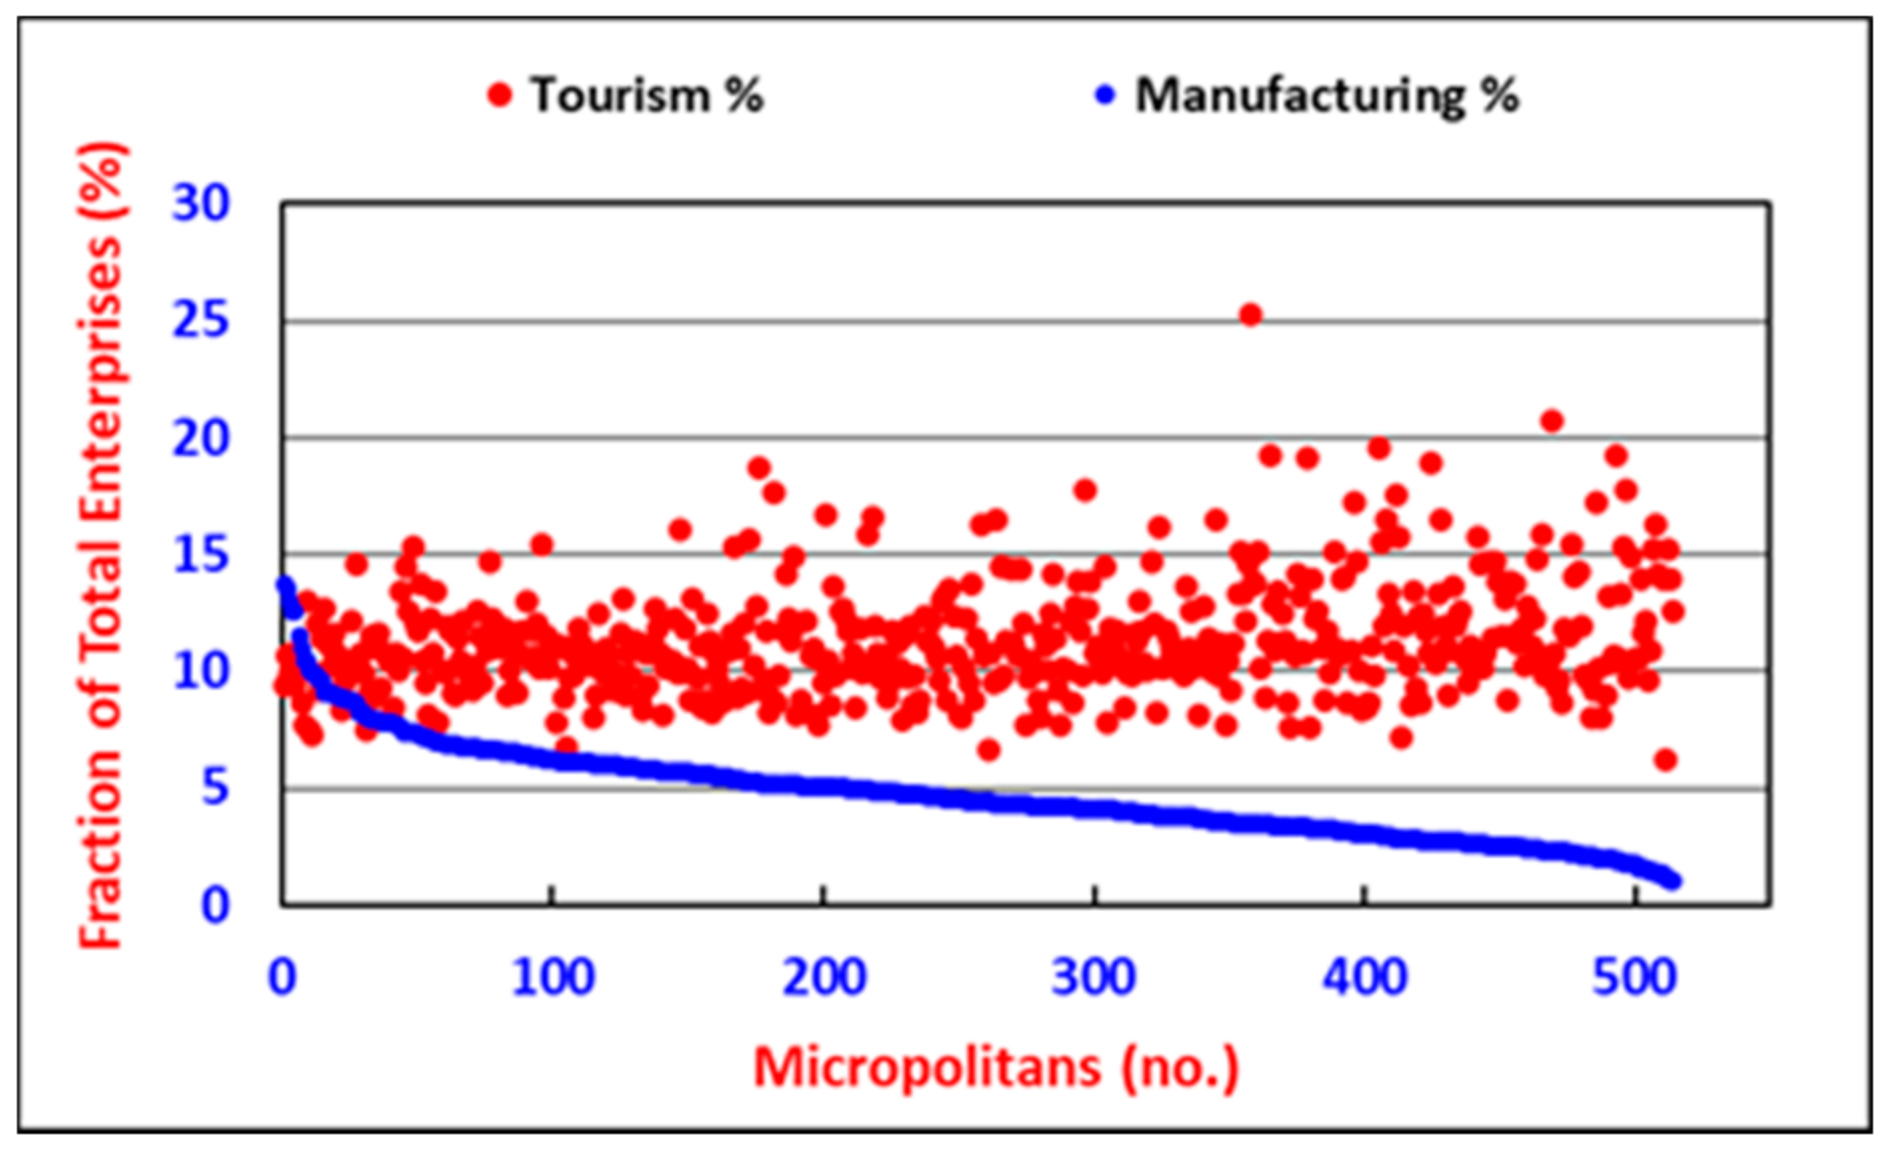
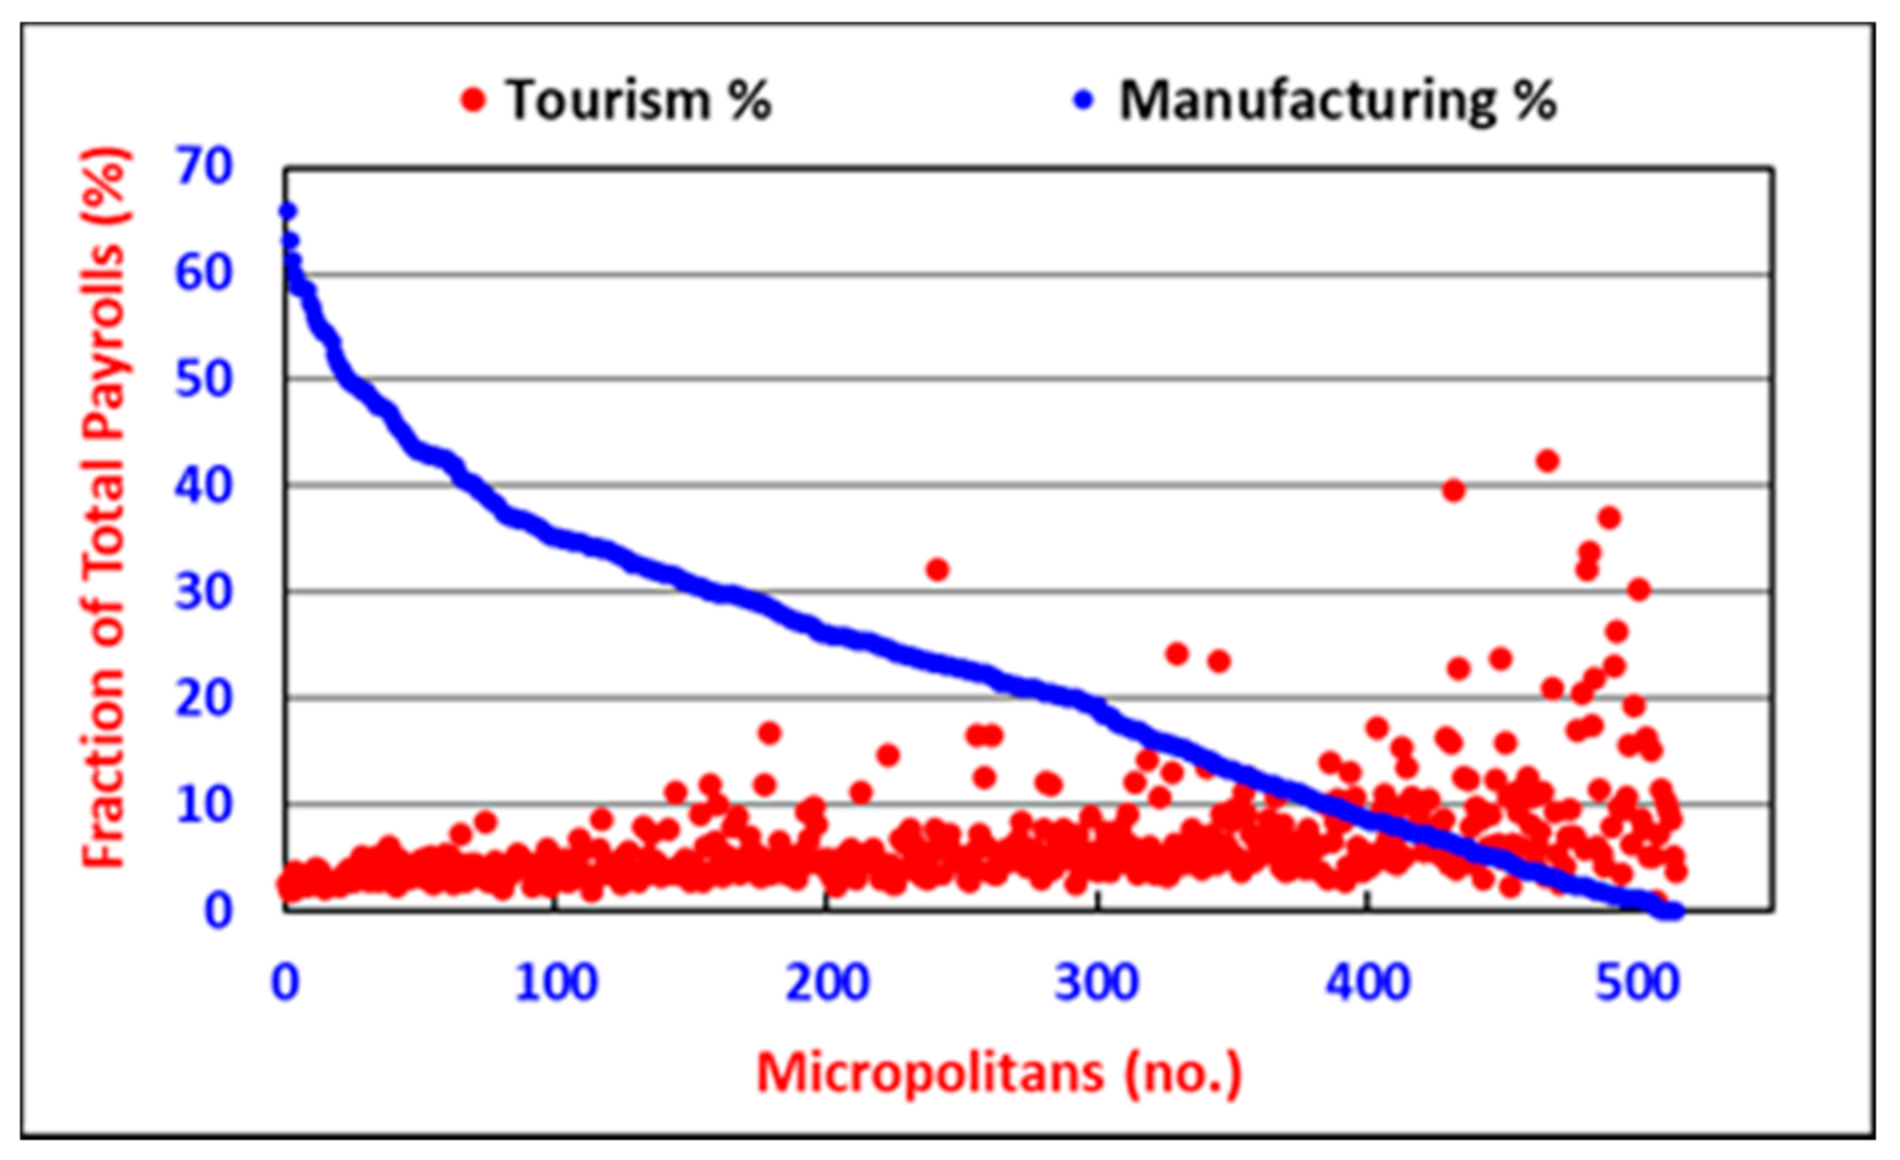
The final analysis comprised a number of additional comparisons. Firstly, the manufacturing strength of the micropolitans was compared with tourism strength, in which the former is ranked from highest to lowest value (Figure 13). There is a slight indication that the tourism sector gains strength when the manufacturing sector weakens.
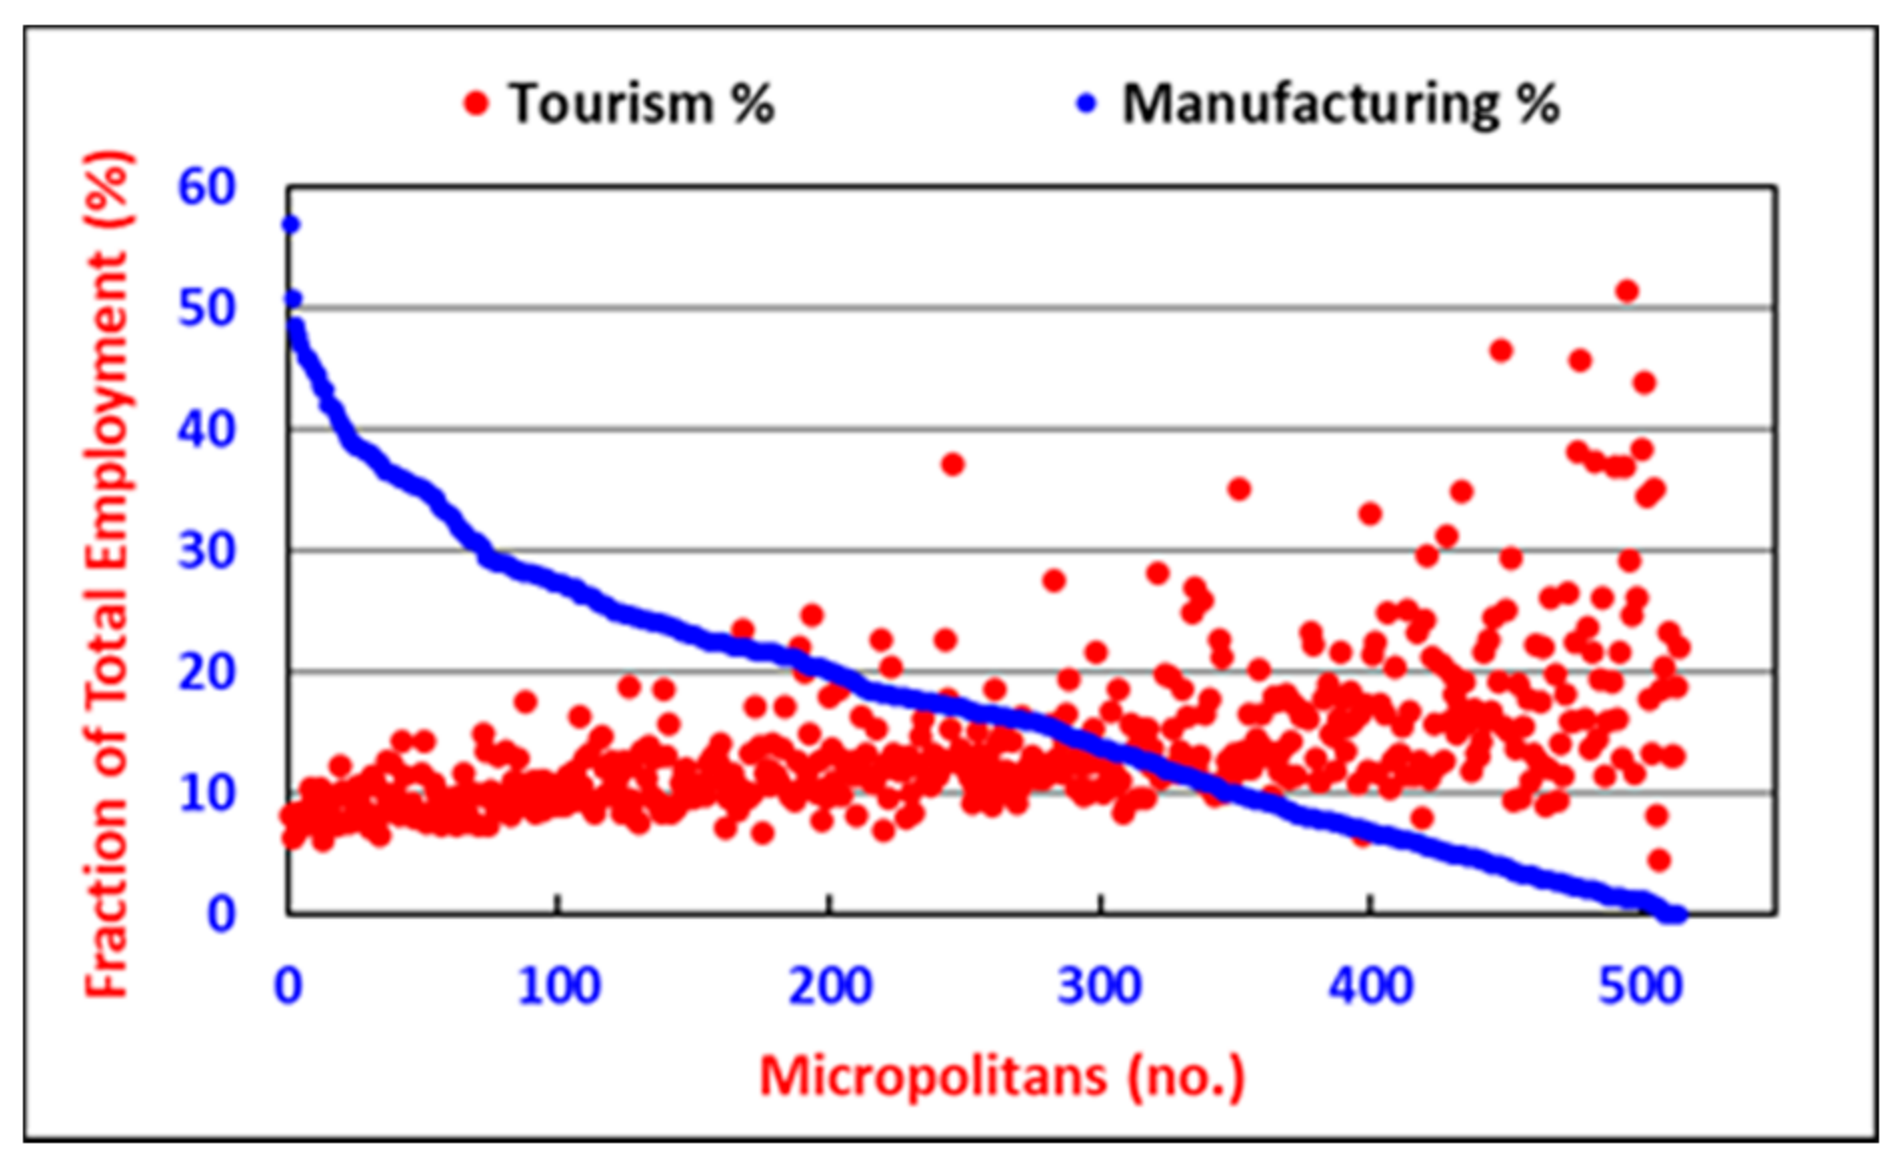
The above negative trend is more evident when the payroll strengths (Figure 14) and employment strengths (Figure 15) of the two sectors were compared.
It is possible that these observations could indicate the presence of Dutch disease. The negative relationships were subsequently confirmed in three linear regression analyses as follows:
Manufacturing enterprise strength (%) = 7.06 − 0.21(tourism enterprise strength, %)
where r = −0.24 and n = 514. Only 5.75% of the variation is explained. The negative relationship is statistically significant but fairly weak.
Manufacturing employment strength (%) = 30.92 − 0.97(tourism enterprise strength, %)
where r = −0.54 and n = 514. Variation explained amounts to 28.8%. The negative relationship is somewhat stronger in this case.
Manufacturing payroll strength (%) = 31.14 − 1.31(tourism payroll strength, %)
where r = −0.45 and n = 514. Variation explains amounts to 20.49%. The negative relationship is not as strong as that of the former equation.
Although more of the variation is explained by Equations (3) and (4), 70 to 80% of the variation is still not explained. The negative relationship between the manufacturing and tourism sectors is fairly weak. Overall, Dutch disease does not appear to be a particularly important issue in micropolitan enterprise dynamics.

4. Discussion

A hypothesis that Dutch disease is not important in the interaction between the tourism and manufacturing sectors of micropolitans was initially posed. The hypothesis raised some questions, e.g., are tourism and manufacturing activities in micropolitans part of the demographic–socioeconomic–entrepreneurial orderliness of micropolitans? are they subject to Dutch disease? do they singly, or in combination, offer potential to strengthen the resilience of micropolitans? It is now possible to consider potential answers.
As one would expect from settlement scaling theory [36], the micropolitans studied here exhibit population-based non-linear orderliness (Figure 1, Table 2). Some of their socioeconomic characteristics scale sub-linearly and others super-linearly with population numbers. Therefore, micropolitans, as human settlements, do not differ in this regard from human settlements such as metropolitan cities that exhibit a wide range of non-linear population-based socioeconomic and entrepreneurial relationships, e.g., [35,36,42]. There were no discernible relationships between the population strengths of the micropolitans (i.e., the portion of total micropolitan population numbers in each micropolitan) and the strengths of either their tourism or manufacturing characteristics (Figure 2 and Figure 3). Micropolitan population size apparently does not play a role in Dutch disease, should it be present.
Orderliness has been recorded in the enterprise structures of South African towns [45,46], US counties [32], US micropolitans [43], and US metropolitans [35]. Orderliness was also observed in the enterprise dynamics of the micropolitans studied here (Figure 4, Table 3). The enterprises of most of the business sectors of the micropolitans scale non-linearly with total enterprise numbers. Some scale sub-linearly and others super-linearly (Table 3). Specifically, tourism and manufacturing enterprises scale slightly super-linearly with the total enterprise numbers of the micropolitans. There is no evidence in the observed enterprise dynamics of the presence of Dutch disease between the tourism and manufacturing sectors.
The relationships between the enterprise numbers of the tourism and manufacturing sectors and their respective employment and payroll numbers have super-linear exponents (Figure 5, Figure 6, Figure 7 and Figure 8). In both sectors, employment and payrolls increase slightly disproportionately faster than increases in their enterprise numbers (Table 4, Table 5, Table 6 and Table 7). Micropolitans with more total enterprises tend to have more tourism and more manufacturing enterprises (Table 3). There is no evidence that total enterprise numbers play a role in the potential presence of Dutch disease.
There is a statistically significant positive correlation (r = 0.63, n = 514) between the number of manufacturing enterprises and tourism enterprises in the micropolitans (Figure 9). This relationship indicates that some have many tourism enterprises and many manufacturing enterprises, or vice versa. This observation does not support the presence of Dutch disease. However, when tourism and manufacturing enterprises are expressed as a percentage of total enterprises (i.e., as the entrepreneurial strength of each sector) and are then compared, evidence is obtained that there are different groups of micropolitans: (i) those with strong manufacturing and weak tourism sectors, (ii) those with strong tourism and weak manufacturing sectors, and (iii) a large in-between group (Figure 10 and Figure 11). Could these groupings result from differences in their enterprise structures? A comparison of the enterprise structures of the top 40 tourism micropolitans with those of the top 40 manufacturing micropolitans (Figure 12) indicates some differences but nothing to indicate that enterprise structures might play a role in the potential presence of Dutch disease.
Resorting to special comparisons of the strengths of the manufacturing and tourism sectors of micropolitans in terms of enterprise numbers, employment, and payrolls (Figure 13, Figure 14 and Figure 15) finally provides some evidence of a negative relationship between the two sectors and the possible presence of Dutch disease. However, because limited variation is explained by equations 1 to 3, it is concluded that Dutch disease is not a major issue in the enterprise dynamics of micropolitans. This agrees with the suggestion of Holzner [28] that exchange-rate distortion and deindustrialisation are not major issues in tourism-dependent countries. Two issues, however, suggest that Dutch disease between the tourism and manufacturing sectors in micropolitans should not be totally ignored. Firstly, Figure 13 shows that all micropolitans have substantial strength in the tourism sector. The tourism sector remains a revitalisation choice for micropolitans even if they have strong manufacturing sectors. Secondly, Larsen [19] considered the nature of Dutch disease and indicated that labour displacement, spending, and spill-over losses lead to Dutch disease. Successful sectors attract capital and labour from other sectors. Factor prices, such as wages, are then likely to increase. Higher prices cause other sectors to lose competitiveness, and they shrink. Based on Table 5, Table 6 and Table 7, a micropolitan with 160 manufacturers could have 8522 manufacturing sector employees, receiving some USD 427 million in wages, or about USD 50,100 per employee per annum. A micropolitan with 480 tourism enterprises could have 8545 tourism sector employees (i.e., almost the same as the previous example), receiving some USD 165.3 million in wages, or USD 19,350 per employee per annum. The wage differential between the two sectors indicates that manufacturing jobs are probably more attractive than tourism sector jobs in micropolitans with both sectors. This could promote a preference for work in the manufacturing sector.
The title of this contribution poses a revitalisation conundrum: should small human settlements such as micropolitans focus on manufacturing, tourism, or both? The answer (based on the rejection of the hypothesis) seems to be that it is not a choice between tourism or manufacturing but a focus on both sectors. Such a strategy should enhance the ability of small settlements (i.e., their resilience) to cope with economic shocks following events such as the Great Recession or the COVID-19 pandemic.
Settlement scaling theory [34,36,38,39,40,41] provided the scientific basis for this analysis. The use of an ‘entrepreneurial lens’ revealed non-linear orderliness in the enterprise dynamics of the micropolitans, which enabled a range of tests of a basic hypothesis about two enterprise sectors in United States counties. US counties served as representatives of small human settlements. This was the first time in which enterprise scaling analyses were used to investigate a question about the revitalisation of small human settlements. This approach provided some new insights. Given the paucity of information about enterprise sector comparisons, further application of this type of analysis is needed to deal with questions about resilience in, and revitalisation of, small towns.

Funding

Research funding was provided by the University of the Free State. There was no conflict of interest involved.

Institutional Review Board Statement

Not applicable.

Informed Consent Statement

Not applicable.

Data Availability Statement

Not applicable.

Acknowledgments

The Centre for Environmental Management, University of the Free State, provided administrative and research support. Alumnus services of the Massachusetts Institute of Technology provided online scholarly journal access. Jean le Roux provided technical assistance. Datasets of the United States Census Bureau were used.

Conflicts of Interest

The author declares no conflict of interest.

References

  1. Marré, A. Rural population loss and strategies for recovery. Econ. Focus First Quart. 2020, 1Q, 27–30. [Google Scholar]
  2. Johnson, K.M.; Voss, P.R.; Hammer, R.B.; Fuguitt, G.V.; McNiven, S. Temporal and spatial variation in age-specific net migration in the United States. Demography 2005, 42, 791–812. [Google Scholar] [CrossRef] [PubMed]
  3. Johnson, K.M. Rural Demographic Change in the New Century: Slower Growth, Increased Diversity; No. 44; Carsey Institute Issue Brief: Durham, NH, USA, 2012. [Google Scholar]
  4. Tacoli, C.; Agergaard, J. Urbanisation, Rural Transformations and Food Systems: The Role of Small Towns; IIED Working Paper; IIED: London, UK, 2017. [Google Scholar]
  5. Hart, J.F. Small towns and manufacturing. Geogr. Rev. 1988, 78, 272–287. [Google Scholar] [CrossRef]
  6. Desilver, D. Most Americans Unaware That as U.S. Manufacturing Jobs Have Disappeared, Output Has Grown; Facttank; Pew Research Center: Washington, DC, USA, 2017; Available online: https://www.pewresearch.org/fact-tank/2017/07/25/most-americans-unaware-that-as-u-s-manufacturing-jobs-have-disappeared-output-has-grown/ (accessed on 22 May 2021).
  7. Devol, R.; Wisecarver, S. Micropolitan Success Stories from the Heartland; The Walton Foundation: Bentonville, AR, USA, 2018. [Google Scholar]
  8. Devol, R.; Crews, J.; Wisecarver, S. Most Dynamic Micropolitans; Walton Foundation: Bentonville, AR, USA, 2019. [Google Scholar]
  9. Hasanov, F. Dutch Disease and the Azerbaijan economy. Communist Post Communist Stud. 2013, 46, 463–480. [Google Scholar]
  10. Hlatshwayo, S.; Spence, M. Demand and defective growth patterns: The role of the tradable and non-tradable sectors in an open economy. Am. Econ. Rev. 2014, 104, 272–277. [Google Scholar] [CrossRef] [Green Version]
  11. Moretti, E. The New Geography of Jobs; Mariner Books: Boston, MA, USA, 2013. [Google Scholar]
  12. Moretti, E.; Thulin, P. Local multipliers and human capital in the United States and Sweden. Ind. Corp. Chang. 2013, 22, 339–362. [Google Scholar] [CrossRef] [Green Version]
  13. UNWTO. International Tourism Highlights; United Nations World Tourism Organization: Madrid, Spain, 2019. [Google Scholar]
  14. Zeng, D.-Z.; Zhuy, X. Tourism and industrial agglomeration. Jpn. Econ. Rev. 2010, 62, 537–561. [Google Scholar] [CrossRef]
  15. Hazari, B.R.; Sgro, P.M. Tourism, Trade and National Welfare; Elsevier: Amsterdam, The Netherlands, 2004. [Google Scholar]
  16. Forsyth, P.; Dwyer, L.; Spurr, R. Is Australian tourism suffering Dutch Disease? Ann. Tour. Res. 2014, 46, 1–15. [Google Scholar] [CrossRef]
  17. Bolwell, D.; Weinz, W. Reducing Poverty through Tourism; International Labour Office, ILO Sectoral Activities Programme: Geneva, Switzerland, 2008. [Google Scholar]
  18. Copeland, B.R. Tourism, welfare and de-industrialization in a small open economy. Economica 1991, 58, 515–529. [Google Scholar] [CrossRef]
  19. Larsen, E.R. Escaping the Resource Curse and the Dutch Disease? When and why Norway caught up with and forged ahead of its neighbors. Am. J. Econ. Soc. 2006, 65, 605–640. [Google Scholar] [CrossRef]
  20. Nowak, J.; Sahli, M. Coastal tourism and ‘Dutch disease’ in a small island economy. Tour. Econ. 2007, 13, 49–65. [Google Scholar] [CrossRef]
  21. Van der Ploeg, F. Natural resources: Curse or blessing? J. Econ. Lit. 2011, 49, 366–420. [Google Scholar] [CrossRef] [Green Version]
  22. Corden, W.; Neary, J. Booming sector and de-industrialisation in a small open economy. Econ. J. 1982, 92, 825–848. [Google Scholar] [CrossRef] [Green Version]
  23. Mathew, P.M. India’s ‘Dutch Disease’: Can SMEs provide the medicine? Econ. Polit. Wkly. 2014, 49, 191–192. [Google Scholar]
  24. Beine, M.; Coulombe, S.; Vermeulen, W.N. Dutch Disease and the mitigation effect of migration: Evidence from Canadian provinces. Econ. J. 2015, 125, 1574–1615. [Google Scholar] [CrossRef] [Green Version]
  25. MacEwan, A. Puerto Rico: Suffering the “Dutch Disease” in reverse. Soc. Econ. Stud. 2017, 66, 185–210. [Google Scholar]
  26. Chao, C.; Hazari, B.R.; Laffargue, J.; Sgro, P.M.; Yu, E.S.H. Tourism, Dutch Disease and welfare in an open dynamic economy. Jpn. Econ. Rev. 2006, 57, 501–515. [Google Scholar] [CrossRef]
  27. Ojaghlou, M. Tourism-led growth and risk of the Dutch Disease: Dutch Disease in Turkey. Int. J. Bus. Res. 2019, 12, 103–120. [Google Scholar] [CrossRef]
  28. Holzner, M. Tourism and economic development: The Beach Disease? Tour. Manag. 2011, 32, 922–933. [Google Scholar] [CrossRef] [Green Version]
  29. U.S. Census Bureau. Micropolitan America; 2019. Available online: https://www.census.gov/library/visualizations/2019/demo/micropolitan-america.html (accessed on 15 January 2021).
  30. Partridge, M.D.; Rickman, D.S. The Geography of American Poverty: Is There a Need for Place-Based Policies? W.E. Upjohn Institute for Employment Research: Kalamazoo, MI, USA, 2006; Available online: https://research.upjohn.org/cgi/viewcontent.cgi?article=1012&context=up_press (accessed on 22 May 2021).
  31. Toerien, D.F. Disproportionate agglomeration and scaling in regional socioeconomic analyses: Alabama counties as a case study. Cogent. Soc. Sci. 2020, 6, 1817256. [Google Scholar] [CrossRef]
  32. Toerien, D.F. Power laws and the demographic-socioeconomic-entrepreneurial nexus of United States counties. In Advances in Sociology Research; Jaworski, J.A., Ed.; Nova Science Publishers: New York, NY, USA, 2020; Volume 32, pp. 65–115. [Google Scholar]
  33. Toerien, D.F. Entrepreneurial space and enterprise richness in a group of U.S. counties before, during, and after economic turmoil. J. Rural Comm. Dev. 2021, 16, 175–194. [Google Scholar]
  34. Bettencourt, L.M.A. The origins of scaling in cities. Science 2013, 340, 1438–1441. [Google Scholar] [CrossRef] [PubMed] [Green Version]
  35. Youn, H.; Bettencourt, L.M.A.; Lobo, J.; Strumsky, D.; Samaniego, H.; West, G.B. Scaling and universality in urban economic diversification. J. R. Soc. Interface 2016, 13, 20150937. [Google Scholar] [CrossRef] [PubMed] [Green Version]
  36. Lobo, J.; Bettencourt, L.M.; Smith, M.; Ortman, S. Settlement scaling theory: Bridging the study of ancient and contemporary urban systems. Urban Stud. 2020, 57, 731–747. [Google Scholar] [CrossRef]
  37. Bettencourt, L.M.A.; Lobo, J.; Youn, H. The hypothesis of urban scaling: Formalization, implications and challenges. arXiv 2013, arXiv:1301.5919. [Google Scholar]
  38. Ortman, S.G.; Davis, K.E.; Lobo, J.; Smith, M.E.; Bettencourt, L.M.A.; Trumbo, A. Settlement scaling and economic change in the Central Andes. J. Archaeol. Sci. 2016, 73, 94e106. [Google Scholar] [CrossRef] [Green Version]
  39. Ribeiro, F.L.; Lobo, J.; Rybski, D. Zipf’s law and urban scaling: Hypotheses towards a Unified Urban Theory. arXiv 2021, arXiv:2107.11782v1. [Google Scholar]
  40. Schläpfer, M.; Bettencourt, L.M.A.; Grauwin, S.; Raschke, M.; Claxton, R.; Smoreda, Z.; West, G.B.; Ratti, C. The scaling of human interactions with city size. J. R. Soc. Interface 2014, 11, 20130789. [Google Scholar] [CrossRef]
  41. Bettencourt, L.M.A. Impact of changing technology on the evolution of complex informational networks. Proc. IEEE 2014, 102, 1878–1891. [Google Scholar] [CrossRef]
  42. Bettencourt, L.M.A.; Lobo, J.; Helbing, D.; Kühnert, C.; West, G.B. Growth, innovation, scaling, and the pace of life in cities. Proc. Natl. Acad. Sci. USA 2007, 104, 7301–7306. [Google Scholar] [CrossRef] [Green Version]
  43. Toerien, D. Orderliness in tourism enterprise dynamics in United States micropolitan statistical areas. Sustainability 2021, 13, 6180. [Google Scholar] [CrossRef]
  44. Walker, B. Resilience: What it is and is not. Ecol. Soc. 2020, 25, 11. [Google Scholar] [CrossRef]
  45. Toerien, D.F.; Seaman, M.T. The enterprise ecology of towns in the Karoo, South Africa. S. Afr. J. Sci. 2010, 106, 1–10. [Google Scholar] [CrossRef] [Green Version]
  46. Toerien, D.F.; Seaman, M.T. Proportionality in enterprise development of South African towns. S. Afr. J. Sci. 2012, 108, 1–10. [Google Scholar] [CrossRef]
  47. Toerien, D.F. Productive knowledge, scaling, enterprise richness and poverty in a group of small U.S. counties. Cogent Soc. Sci. 2018, 4, 1560883. [Google Scholar] [CrossRef]
  48. U.S. Census Bureau. 2016 SUSB Annual Data Tables by Establishment Industry; 2018. Available online: https://www.census.gov/data/tables/2016/econ/susb/2016-susb-annual.html (accessed on 25 May 2021).
  49. United States. North American Industry Classification System; Executive Office of the President: Washington, DC, USA, 2017. [Google Scholar]
  50. U.S. Census Bureau. Annual Estimates of the Resident Population for Micropolitan Statistical Areas in the United States and Puerto Rico: 1 April 2010 to 1 July 2019. 2021. Available online: https://www.census.gov/data/tables/time-series/demo/popest/2010s-total-metro-and-micro-statistical-areas.html (accessed on 18 June 2021).
  51. West, G. Scale: The Universal Laws of Life and Death in Organisms, Cities and Companies; Weidenfeld & Nicolson: London, UK, 2017. [Google Scholar]
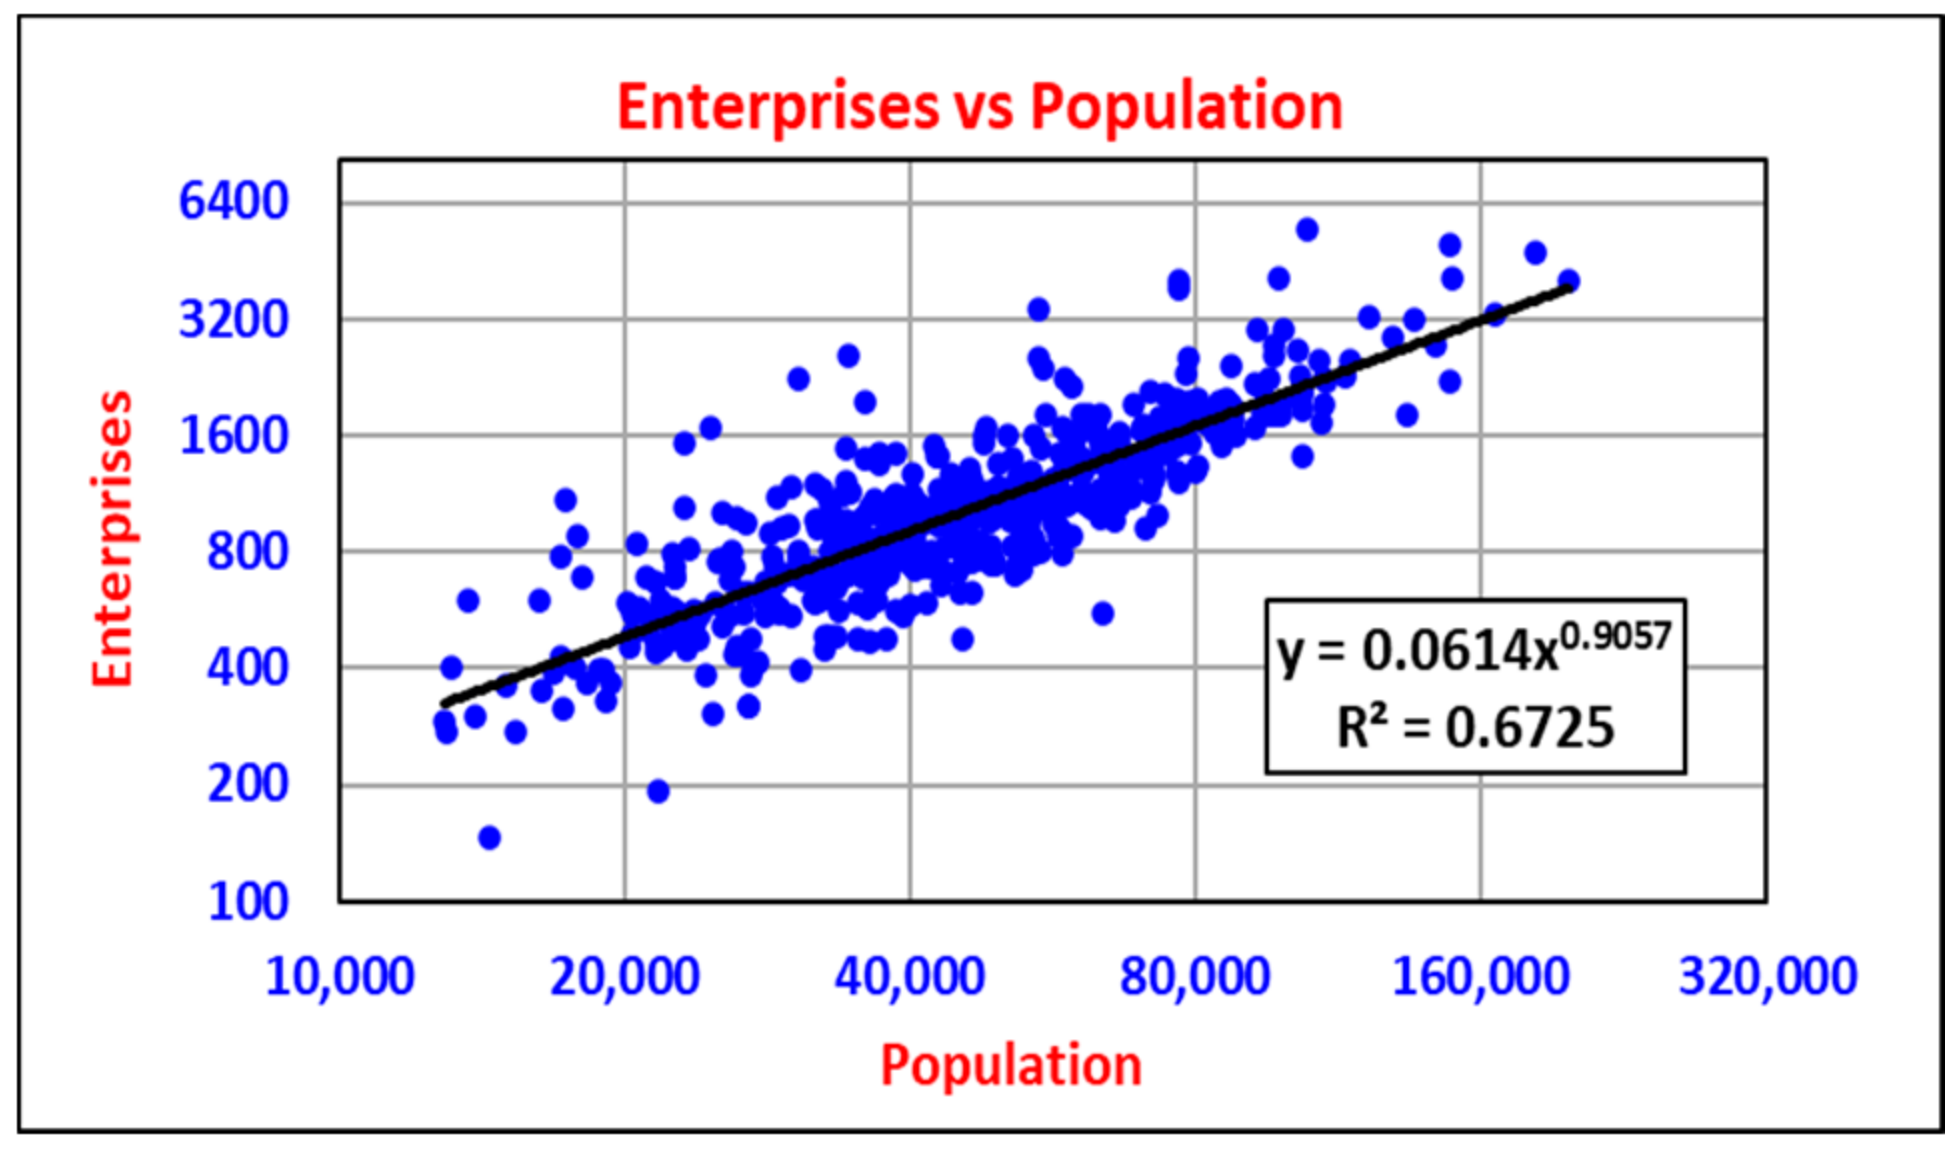
Figure 1. The 2016 association between population numbers and enterprise numbers in United States micropolitan statistical areas.
Energies 14 07568 g001
Figure 2. Comparison of ranked population strengths (percentage of total micropolitan population, blue dots) of micropolitans with (A) the strength of their tourism enterprises (percentage of total tourism enterprises, red dots) and (B) the strength of their manufacturing enterprises (percentage of total manufacturing enterprises, red dots).
Energies 14 07568 g002
Figure 3. Comparison of ranked population strengths (percentage of total micropolitan population, blue dots) of micropolitans with (A) the strength of their tourism employment (percentage of total tourism employment, red dots) and (B) the strength of their manufacturing employment (percentage of total manufacturing employment, red dots).
Energies 14 07568 g003
Figure 4. The power-law association between total enterprise numbers and the combined numbers of wholesale and retail enterprises in US micropolitans. The power law has a sub-linear exponent of 0.94.
Energies 14 07568 g004
Figure 5. The power-law association between the number of manufacturing enterprises and manufacturing employment in United States micropolitans.
Energies 14 07568 g005
Figure 6. The power-law association between the number of manufacturing enterprises and manufacturing payrolls in United States micropolitans.
Energies 14 07568 g006
Figure 7. The power-law association between the number of tourism enterprises and tourism employment in United States micropolitans.
Energies 14 07568 g007
Figure 8. The power-law relationship between the number of tourism enterprises and tourism payrolls in United States micropolitans.
Energies 14 07568 g008
Figure 9. The linear relationship between manufacturing and tourism enterprises in United States micropolitans.
Energies 14 07568 g009
Figure 10. A comparison of the strengths (% of total enterprises) of the tourism and manufacturing sectors of United States micropolitans.
Energies 14 07568 g010
Figure 11. A comparison of 40 micropolitans with the strongest tourism sectors (red dots) and 40 micropolitans with the strongest manufacturing sectors (blue dots). Strength is based on the percentage of either tourism or manufacturing enterprise numbers relative to total enterprise numbers.
Energies 14 07568 g011
Figure 12. The enterprise structures of the top 40 tourism and the top 40 manufacturing United States micropolitans. The structure reflects the proportion (%) of the total sector enterprise numbers relative to the total group enterprise numbers. The explanation of the abbreviations of the business sectors is presented in Table 1.
Energies 14 07568 g012
Figure 13. Tourism strengths (% of total enterprises) of the micropolitans, compared with ranked manufacturing sector strengths (% of total enterprises).
Energies 14 07568 g013
Figure 14. Payroll strengths (% of total) of the micropolitans, compared with ranked manufacturing sector strengths (% of total).
Energies 14 07568 g014
Figure 15. Employment strengths (% of total) of the micropolitans, compared with ranked manufacturing sector strengths (% of total).
Energies 14 07568 g015
Table 1. The economic sectors based on the first two numbers of the six-digit North American Industrial Classification System [49] into which all micropolitan enterprises were classified before enumerating sector enterprises.
NumberSix-Digit NAICS
Classifications Starting with
Economic Sectors
111Agriculture, forestry, fishing and hunting
221Mining, quarrying, and oil and gas extraction
322Utilities
423Construction
531,32,33Manufacturing
642,44,45Wholesale trade and retail trade
748,49Transport and warehousing
851Information
952Finance and insurance
1053Real estate and rental and leasing.
1154,55Professional, scientific, technical services and management of companies and enterprises
1256Administrative and support and waste management and remediation services
1361Educational services
1462Health care and social assistance
1571Arts, entertainment, and recreation
1672Accommodation and food services
1781Other services
Note: Tourism enterprises were estimated by combining the enterprise numbers of sectors 71 and 72 according to [43].
Table 2. Power-law associations between population numbers and different economic and entrepreneurial characteristics of United States micropolitans.
Characteristic No. 1Characteristic No. 2R2ExponentConstant
PopulationGDP0.66980.8744156.67
PopulationEmployees0.76321.00620.2762
PopulationPayrolls0.65321.01339.1494
PopulationTourism enterprises0.52420.92030.0058
PopulationManufacturing enterprises0.53531.04250.0006
Table 3. The power-law associations between total enterprise numbers and the enterprises of different business sectors of US micropolitans. R2 represents the fraction of variation explained.
Independent
Characteristic
Dependent
Characteristic
R2ExponentConstant
Total enterprise numbersFinancial and insurance services0.78520.82580.2067
Total enterprise numbersConstruction services0.82211.19950.0228
Total enterprise numbersTransport and warehousing services0.47060.84850.1012
Total enterprise numbersInformation services0.78720.90360.0301
Total enterprise numbersManufacturing enterprises0.55831.0670.027
Total enterprise numbersTourism enterprises0.85791.03430.0873
Table 4. Manufacturing employment in relation to the number of manufacturers in United States micropolitans. The power law in Figure 5 was used in the calculations.
Manufacturing
Enterprises
Manufacturing
Employment
Doubling RatioEmployees per
Enterprise
10278 27.8
206542.3532.7
4015382.3538.5
8036212.3545.3
16085222.3553.3
Table 5. Manufacturing payrolls in relation to the number of manufacturers in United States micropolitans. The power law in Figure 6 was used in the calculations.
Manufacturing
Enterprises
Manufacturing Payroll (USD 1000)Doubling RatioPayroll (USD 1000) per Enterprise
1011,531 1153.1
2028,4452.471422.2
4070,1712.471754.3
80173,1052.472163.8
160427,0332.472669.0
Table 6. Tourism payrolls in relation to the number of tourism enterprises in United States micropolitans. The power law in Figure 7 was used in the calculations.
Tourism EnterprisesTourism EmploymentDoubling RatioEmployment per Enterprise
30408 13.6
608722.1414.5
12018662.1415.6
24039942.1416.6
48085452.1417.8
Table 7. Tourism payrolls in relation to the number of tourism enterprises in United States micropolitans. The power law in Figure 8 was used in the calculations.
Tourism EnterprisesPayroll (USD 1000)Doubling RatioPayroll (USD 1000) per Enterprise
304789 159.6
6011,6082.42193.5
12028,1392.42234.5
24068,2102.42284.2
480165,3422.42344.5
Publisher’s Note: MDPI stays neutral with regard to jurisdictional claims in published maps and institutional affiliations.