Article

Experimental Investigation of EU-DEMO Breeding Blanket First Wall Mock-Ups in Support of the Manufacturing and Material Development Programmes

1
Karlsruhe Institute of Technology, Institute for Neutron Physics and Reactor Technology, 76131 Karlsruhe, Germany
2
Karlsruhe Institute of Technology, Institute for Applied Materials, 76131 Karlsruhe, Germany
*
Author to whom correspondence should be addressed.
Energies 2021, 14(22), 7580; https://doi.org/10.3390/en14227580
Submission received: 29 September 2021 / Revised: 29 October 2021 / Accepted: 8 November 2021 / Published: 12 November 2021
(This article belongs to the Special Issue Thermal-Hydraulics in Nuclear Fusion Technology: R&D and Applications)

Abstract

:
This paper presents the testing campaign of the two First Wall mock-ups in the HELOKA facility, one mock-up having a 3 mm thick Oxide Dispersion Strengthened (ODS) steel layer on its surface and the other featuring a tungsten functionally graded cover. Special consideration is given to the diagnostics used for these tests, in particular, the measurement of the surface temperature of the tungsten functionally graded layer with an infrared camera. Additionally, the paper looks into the uncertainty associated with the calorimetric evaluation of the applied heating power for these experiments.

1. Introduction

The presently estimated surface loadings of the EU-DEMO blanket are pushing the design of the Helium Cooled Pebble Bed breeding blanket closer to the upper limits of the operation window for the Eurofer97 (European reduced activation ferritic martensitic steel). To mitigate this issue, various approaches have been investigated. To increase the temperature upper limits and improve the neutron irradiation performance, novel nanostructured Oxide Dispersion Strengthened (ODS) steels have been developed [1]. Additionally, to reduce the sputtering due to particle loading of the first wall (FW), the application of a tungsten coating has been considered [2]. Given the difference in the thermal expansion coefficient between the two materials, the experimental demonstration of the good adhesion and stability of such a coating under high heat flux loading is required. To evaluate experimentally the behavior of an ODS first wall under high heat loadings as well as the qualification of the tungsten coating procedures, two FW mock-ups have been manufactured and tested in the Helium Loop Karlsruhe (HELOKA) at KIT: (i) an FW mock-up with 3 mm ODS plate joined to Eurofer97 plate by diffusion welding [3], and (ii) an FW mock-up with Functionally Graded Tungsten/Eurofer97 coating (about 1.4 mm) by vacuum plasma spraying [4]. Both mock-ups have cooling channels of shapes and sizes used for the design of the DEMO blanket and have been subject to high heat flux cyclic loading while being cooled by helium at blanket relevant operating conditions of 8 MPa and 300 °C (mock-up inlet conditions). The FW mock-ups were installed inside the HELOKA vacuum vessel (VV), and heated using an electron beam gun (EBG) attached to the top of the VV. During testing the typical vacuum level was 10−4 mbar, a vacuum level that was found to be optimal for the EBG operation. More details and information about HELOKA may be found in reference [5].
The objectives of this paper are to cover the following: (i) testing of the FW mock-ups under blanket FW operating conditions, namely, cyclic high heat flux and cooling with helium at 80 bar and 300–350 °C, (ii) describing the diagnostics used in the testing campaign, especially the surface temperature measurement with an IR camera and the evaluation of the applied heating power, and (iii) presenting the relevant measurements obtained during the experiments. Regarding the paper structure, the FW mock-ups are introduced in Section 2. Then, in Section 3, the measurement sensors and diagnostic tools are presented, followed by Section 4, which contains the testing parameters for both mock-ups. Section 5 has two subsections presenting the experimental results of each mock-up. At the end of the paper, Section 6 is dedicated to the conclusions.

2. Mock-Ups and Experimental Set-Up Description

The two mock-ups, the Functional Graded Tungsten/Eurofer FW (hereafter designated by FG-FW) and the combined ODS/Eurofer97 FW (ODS-FW), have three and, correspondingly, five cooling channels of rectangular cross-section, 10 × 15 mm2, with 2 mm filet radius at the corners (see Figure 1b and Figure 2b). The only exception is the middle channel (3rd channel) in the ODS mock-up, which has a height of 11 mm, the wall thickness towards the heat-loaded surface being 2.5 mm, with 1 mm thinner than this for the rest of the channels. The channels are separated one from the other by a 5 mm thick wall. For the FG-FW, a thermocouple is inserted in a 1.5 mm hole made in the wall between the 2nd and 3rd channel at mid distance between the channel’s inlet and outlet. The hole, drilled from the back-side of the mock-up, has a depth of 18 mm allowing monitoring of the temperature field at 3.4 mm below the heat-loaded surface (1.4 mm functional graded coating and 2 mm base material), as can be seen in Figure 1b.
The FG mock-up was made out of a 300 × 100 × 20 mm3 Eurofer97 plate, the coating being applied over a 270 × 62 mm2 surface. As can be seen in Figure 1, the coating is applied slightly asymmetric with respect to the plate width, one side being at about 20 mm away from the edge and at around 2.5 mm from the 1st channel side wall, the other side extending 4.5 mm from the 3rd channel wall.
For the ODS mock-up, the cooling channels were cut in a 208 × 160 × 24 mm3 plate through electro-discharge wire cutting, as can be seen in Figure 2a. From Figure 2b it can be seen that the cooling channels 1, 2, 4 and 5 have a wall thickness towards the heat-loaded side of 3.5 mm. From this wall thickness, 3 mm is ODS steel and 0.5 mm is Eurofer97. Channel 4’s height was intentionally increased to 11 mm so that the channel wall contained only ODS steel. Thus, the wall thickness was reduced to 2.5 mm and the zone where the joining between ODS and Eurofer97 occurred is exposed to the coolant.
More details about the design and manufacture of the FG and ODS mock-ups are reported in references [3,4], respectively.
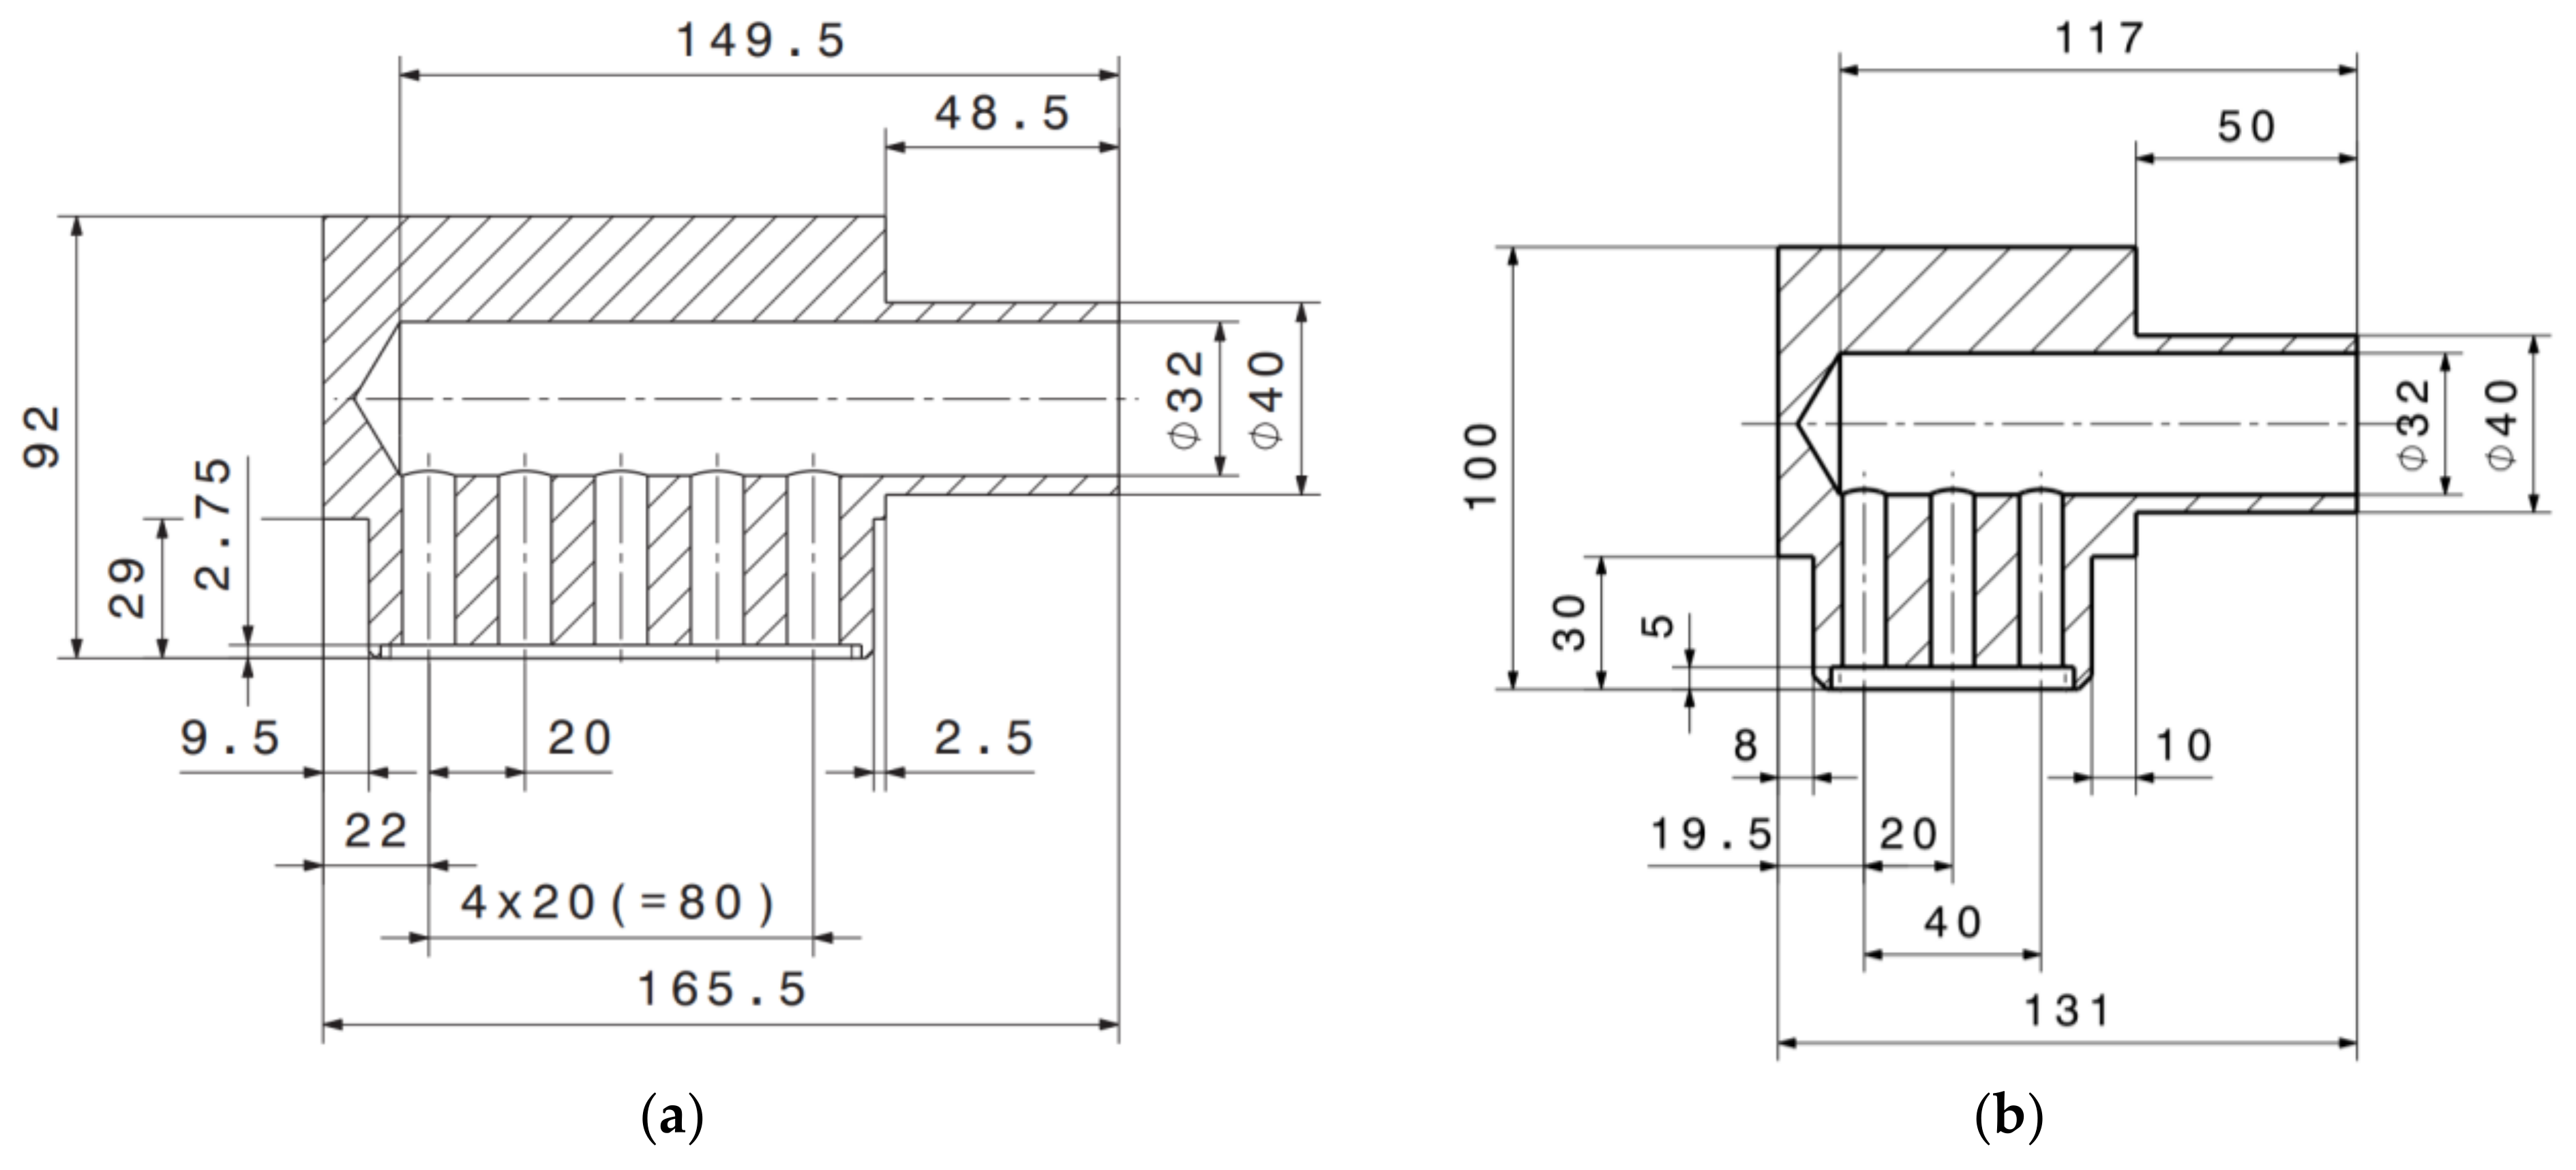
The helium distribution in the cooling channels was conducted using specially designed inlet/outlet manifolds. The design of these flow distributors was optimized for achieving a uniform mass flow distribution in the cooling channels of the ODS mock-up, assuming a nominal flow rate per channel of 40 g/s (200 g/s in total). As can be seen in Figure 3a, the manifolds have a large cylindrical chamber, 32 mm in diameter, where the helium either coming from the loop or from the channels gathers. For the inlet, the helium flows from this chamber towards the cooling channels through 11 mm in diameter and 30 mm long holes. These round channels have the same axis as the cooling channels themselves and have the function of stabilizing the flow reducing the transverse component of the flow. The Computational Fluid Dynamics (CFD) analyses performed with ANSYS CFX show that the expected deviation from the nominal value ranges from around 4% below the nominal flow rate, in the case of channel 1, and up to 3.5% excess flow in the case of channel 3 (see Table 1), values that are considered as acceptable for the foreseen testing conditions.
The inlet/outlet manifolds for the FG mock-up (Figure 3b) were manufactured without any prior CFD analysis by taking the same cross-section (in the flow direction) as for the ODS mock-up manifolds and simply reducing the flow distribution length from 100 mm (5 channels mock-up) to 60 mm (3 channels mock-up).
During testing, the mock-ups were cooled in parallel but, since the set-up does not allow controlling the flow independently for each mock-up, during a testing session, the surface heat loading was applied only on one mock-up, while the flow rate through that particular item was adjusted to the required value.
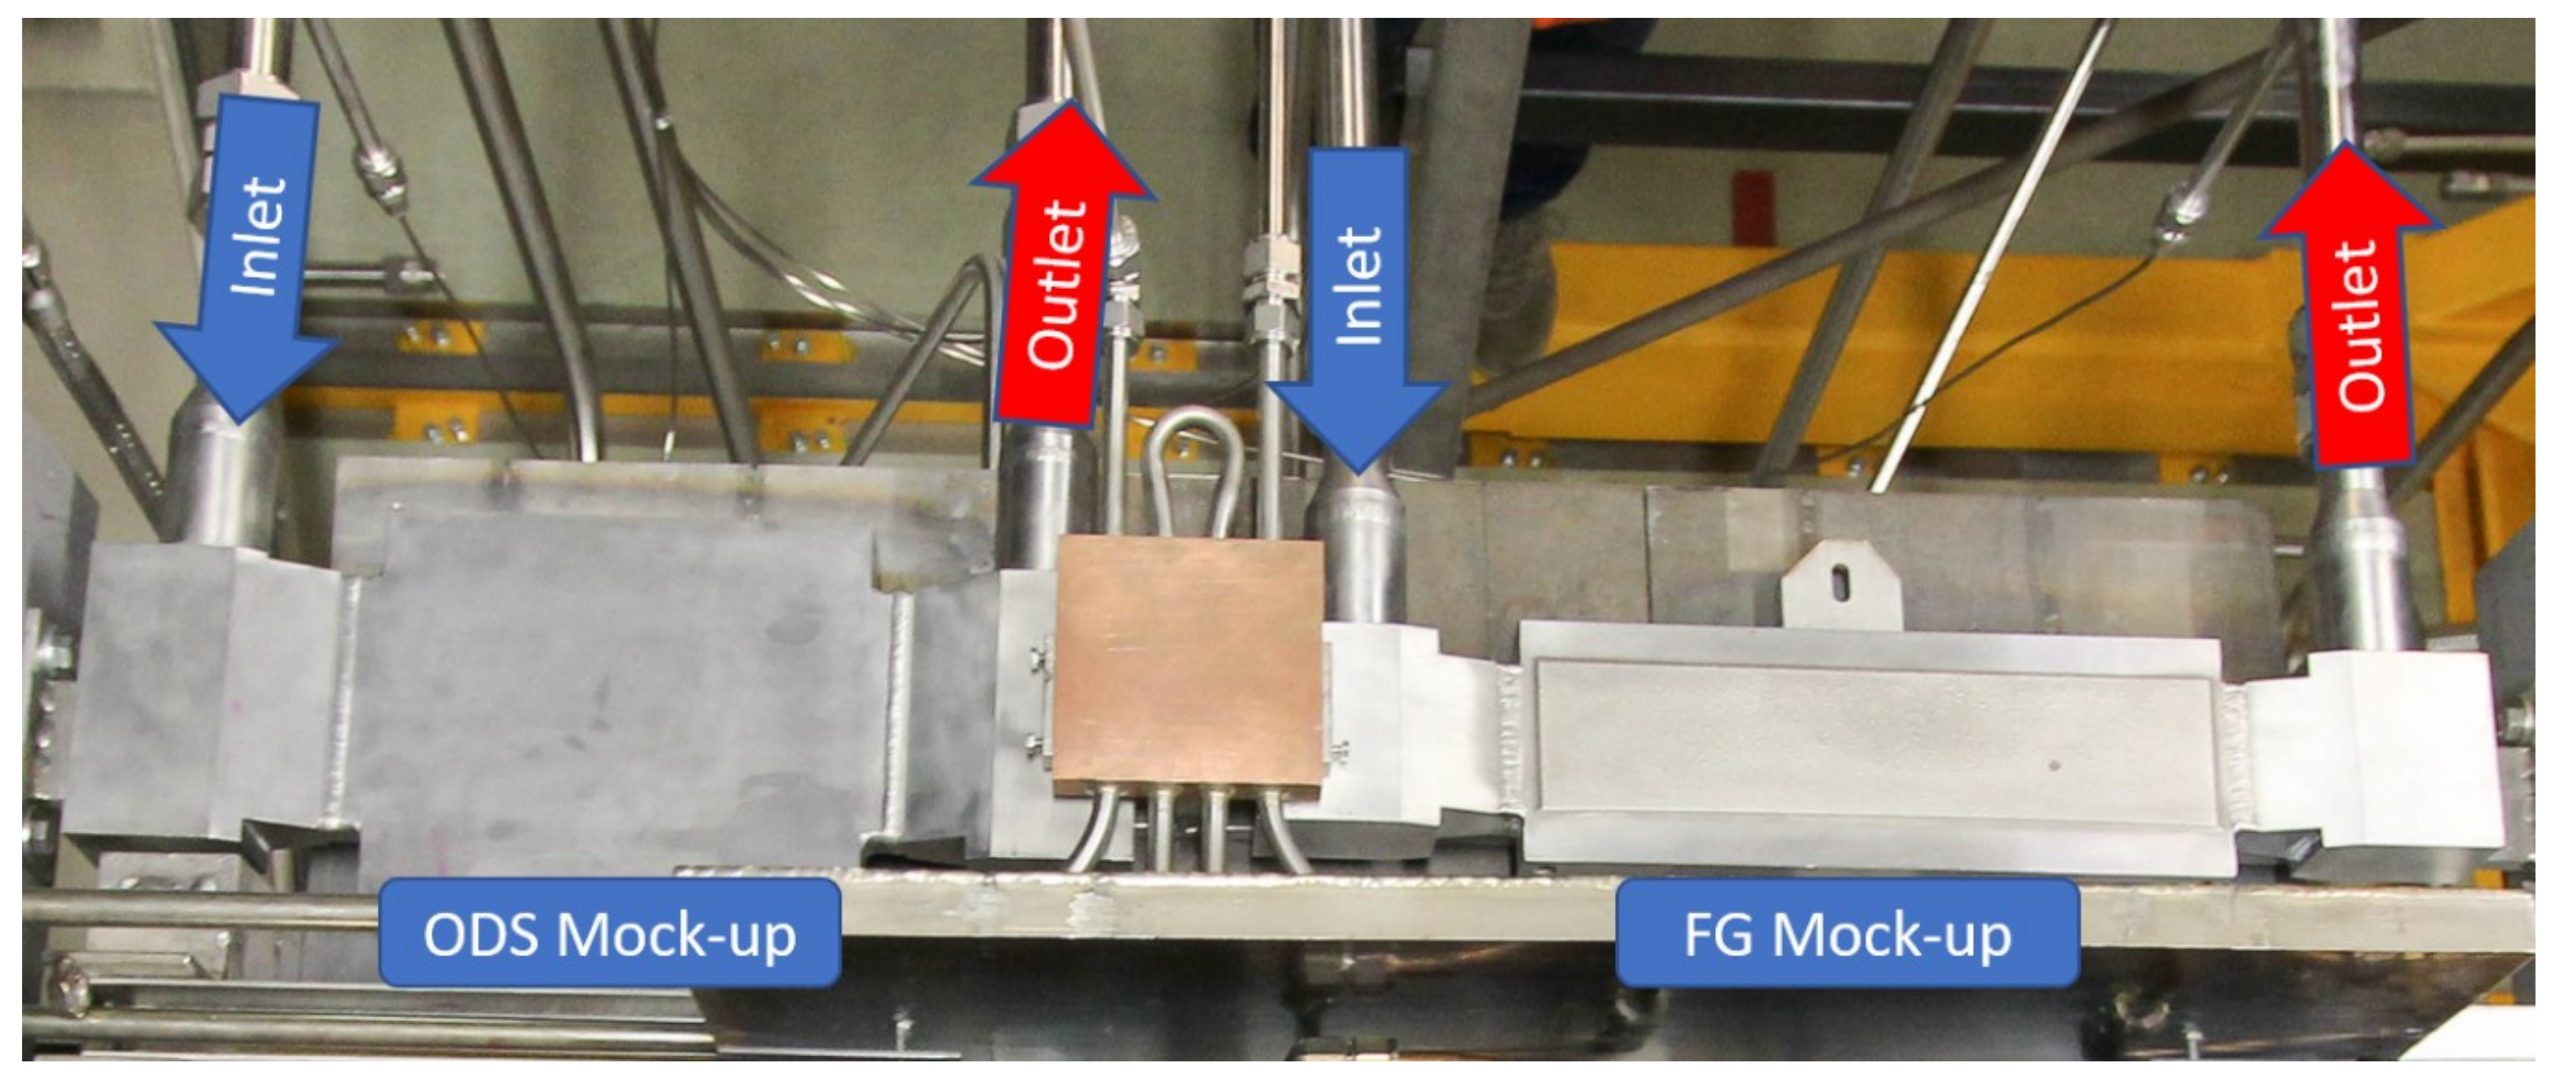
The two mock-ups were installed, one next to each other, on a joint fixation structure inside the VV, see Figure 4. This fixation structure was designed in a way that allows free thermal expansion of the mock-ups in the two directions parallel to the mock-ups surface but preventing an overall dislocation (movement) of the mock-ups. Each mock-up was fixed to the holding plate by four stainless steel bolts, two at the manifolds and two on the massive parts of the plates that were free to move in slotted holes. Several ceramic discs were placed between the mock-ups and the holding plate to minimize heat loss by conduction.

3. Measurements & Diagnostics

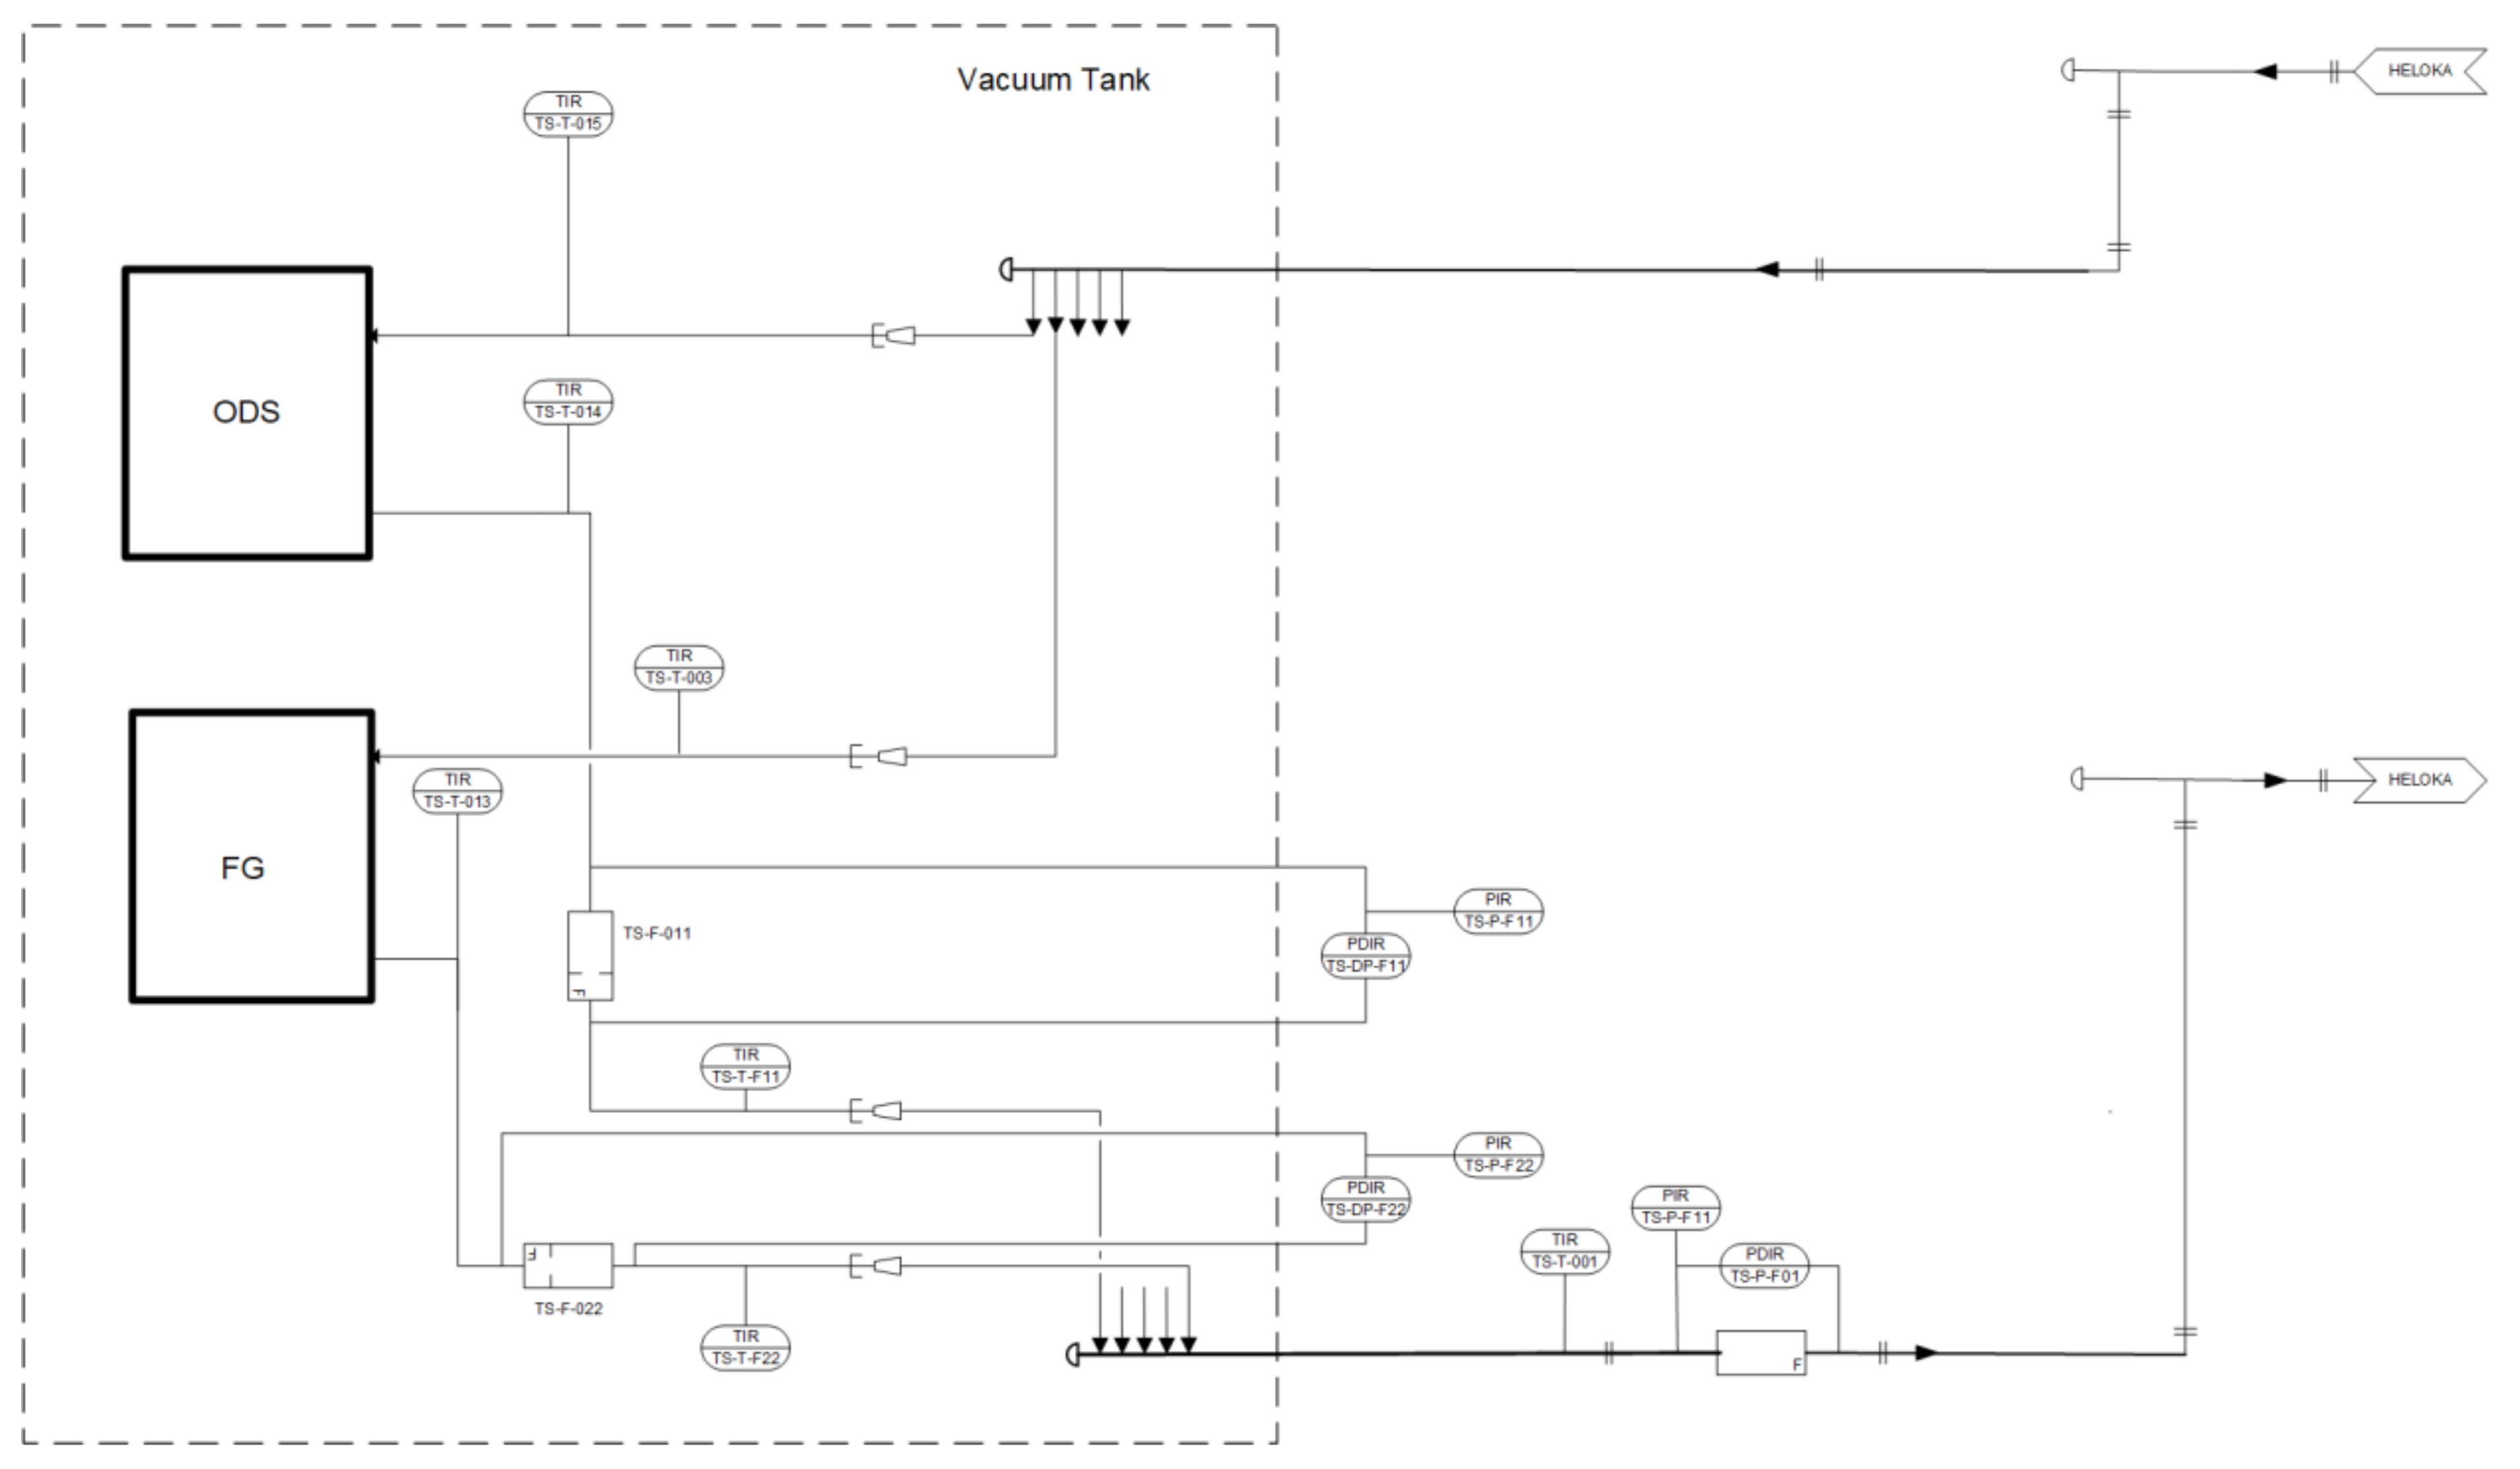
The two mock-ups were installed in parallel, as can be seen from Figure 5, the coolant parameters being monitored. Thus, the flow rate through each mock-up and their inlet and outlet temperatures were monitored, as indicated in Table 2 and Table 3.
The HELOKA facility has a dedicated data acquisition for the experimental test sections based on National Instruments CompactRIO NI cRIO-9025. This system runs in parallel with the HELOKA loop own control system, which is based on Siemens SIMATIC PCS7 (see reference [6] for further details on HELOKA control). The two systems are synchronized by obtaining the time stamp from the same radio clock (Siemens SICLOCK TC 400), otherwise they can be independently developed and maintained.

3.1. Mass Flow and Pressure Measurements

The helium mass flow rate is measured downstream of each mock-up using orifice flowmeters designated in Figure 5 as TS-F-011 for the ODS mock-up and TS-F-022 for the FG mock-up. The two flowmeters can operate at high pressure, up to 110 bar, and temperatures up to 550 °C. The flowmeter and their associated transducers were designed initially for another experiment operating at 400 °C, 8 MPa and 50 g/s. Since the two experiments required higher flow rates (170 g/s for FG mock-up and 200 g/s for the ODS mock-up), the original transducers were replaced by new ones of the same type (SIEMENS Sitrans P DSIII) but having a larger measuring range (0 to 5000 mbar). Differently from the original transducers that were calibrated and set to deliver the mass flow directly, the new transducers were used to measure the pressure loss over the orifice, the mass flow being calculated in the cRIO according to the provisions of DIN-EN-ISO 5167-1 and 2:2004-01 standards. The calculation uses the helium pressure and temperature measured at the level of the flow meter using DMP 320 sensors from BD Sensors GmbH (<0.1% uncertainty at a measuring range of 100 bar) and thermocouples type K (3 mm sheath; tolerance class 1), respectively.
Using the existing orifice flow meters means that we needed to cope with large pressure drops at the flow meters’ level: around 1.5 bar for the FG mock-up and 2.9 bar for the ODS mock-up. However, the HELOKA loop can easily cope with such loads, while the systematic uncertainty for the mass flow measurement stays constant at around 1.31% for all of the measuring range of interest. This value, calculated according to DIN-EN-ISO 5167-2:2004 and ISO/TR-15377:2007, already takes into account the fact that, for the pressure and the differential pressure, there is an additional uncertainty of 0.54% associated with the National Instruments card (NI 9203) that was used during the testing. In the calculation, this uncertainty is added to the sensor’s systematic uncertainty (0.065% from the measuring range).

3.2. Coolant Temperature Measurements

Four thermocouples (TCs) of type K (tolerance class 1) with a 3 mm sheath diameter measure the helium temperatures at the inlet and outlet pipes of the two mock-ups. The sensors are installed on the piping 100 mm downstream from the mock-ups inlet/outlet connecting points. These thermocouples are inserted directly in the helium stream to reduce the response time.
During testing, the inlet sensors are used to adjust the power of the HELOKA heater to match the temperature set-point for the loop control. In addition to this, these sensors, together with the corresponding outlet temperature sensors, are used for the calorimetric power evaluation.

3.3. Mock-Up Temperature Measurement

The experiments were focused mainly on phenomena occurring on the surface of the mock-up, therefore dedicated measurements of the mock-up steel are not included. The only exception is the thermocouple inserted in the wall between channel 2 and 3 of the FG mock-up. As indicated in [4], this sensor was used during manufacturing to monitor the surface temperature when the coating step was performed. During testing in HELOKA, the sensor, a type K sensor with class 1 accuracy, was included in the experimental data acquisition as an additional way to monitor the temperature of the steel near the heat-loaded surface. For the ODS mock-up, such a sensor was not needed during manufacturing and applying a sensor afterwards up to 2 mm below the surface was considered too intrusive, the sensor would be penetrating into the ODS layer.
Measuring the heated surface temperature using thermocouples was difficult to implement for the present mock-ups. Having relatively thin walls (3.5 and 4 mm), placing even thin thermocouples on the surface would impact on the local heat transfer, the thermocouples having a stainless-steel sheath with lower conductivity than the mock-up material. Additionally, since the experiments were conducted in a vacuum at high heat fluxes, the thermocouple wires needed to be brazed to the mock-up surface, the presence of the brazing increasing further the impact on the local heat transfer. This brazing needed to be performed on the whole path the thermocouple followed on the heated surface (not only on the tip), to avoid the (relatively fast) destruction of the thermocouple by the electron beam.
For these reasons, a thermal imaging infrared (IR) camera of type X6580 sc, from FLIR Systems, Inc., (Wilsonville, OR, USA), was used to measure the surface temperatures of the tested mock-ups. The camera images were also used to define and adjust the electron beam gun heating pattern by looking at the thermal response of the mock-up.
The camera is installed outside the vacuum vessel, behind an ZnSn window, and the images are recorded through a mirror system, the same as used in reference [7]. A detailed description of the camera set-up can be found in reference [7] and will not be repeated here. The only difference to the experiments presented in [7] is the use of a different camera filter (NA 3.90–4.01 µm 60%) calibrated for measurements between 300 °C and 1500 °C, the temperature range to be observed exceeding the limits of the filter used in [7], which was calibrated for temperatures between 100 °C and 600 °C.
The treatment of the images was carried out using FLIR Systems, Inc., (Wilsonville, OR, USA) proprietary software, the FLIR ResearchIR Max Version 4.40.9.30 (7 February 2019). In order to provide reliable values for the surface temperature, this software requires setting two parameters: the transmission coefficient and the surface emissivity. For the HELOKA test stand, similarly to the tests presented in [7], the transmission coefficient is always set to 0.33. The surface emissivity depends on the material and the status of the mock-up surface; therefore, its value is set (calibrated) at the beginning of each (daily) run and checked again at the end of the day. The calibration is conducted by selecting a Region of Interest (ROI) on the surface of the mock-up and bringing the mock-up at 300 °C using the coolant temperature only. In the absence of external heating and due to the fact that the mock-ups are in vacuum, there is practically no temperature gradient across the mock-up walls, the surface having the same temperature as the coolant. Thus, by providing the FLIR ResearchIR the coolant temperature value, the software is able to calculate the corresponding emissivity.
As indicated in [7], in the case of EUROFER97 mock-ups or made out of similar ferritic martensitic steels, calibrating the emissivity parameter at a coolant temperature of 300 °C results in a reliable reading for temperatures in the range of 300 °C to 550 °C, the parameter value staying almost constant above 300 °C. Thus, for the ODS mock-up, the surface temperatures measured with the IR camera are assumed to have the same uncertainty as those mentioned in [7], namely, 2% uncertainty for (area) averaged temperatures and 4% for maximum values.
The situation is different when it comes to tungsten-covered surfaces due to its substantial change in emissivity with temperature. During previous experiments, in which massive tungsten blocks were heated up from 300 °C or 450 °C up to temperatures above 1000 °C, it was observed that the IR camera readings were higher than the real surface temperatures. In these experiments, similar to the first wall experiments presented here, the emissivity parameter was set at the beginning of the heating cycle when the mock-up was in thermal equilibrium with the environment.
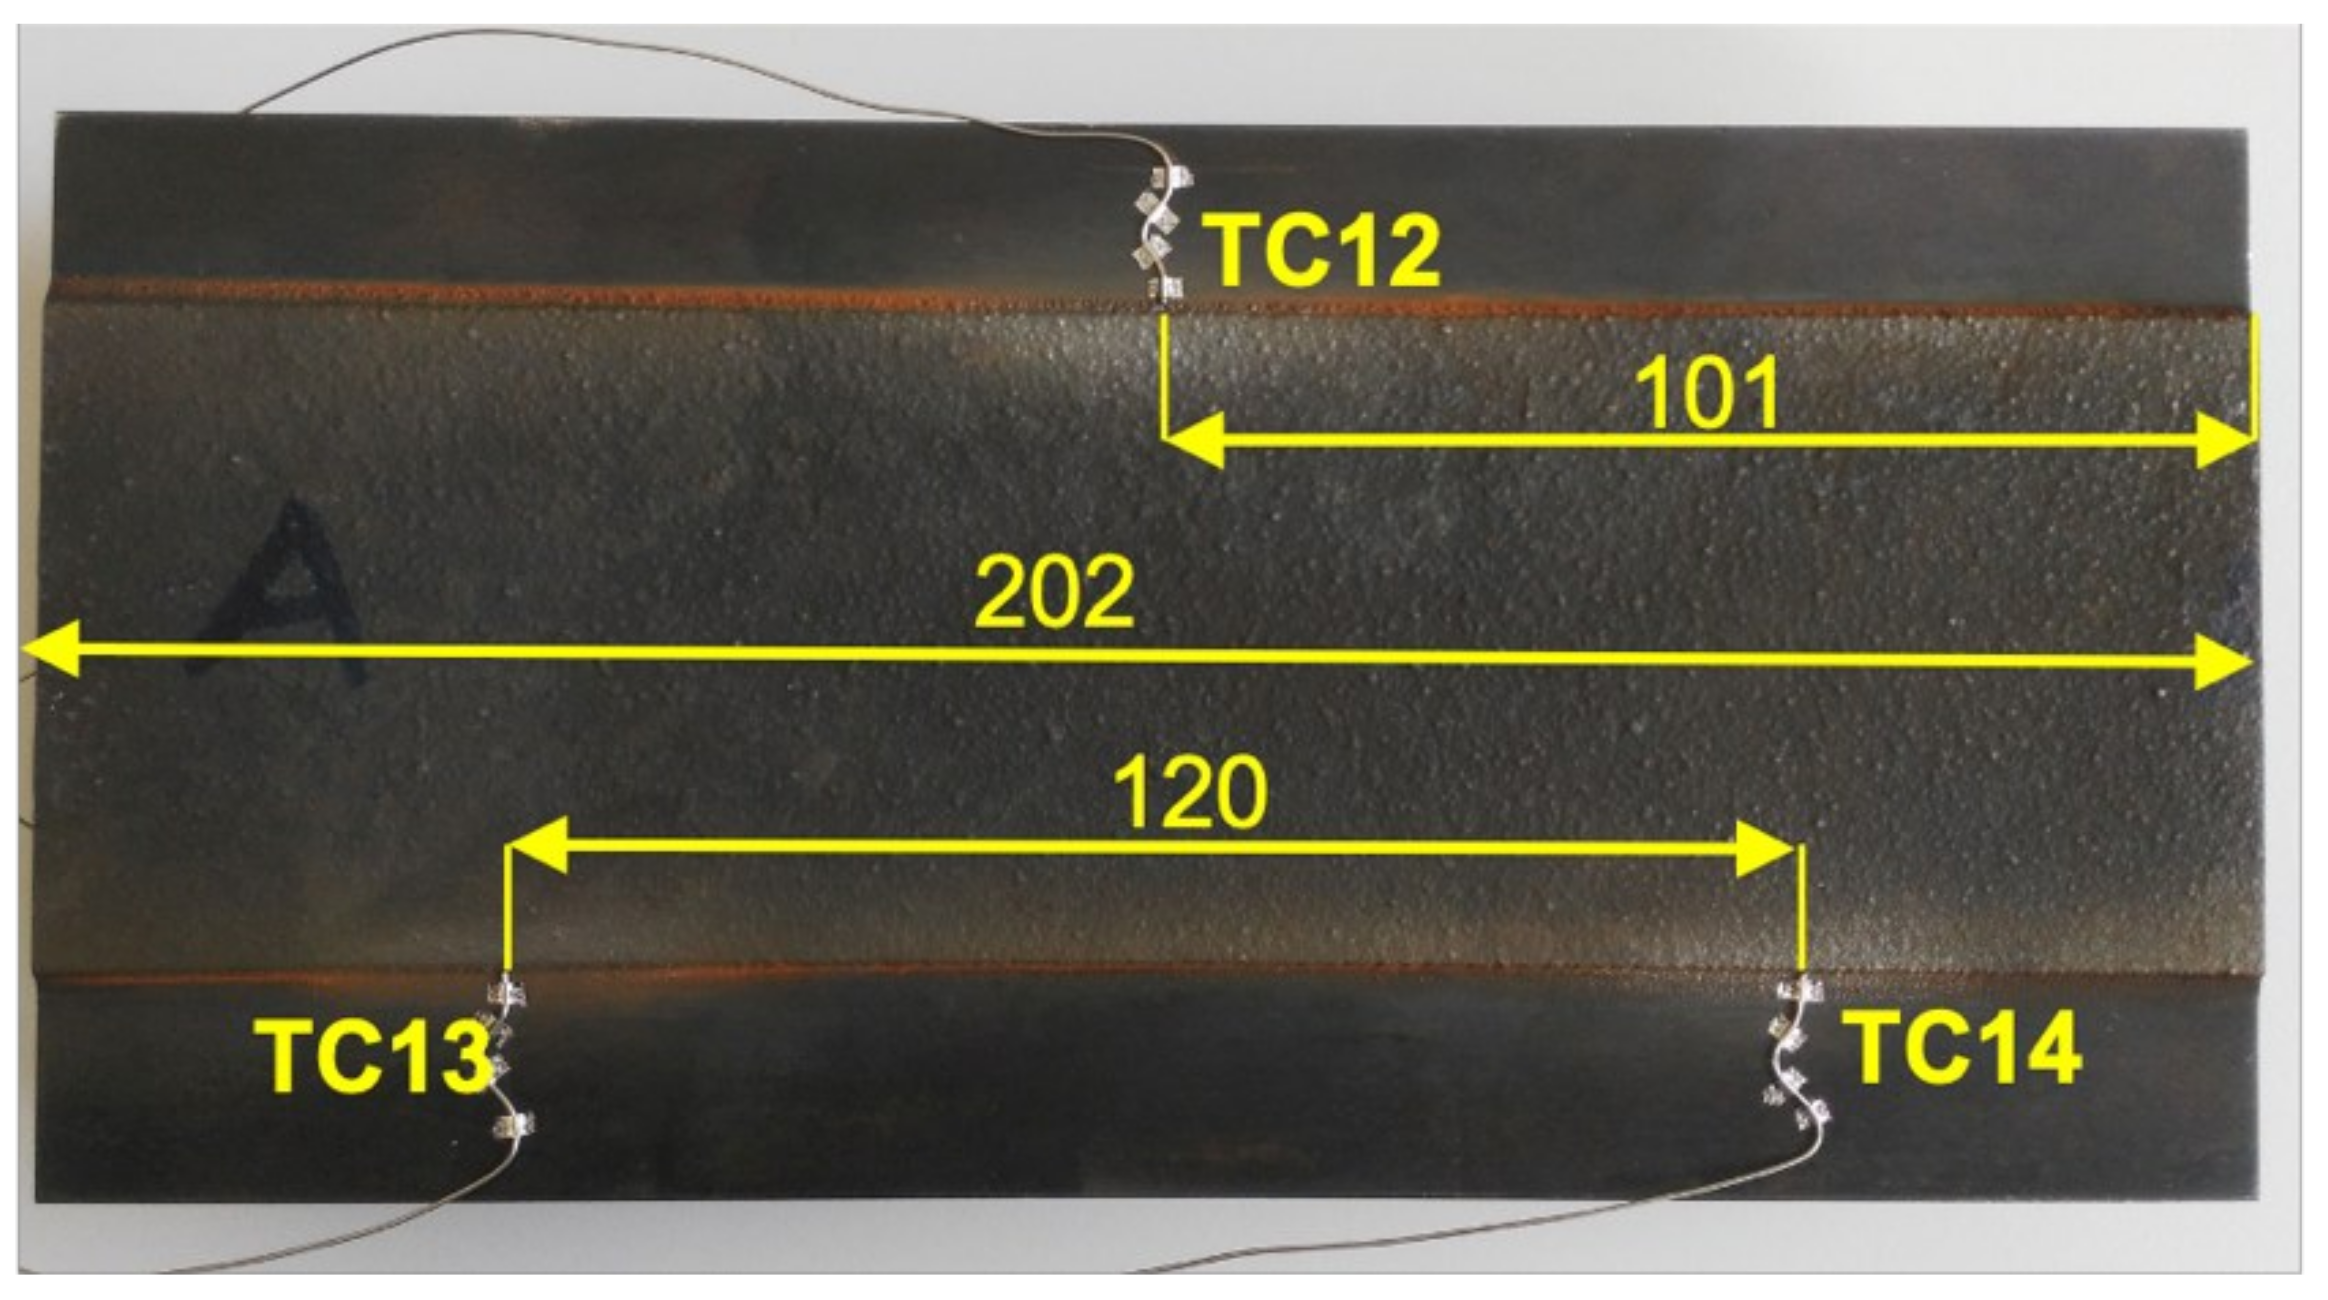
A well-defined correction formula for such experiments is difficult to produce due to the multitude of factors coming into play for high heat flux testing, the most significant being the change in the surface roughness that occurs during the experiment. Nevertheless, in order to have a better idea of the temperature levels on the surface of the mock-up, we performed a complementary experiment to deduce a correction relation for the IR camera readings over a temperature range of 300 to 800 °C. The experiment used the central part of the FG mock-up, a part that remained available after the samples for the material studies were cut off. Thus, the test object is only 202 mm long, about 30 mm being cut away from each end. The mock-up is installed inside the HELOKA vacuum vessel at the same position as the original mock-up. For the purpose of this experiment, the heating of the mock-up was conducted using six strip heaters (two heaters per each cooling channel). Three thermocouples (TC12–14) are fixed on the steel surface and aligned transversely to contact the tungsten coating as shown in Figure 6. The fourth thermocouple has the same position as the thermocouple used to monitor the mock-up base material temperature during the high heat flux testing. The TCs are type K (accuracy class 1) with 1 mm sheath diameter and temperature limit of 1000 °C.
The data for the correction formula were gathered during three runs. In each run, the six heaters were turned on to heat the mock-up top surface to 300 °C and the heaters’ power supplies were adjusted so that the readings of the four thermocouples was stationary. This initial state was used to set the emissivity parameter of the IR camera the same way as was carried out in the FG mock-up testing campaign. Once the setting of the emissivity was performed, the temperature of the mock-up was increased in steps of 100 °C until reaching the final temperature of 800 °C. During the run, the temperature measurements of TC12–14 were saved while the IR camera software recorded images of the test object. Three ROI (Region of Interest), in the shape of 3 × 3-pixel regions, were placed on the tungsten coating area close to the thermocouples. Under stationary conditions, these regions should have the same temperatures (or very close ones) as the neighboring thermocouples on the steel surface. The temperature values obtained from FLIR ResearchIR for the three ROIs and the corresponding thermocouple readings were processed using OriginPro software (OriginPro, Version 2021, OriginLab Corporation, Northampton, MA, USA). Figure 7 shows the FV (Fasano and Vio [8]) linear fitting of the thermocouples’ (TC12–14) measurements versus the IR camera’s temperature measurements in the three runs. This fitting method was preferred to the OriginPro default method (York) since it allows us to take in account uncertainties in both coordinates/variables. All thermocouples measurements were plotted associated with both the systematic and random errors.

4. Testing Parameters and Loading Conditions

The two FW mock-ups were subject to high heat cyclic loading, and were cooled by helium at 8 MPa. In both cases, the loading starts when the mock-ups have a temperature level around 300 °C. A predefined scanning pattern allows the application of a rather uniform surface heat load by means of an electron beam gun. The selected loading level is reached relatively fast, after 1 s, the beam power being already at the selected level. The duration of the beam pulse is mostly determined by the time needed by the helium outlet temperature to reach a stationary value so that the value of the power deposited on the mock-up can be evaluated calorimetrically. This duration was set at 150 s for the FG mock-up and 120 s for the ODS-mock-up. After the beam is shut-off, a cool-down period of similar length is needed so that the mock-ups return to the same thermal state as before the beam was applied, namely a uniform temperature of 300 °C.
The EB gun scanning pattern is defined in such a way that the loading of the weld seams between the inlet/outlet manifolds is avoided. Additionally, on the transverse direction to the channels, the heating patterns are limited to the area above the cooling channels. Both mock-ups have, left and right of the channel’s region, massive steel parts that are of limited interest for the experiment, but they can influence the duration of a loading cycle, the more heat that is applied over these regions, the longer it will take for the mock-ups to cool-down. The shape of the electron beam pattern and the uniformity of the heating loads were estimated by looking at the mock-up’s surface thermal images recorded by the IR camera.
For the FG mock-up, the testing parameters listed in Table 4 were selected so that the temperature of the steel substrate was maintained below the maximum working temperature of the material (550 °C), as indicated in reference [4]. Based on their calculations, for an applied heat flux of 750 kW/m2, the steel temperature should be around 530 °C. However, estimating the heat flux is not trivial, an estimation directly from the beam power being far from straightforward due to the fact that the fraction of the power transferred as heat flux to the mock-up depends strongly on the surface material, and the FG mock-up has both tungsten and steel. For the experiment, the setting of the beam power was conducted at the beginning of the testing campaign by increasing, progressively, the beam power while maintaining the specified cooling conditions, until the thermocouple installed in the middle of the mock-up indicated a temperature around 500 °C. Using the simplified convection/conduction model from [4] for the wall temperature increase along the mock-up channel, having 500 °C half-distance along the channel would correspond to a heat flux of 625 kW/m2. Under these conditions, the same model predicts that the substrate maximum temperature would stay below 550 °C. However, the evaluation of the experimental results indicate that the calorimetrically estimated heat flux was close to 730 kW/m2, which means that the real heat transfer coefficients were higher than those from the model.
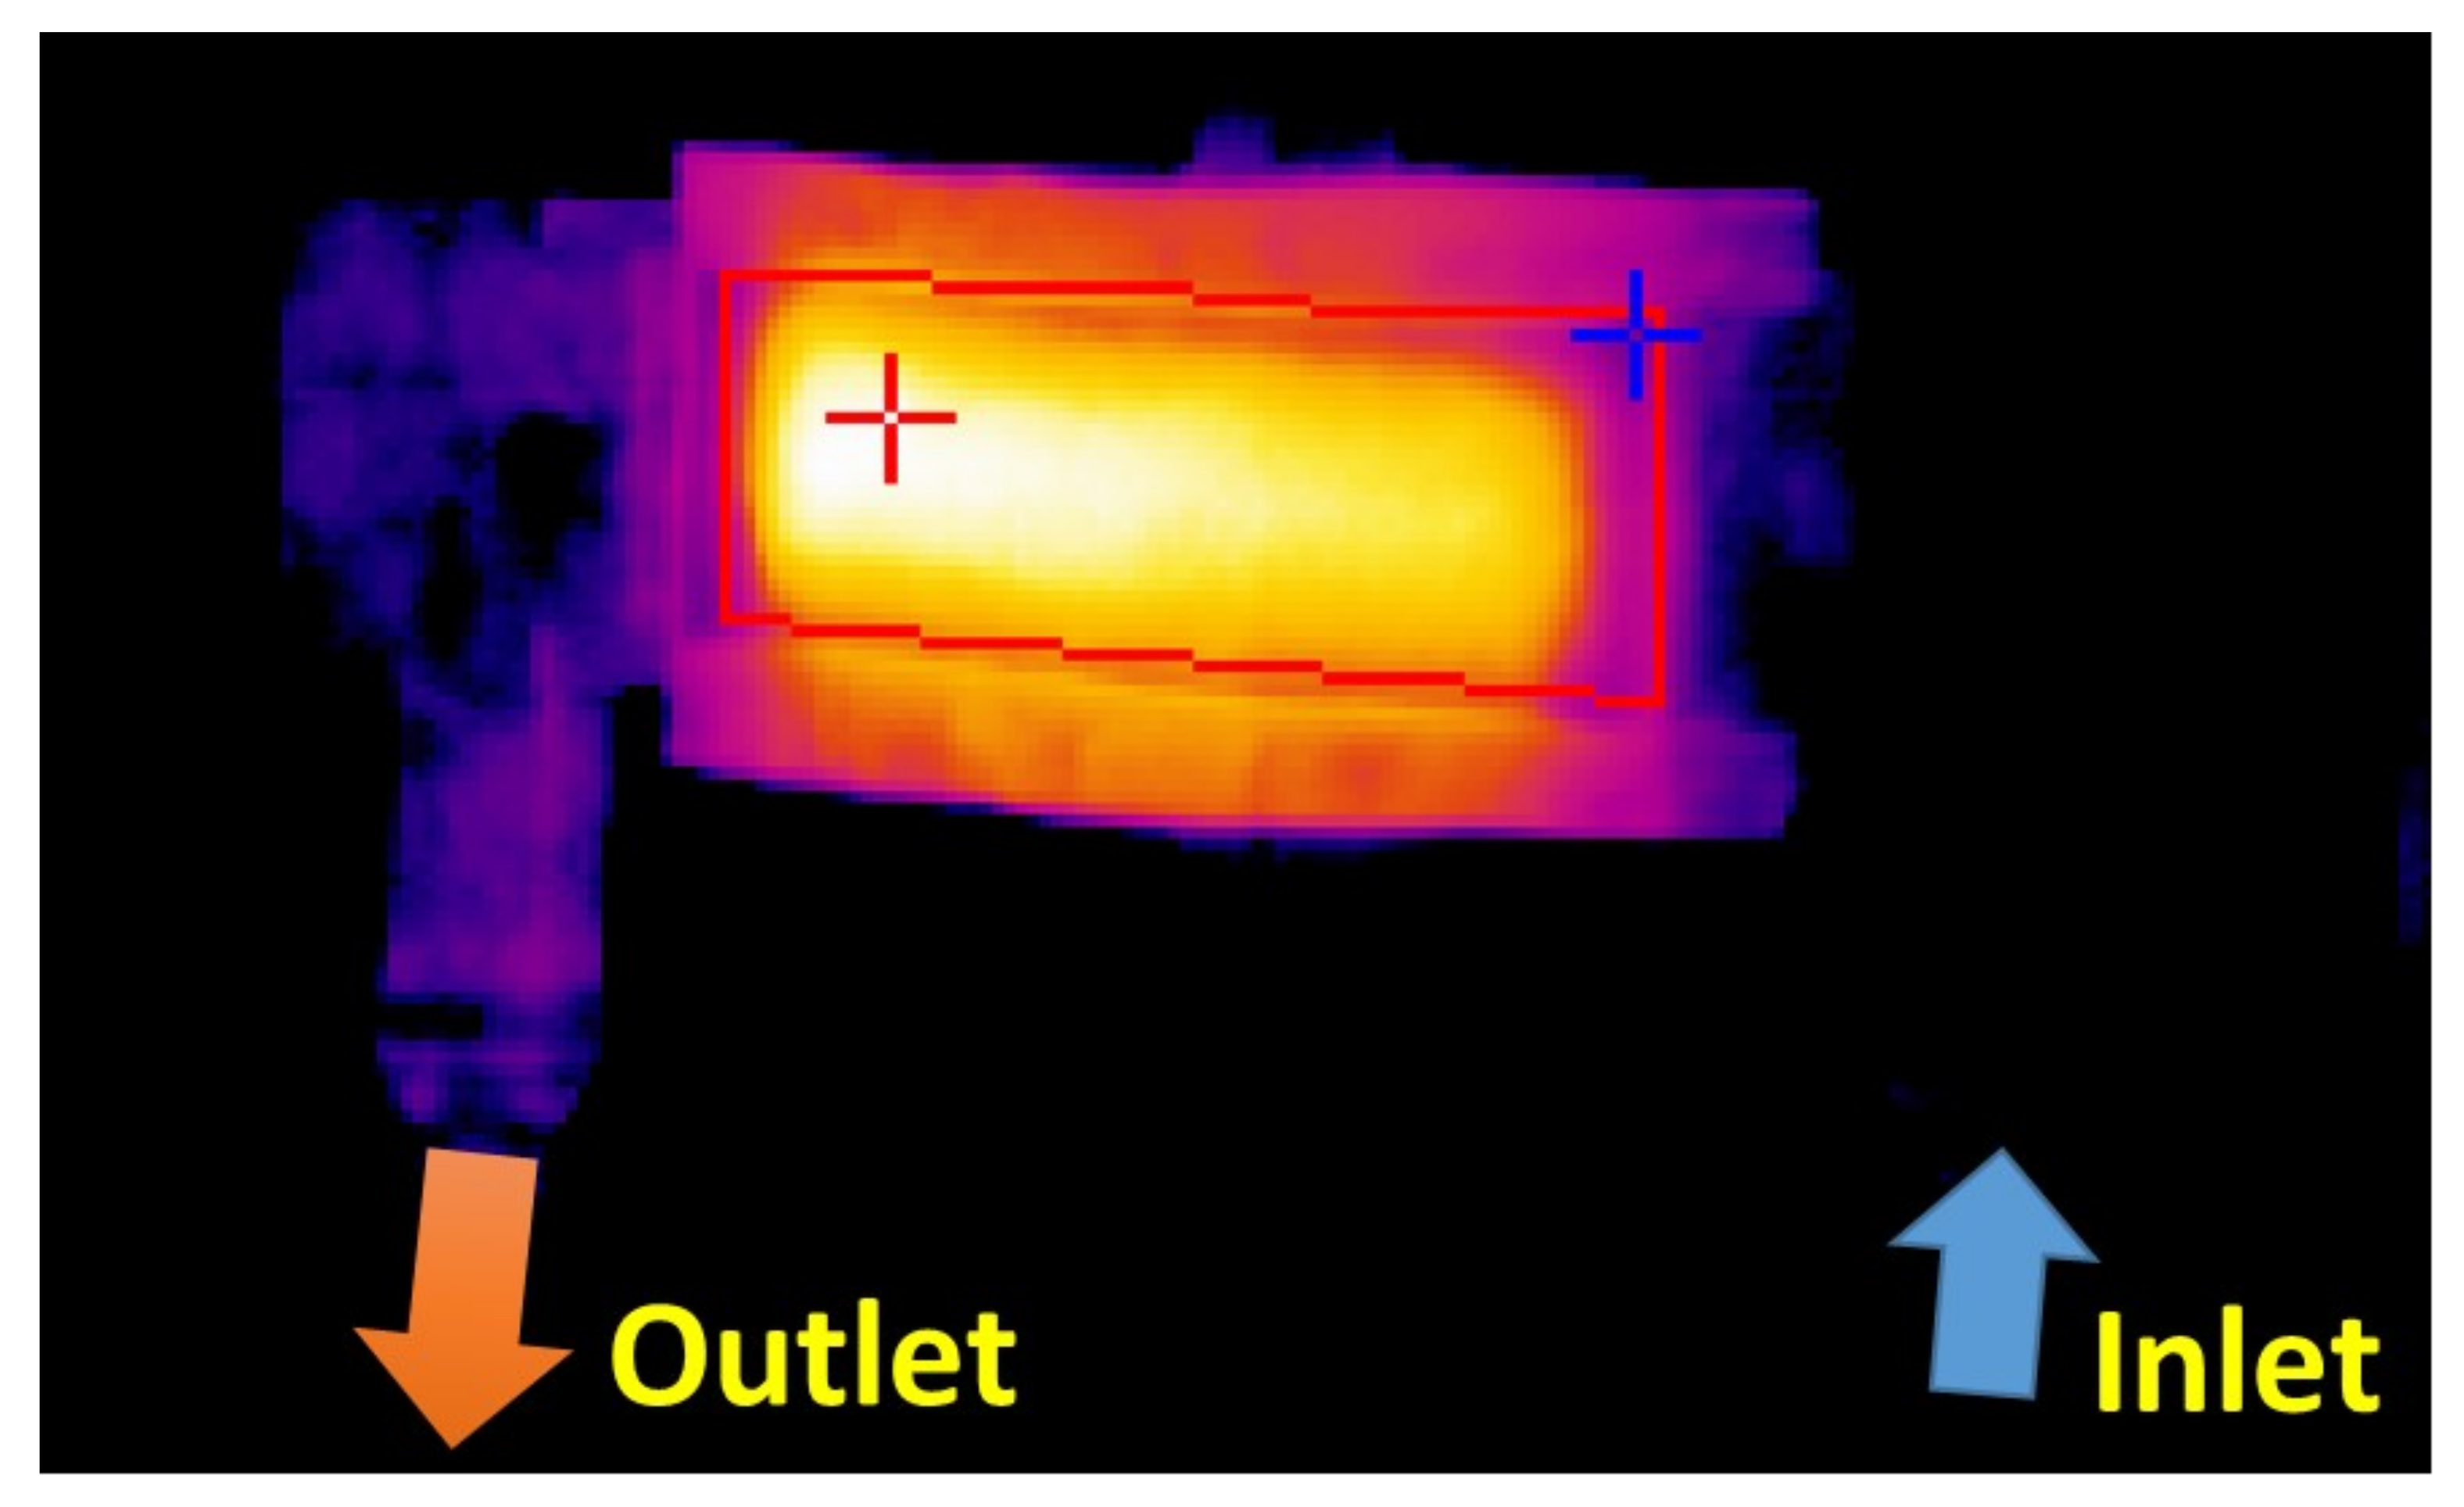
Figure 8 shows an infrared image of the mock-up taken during testing. In this picture, one can see the thermal response to the applied heating pattern, indicating that the area of uniform heat flux is somewhat smaller than the coated area, both in the direction of the flow and in the transverse direction. This is mainly due to the fact that the beam spot has a diameter of about 15 mm and a Gaussian shape. This means that, in order to avoid heating the welds or the bulk steel on the sides, we have to restrict the scanning pattern inside the coated area. Nevertheless, there is an area sufficiently large towards the outlet of the mock-up that has suitable testing conditions.
In the case of the FG mock-up, the objective was to cycle for 1000 times the tungsten coating at the highest surface heat flux possible while keeping the substrate (steel) at temperatures below 550 °C. The flow rate was set to the maximum value allowed by the experimental set-up. For the ODS mock-up, the main objective was to apply 100 cycles while reaching a specified surface temperature under typical blanket First Wall cooling conditions, namely 40 g/s in each cooling channel (200 g/s in total). Table 5 presents the complete test matrix for the ODS mock-up. After the original testing objectives were reached, it was decided to apply the same load as that for the last fatigue tests (0.9 MW/m2) and maintain it for a longer time in order to activate creep or other thermal effects in the ODS layer (see [4] for more details). The duration of these pulses was chosen having in mind a typical EU-DEMO pulse duration.
For the ODS mock-up, the selection of the heating pattern was conducted following the same general guidelines and procedures as for the FG mock-up. Since the ODS layer covered the whole surface, the lateral extent of the electron beam scanning pattern was determined by looking at the two junctions between the inlet and outlet manifolds to the main plate. In the flow direction, the extent of the scanning pattern was decided based on a preliminary stress analysis carried out with ANSYS software. The reason for this was that the welds between the manifolds and the main plate contained ODS material and, at the time when the experiment was performed, we had no thorough investigation and qualification of these kind of welds (and the associated heat treatment). As such, in planning the experiment, it was decided to keep these zones at stress levels well below the allowable limits. Following these investigations, it was decided to use a heating pattern with a length of 11 mm in the flow direction.
The stress analysis also showed that, for the first two series of cycles (700 kW/m2 and 800 kW/m2), the stresses stay below the allowable limits defined by RCC-MRx code [9] for EUROFER97. When going to higher surface loadings (900 kW/m2) and higher surface temperatures, the design code ratcheting criteria (3Sm) is no longer fulfilled. However, by increasing the inlet temperature to 350 °C and using a surface heat flux of 900 kW/m2, the model predicts thermal stresses that exceed by only 10% the allowable values for EUROFER. These values occur within the mock-up wall towards the heated surface, which is mostly made out of ODS steel. While the characterization of the ODS steels is an on-going activity, it is expected that the mechanical properties of these steels will see an improvement as compared with the EUROFER in the range of 20%. As a consequence, it was decided that, for the tests aiming at 650 °C, the helium inlet temperature was increased from 300 °C to 350 °C.

5. Results and Discussion

5.1. Results for the FG Mock-Up

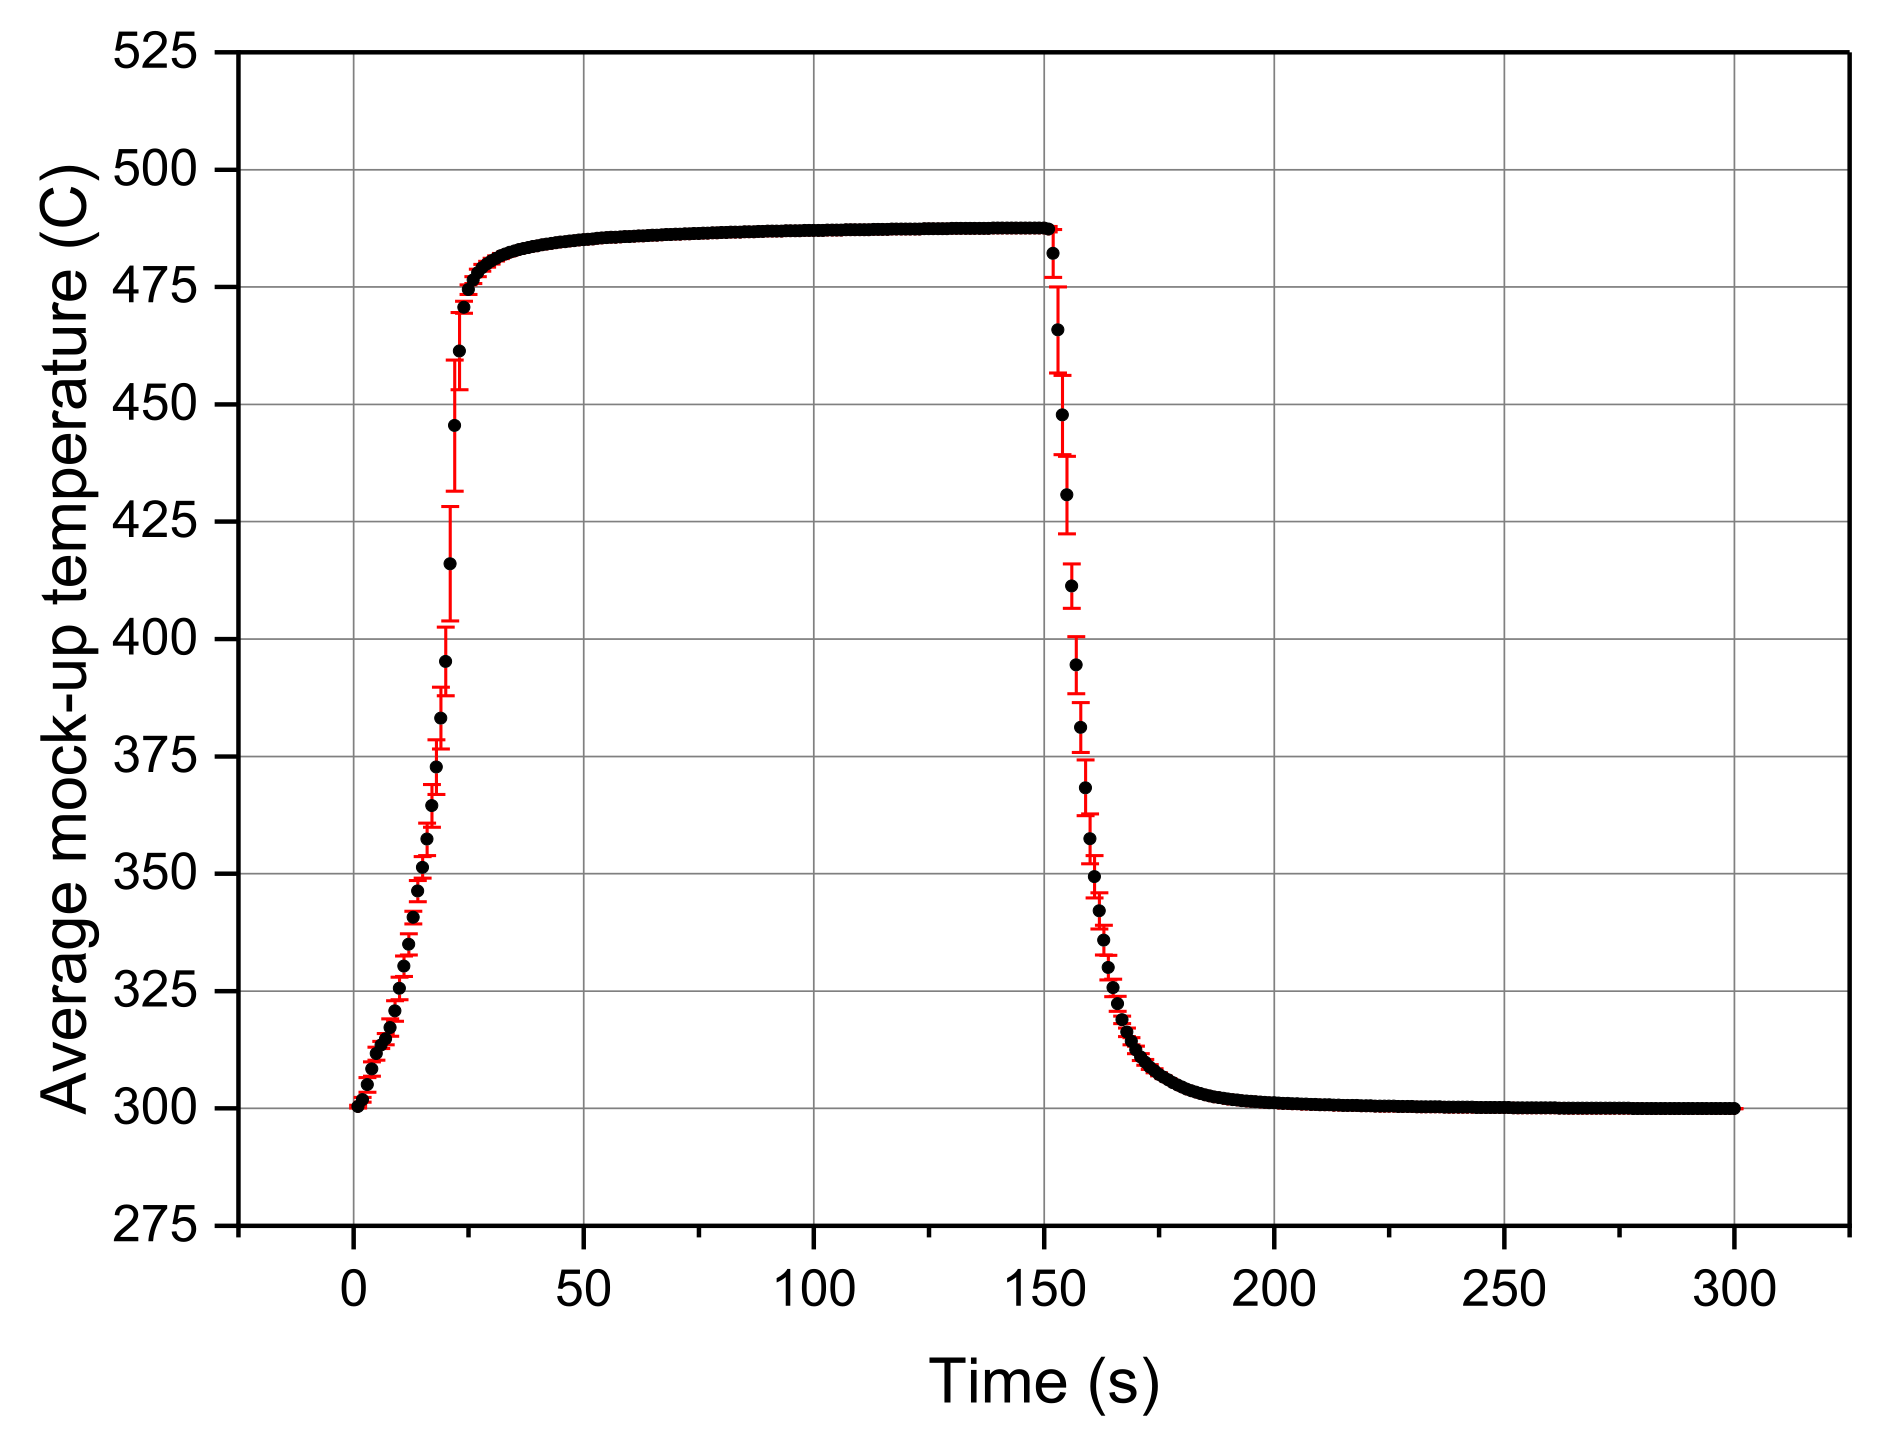
In this section, the results of the FW and FG mock-up experimental runs are presented. Testing of the FG mock-up was performed to investigate the durability of the Tungsten/Eurofer97 coating by exposing it to high heat loadings. Applying this loading repeatedly, the experiment aimed to demonstrate the robustness of the coating. Figure 9 shows the measured values of the inlet helium temperature (T-in), outlet helium temperature (T-out) and the internal mock-up temperature (T-TC) for a representative group of seven thermal cycles recorded during the experimental run of the 5 August 2019. The reproducibility of the three temperatures, measured in these cycles, shows that the experiment was producing similar heating cycles. As can be seen in Figure 9, when the heat load is applied to the mock-up, the outlet helium temperature reaches a maximum value of 314.5 °C, while the thermocouple embedded into the mock-up measures a temperature of 488 °C. During the beam-off period, both the outlet helium temperature and internal mock-up temperature go down to the inlet helium temperature level of 300 °C. The good reproducibility of the testing conditions can be seen also by compiling an “averaged” loading cycle. Thus, by taking 15 consecutive cycles (the 7 cycles shown in Figure 9 and the following 8 cycles) and treating them as individual realizations of a typical 300-s-long loading cycle, we can compute an averaged evolution of the various parameters. Figure 10 shows the average values over the 15 cycles of the temperature measured by the mock-up thermocouple and the associated standard deviations (random uncertainties). From this figure, one can see that the temperature near the surface of the mock-up reaches, rather quickly, a stationary value having a standard deviation in that region around 0.01 °C, which indicates a very good reproducibility of the testing conditions. The situation is slightly different during the ramp-up and ramp-down phases when the standard deviation can reach up to 14 °C. While the duration of the transient phases is the same for all of the 15 cycles, the large deviation could be due to the fact that during the heating-up phase, there might be slight variations in the electron beam gun operation. Moreover, the instant the shut-off signal for the beam is initiated could slightly differ from cycle to cycle, leading to high deviations in the cool-down phase.
From the available data we can evaluate the power increase in the helium stream. For this we apply a two-step procedure as follows:
  • From the measured data, we compile first typical evolution profiles for the helium mass flow rate m ˙ , and the mock-up inlet and outlet temperatures, T i n and T o u t in a similar way it was carried out for the mock-up thermocouple measurement. Together with the averaged values we also obtain the associated standard deviation, which will give us the measure of the random uncertainty. The associated systematic uncertainties are calculated using the averaged values of the parameters.
  • From these averaged profiles, the evolution of the power rise over the mock-up is calculated using the formula
    P = m ˙ C p T o u t T i n
    where Cp is the helium specific heat capacity. Here, for the specific heat capacity (Cp) of helium, we consider a value of 5.195 kJ/kg∙K with an uncertainty of 0.3% according to reference [10]. The associated systematic uncertainty is calculated as
    u P 2 = C p T o u t T i n u m 2 + m ˙ T o u t T i n u C p 2 + m ˙ C p 2 u T o u t 2 + u T i n 2
    where u m , u T o u t and u T i n are the systematic uncertainties calculated in the first step, while u C p = 15.585   W / kg · K . The random uncertainties are obtained using the same formula and taking the corresponding random uncertainties for the mass flow and temperatures, the random uncertainty for the specific heat capacity being taken as zero.
Similar to the thermocouple measurements shown in Figure 10, the power applied over the 15 cycles shows a good reproducibility, as can be seen in Figure 11a. In this figure, the mean values for the power and the associated random uncertainties are shown. From this figure, one can see that the time evolution is slightly different from that in Figure 10, the profile reaching a stationary value only shortly before the heating period stops. This behavior is mainly due to the impact of the outlet manifold thermal inertia to the helium power intake evolution, the hot helium exiting the mock-up channels losing a part of its enthalpy to the colder manifold walls. Once the manifold reaches the same temperature as the helium coming from the heated zone, the outlet temperature signal becomes stationary. Due to this delay in the outlet temperature measurement, the power applied by the electron beam gun to the mock-up can be correctly estimated only from the part where stationary conditions are achieved, and all of the input power exits the system as helium enthalpy. Taking the last 30 values before the end of the beam-on period, we obtain for the applied power a value of 12.3 kW with a standard deviation of ±0.04 kW. However, when taking into account the systematic uncertainties, the total uncertainty of the estimated power increases to 1.5 kW, which represents 12.3% from the estimated value. Assuming that the heat flux is applied uniformly over the whole coated area, the resulting applied average heat flux is then 734 kW/m2 ± 90 kW/m2, a value obtained by dividing the power by the area of the loaded zone (1.674·10−2 m2)
These results show that there is a relatively high uncertainty in the estimated power levels and, consequently, on the evaluated heat fluxes, despite using sensors with low uncertainty. Looking more in detail, one can see that this is due to having a low temperature increase over the mock-up: while the temperature sensors themselves have a low uncertainty (0.4% from the temperature, which corresponds roughly to 1.2 °C in our case), the temperature difference, which is close to 12 °C, has an associated uncertainty of 1.7 °C or 14.7% relative uncertainty. This high uncertainty dominates, in fact, the overall uncertainty of the power evaluation at any point during the pulse, as can be seen in Figure 11b.
A typical temperature distribution of the FG mock-up surface obtained by the IR camera can be seen in Figure 8. In this picture, the temperature scale was set from 300 °C (black) to 800 °C (white), and the image was recorded using a Plateau Equalization (PE) algorithm available in the FLIR ResearchIR Max Version 4.40.9.30 (7 February 2019) software from FLIR Systems, Inc., Wilsonville, OR, USA. In this picture, the maximum surface temperature recorded by the IR camera is close to 750 °C and is located at the white area near the helium outlet side of the mock-up. Using the correction formula deduced above (see Figure 7), the real surface temperature should be around 670 °C, as can be seen in Figure 12, where the axial and transverse temperature profiles through the point of maximum temperature are plotted.
For the last 200 cycles the beam power was increased, the power deposited into the mock-up being 13.25 ± 1.56 kW. This led to an increase in the surface temperature, the IR camera recorded value being around 800 °C, as reported in reference [4]. Using the correction formula introduced earlier, the estimated maximum temperature on the mock-up surface would be close to 750 °C (see the profiles using a star as a symbol in Figure 12).
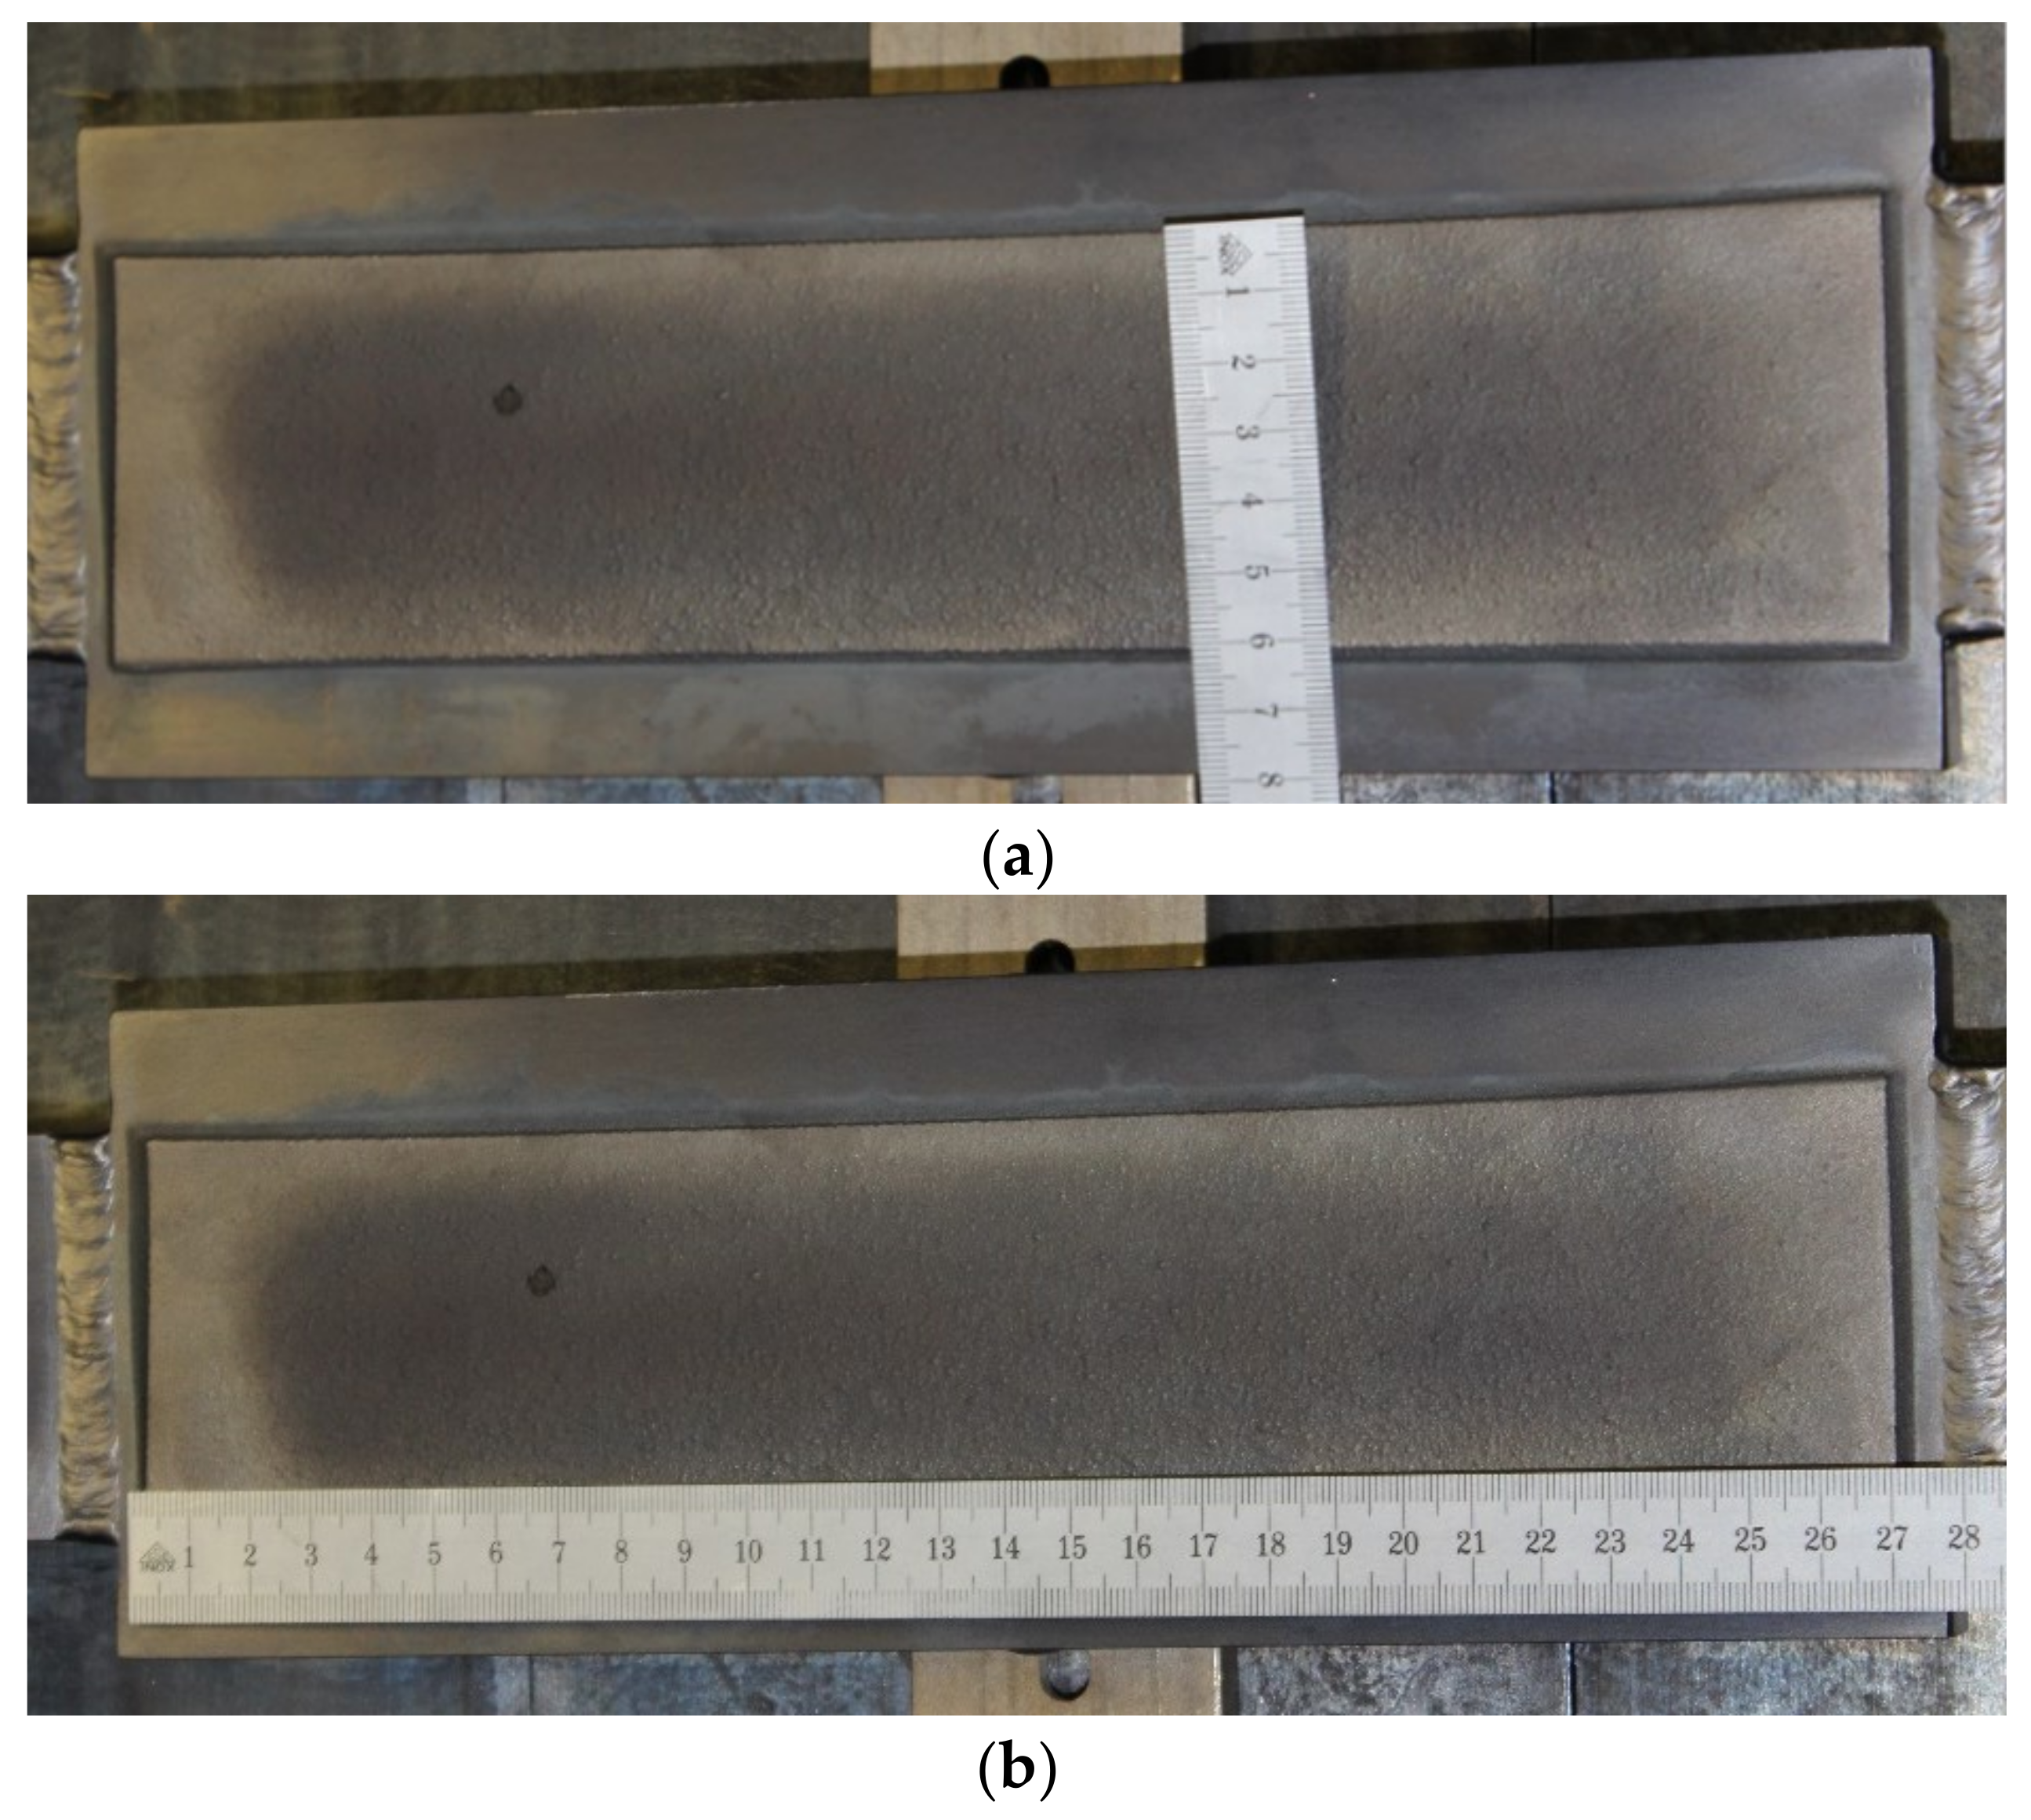
Figure 13 shows the status of the heat-loaded coating area of the FG mock-up after finishing the testing campaign. The impact of the high heat flux on the surface can be observed clearly, however, the thermal stability of the coating successfully survived the thermal fatigue tests. The Tungsten/Eurofer97 coating layer did not fail or separate during (or after completing) the heating cycles.
From both the temperature profile measurements in Figure 12b and the shape of the darker zone in Figure 13, it can be seen that the heating profile is not uniform over the whole coated surface, meaning that the uniform heat flux level will be higher in the middle of the coating, dropping quickly towards the sides. Given the fact that the beam profile can be approximated with a Gaussian, the profile on the sides will follow the same law, the width being determined by the beam spot diameter, which has been estimated to 13.56 mm. To understand better what the real loading conditions on the mock-up were, we simulated the experiment with ANSYS CFX (2021 R1) both using a uniform heat flux and a profiled heat flux. In both cases the coolant enthalpy rise was the same, 12.3 kW, as in the experiments from 5 August 2019. For the profiled heat flux, the area where the applied heat flux is constant (red zone in Figure 14a) has been adjusted so that the resulting temperature field (Figure 14b) matches the darkened area observed on the surface of the mock-up from Figure 13. The resulting heat flux profile has a peak value close to 930 kW/m2 for the same rise in helium enthalpy as for the case when the heat flux is applied uniformly over the whole coated area. The temperature profiles, both in the axial and transverse direction, are in good agreement with the corrected profiles obtained from the IR camera readings from the experiment on 5 August 2019.

5.2. Results for the ODS Mock-Up

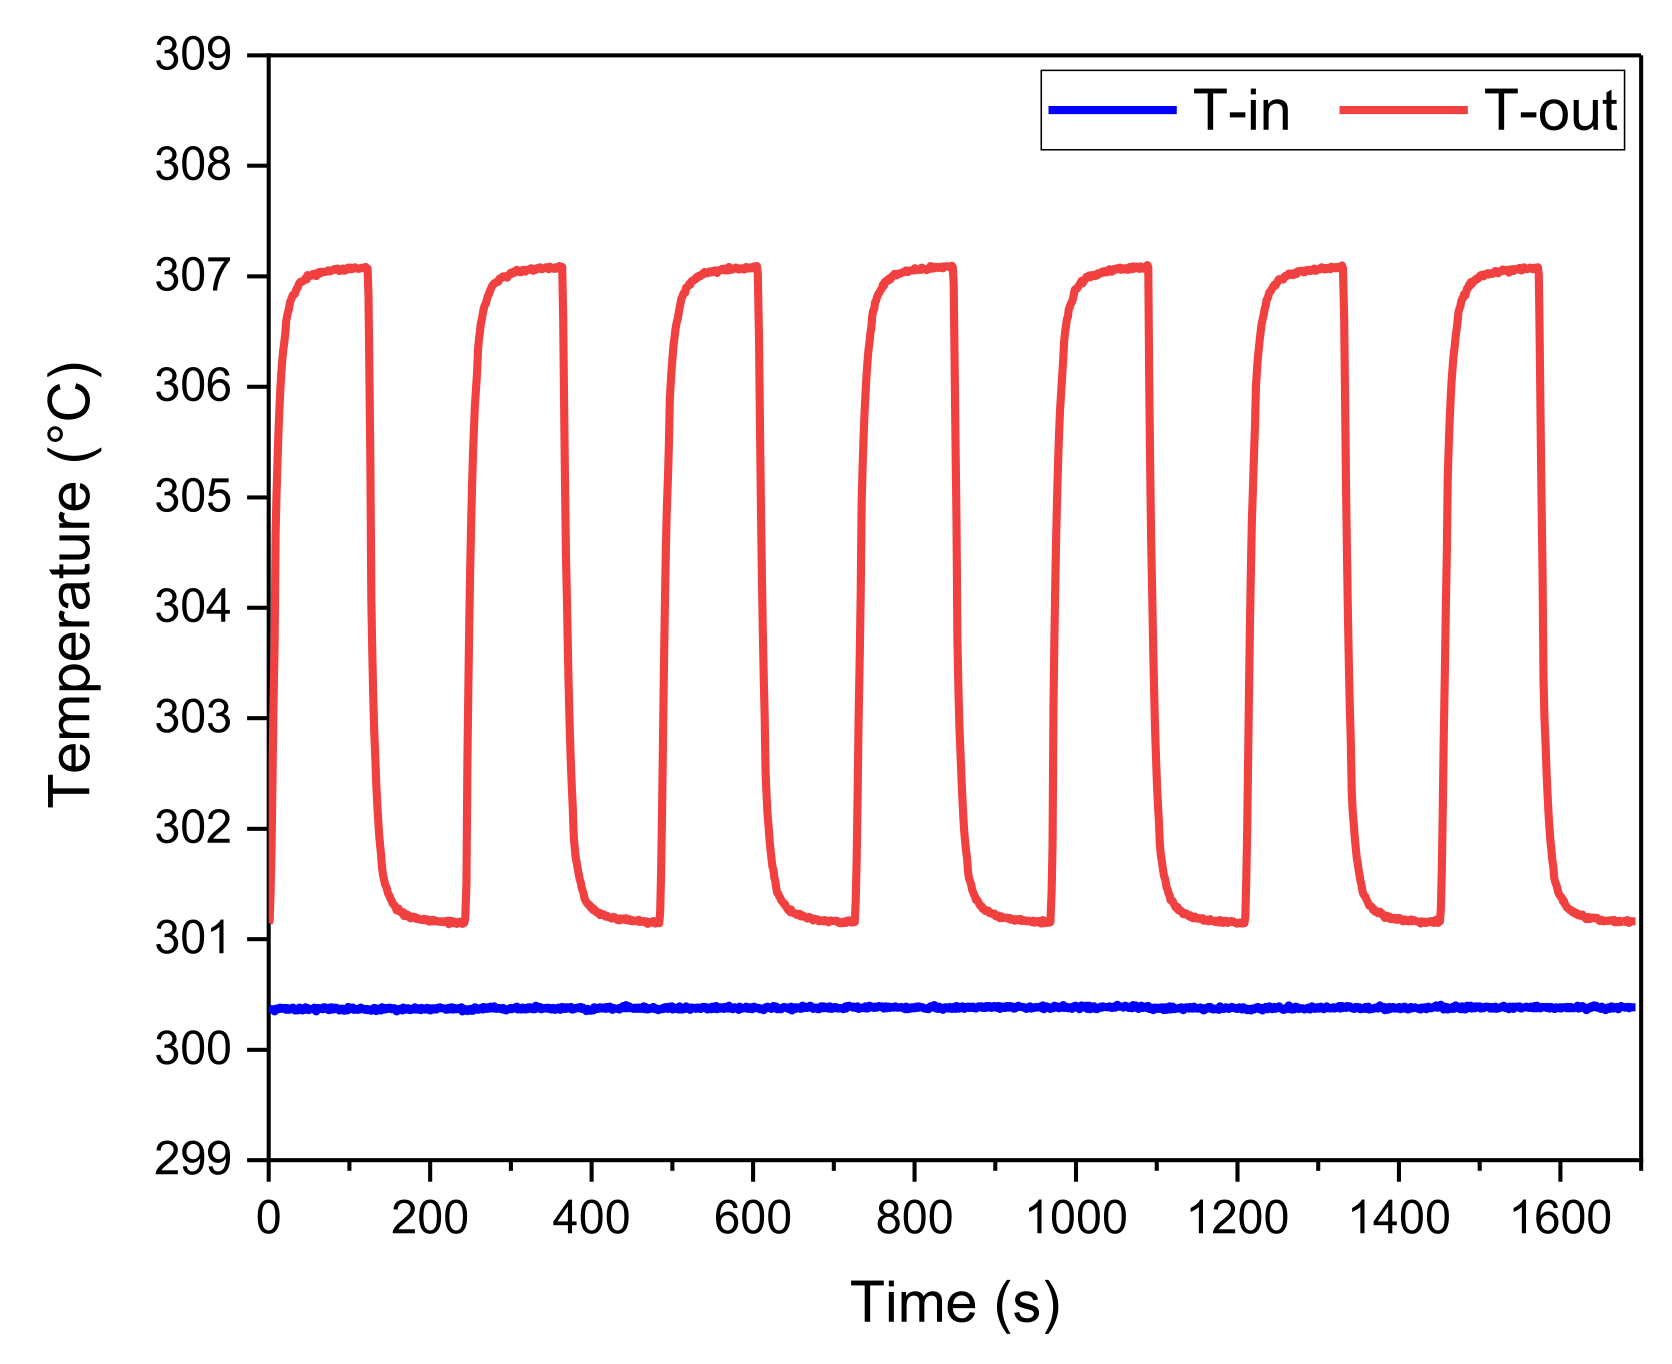
Figure 15 shows the measured values of the inlet helium temperature (T-in) and outlet helium temperature (T-out) for seven short (4 min) heating cycles selected from the testing run of the 9 September 2019. Similar to the experimental sessions for the FG mock-up, in this case the experimental settings ensure a good reproducibility of the loading cycles and generate consistent results. For these tests, the outlet helium temperature reaches a maximum value of 307 °C during the heating-on phase and then decreases down to 301 °C at the end of the heating-off phase of the heating cycle. Additionally, in this run, the inlet helium temperature is about 300.4 °C, which is slightly higher than the set value of 300 °C.
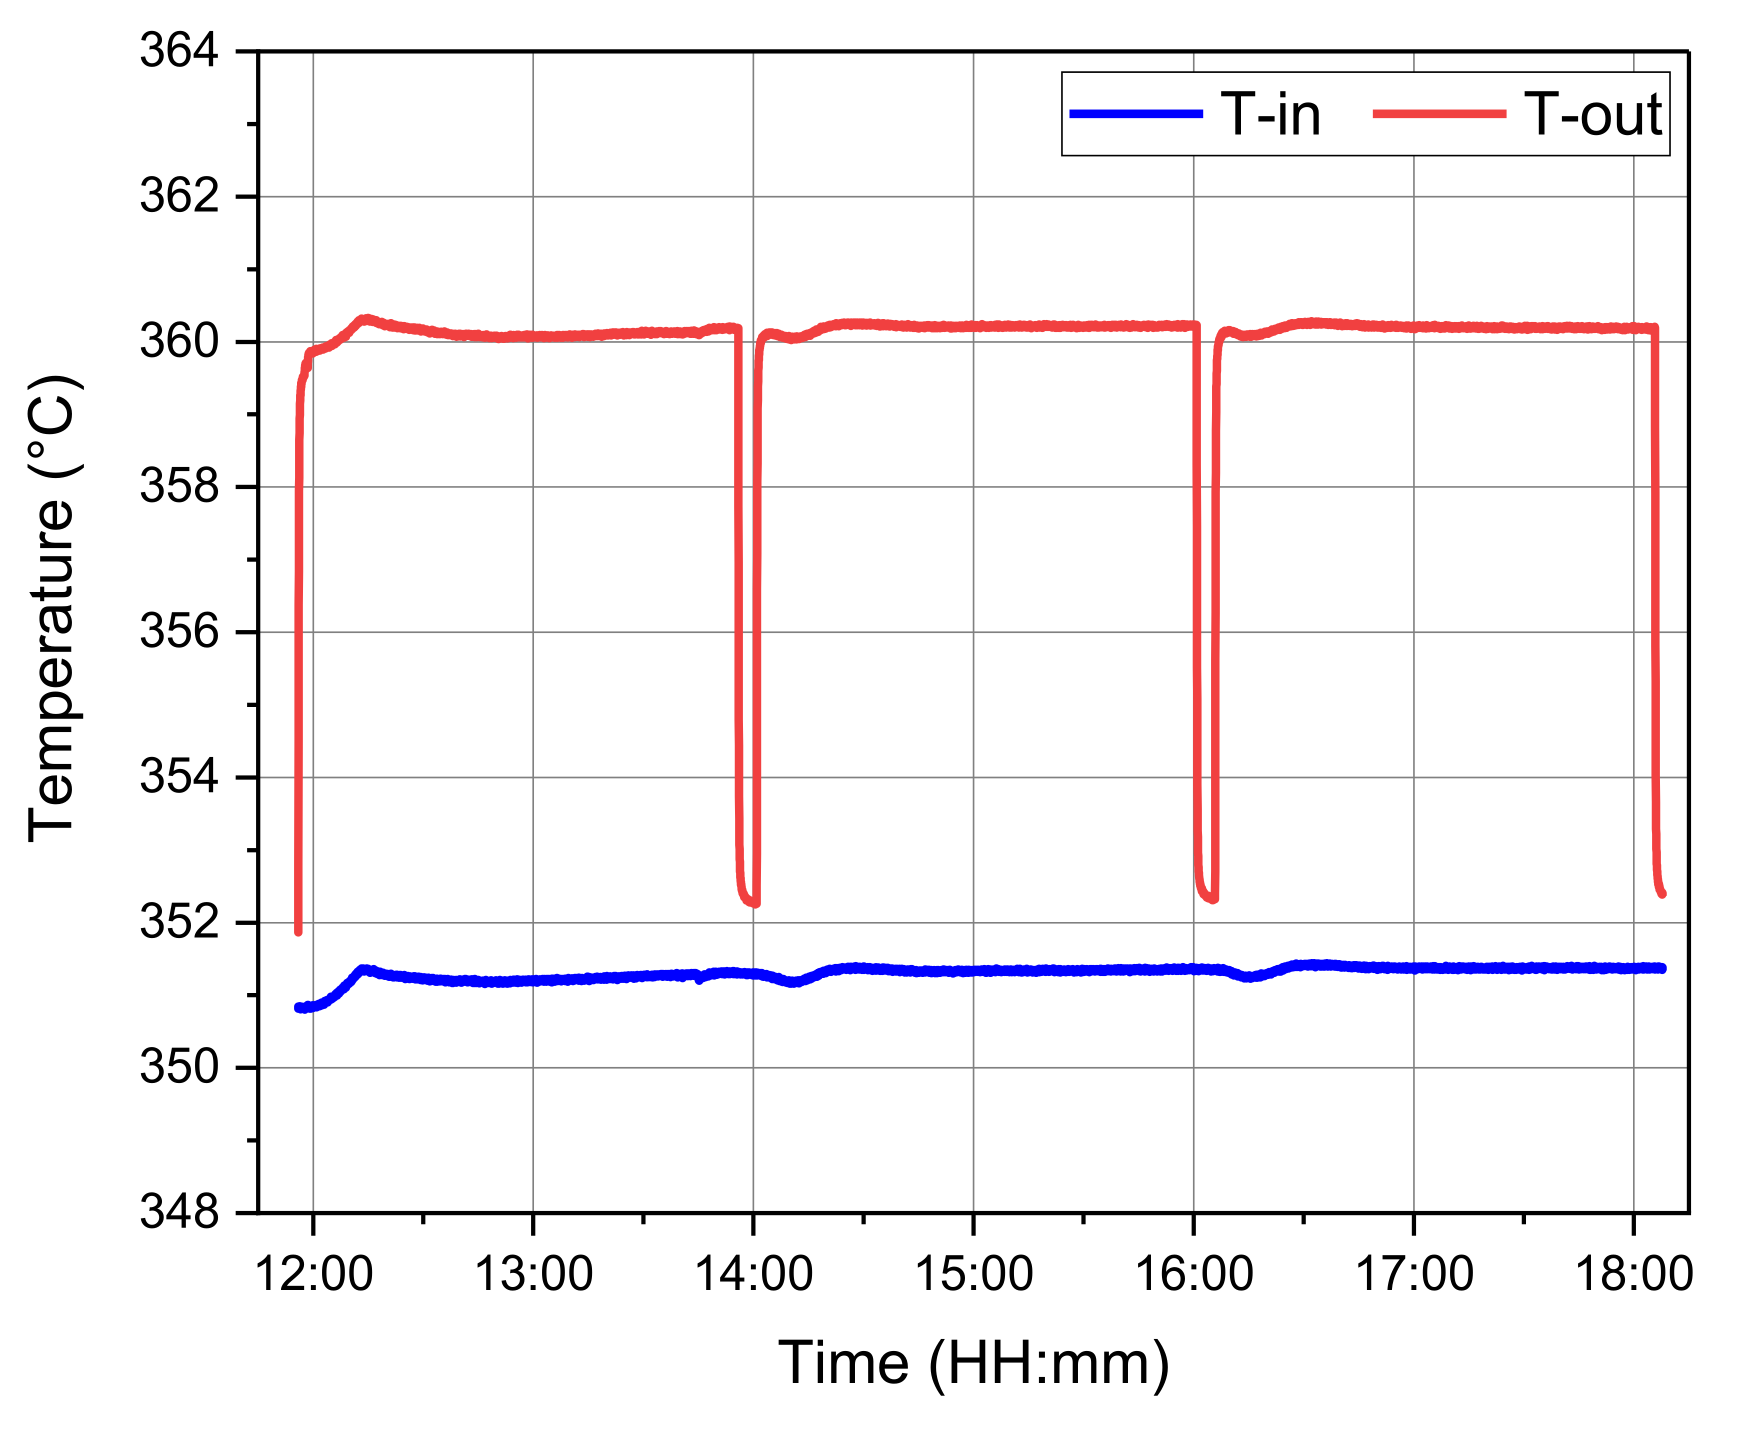
After the completion of the specified number of short pulses, the mock-up was exposed to seven long pulses (one on 7 October, three on 8 October and three on 9 October, 2019), each one being 2 h long. Figure 16 shows the inlet helium temperature (T-in) and outlet helium temperature (T-out) versus the time during the testing run of 8 October 2019. In those runs, the helium mass flow rate was 201 g/s, and the inlet helium temperature was about 351.4 °C. The outlet helium temperature has a maximum value of 360.3 °C during the heating phase and a minimum value of about 352 °C at the end of the heating-off phase of the heating cycle. The helium temperature rise is about 8.3 °C.
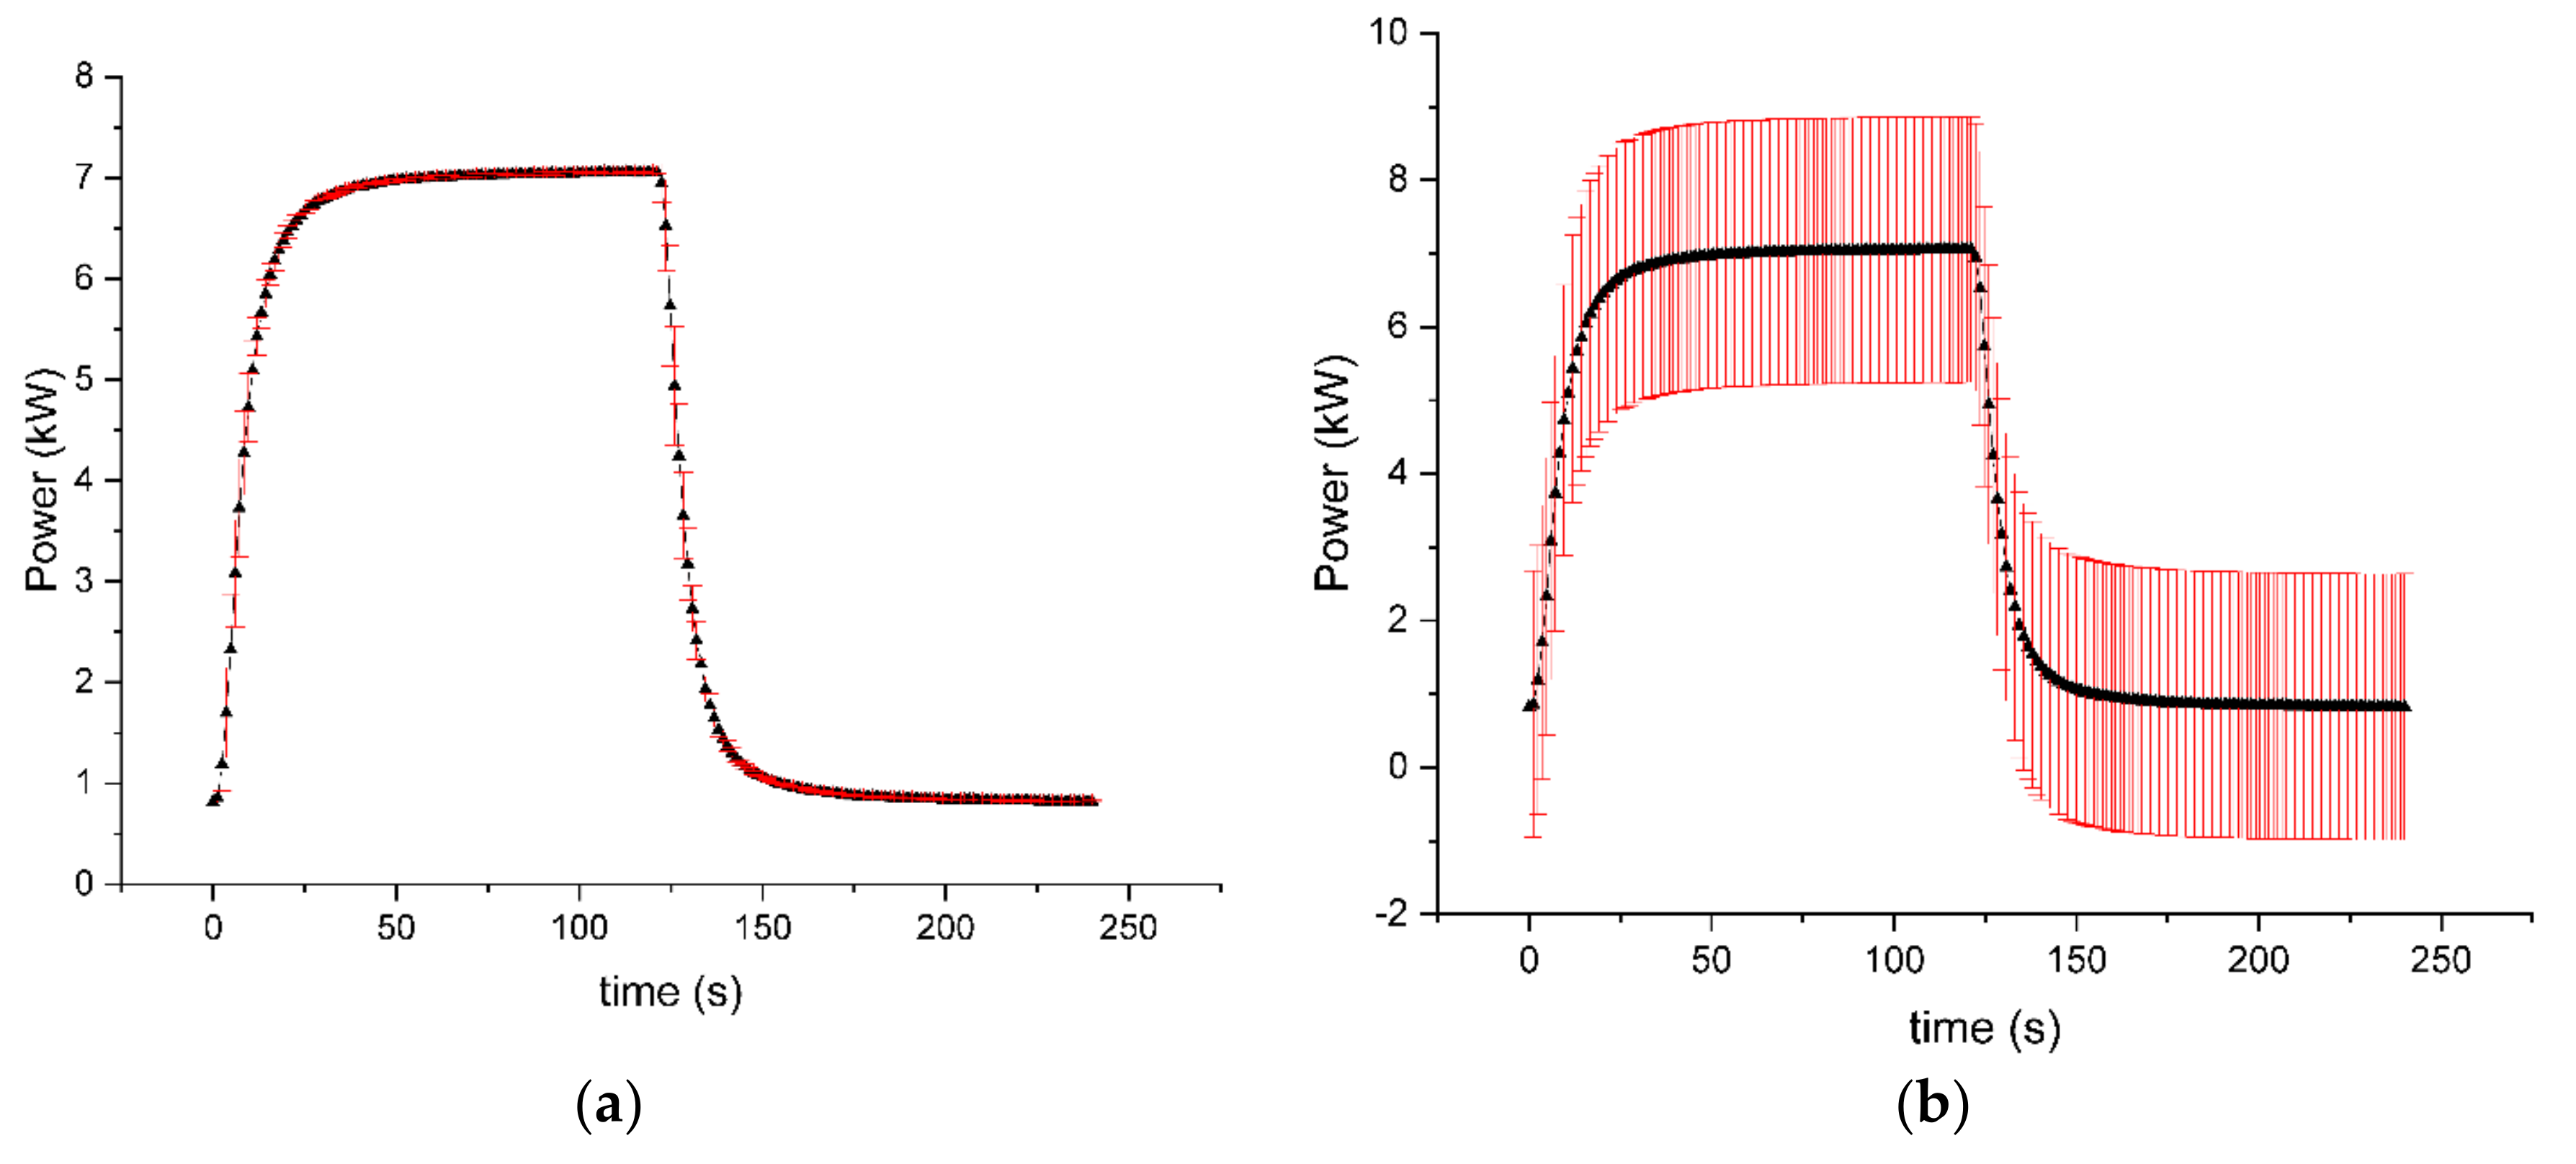
Similar to the FG mock-up, Figure 17a shows the helium enthalpy rise over the mock-up averaged over 15 cycles as well as the associated random uncertainty. The low standard deviations associated with the data over most of the stationary side of the pulse are an indication of the good reproducibility of the loading cycles. When also taking into account the systematic uncertainties associated with the individual measurements, the same as for the FG mock-up, the total uncertainty for the calorimetrically estimated power intake (given in Figure 17b) is almost the same (minimum = ±1.81 kW and maximum = ±1.9 kW). At the top plateau where the power is about 7 kW, the total uncertainty is about 1.81 kW (i.e., the relative uncertainty is about ±26%). The same as for the FG mock-up, the major contribution to the uncertainty associated with the power estimation comes from the uncertainty in evaluating the temperature difference, ΔT, which is relatively large because the temperature difference ΔT is relatively small (maximum ΔT = 6.7 °C). Since the uncertainties in the measurement of the temperatures are almost the same for the two mock-ups, having a lower temperature increase in the ODS experiment means that we have a larger power uncertainty compared to the FG mock-up.
For the long pulses we follow a different approach in evaluating the enthalpy rise in the mock-up. Having only seven pulses, it does not make sense in averaging over the pulses as we did for the short loading cycles. However, the long steady-state region provides us with enough measurement points to estimate the power input during each pulse or an overall value for this type of loading. If we consider the data from all three days, the heat load is estimated to be 9.11 kW/m2 ± 2.1 kW/m2 (relative total uncertainty 23.1%).
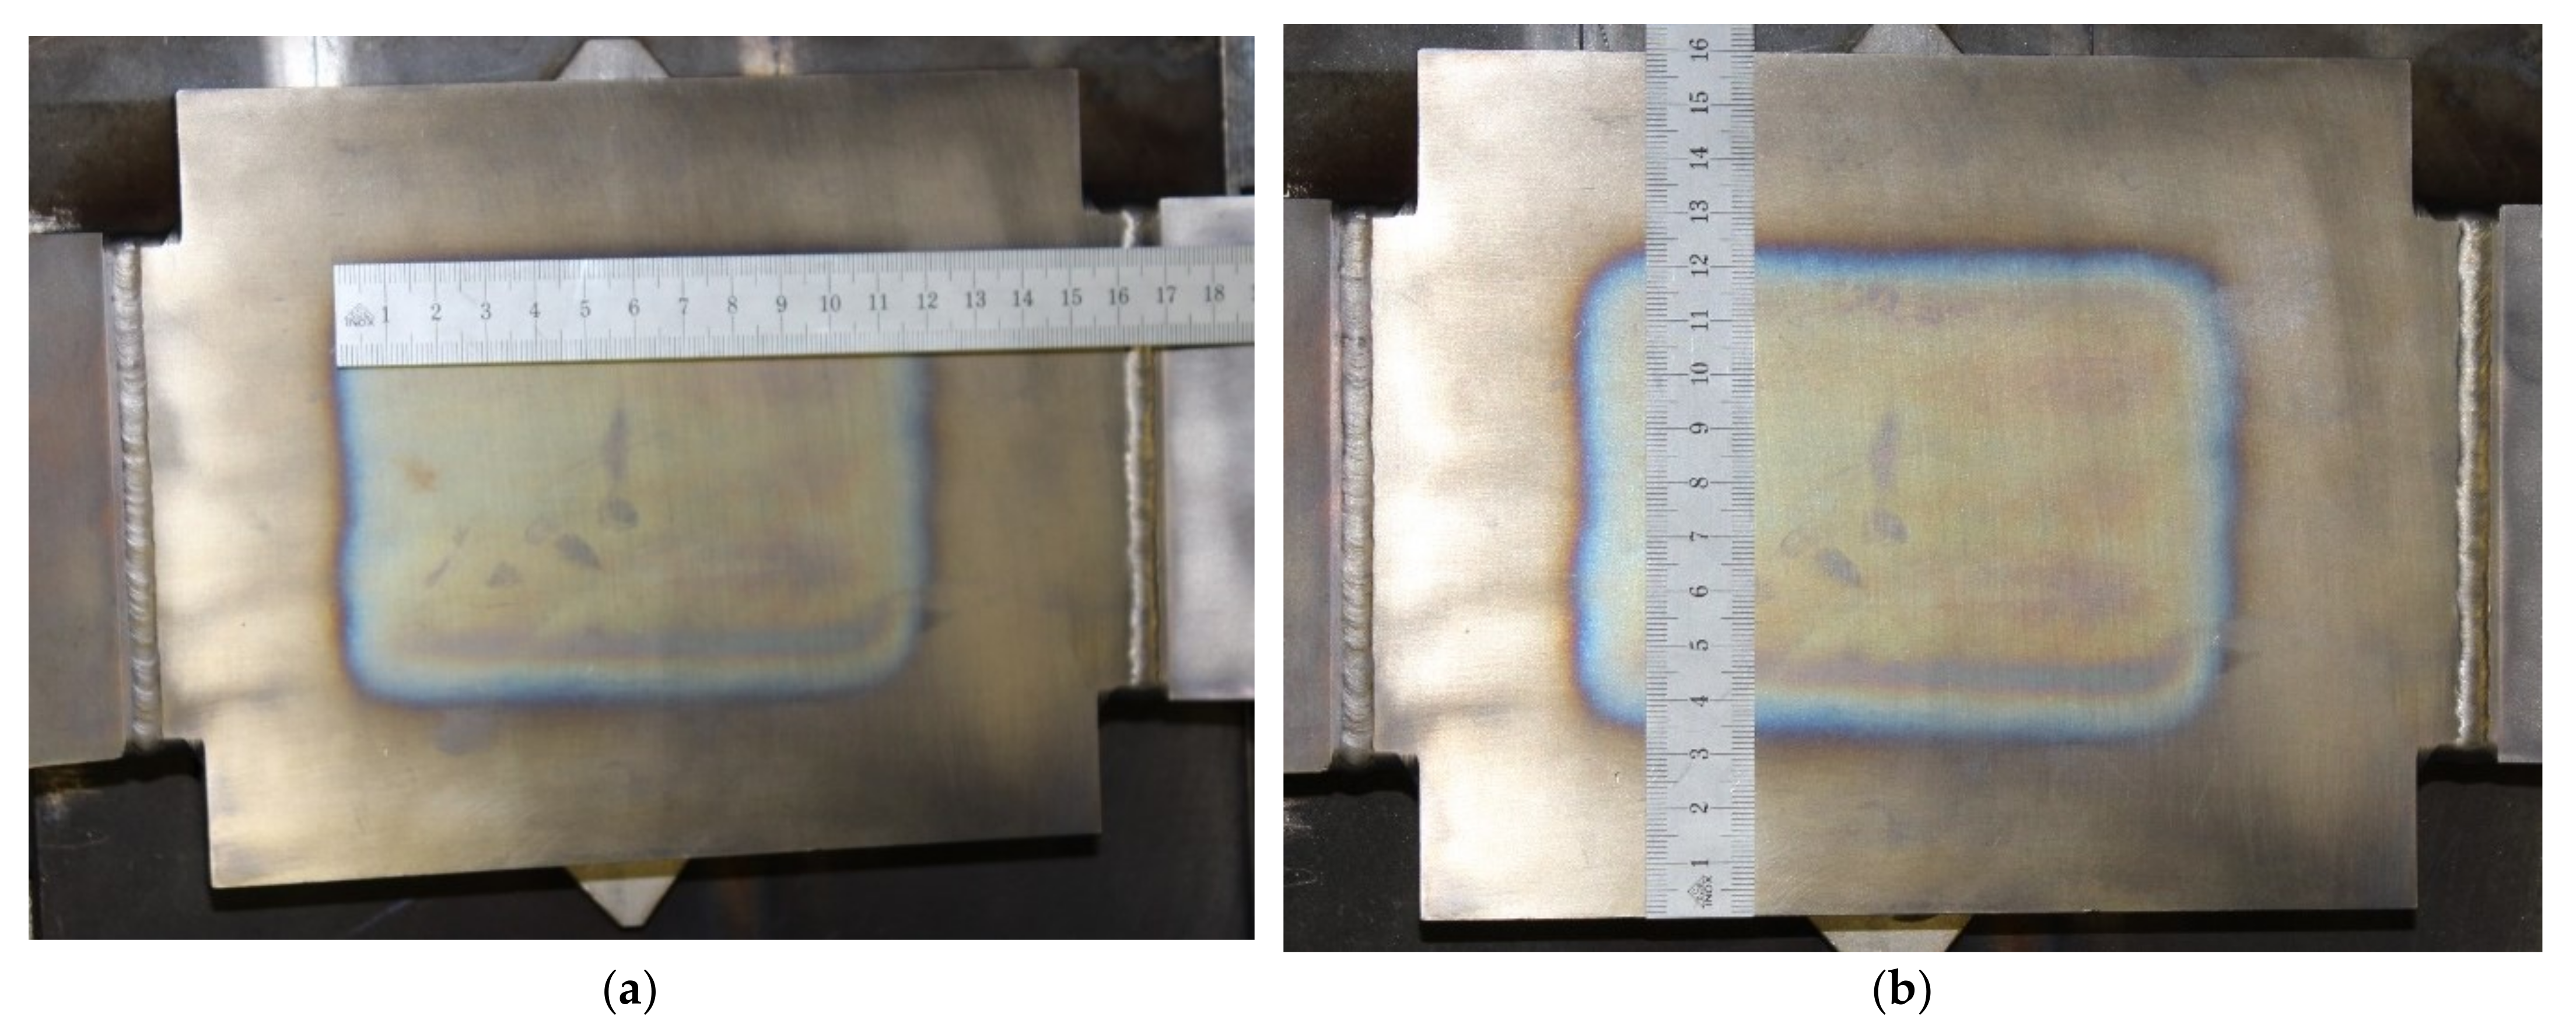
The situation is even more complex when it comes to evaluating the applied heat flux because, during the experiment, there is no clear delimitation of the area on which the heat load is applied, for the FG mock-up, the limits of the coating provide a better reference. Looking at the surface of the mock-up after the experiment (Figure 18), one can see that there is a zone 110 mm long and 90 mm wide that has a rather uniform change in color (light yellow) surrounded by what seems a transition area with a thickness of 5 mm. The first observation that can be made is that, in the flow direction the heated zone covers more than half of the channels’ length (110 mm from 208 mm total length), while in the transverse direction only three channels are below the high heat-loaded zone.
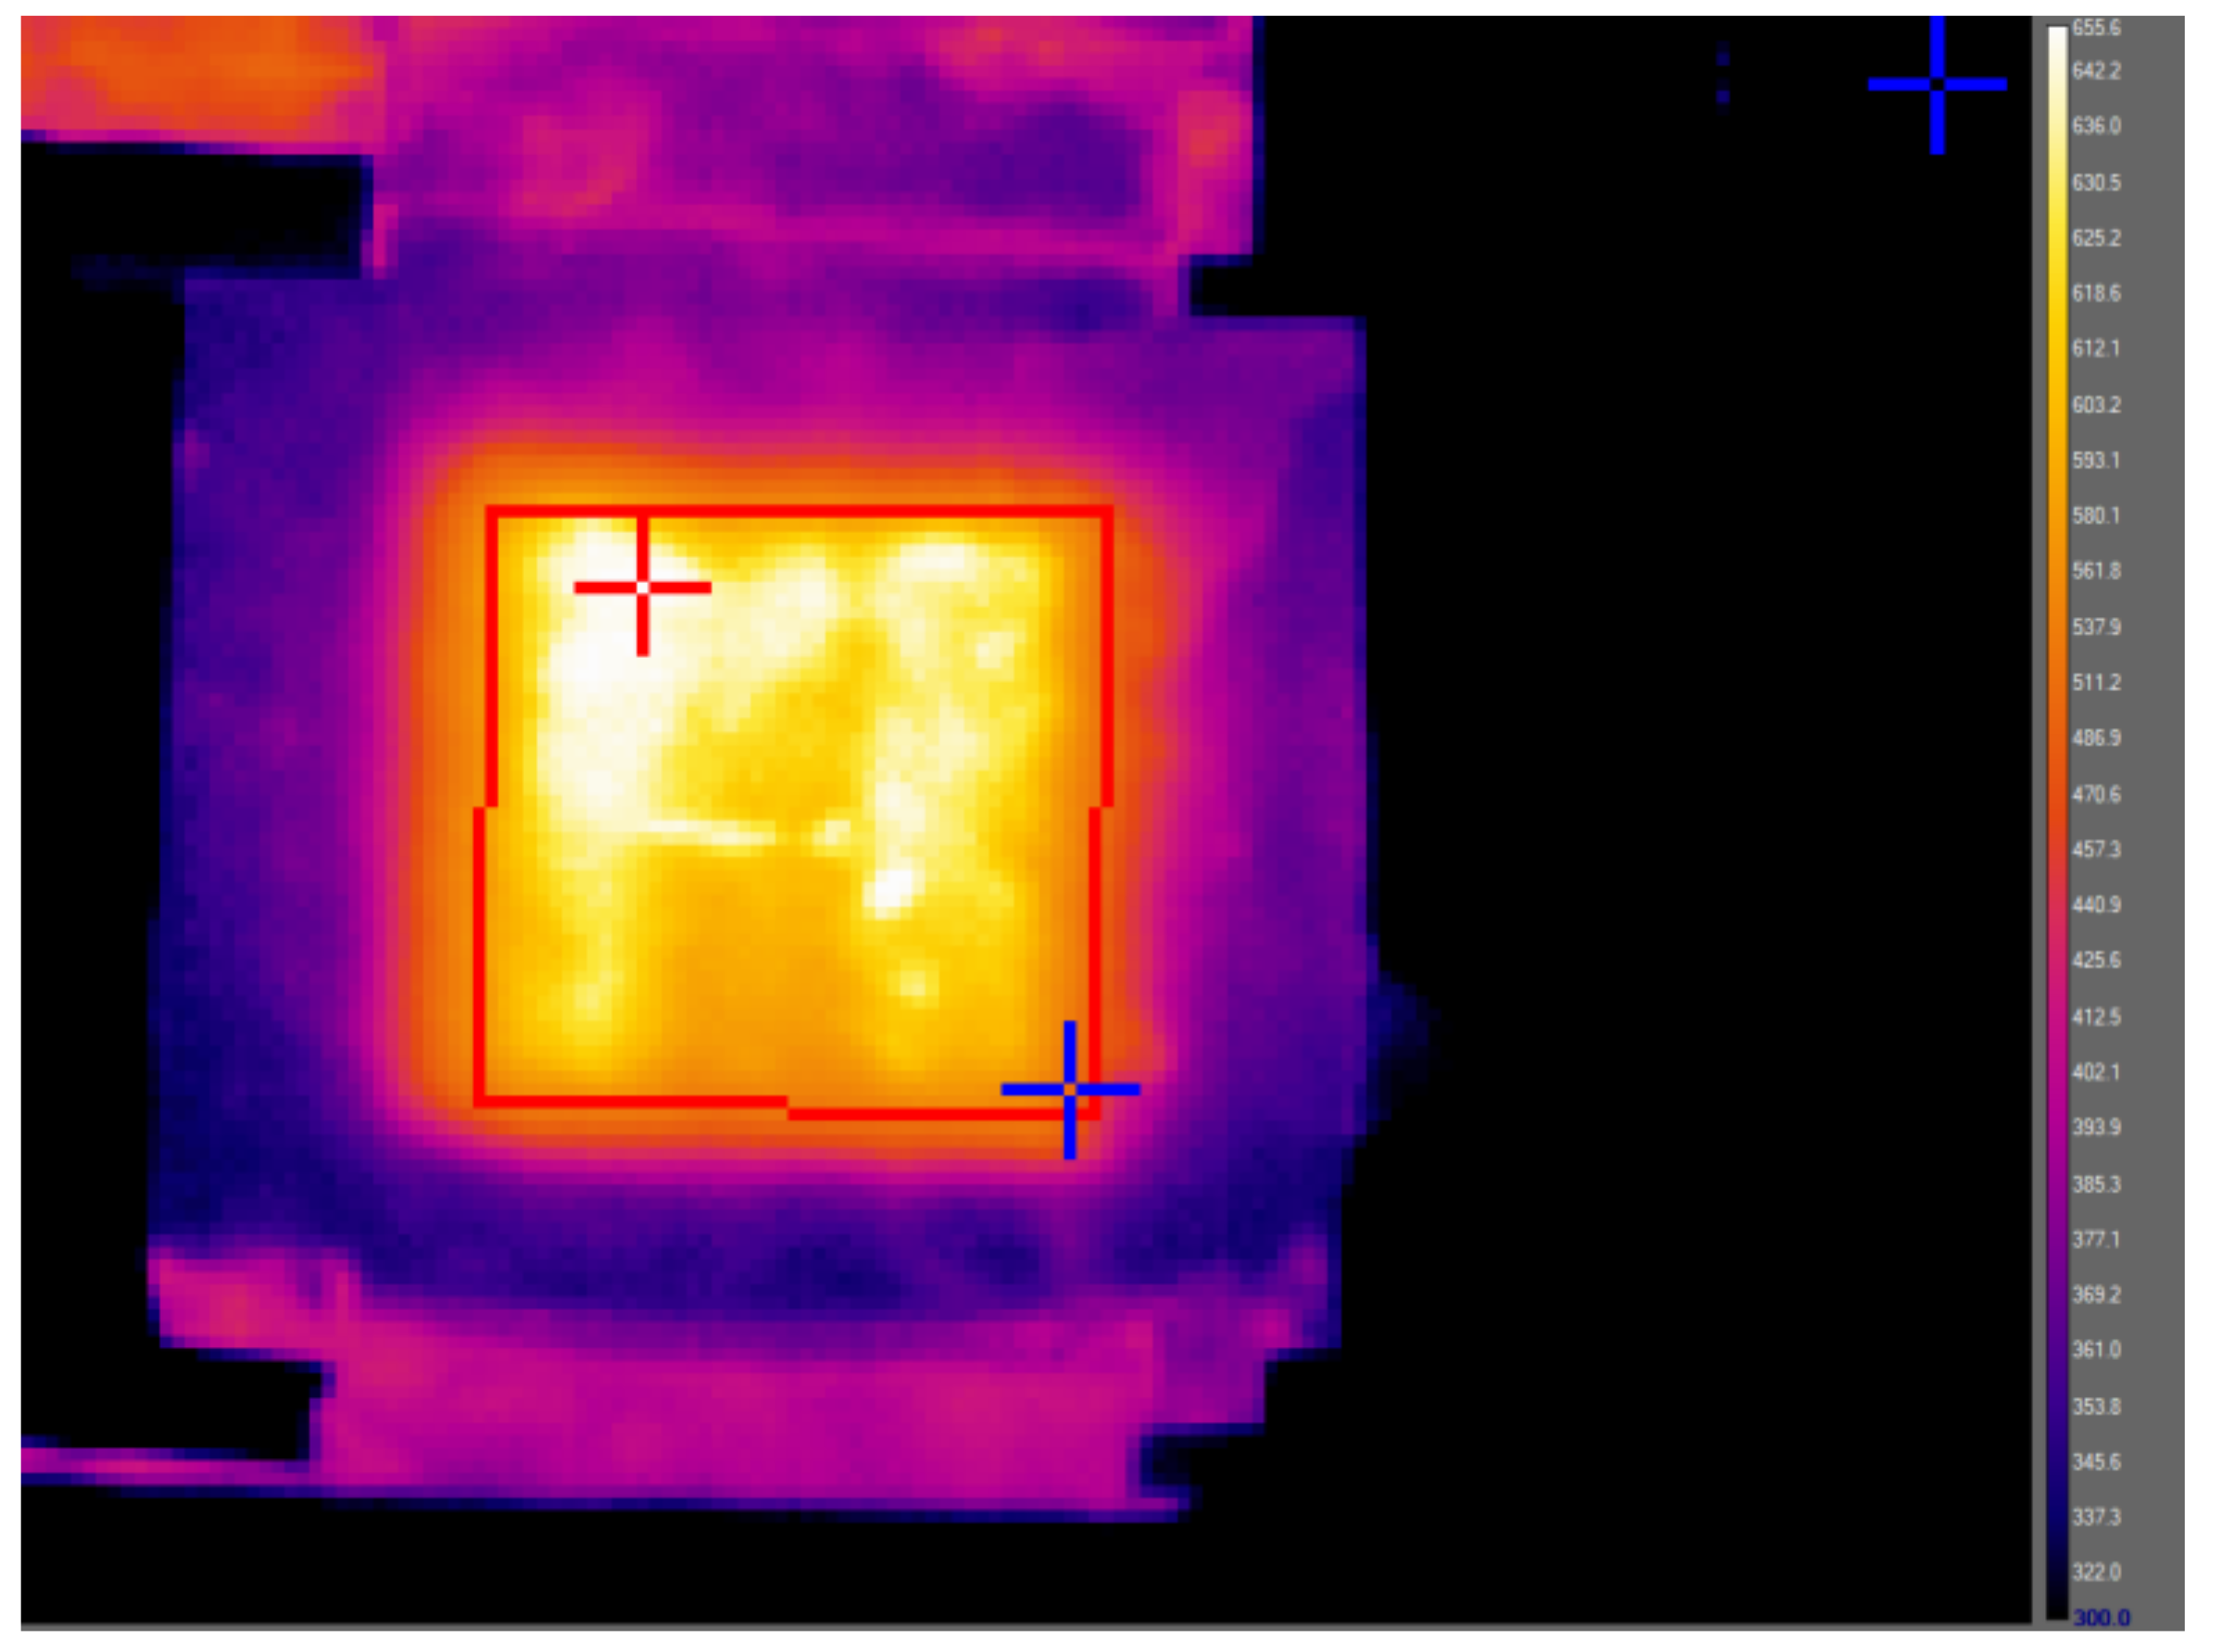
Figure 19 shows the ODS mock-up surface temperature distribution as recorded by the IR camera. The maximum surface temperature is about 656 °C and it occurs in the white colored area in the upper half of the mock-up. Using the channel numbering from Figure 2b, this maximum value occurs on top of channel number 2.
The longitudinal and transverse temperatures profiles (shown in Figure 20) across the ODS mock-up surface were also generated by the IR camera software for the same run from 7 October 2019, for which the picture in Figure 19 was taken.
Both the IR image and the temperature profiles were taken during the long pulse when the highest surface temperature was obtained (close to 670 °C). For comparison, the tests were simulated using ANSYS CFX (2021 R1). The numerical simulation uses the same coolant conditions as in the experiment (350 °C and 201 g/s), the surface heating being applied uniformly over a 110 × 90 mm2 area, similar with the yellow area measured on the mock-up itself. Similar to the simulation conducted for the FG mock-up, outside this zone the heating profile drops following a Gaussian with a full width at half maximum (FWHM) of 13.56 mm. From Figure 20 it can be seen that there is a relatively good agreement between the model and the experiment, in particular in what concerns the axial profile. On the transverse direction, the simulation gives a flatter profile in the top region than what is recorded by the IR camera. Moreover, the peak temperature values occur on top of the middle channel (number 3) and the second channel from the left, while the temperature slightly drops towards the right-hand side. The trend of having lower values on the right-hand side of the mock-up is also visible in the experiment but there the middle channel has lower temperatures as compared to the two neighboring channels. The fact that the middle channel has a thinner wall would explain, to some extent, the temperature profile observed experimentally; however, having a channel with a larger cross-section, the coolant velocity would be smaller than in the other channels, reducing the heat transfer performances. The latter would explain the profile obtained numerically. To clarify these aspects and to further analyze the mechanical stresses that occurred during the experiment, further numerical investigations are under way.
In general, it can be stated that the ODS mock-up was tested successfully (i.e., without any failure or damage) in three hundred short (4 min.) heating cycles and seven long (2 h) heating cycles, as planned. The surface area, which received the electron beam heating, has an obvious change in its color (see the blue-black square contours) as seen in Figure 18. However, besides this change in color, the material analysis conducted afterwards did not find any significant changes in the material structure, as reported in [3].

6. Conclusions

This paper describes the experimental campaign of two breeding blanket first wall mock-ups with special consideration of the diagnostics used, in particular, the measurement of the surface temperature with an IR camera and the evaluation of the applied heating power. Both mock-ups completed the specified testing program without any signs of deterioration. The data acquired during these experiments show a good reproducibility of the loading cycles and a stable loop operation at helium-cooled breeding blanket relevant conditions. The calorimetric evaluation of the power deposited on the mock-ups shows relatively large uncertainties, despite using sensors with the lowest commercially available uncertainty. The reason for this is mainly due to the uncertainty associated with the estimation of the temperature rise over the mock-up, which is calculated from the inlet and outlet temperature measurements. Since these experiments have a modest temperature difference between the inlet and outlet (typically around 10 °C), the associated uncertainty (around 1.7 °C at temperatures around 300 °C) represents about 17% of the calculated value. For the experiments presented in this paper, the value of the power and the associated heat fluxes had only an informative value, the focus here being on the behavior of the materials, therefore, a lower uncertainty on the power evaluation was not required. Nevertheless, numerical studies of these two experiments are underway to evaluate the associated uncertainty of the mechanical stresses.
The experimental investigation and obtained results for the two mock-ups will support the development activities of the advanced Eurofer97 steels as well as the manufacturing techniques for the fusion FW.

Author Contributions

Conceptualization, B.-E.G., M.R., T.E., A.A.S. and M.L.; writing—original draft preparation, B.-E.G.; writing—review and editing, A.A.S.; visualization, A.A.S., B.-E.G.; supervision, J.A., M.R. All authors have read and agreed to the published version of the manuscript.

Funding

This work has been carried out within the framework of the EUROfusion Consortium and has received funding from the Euratom research and training programme 2014–2018 and 2019–2020 under grant agreement No 633053. The views and opinions expressed herein do not necessarily reflect those of the European Commission.

Institutional Review Board Statement

Not applicable.

Informed Consent Statement

Has received funding from the Euratom research and training programme 2014–2018 and 2019–2020 under grant agreement No 633053. The views and opinions expressed herein do not necessarily reflect those of the European Commission.

Data Availability Statement

Not applicable.

Conflicts of Interest

The authors declare no conflict of interest.

References

  1. Gräning, T.; Rieth, M.; Hoffmann, J.; Möslang, A. Production, microstructure and mechanical properties of two different austenitic ODS steels. J. Nucl. Mater. 2017, 487, 348–361. [Google Scholar] [CrossRef]
  2. Emmerich, T.; Qu, D.D.; Vaßen, R.; Aktaa, J. Development of W-coating with functionally graded W/EUROFER-layers for protection of First-Wall materials. Fusion Eng. Des. 2018, 128, 58–67. [Google Scholar] [CrossRef] [Green Version]
  3. Rieth, M.; Pintsuk, G.; Aiello, G.; Henry, J.; de Carlan, Y.; Ghidersa, B.E.; Neuberger, H.; Rey, J.; Dürrschnabel, M.; Bolich, D.; et al. Impact of materials technology on the Breeding Blanket design—Recent progress and case studies in materials technology. Fusion Eng. Des. 2021, 166, 112275. [Google Scholar] [CrossRef]
  4. Emmerich, T.; Qu, D.; Ghidersa, B.E.; Lux, M.; Rey, J.; Vaßen, R.; Aktaa, J. Development progress of coating First Wall components with functionally graded W/Eurofer layers on laboratory scale. Nucl. Fusion 2020, 60, 126004. [Google Scholar] [CrossRef]
  5. Ghidersa, B.E.; Ionescu-Bujor, M.; Janeschitz, G. Helium Loop Karlsruhe (HELOKA): A valuable tool for testing and qualifying ITER components and their He cooling circuits. Fusion Eng. Des. 2006, 81, 1471–1476. [Google Scholar] [CrossRef]
  6. Jianu, A.; Marchese, V.; Ghidersa, B.E.; Messemer, G.; Ihli, T. HELOKA data acquisition and control system: Current development status. Fusion Eng. Des. 2009, 84, 974–978. [Google Scholar] [CrossRef]
  7. Ranjithkumar, S.; Yadav, B.K.; Saraswat, A.; Paritosh Chaudhuri, E.; Kumar, R.; Kunze, A.; Ghidersa, B.E. Performance assessment of the Helium cooled First Wall mock-up in HELOKA facility. Fusion Eng. Des. 2020, 150, 111319. [Google Scholar] [CrossRef]
  8. Fasano, G.; Vio, R. Fitting a straight line with errors on both coordinates. Bull. D’inf. Cent. Donnees Stellaires 1988, 35, 191. [Google Scholar]
  9. Association Française pour les Règles de Conception, de Construction et Surveillance en Exploitation des Matériels des Chaudières Électro-Nucléaires. RCC-MRx, Design and Construction Rules for Mechanical Components of Nuclear Installations: High Temperature, Research and Fusion Reactors; AFCEN: Courbevoie, France, 2015. [Google Scholar]
  10. Peterson, H. The Properties of Helium: Density, Specific Heats, Viscosity, and Thermal Conductivity at Pressures from 1 to 100 Bar and from Room Temperature to About 1800k; Risö Report no. 224; Forskningscenter Risoe: Roskilde, Denmark, 1970. [Google Scholar]
Figure 1. FG mock-up cross-section: (a) Picture of the mock-up cross-section as manufactured; (b) Drawing of the cross-section with dimensions including the final dimensions of the coating (1.2 mm FG layer +0.2 mm tungsten cover). Note that, during the final manufacturing steps, the mock-up lost about 0.6 mm from the initial 0.8 mm of the tungsten layer, as described in [4].
Energies 14 07580 g001
Figure 2. ODS mock-up: (a) the cooling plate with the cooling channels before the installation of the inlet/outlet manifolds; (b) cross-section through the mock-up with channels dimensions.
Energies 14 07580 g002
Figure 3. Geometry of the inlet/outlet manifolds: (a) ODS mock-up; (b) FG mock-up.
Energies 14 07580 g003
Figure 4. Experimental assembly featuring the two mock-ups.
Energies 14 07580 g004
Figure 5. Piping and Instrumentation Diagram for the experimental set-up.
Energies 14 07580 g005
Figure 6. Experimental set-up for determining the correlation between IR camera temperature readings and the real surface temperature for tungsten surfaces.
Energies 14 07580 g006
Figure 7. Fasano and Vio [8] fit of the IR camera measurements and the W-slab thermocouple.
Energies 14 07580 g007
Figure 8. Thermal image of the FG mock-up by the IR camera. The red rectangle marks the coated area and the red and blue cross marks the position of the hottest and, respectively, the coldest point on the coating. The coolant at 300 °C enters the target from the right side and flows to the left side.
Energies 14 07580 g008
Figure 9. Temperatures (T-in, T-out, T-TC) in 7 cycles for FG mock-up during the run 5 August 2019.
Energies 14 07580 g009
Figure 10. Temperature evolution at the mock-up thermocouple position averaged over 15 cycles during a run from 5 August 2019 for FG mock-up.
Energies 14 07580 g010
Figure 11. Helium power intake averaged over 15 pulses (run from 5 August 2019): (a) power with associated random uncertainty; (b) power with associated measurement uncertainty.
Energies 14 07580 g011
Figure 12. FG mock-up temperature profiles obtained from IR camera, the corresponding corrected profiles and (CFX) simulated temperature profiles: (a) axial temperature profile; (b) transversal temperature profile. The profiles are taken through the point of maximum temperature of the temperature field.
Energies 14 07580 g012
Figure 13. Status of the heat-loaded FG mock-up surface after the testing, the flow direction in the channels being from right to the left. The dark area in the center of the picture indicates the zone subject to high-heat flux loading: (a) transverse measurement of the FG-layer and of the loaded area; (b) measurement of the longitudinal dimensions of the FG-layer and the loaded surface.
Energies 14 07580 g013
Figure 14. Surface temperature field simulated with CFX: (a) profiled heat flux distribution (930 kW/m2 peak flux); (b) surface temperature using the profiled heat flux; (c) surface temperature obtained for a uniform heat flux of 734 kW/m2.
Energies 14 07580 g014
Figure 15. Temperatures (T-in and T-out) in 7 short cycles for ODS mock-up run 9 September 2019.
Energies 14 07580 g015
Figure 16. Temperatures (T-in and T-out) in the long cycles for ODS mock-up run from 8 October 2019.
Energies 14 07580 g016
Figure 17. Power evolution for the run of 19 September 2019: (a) values averaged over 15 consecutive cycles with the associated standard deviation; (b) power evolution including the associated uncertainty.
Energies 14 07580 g017
Figure 18. Status of the heat-loaded ODS mock-up surface after the testing, in both pictures the flow direction in the channels being from left to the right. The light-yellow area in the center of the picture indicates the zone subject to high-heat flux loading: (a) longitudinal measurement of the loaded area; (b) measurement of the mock-up transverse dimensions and of the loaded surface.
Energies 14 07580 g018
Figure 19. Thermal image of the ODS mock-up by the IR camera. The coolant inlet is on the bottom of the figure, the helium channels being oriented vertically in this picture. The red cross indicates the position of the maximum temperature (656 °C) and the blue cross the lowest temperature (504 °C) the averaged value being around 612 °C.
Energies 14 07580 g019
Figure 20. Temperatures profiles across the ODS mock-up in run of 7 October 2019: (a) longitudinal; (b) transversal. The numerically simulated profiles are drawn with red continuous line.
Energies 14 07580 g020
Table 1. Calculated channel flow rates under steady-state conditions and deviation from the nominal values (positive values represent a deficit in the flow and the negative values correspond to an excess with regard to nominal values).
Flow Channel mn1Flow Calculated at the Channel Inlet (g/s)Deviation from
Nominal Flow (%)
Flow CH138.44
Flow CH239.51.25
Flow CH341.4−3.5
Flow CH440.2−0.5
Flow CH540.4−1
Total200.2−0.1
Table 2. List of helium parameters monitored for the ODS mock-up.
ParameterSensor/Signal LabelSensor TypeRange
Accuracy
Flow rateTS-F-011Orifice
(d = 14.365 mm, β = 0.53921)
-
Differential pressure over the flowmeterTS-DP-F11Membrane differential pressure sensor
(type SIEMENS
Sitrans P DSIII,)
0 to 5 bar
0.065% from range
Pressure before the flowmeter (+tap)TS-P-F11Membrane pressure sensor
(type DMP 320 from
BD Sensors GmbH)
0 to 100 bar
0.1% from range
Temperature after flowmeterTS-T-F11Thermocouple (type K, class 1)<1000 °C
0.4% × temperature (in °C)
Inlet temperatureTS-T-015Thermocouple (type K, class 1)<1000 °C
0.4% × temperature (in °C)
Outlet temperatureTS-T-014Thermocouple (type K, class 1)<1000 °C
0.4% × temperature (in °C)
Table 3. List of helium parameters monitored for the FG mock-up.
ParameterSensor/Sig Sensor/Signal LabelSensor TypeRange
Accuracy
Flow rateTS-F-022Orifice
(d = 14.365 mm, β = 0.53921)
-
Differential pressure over the flowmeterTS-DP-F22Membrane differential pressure sensor
(type Sitrans P DSIII from SIEMENS)
0 to 5 bar
0.065% from range
Pressure before the flowmeter (+tap)TS-P-F22Membrane pressure sensor
(type DMP 320 from BD Sensors GmbH)
0 to 100 bar
0.1% from range
Temperature after flowmeterTS-T-F22Thermocouple (type K, class 1)<1000 °C
0.4% × temperature (in °C)
Inlet temperatureTS-T-003Thermocouple (type K, class 1)<1000 °C
0.4% × temperature (in °C)
Outlet temperatureTS-T-013Thermocouple (type K, class 1)<1000 °C
0.4% × temperature (in °C)
Table 4. Testing parameters of the FG mock-up (see [4] for details).
Helium Mass Flow Rate170 g/s
Helium inlet temperature 300 °C
Helium pressure8 MPa
Maximum heat flux700 kW/m2
Substrate temperature limit<520 °C
Heating on/off time150 s/150 s
Number of cycles1000
Table 5. Test matrix for the ODS mock-up.
CyclesHe Inlet TSurface THeat on/off TimeEst. Heat Flux
100300 °C550 °C120 s/120 s700 kW/m2
100300 °C600 °C120 s/120 s800 kW/m2
100350 °C650 °C120 s/120 s900 kW/m2
7350 °C650 °C2 h/5 min900 kW/m2
Publisher’s Note: MDPI stays neutral with regard to jurisdictional claims in published maps and institutional affiliations.