Article

Numerical Simulation of the Effects of Oil Gun Location and Oil Feed Rate on Coal Ignition and Burner Wall Temperature in a Tiny Oil Ignition Burner

1
Key Laboratory of Energy Thermal Conversion and Control of Ministry of Education, School of Energy and Environment, Southeast University, Nanjing 210096, China
2
China Datang Corporation Science and Technology Research Institute, Beijing 100040, China
*
Author to whom correspondence should be addressed.
Energies 2021, 14(22), 7597; https://doi.org/10.3390/en14227597
Submission received: 18 September 2021 / Revised: 11 November 2021 / Accepted: 12 November 2021 / Published: 13 November 2021

Abstract

:
To solve the overheating problem of tiny oil ignition burners’ walls during the firing-up process in a 330 MWe tangentially pulverized coal-fired boiler, a numerical model of a tiny oil ignition burner was carefully built considering combustion, gas–solid flow, and heat transfer. Then, the burner location and oil feed rate were optimized based on the model to prevent the burner’s walls from overheating. The effects of the oil gun extension distance (100, 200, 300, 400, 500 mm) and oil feed rate (160, 140, 120, 100, 80, 70, 60 kg/h) on coal ignition performance and burner wall temperature were carefully investigated. The simulation results showed good agreement with the measured results. The results indicated that decreasing the oil gun distance within the burner diminished the flame length of the co-combustion of oil and pulverized coal, thus lowering the burner wall temperature. Decreasing the oil feed rate appropriately could also reduce the burner wall temperature without influencing the ignition performance. Considering both ignition performance and burner wall temperature, an extension of 400 mm of the oil gun location and an oil feed rate of 160 kg/h were successfully applied to the actual operation without adverse effects. Moreover, it is suggested to move the temperature monitor points from the burner upper wall to the burner side wall.

1. Introduction

The pulverized coal in a coal-fired power plant boiler is ignited by the high-temperature gas preheated by an oil gun, and the pulverized coal is not injected into the boiler until the boiler temperature reaches the coal ignition temperature [1,2]. A large amount of oil is consumed during the firing-up process and partial-load operation in a coal-fired utility boiler [3]. For instance, a lean coal-fired 300 MWe utility boiler consumes approximately 100 tons of fuel oil during the entire ignition process [4]. The annual oil consumption for a Chinese power plant is 1.6 × 10⁷ t, 60% of which is the start–stop oil consumption, and the remainder is the partial load oil consumption [5]. For the sake of saving oil and reducing the economic cost of power plants, many novel ignition technologies have been developed, such as plasma-assisted burners, microwave-assisted burners, and tiny oil ignition burners [6,7,8]. However, there are some problems with plasma-assisted burners and microwave-assisted burners, including limited burner capacities and frequent maintenance demand [9,10,11].
Tiny oil ignition burners are the predominant novel ignition technique in pulverized coal-fired power plants. When using tiny oil ignition burners for the firing-up process in a pulverized coal-fired boiler, light diesel is first ignited to locally produce a high temperature, which can further ignite the pulverized coal inside the burner body. The pulverized coal is partly combusted to form a continuous pulverized coal flame into the furnace. The remain of the pulverized coal will combust inside the furnace to heat the whole furnace and finish the firing-up process. Both oil consumption and initial investment are decreased remarkably when a tiny oil ignition burner is employed; in addition, oil ignition burners are stable. Thus, this kind of burner is widely used in coal-fired utility boilers [12,13]. Many investigations on tiny oil ignition burners have been conducted. Li et al. [14] investigated the effects of key factors such as pulverized coal concentration and primary air velocity on the firing-up process; the oil gun consisted of one main gun and two auxiliary guns, which were separated from the combustion chamber. Xu et al. [15] investigated the ignition of low-volatile pulverized coal using a tiny oil burner in oxygen-enriched conditions; the burner was a double-grade swirl burner in which the oil gun was embedded. Liu et al. [16] investigated the effect of the oil feed rate on bituminous coal ignition performance in a full-scale tiny oil ignition burner; one main oil gun and one auxiliary oil gun were employed in the experiment, and the combustion chamber was divided into an adiabatic combustion chamber, a first combustion chamber, and a second combustion chamber. Zhou et al. [17] investigated gas-solid flow and combustion in tiny oil ignition burners with a numerical simulation method. The existing research works mainly concentrated on the factors that influence the ignition performance of tiny oil burners. However, little attention has been paid to the wall overheating problem and the effect of oil gun location. Compared with furnaces, the inner space of tiny oil ignition burners is much smaller, and the maximum temperature of the flame core can reach 2273 K [18]. During the firing-up process, the oil combustion flame spreads along the burner and reaches the burner outlet, leading to damage due to wall overheating or even to automatic protecting withdrawal of the oil guns from the burner ally, which means the failure of the firing-up process. A relatively high oil feed rate also gives rise to a wall overheating problem due to the excessive intensity of the co-combustion of oil and coal. Therefore, in this paper, a model of a tiny oil ignition burner was carefully built to simulate gas–solid flow, combustion, and heat transfer during the firing-up process for a 330 MWe tangentially pulverized coal-fired boiler. The effects of the oil gun extending distance (as shown in Figure 1) and oil feed rate on ignition performance and burner wall temperature were analyzed in detail using a three-dimensional numerical simulation method. Finally, optimal burner location and oil feed rate were determined to prevent overheating.

2. Methodology

2.1. Tiny Oil Ignition Burner

The tiny oil ignition burner in this study was employed in a 330 MW tangentially fired coal boiler. The main subsystems of the burner were a compressed air system, a fuel oil system, a wall temperature monitoring system, and a flame detecting system. Figure 1 shows the structure of the tiny oil ignition burner. The length of the tiny oil ignition burner was 3.4 m, and the outlet dimension was 0.445 × 0.56 m. A pulverized coal concentration structure was used to regulate the concentration distribution of the pulverized coal. The wearing sleeve arranged at the surface of the oil gun protected it from erosion caused by the pulverized coal; moreover, some secondary air leaked through the middle of the rectangle-circle connector to cool down the wall. We set two temperature monitor points, marked as temperature monitor point A and temperature monitor point B. The temperature at monitor point B was lower than that at monitor point A according to the practical operation data, so the temperature at monitor point A was selected to investigate the wall over heating phenomenon. The temperature monitor point A was located in the middle of the rectangle-circle connector. A temperature below 693 K protected the burner metal material from deformation. That is to say, the overheating phenomenon occurred when the wall temperature exceeded 693 K, which is marked as “To”. The temperature monitor system activated an alarm and automatically quit the firing-up process when the wall temperature exceeded 893 K, which is marked as TW. As shown in Figure 1, the temperature was measured along the x line and the y line, i.e., along the adjacent edges parallel to the burner outlet at temperature monitor point A.

2.2. Numerical Method

Three-dimensional steady-state CFD simulations were performed using the commercial CFD software ANSYS FLUENT 16.0 to obtain the burner wall temperature and ignition performance. The inner space of the tiny oil ignition burner was narrow, and the combustion process was of great complexity, including a variety of coupled sub-processes such as multiphase heat transfers, atomization and combustion of oil, coal devolatilization/combustion and char combustion, heat and mass exchange between the gas phase and the solid phase, and gas turbulent flow. The standard k-ε turbulence model was applied to simulate the turbulent flow in the burner [19,20]. The motion of the particle phase was obtained by solving the Lagrangian equations for the trajectory of a statistically significant sample of individual particles. The P1 model radiation considering the radiation scattering effect was adopted to calculate the radiation heat transfer [21,22]. The weighted-sum-of-gray-gases model (WSGGM) was used to calculate the flue gas emissivity [23,24,25]. A typical gas emissivity of 0.15 was used in this study. The values of 0.9 and 0.6 were used for particle emissivity and particle scattering factor for a coal particle, respectively, while the values of 0.8 and 0.5 were chosen for a diesel liquid particle. The Enhanced Wall Treatment model was adopted to improve the simulation accuracy calculation near the wall. The eddy dissipation model was used for the interaction of turbulence, heat transfer, and reaction. The combustion of pulverized coal char was calculated by the kinetic/diffusion control model. The heterogeneous combustion of coal consisted in the devolatilization and char combustion processes. Devolatilization is assumed to be controlled by the two-competing-reaction model [26,27], i.e., one reaction controls the process at low temperature, and the other reaction controls the process at high temperature:
C o a l ( s ) K v 1 α 1   V o l a t i l e ( g ) + ( 1 α 1 )   C h a r ( s )
C o a l ( s ) K v 2 α 2   V o l a t i l e ( g ) + ( 1 α 2 )   C h a r ( s )
where char combustion is controlled by both the diffusion rate of oxygen on the particle surfaces, kph, and the kinetic rate of the chemical reaction, kch [28,29]. The actual reaction rate kt is a function of these two rates, as follows:
k t = k c h k p h k c h + k p h
The adopted kinetic values for the devolatilization and char combustion are shown in Table 1.
In this study, the eddy dissipation model is used to calculate the homogeneous combustion processes [31,32]. It is assumed that the overall reaction rate is mainly determined by the turbulent flow mixing rate of the species because the chemical reactions are very fast. The turbulent mixing rate of the i component takes the smaller of two values as follows:
R i = min ( υ i , r M w , i A ρ ε k min R ( Y r υ i , r M w , R ) υ i , r , M w , i A B ρ ε k ( P Y p j N υ j , r M w , j ) )
where Yp and YR are the mass fraction of any product species and the mass fraction of a particular reactant, respectively. A and B are empirical constants equal to 4.0 and 0.5, respectively [33]. υ i , r and υ j , r are stoichiometric coefficients, and Mw is the molecular weight of the species.
The coal used was high-volatility Shenhua bituminous coal, whose proximate analysis and ultimate analysis are shown in Table 2. Light diesel was applied in the ignition process, and its ultimate analysis is presented in Table 3. In this study, the diesel spray process was not considered, and the diesel was assumed as the gas after the spray and vaporization process. The combustion of volatile matter and diesel was modeled using two reactions that depend on the properties of the coal and the molecular formula of diesel as follows:
C H 1.115 O 0.247 N 0.0205 + 0.826 O 2 0.7 C O + 0.3 C O 2 + 0.558 H 2 O + 0.00792 N 2
C H 2.2 + 1.2 O 2 0.7 C O + 0.3 C O 2 + 1.1 H 2 O
C O + 0.5 O 2 C O 2
The parameters used in the stimulation were selected according to the practical operation condition. Velocity inlet boundary conditions were employed, and the velocity attitude was perpendicular to the burner inlet. The velocity at the burner inlet was 26 m/s at a temperature of 350 K. The pressure outlet boundary condition was adopted, and the pressure was −50 Pa (a relative pressure). The SIMPLE algorithm was applied to solve the pressure–velocity relationship. PRESTO format was used on the discrete scheme of the pressure term, while the discrete scheme of the remaining terms was the first-order upwind. The convergence criteria were as follows: the temperature of the monitor point was basically stable, the residuals of the energy equation and radiation heat transfer were less than 10−6, and the residuals of the remaining equation were less than 10−3.
The burner wall was made of cast iron; thermal conductivity and specific heat were selected on the basis of the calculated temperature around the wall for the sake of a more accurate wall temperature [34]. Figure 2 shows the thermal conductivity and the specific heat curves as a function of temperature; the relationship among thermal conductivity, specific heat, and temperature is as expressed below:
T C = 2.99345 × 10 5 T 2 6.29 × 10 3 T + 53.84425
S H = 4.1945 × 10 7 T 2 2.81812 × 10 4 T + 0.52999
where TC and SH stand for thermal conductivity (W·m−1·K−1) and specific heat (J·g−1·K−1), respectively, and T (K) is the temperature of cast iron.
S H = 4.1945 × 10 7 T 2 2.81812 × 10 4 T + 0.52999 A three-dimensional grid was used to construct the CFD model. To obtain a more accurate result of the wall temperature, the wall thickness and the surrounding air field were added to the model based on the actual size; therefore, the wall temperature was calculated using the fluid–solid interaction method. A quadrilateral grid was utilized because of its good adaptability to complex shapes and flow field [35,36]. The meshes had different sizes in different areas. More refined meshes were present in the combustion region. Grid independence tests were conducted under the numbers of 430,000, 625,000, and 840,000 cells.
A no-slip temperature boundary condition was applied to the furnace wall with the temperature and emissivity set to 350 K and 0.8, respectively. The pulverized coal concentration was 0.613 kg/s, and its particle diameter obeyed the Rosin-Rammeler distribution with a distribution index of 1.5. The mean diameter, minimum diameter, and maximum diameter were 60 μm, 10 μm, and 250 μm, respectively, and the output of the oil gun was 250 kg/h. Numerical simulations were performed to assess the effects of the oil gun extension distance and oil feed rate on the burner wall temperature; the parameters of the simulated 16 cases are shown in Table 4. Cases 1–4, 7, and 16 were conducted to investigate the influence of the oil gun extension distance on the burner wall temperature and determine the favorable extension distance. Cases 4–9 were conducted to investigate the influence of the oil feed rate on burner wall temperature and find the best extension distance. Cases 9–14 were conducted to investigate the oil feed rate on ignition performance and determine the optimal oil feed rate.

3. Results and Discussion

3.1. Validation of the Simulation Result

The grid independence testing based on vertical gas velocity and gas temperature along the axis of the tiny oil burner is shown in Figure 3. For meshes with 625,000 and 840,000 cells we obtained similar results when comprehensively considering the calculated speed and precision; the mesh consisting of 625,000 cells was adopted for the simulations.
Figure 4 depicts a comparison of the measured and calculated temperatures at the monitor point. When the oil gun was located at the original position and the oil feed rate was 250 kg/h, the calculated temperature at the monitor point was 830 K, and the temperature obtained from the experiment was 886 K. In addition, when the oil gun extension distance was 400 mm and the oil feed rate was adjusted to 160 kg/h, the calculated and the measured temperatures at the monitor point were 615 K and 635 K, respectively. The relative errors between calculated and experimental values under these two operation conditions were 9.1% and 5.5%, respectively. The results indicate that the mathematical models and grid used in this work can reasonably predict the flow, combustion, and heat transfer in the tiny oil ignition burner. The model allows calculating the wall temperature with the desirable accuracy.

3.2. Analysis of the Burner before Modification

Figure 5 shows the temperature and velocity fields, O2, CO2, H2O, and light diesel oil mole fraction fields of the burner at the cross section before modification. The temperature distribution showed that the flame of oil and consequently the ignited pulverized coal diffused along the burner and reached the maximum in the burner outlet region, which is consistent with the practical jet characteristics of a straight flow. The velocity gradually increased because of the expansion of the high-temperature gas. There was a conical area in the burner where O2 concentration was near zero, and CO2 and H2O concentrations were high. This phenomenon was mainly caused by the fact that the combustion of oil and, consequently, the ignited pulverized coal by oil combustion consume a large amount of oxygen. It can be seen that the concentration of light diesel oil decreased gradually from the oil gun nozzle to the middle of the burner. This indicated that the combustion of light diesel oil occurred mainly near the nozzle, and the ignited pulverized coal continued igniting the remained pulverized coal in the left part of the burner

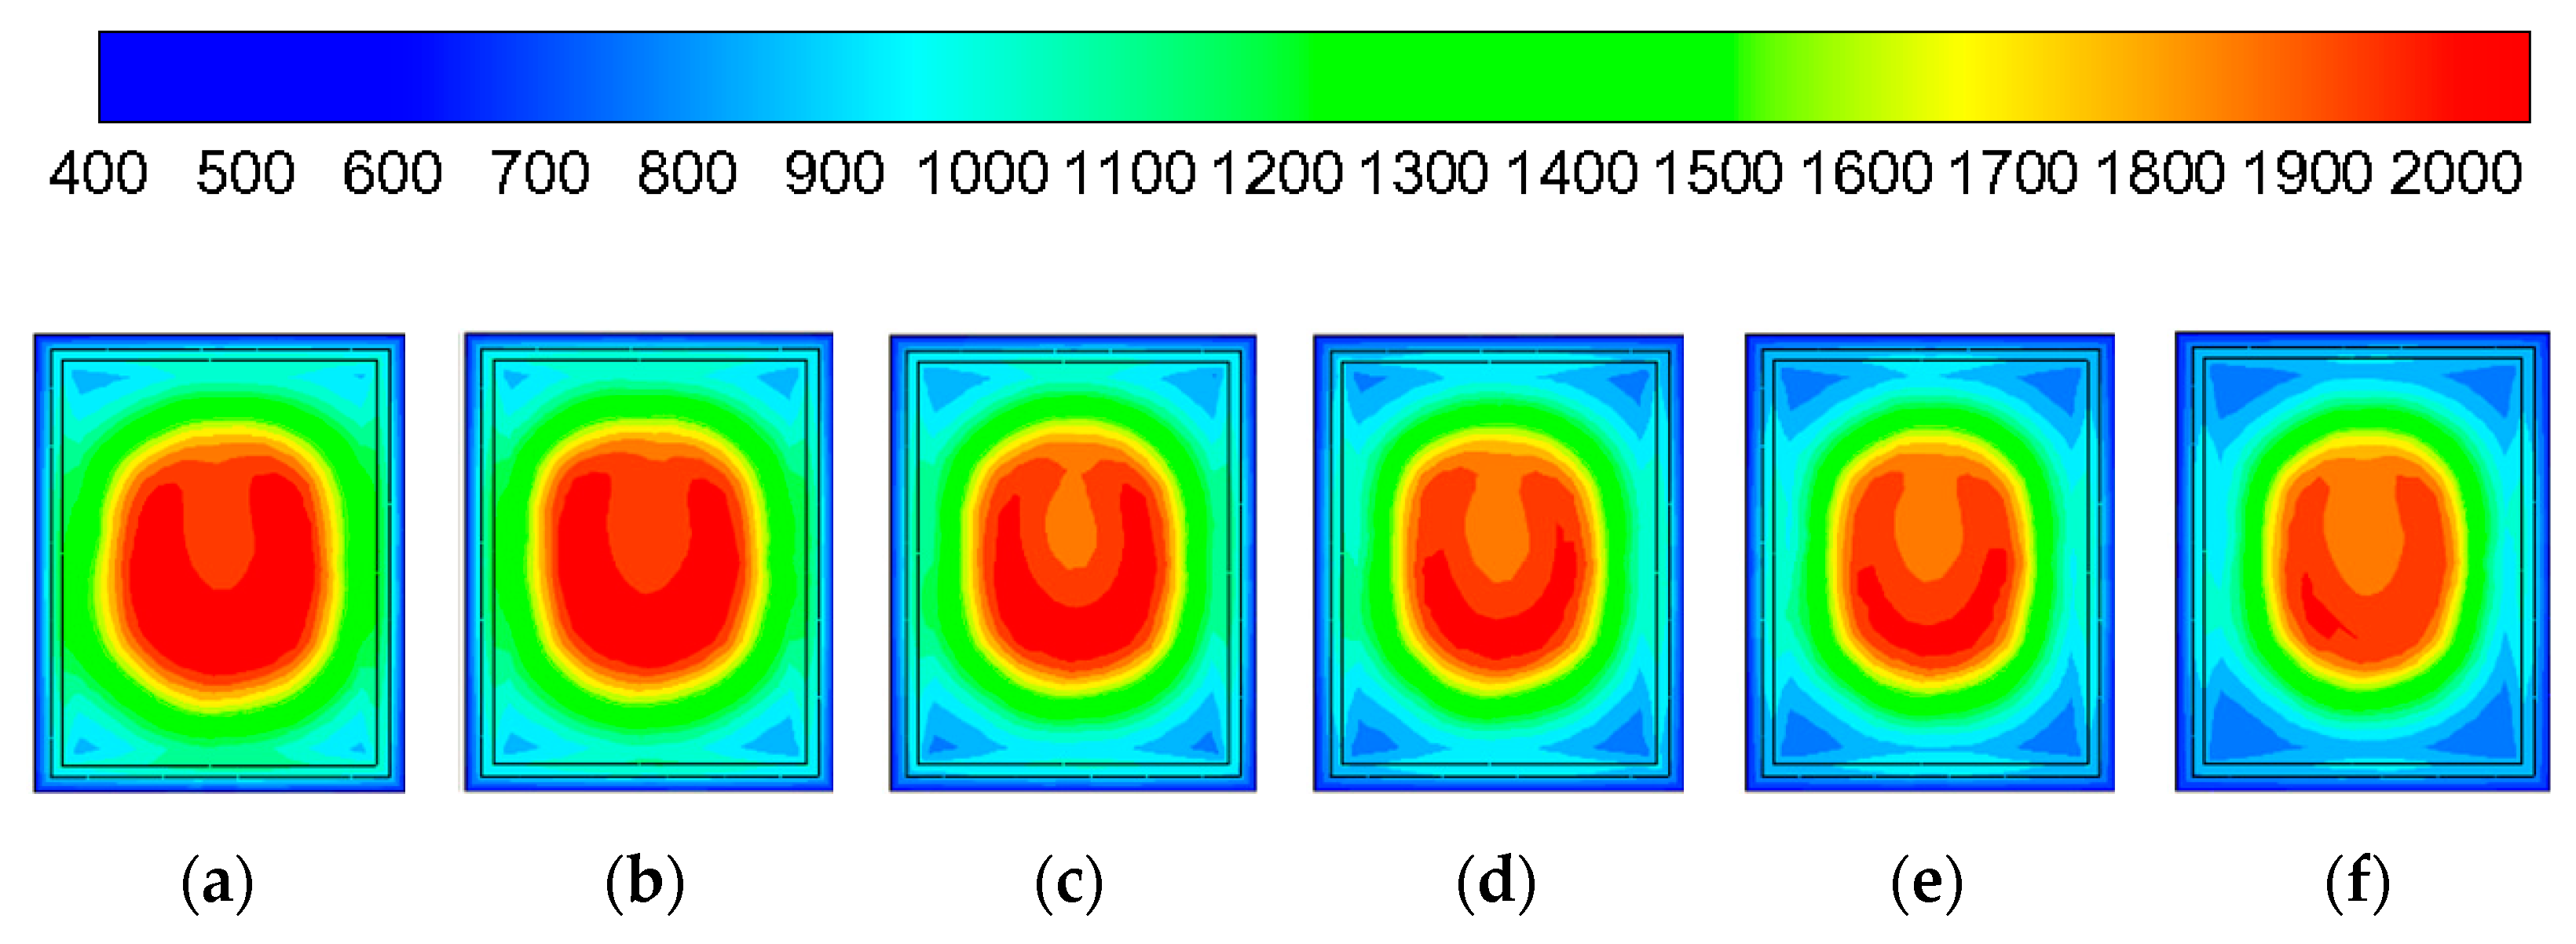
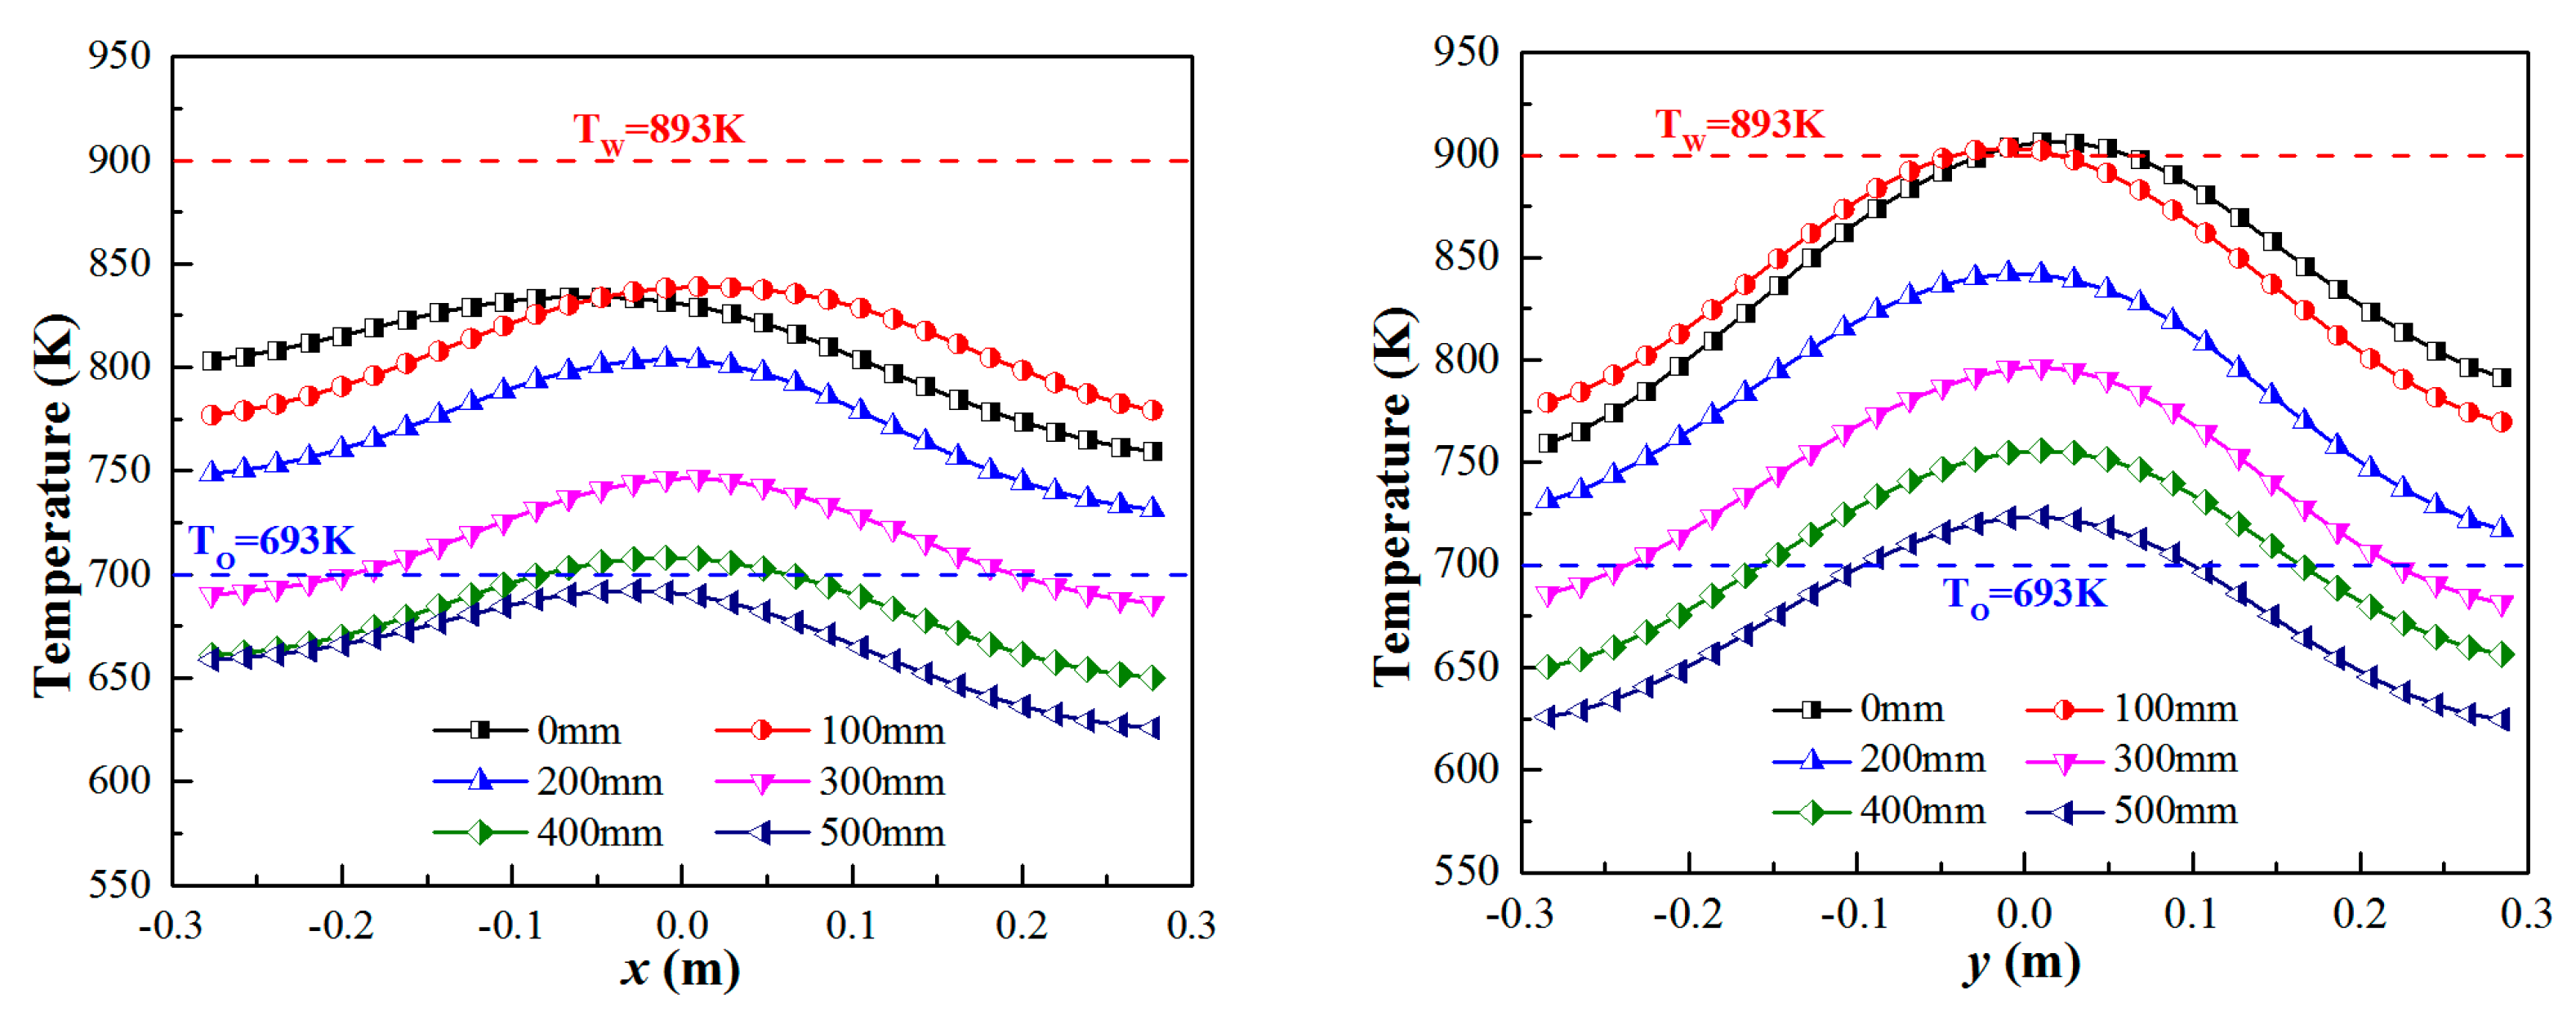
3.3. Impact of the Oil Gun Extension Distance on Ignition Performance and Wall Temperature

As shown in Figure 6, the temperature field at the burner outlet is portrayed with different oil gun extension distances, and the high-temperature region is centralized at the bottom of the outlet and is U-shaped, because of the enrichment and higher concentration of pulverized coal at the outlet bottom due to the effect of the bend centrifugation in the burner head. The combustion was more intense at the bottom, so the temperature was higher. With the increase in the oil gun extension distance, both the flame fullness and the high-temperature region evidently decreased.
The temperature distribution profile at the center cross section of the burner with different extension distances is shown in Figure 7. It can be seen that the development tendency of the flame was similar under different extension distances. Flames diffused along the direction of the primary air, and the flame diameter reached the maximum at the burner exit. However, Figure 6 and Figure 7 show that, with the increase in the extension distance, the flame expansion degree decreased, and the high-temperature region showed a shrinking tendency. This tendency was attributed to the reduction of co-combustion distance as the extension distance increased, which resulted in a reduction of the amount of pulverized coal ignited by the oil and an increased proportion of unburned volatile content. Furthermore, the heat absorbed by the char decreased as well, which led to a lower burnout rate of the char; the combustion intensity was alleviated, decreasing the wall temperature.
Figure 8 presents the temperature along the X-line and Y-line, and it can be seen that with the increase in extension distance, the overall temperature gradually decreased. Compared to the temperature at the origin oil gun position (0 mm extension distance), the temperature decrease was not obvious when extending the oil gun by 100 mm, and the temperature was even higher in a certain segment. The results showed that extending the oil gun by 100 mm had little influence on the wall temperature. Comparing the temperatures at extension distances of 400 mm and 500 mm, the overall temperature at 500 mm was lower, but the decreasing tendency was less obvious, which indicated that the effect of the extension distance on the temperature decreased when the extension distance exceeded 400 mm. The ignition performance would also degrade if the extending distance was too large, even though the wall temperature was acceptable. The wall temperature was too high for 100 mm and 200 mm extension distances, i.e., the overheating problem could not be solved. The wall temperature and temperature field of the outlet were satisfying for 300 mm and 400 mm extension distances, which can be assumed to be the preferable extension distance. However, the maximum temperatures of the two extension distances were 796 K and 700 K, respectively, that is, beyond 693 K. The oil flame directly ignited the pulverized coal passing through the high-temperature flame kernel field, and the oil feed rate determined the amount of ignited pulverized coal. When more oil was used, more pulverized coal could be ignited. Parts of pulverized coal ignited by the oil combustion heat would ignite the other pulverized coal, i.e., the energy degree gradually increased along the direction of the primary air and caused the wall overheating problem.
In addition, the temperature on the Y-line was obviously higher than that on the X-line; it is suggested that the temperature monitor points of the temperature monitor system be moved from the burner upper wall to the burner side wall in the actual operation.

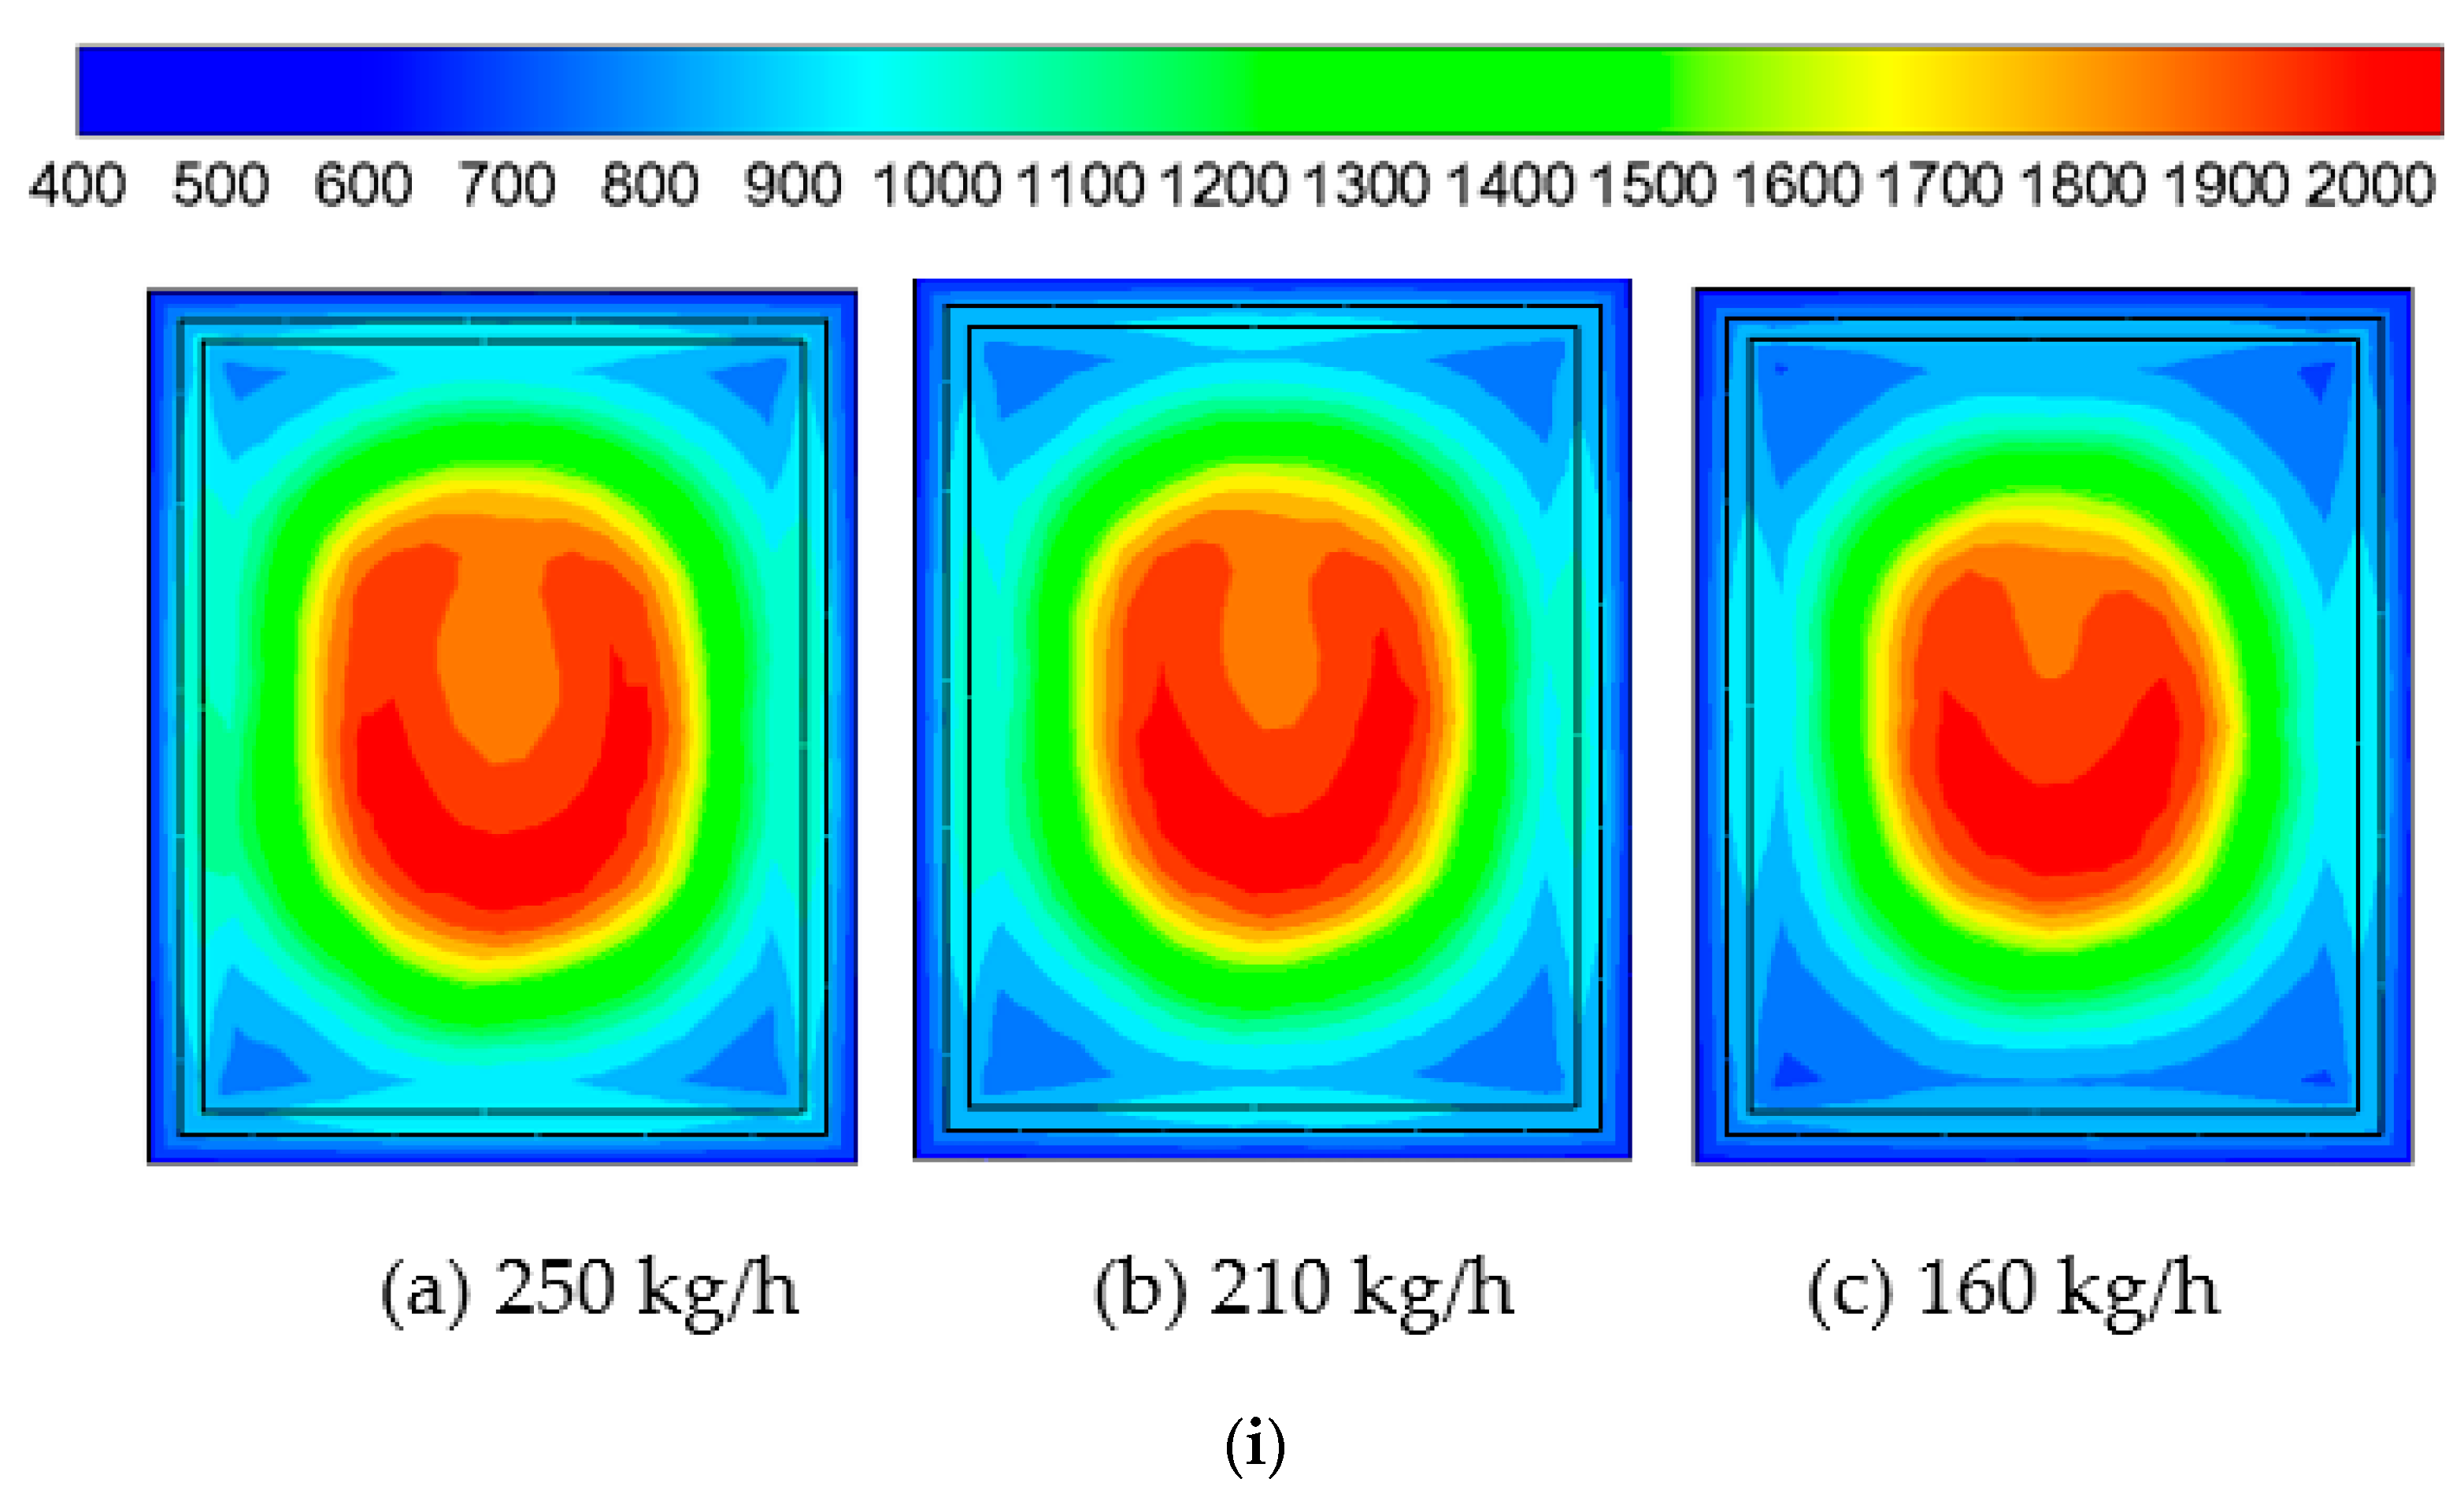
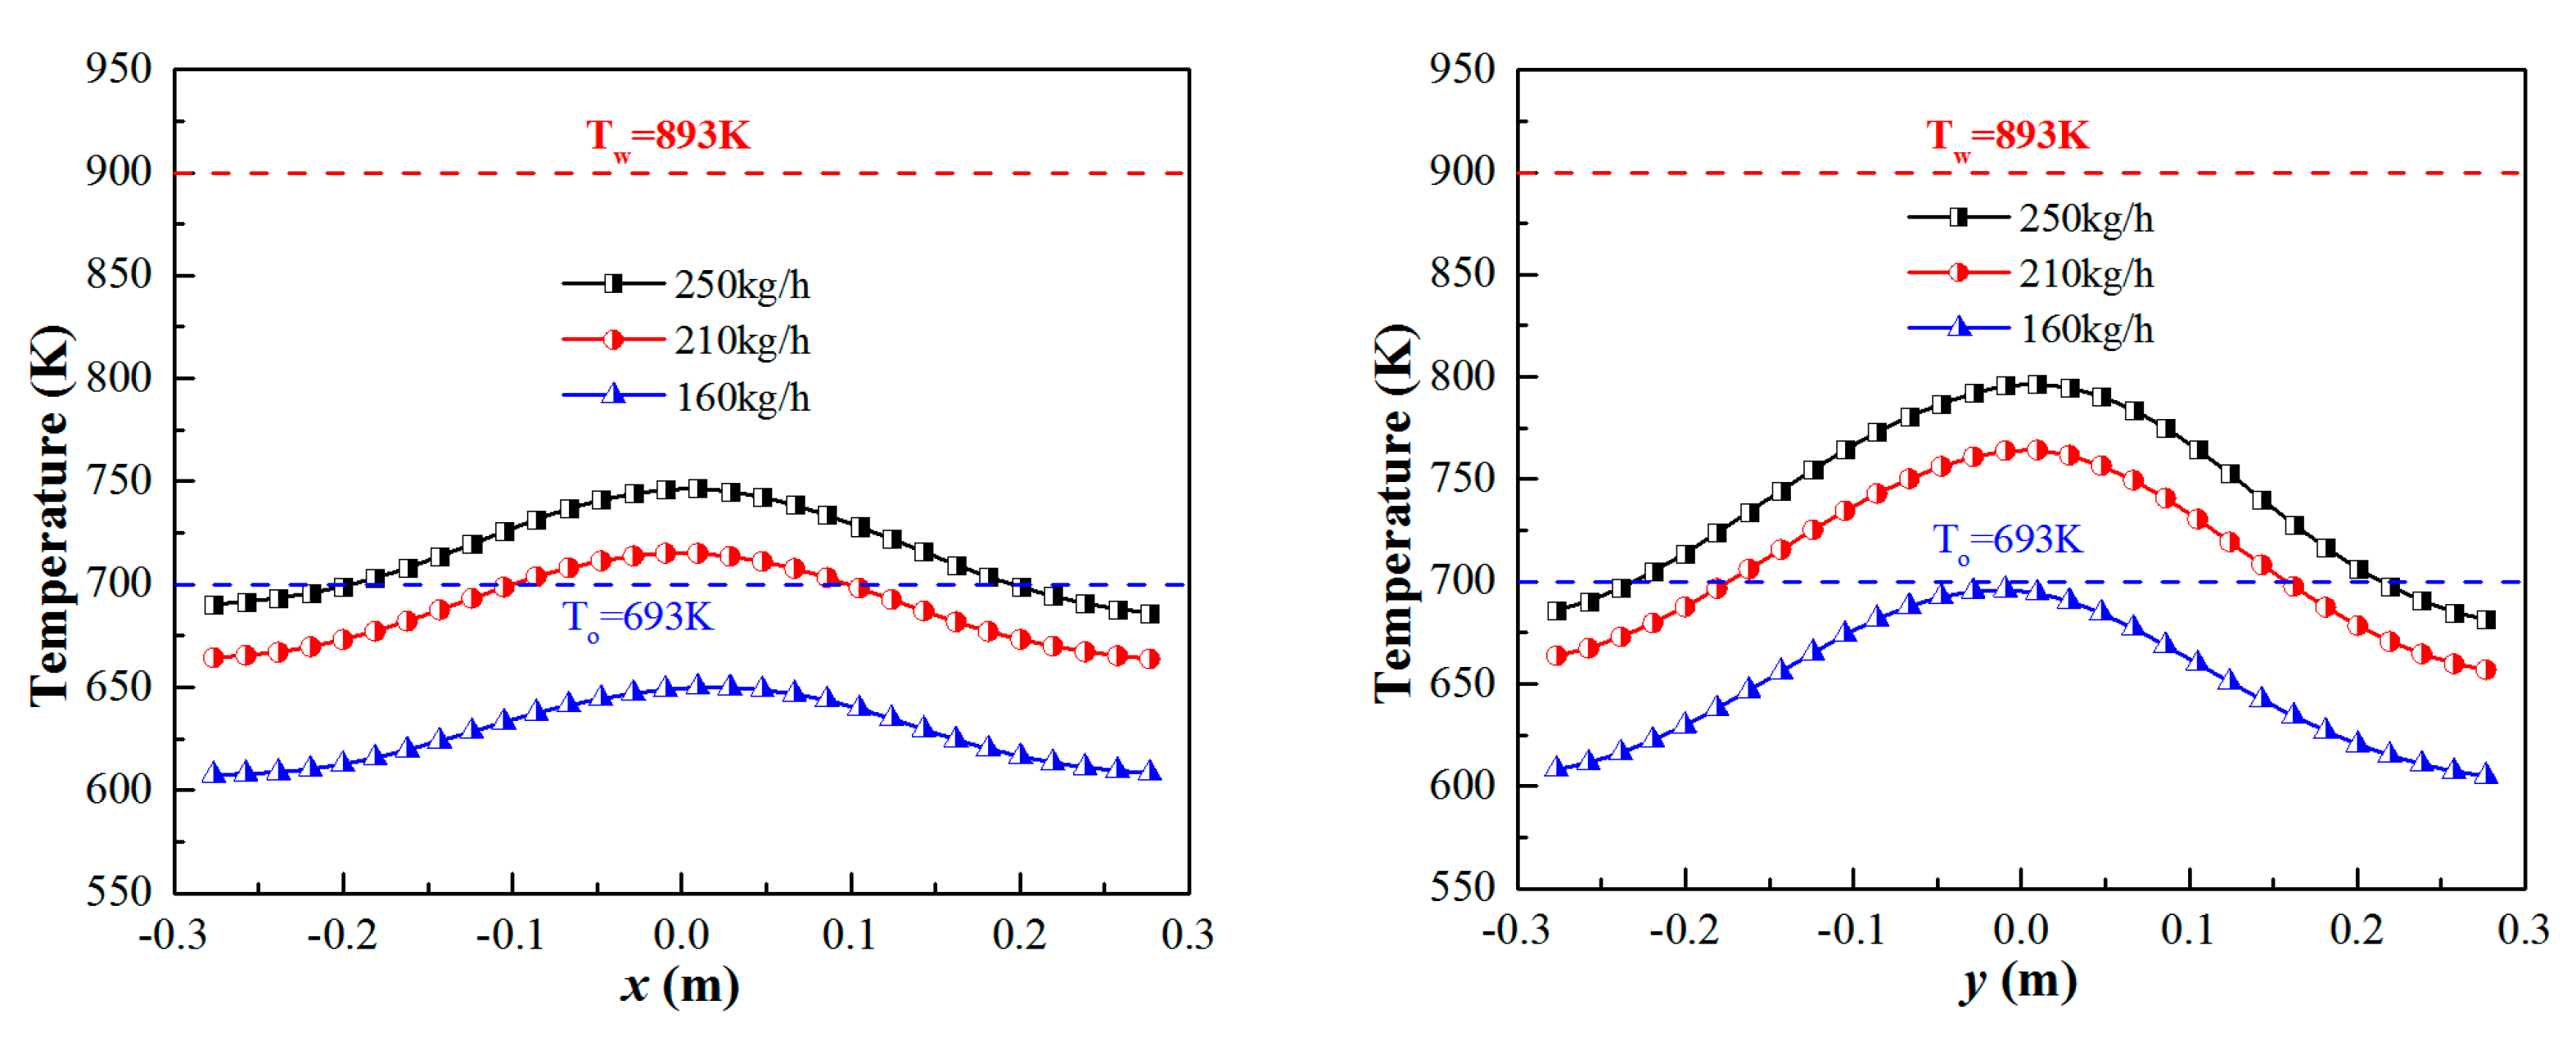
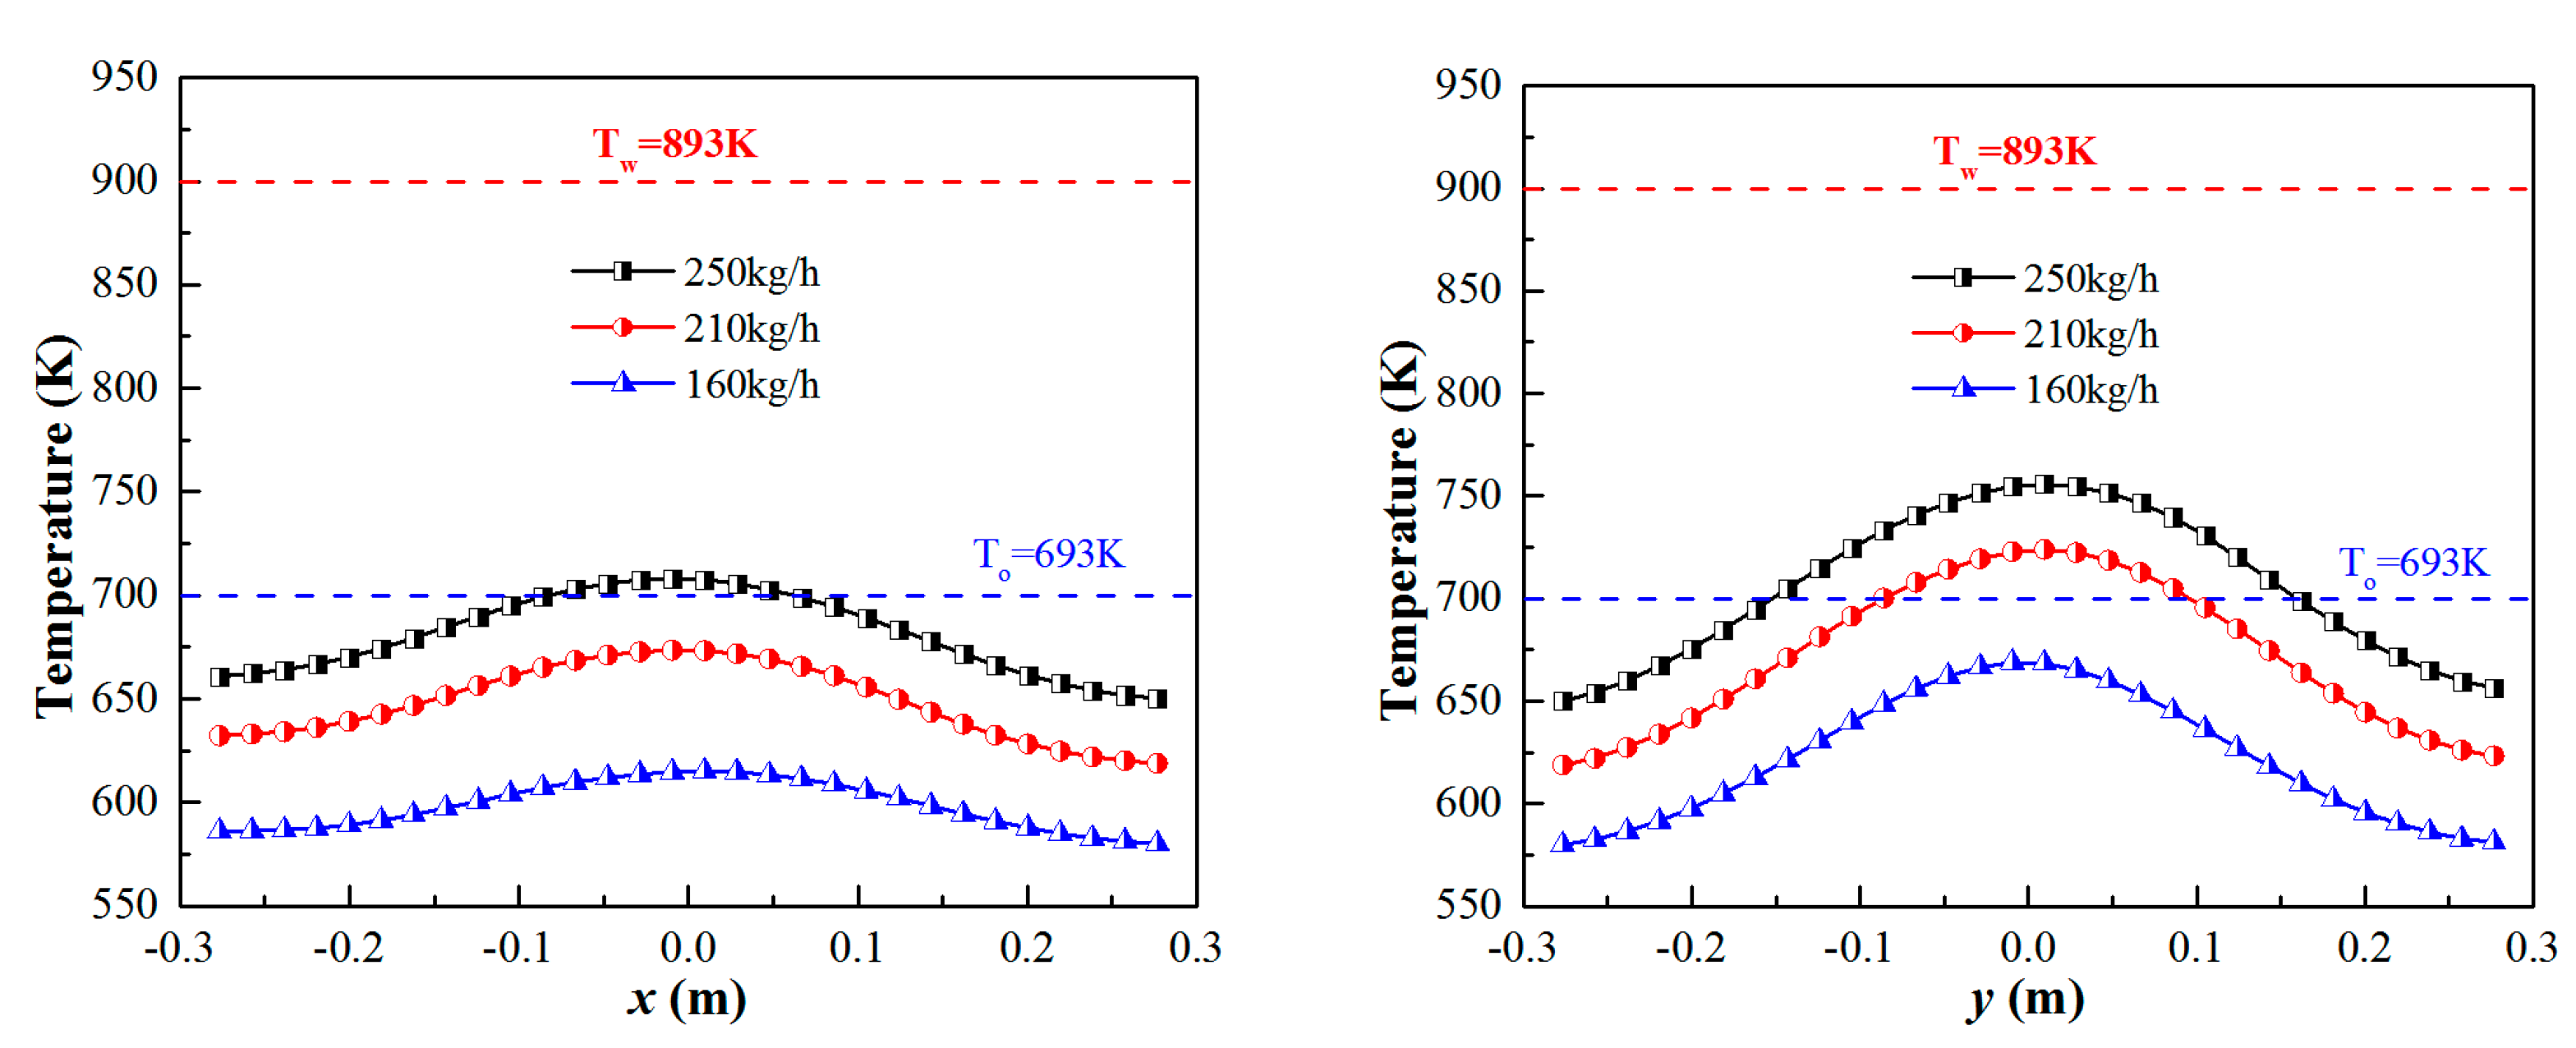
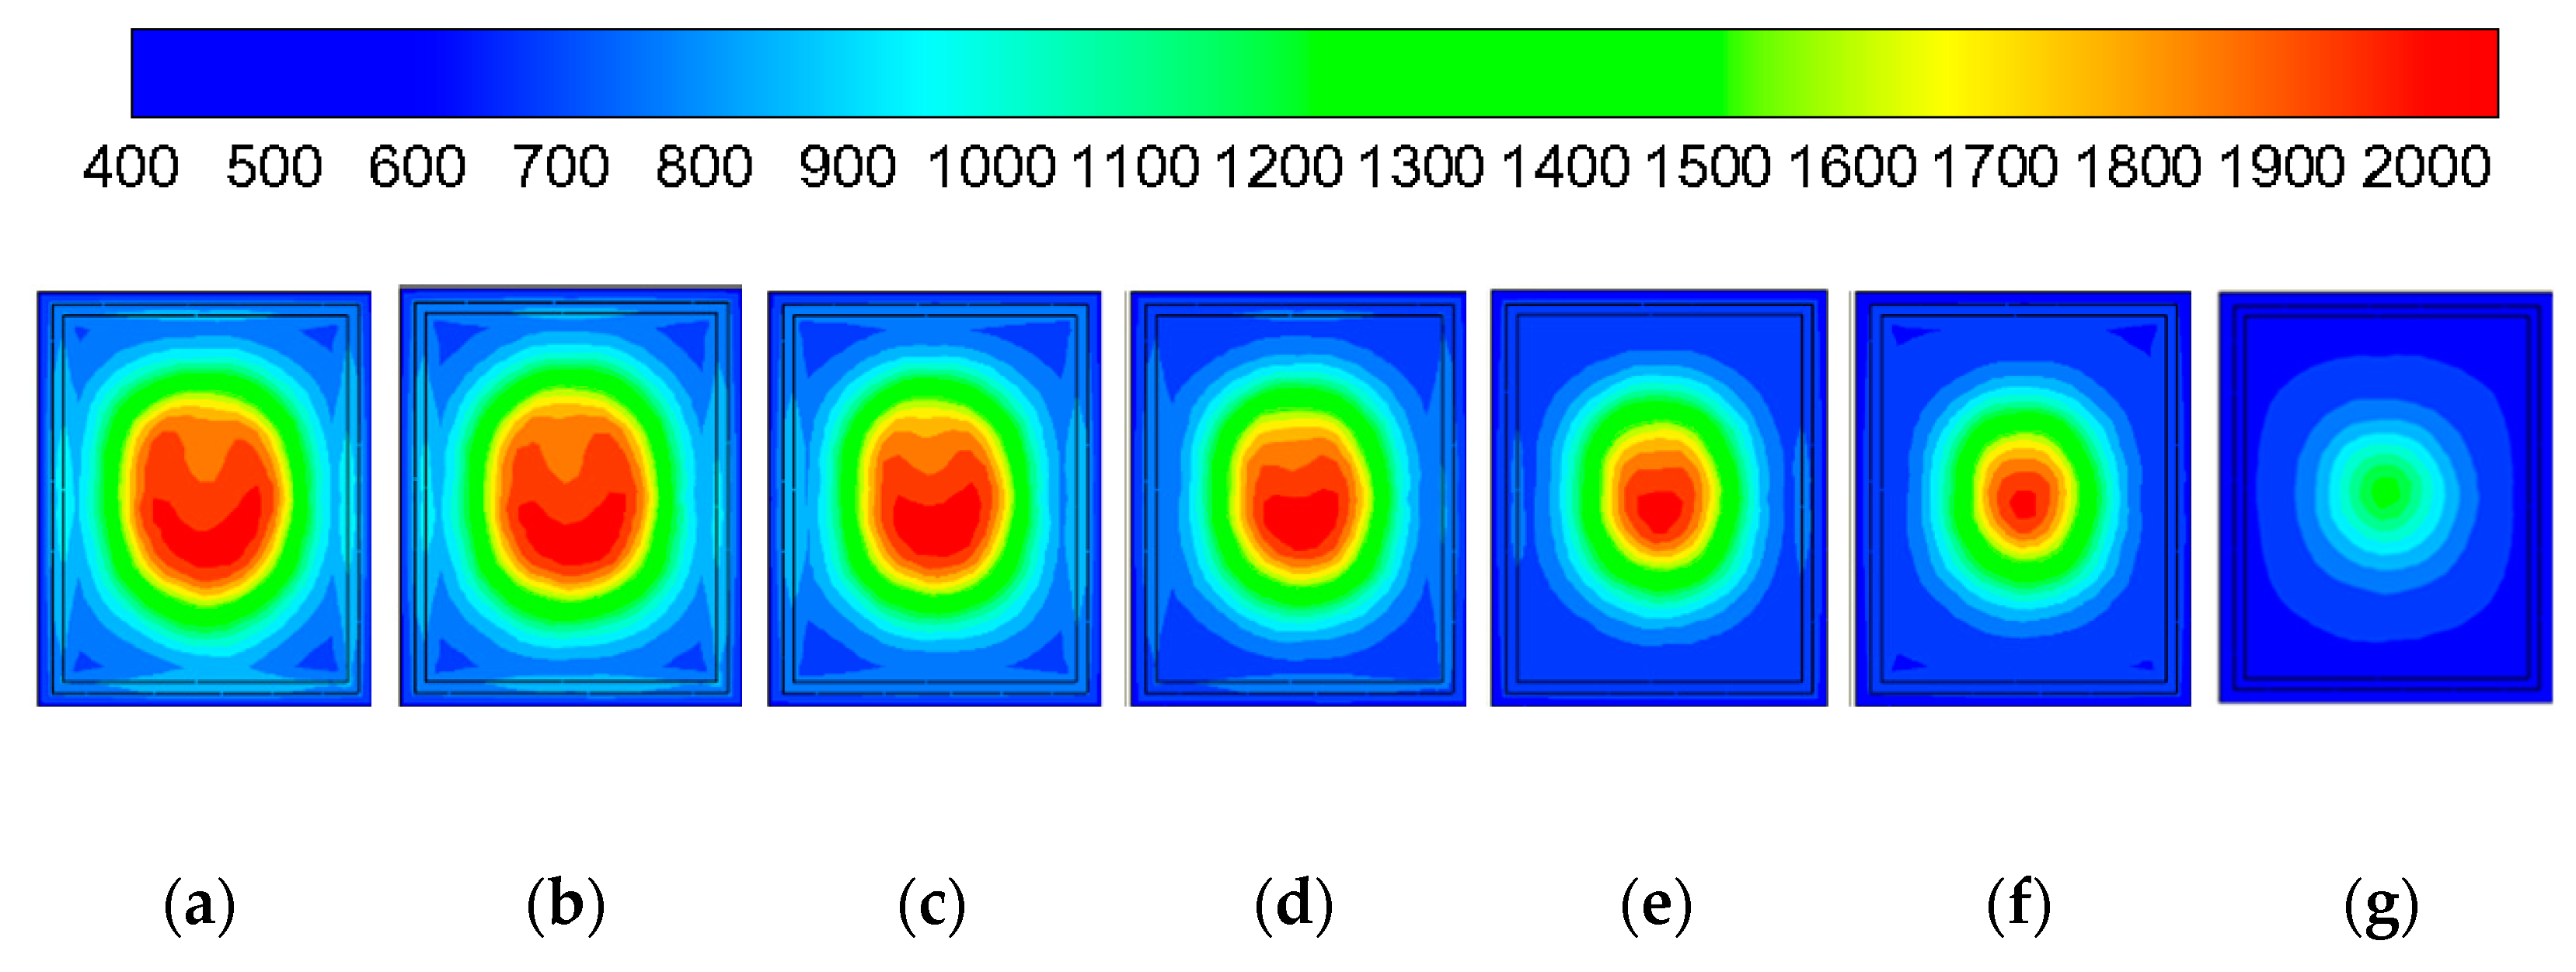
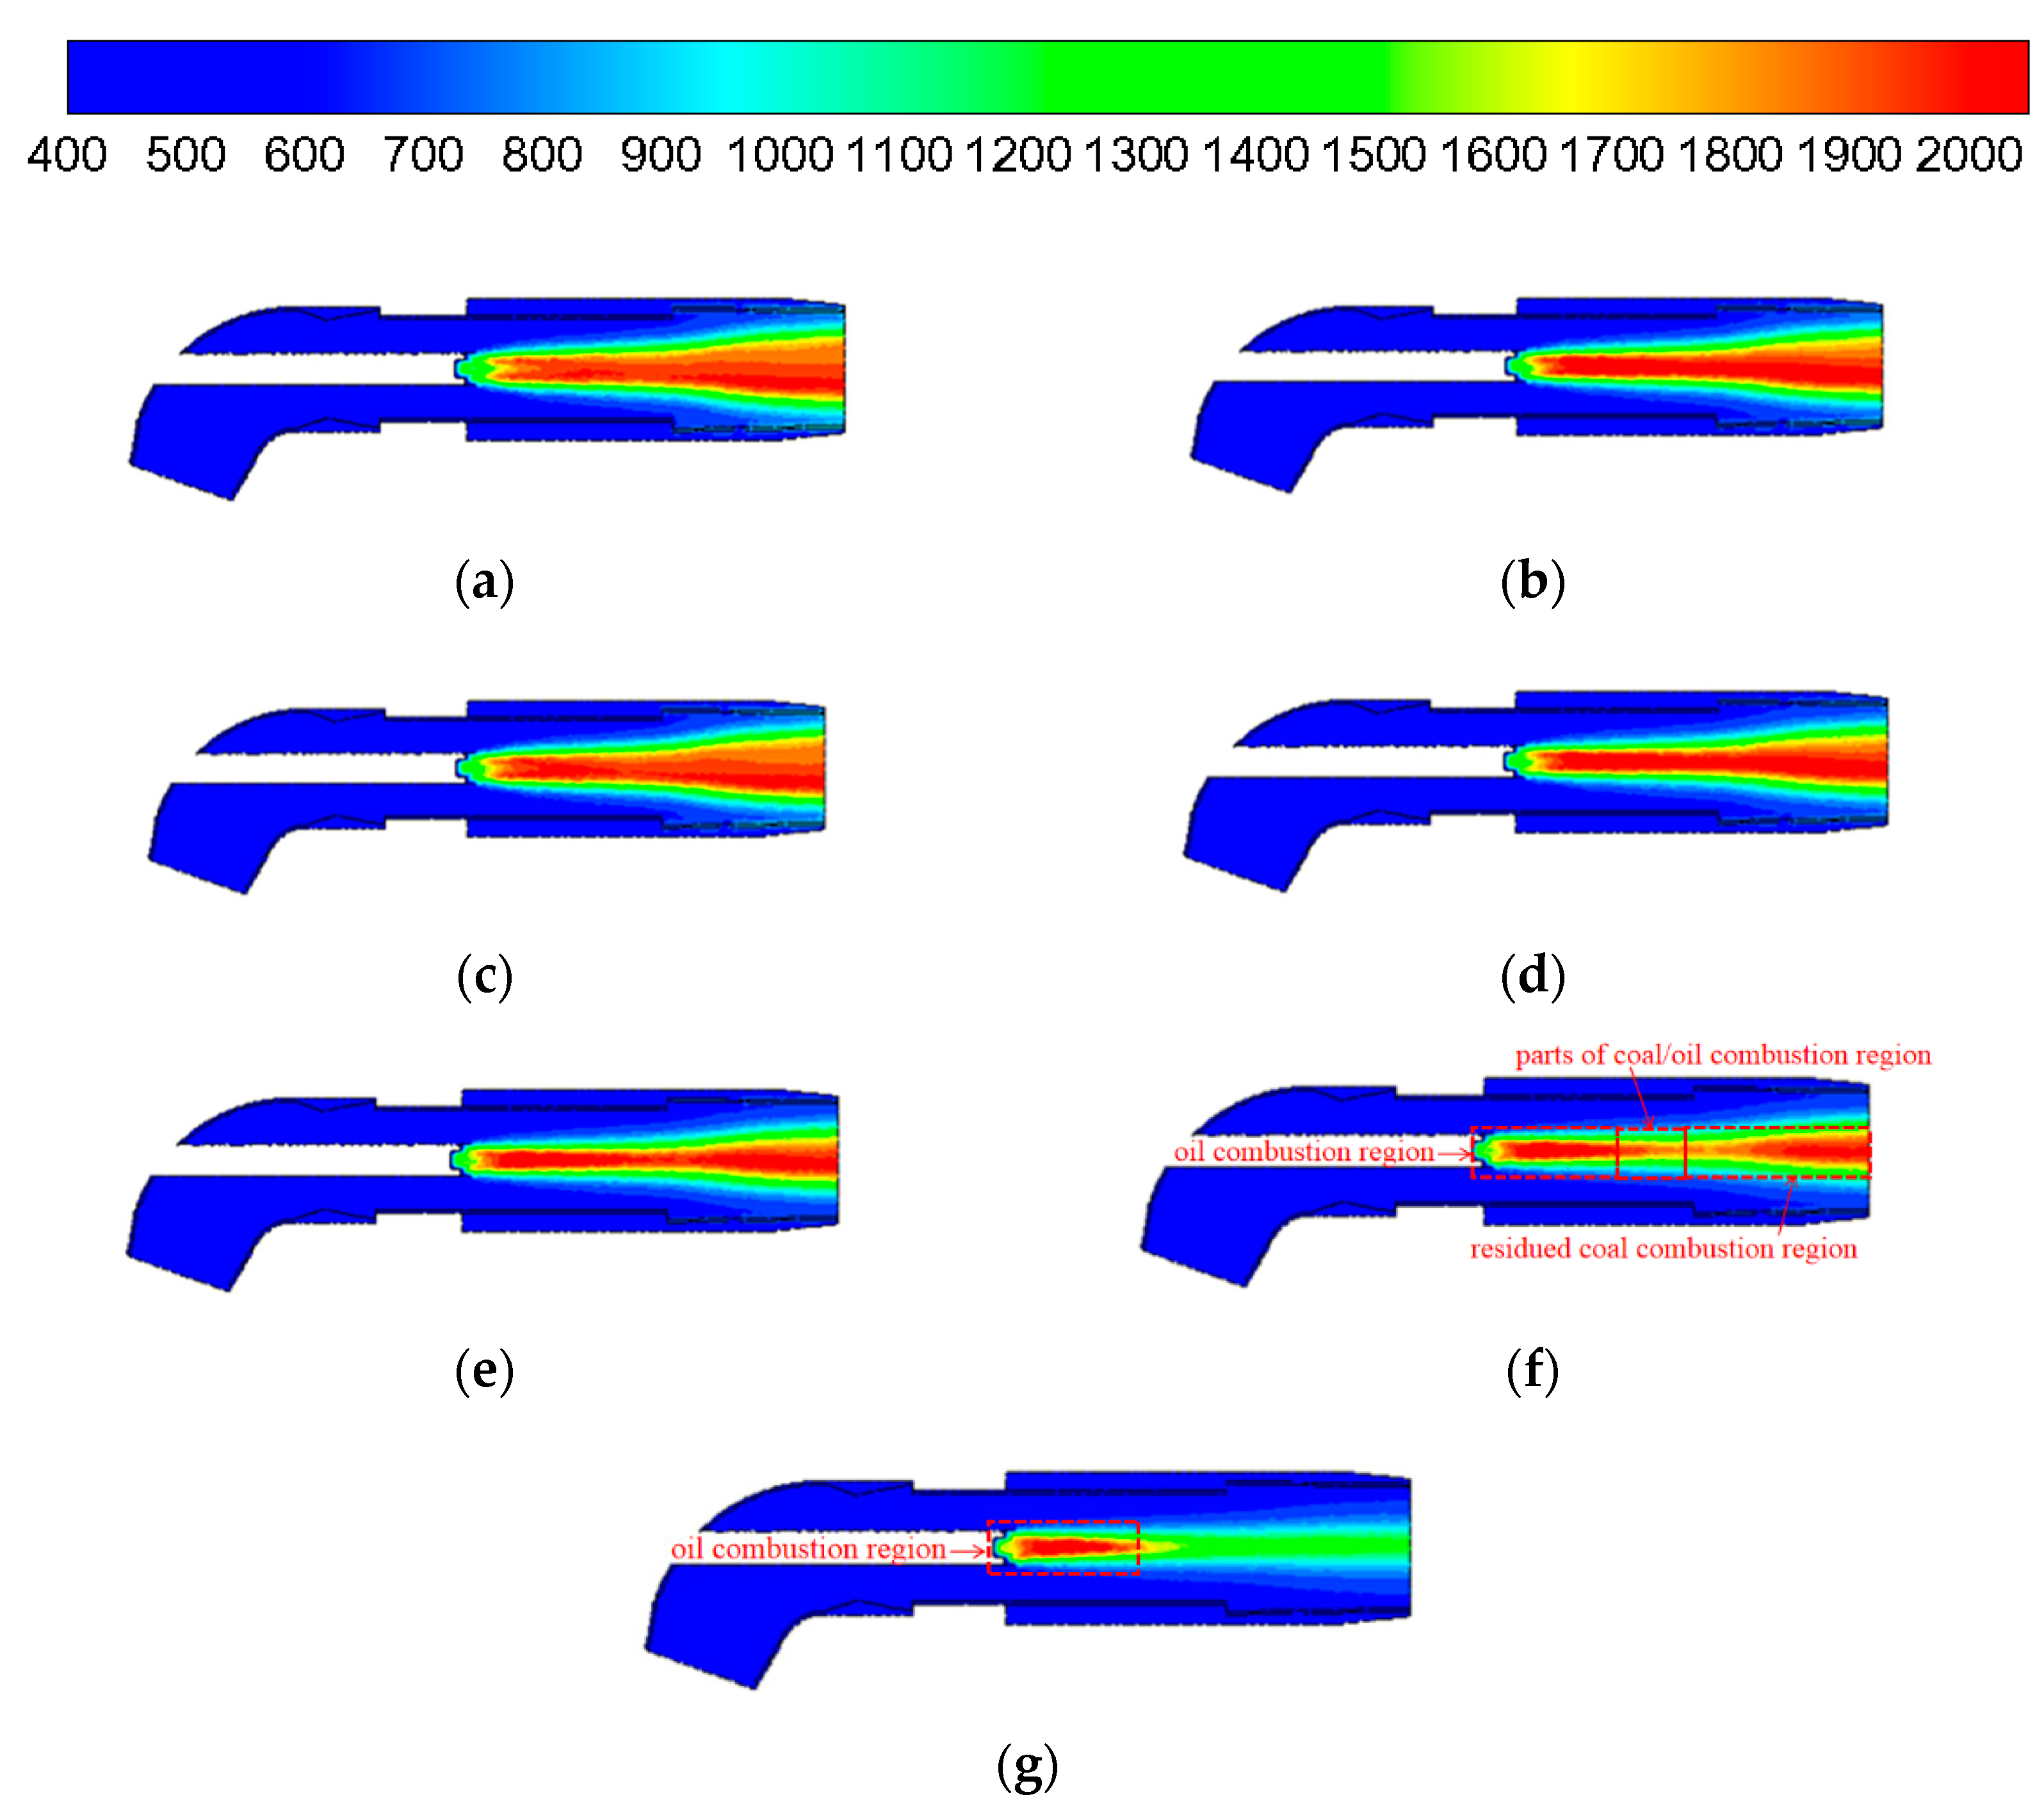
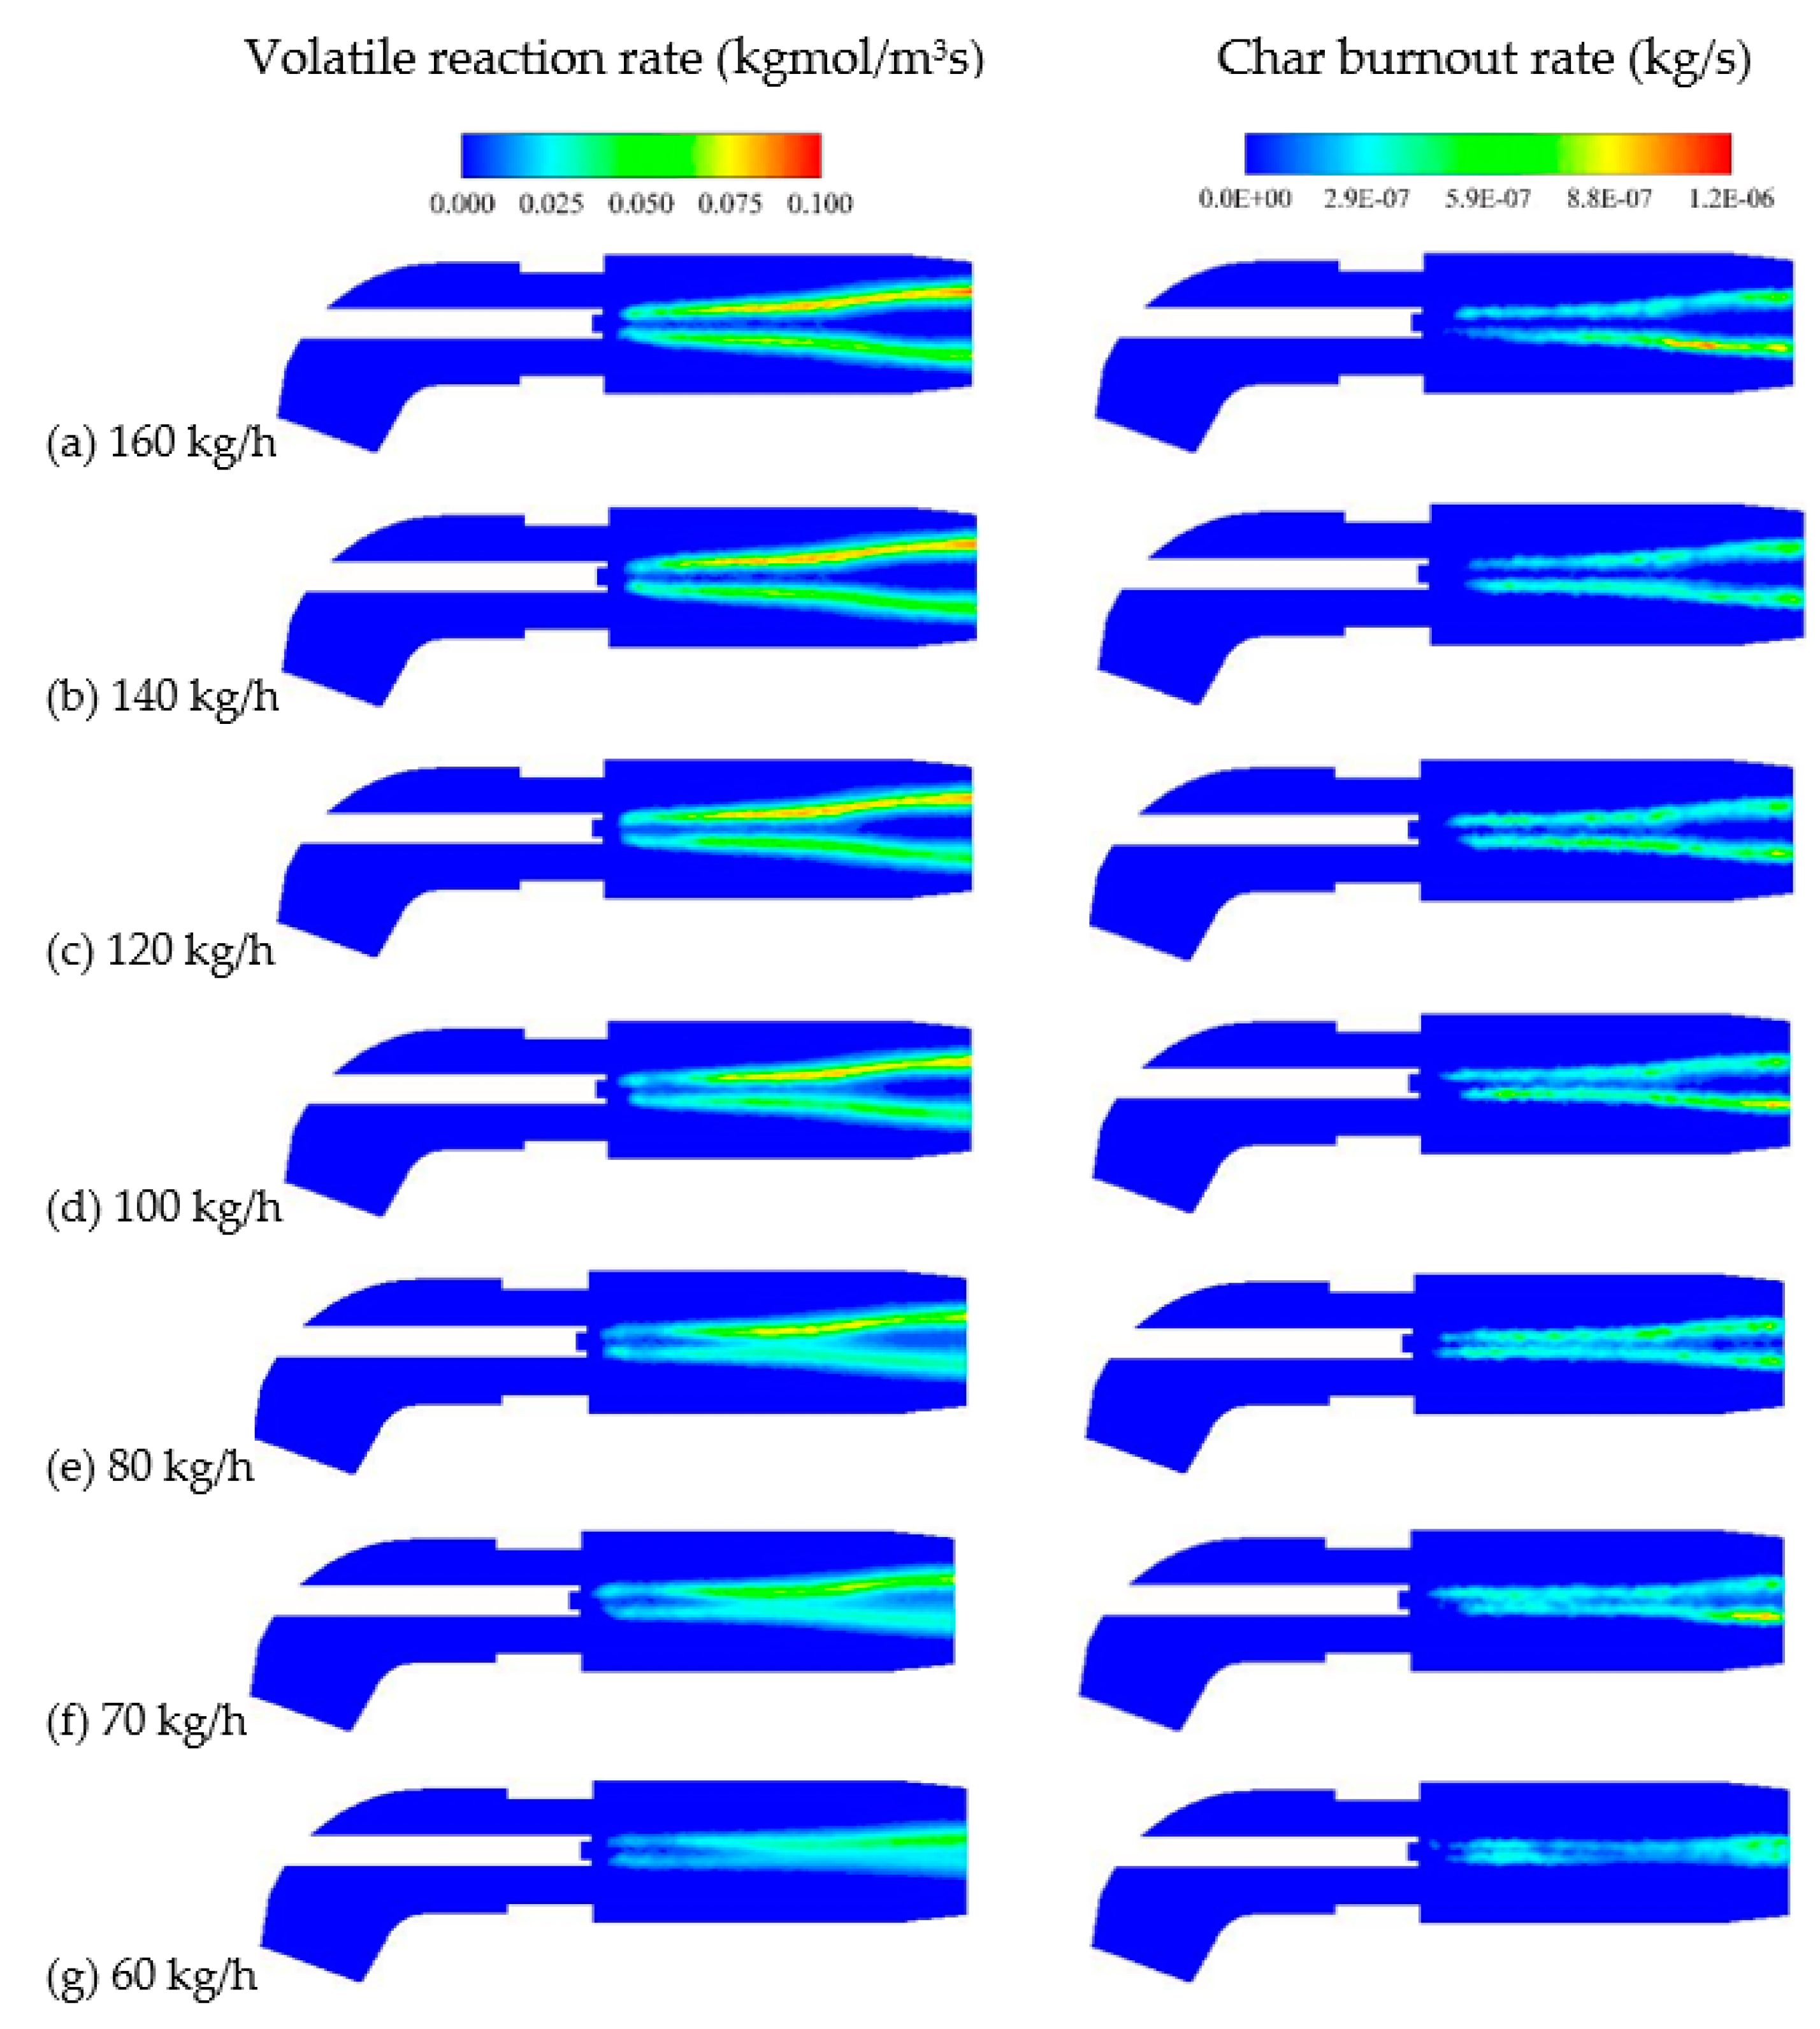
3.4. Impact of the Oil Feed Rate on Ignition Performance and Wall Temperature

Figure 9 presents the temperature distribution profile of the burner outlet with different oil feed rates at extension distances of 300 mm and 400 mm, respectively. The flame fullness decreased, and the high-temperature region decreased as the oil feed rate decreased under a certain extension distance as a result of a decrease of the heat released by the oil combustion. Furthermore, the flame fullness was lower for the 400 mm extension distance compared with the 300 mm extension distance under the same oil feed rate.
Figure 10 and Figure 11 present the temperatures along the X-line and Y-line for the 300 mm and 400 mm extension distances under different oil feed rates, respectively. It can be seen that, with the decrease of the oil feed rate, the temperatures of the X-line and Y-line manifested a declining tendency. When the extension distance was 300 mm with a 160 kg/h oil feed rate, the maximum temperatures of the X-line and Y-line were 650 K and 700 K, respectively. The maximum temperature of the Y-line exceeded 693 K, although the value of the X-line was below 693 K. When the extension distance was 400 mm with a 160 kg/h oil feed rate, the maximum temperatures of the X-line and Y-line were 620 K and 670 K, respectively, that is, both were below 693 K. The maximum temperature of the burner outlet was 2057 K for the 400 mm extension distance, and the pulverized coal was deemed to be ignited favorably at this temperature, which means the wall overheating problem was solved without influencing the ignition performance. Comprehensively considering the ignition performance and the wall temperature, the wall overheating problem could be solved, and the ignition performance was as desirable when the extension distance was 400 mm and the oil feed rate was adjusted from 250 kg/h to 160 kg/h. However, the operation oil feed was still at a relative high level with a high flame fullness at the burner outlet; therefore, the oil feed rate could still be optimized.
It can be seen from Figure 12 that the flame fullness showed a declining tendency as the oil feed rate decreased. The declining tendency of the high temperature region was unapparent when the oil feed rate was in the range of 160 to 120 kg/h, which indicated that the co-combustion of oil and coal was sufficient to maintain a high temperature region. The high-temperature region regularly shrank as the oil feed rate decreased when the oil feed rate was in the range from 100 to 70 kg/h, which indicated that the oil feed rate has a great influence on the ignition performance. The high temperature disappeared at the oil feed rate of 60 kg/h, which implies that pulverized coal can hardly be ignited.
The temperature field of the X cross section for different oil feed rates is portrayed in Figure 13, and it can be seen that outline of the flame region shrank with the increase of the oil feed rate. When the oil feed rate was adjusted to 70 kg/h, the middle part of the flame was almost disconnected; the high-temperature flame region was concentrated around the oil gun nozzle as the oil feed rate was adjusted to 60 kg/h, which means that the formation of the high-temperature region was mainly caused by the combustion of oil. The amount of coal ignited by the oil flame was scarce, so it can be concluded that coal cannot be ignited at a 60 kg/h oil feed rate.
Figure 14 shows the volatile reaction rate and char burnout rate for different oil feed rates. In all cases, the volatile matter and char were quickly ignited near the oil feeder exit. Figure 15 depicts the main parameters at the burner exit for different oil feed rates. The maximum temperature was maintained at a steady level, which was 2100 K, as the oil feed rate was adjusted from 160 to 70 kg/h; the pulverized coal could be ignited at this temperature. The maximum temperature of the burner outlet was 1200 K as the oil feed rate was adjusted to 60 kg/h, which is insufficient for the combustion of pulverized coal. It can be concluded that there was a reduction in the burnout rate of volatile and char as the oil feed rate decreased. Devolatilization and combustion of volatile matter occurred when the pulverized coal passed through the high-temperature flame core formed by the combustion of oil, and the heat released by the combustion of oil and volatile matter further promoted the combustion of char. The maximum temperature appeared at approximately 0.4 m for different oil feed rates, as the center of the oil gun nozzle was set as the zero point. The result showed that the high temperature region where the oil combustion was intense and generated a high temperature was located from 0 to 0.4 m.
Figure 16 depicts the profiles of the gas temperature obtained along the burner axis. Actually, the turbulence-flame interaction in turbulent flames accounting for the presence of a dispersed phase may affect the axial position where the maximum temperature is [37,38,39]. However, this interaction may not affect the overall temperature tendency. Therefore, the turbulence-flame interaction under different conditions is usually not considered, as in this study. The overall temperature of the axis for the 140 kg/h and 160 kg/h oil feed rates was lower than that at 80 kg/h to 120 kg/h oil feed rates. This was because the high temperature region moved up as the oil feed rate decreased; however, the lower the oil feed rate was, the lower the burner overall temperature that was comprehensively affected by these factors. The overall temperature of the axis at 140 kg/h and 160 kg/h oil feed rates was slightly lower but still at a high level. The temperature profile showed a decline before ascending in the middle section corresponding to the almost broken section of the flame in Figure 4. The results indicated that 70 kg/h was close to the ultimate limit of the oil feed rate. The temperature beyond the high temperature field continuously decreased when the oil feed rate was 60 kg/h. The results showed that the pulverized coal was not ignited under this oil feed rate, and the high temperature field was mainly concentrated in the vicinity of the oil gun nozzle.

3.5. Practical Operation Performance after Burner Modification

The oil gun location corresponding to an extension of 400 mm and the oil feed rate at 160 kg/h were successfully applied into the actual operation. The practical operation data obtained before and after burner reconstruction are listed in Figure 4; the temperature at the monitoring point was 886 K before reconstruction and 635 K after reconstruction. The wall over-temperature phenomenon disappeared, and the pulverized coal could be ignited successfully even though there was a slight decline at the maximum temperature and average temperature. Furthermore, the oil consumption decreased.

4. Conclusions

This paper built a model of a tiny oil ignition burner to simulate the combustion, gas–solid flow, and heat transfer inside it. The effect of the oil gun extension distance and oil feed rate on ignition performance and wall temperature were analyzed. The monitoring point temperatures showed reasonable agreement with the measurement results. Finally, optimal oil gun extension distance and oil feed rate were determined. The following conclusions were drawn. When increasing the oil gun extension distance, the co-combustion length of oil and coal diminished, which contributed to lower the wall temperature. Appropriately reducing the oil feed rate (above 70 kg/h) could also reduce the wall temperature without influencing the ignition performance. Considering both the ignition performance and the burner wall temperature, an extension distance of 400 mm and an oil feed rate of 70–80 kg/h appeared to be the optimal location and the theoretical minimum oil feed rate, respectively. Considering both the ignition performance and the burner wall temperature, an oil gun location extended by 400 mm and an oil feed rate at 160 kg/h were successfully used in the actual operation without adverse effects. Moreover, it is suggested that the temperature monitor points be moved from the burner upper wall to the burner side wall.

Author Contributions

Writing—original draft, Q.M.; Investigation, Q.M. and X.C.; writing—review and editing, Q.M., J.L., H.Z. and W.Z.; project administration, W.Z. All authors have read and agreed to the published version of the manuscript.

Funding

This research was funded by the National Key R&D Program of China (No. 2017YFB0601805).

Institutional Review Board Statement

Not applicable.

Informed Consent Statement

Not applicable.

Data Availability Statement

Data is contained within the article.

Conflicts of Interest

The authors declare no conflict of interest.

References

  1. Yang, H.; Lu, J.; Zhang, H.; Yue, G.; Guo, Y. Coal ignition characteristics in CFB boiler. Fuel 2005, 84, 1849–1853. [Google Scholar] [CrossRef]
  2. Liu, P.; Gao, J.; Zhang, H.; Zhang, D.; Wu, Y.; Zhang, M.; Lu, J. Performance of the primary air concentrators on anthracite ignition and combustion in a 600 MW supercritical arch-fired boiler. Fuel Process. Technol. 2017, 158, 172–179. [Google Scholar] [CrossRef]
  3. Liu, C.; Li, Z.; Zhao, Y.; Chen, Z. Influence of coal-feed rates on bituminous coal ignition in a full-scale tiny-oil ignition burner. Fuel 2010, 89, 1690–1694. [Google Scholar] [CrossRef]
  4. Li, Z.; Liu, C.; Zhao, Y. Influence of the coal feed rate on lean coal ignition in a full-scale tiny-oil ignition burner. Energy Fuels 2010, 24, 375–378. [Google Scholar] [CrossRef]
  5. Zhou, H.; Mo, G.; Si, D.; Cen, K. Experimental study on the aerodynamic and separating characteristics of a novel tiny-oil ignition cyclone burner. Asia-Pac. J. Chem. Eng. 2012, 7, 624–632. [Google Scholar] [CrossRef]
  6. Askarova, A.S.; Karpenko, E.I.; Lavrishcheva, Y.I.; Messerle, V.E.; Ustimenko, A.B. Plasma-supported coal combustion in boiler furnace. IEEE Trans. Plasma Sci. 2007, 35, 1607–1616. [Google Scholar] [CrossRef]
  7. Gorokhovski, M.A.; Jankoski, Z.; Lockwood, F.C.; Karpenko, E.I.; Messerle, V.E.; Ustimenko, A.B. Enhancement of pulverized coal combustion by plasma technology. Combust. Sci. Technol. 2007, 179, 2065–2090. [Google Scholar] [CrossRef]
  8. Messerle, V.E.; Karpenko, E.I.; Ustimenko, A.B.; Lavrichshev, O.A. Plasma preparation of coal to combustion in power boilers. Fuel Process. Technol. 2013, 107, 93–98. [Google Scholar] [CrossRef]
  9. Sugimoto, M.; Maruta, K.; Takeda, K.; Solonenko, O.P.; Sakashita, M.; Nakamura, M. Stabilization of pulverized coa1 combustion by plasma assist. Thin Solid Film. 2002, 407, 186–191. [Google Scholar] [CrossRef]
  10. Messerle, V.E.; Karpenko, E.I.; Ustimenko, A.B. Plasma assisted power coal combustion in the furnace of utility boiler: Numerical modeling and full-scale test. Fuel 2014, 126, 294–300. [Google Scholar] [CrossRef]
  11. Lee, D.H.; Kim, K.T.; Kang, H.S.; Song, Y.H.; Park, J.E. Plasma-assisted combustion technology for NOx reduction in industrial burners. Environ. Sci. Technol. 2013, 47, 10964–10970. [Google Scholar] [CrossRef] [PubMed]
  12. Li, Z.; Liu, C.; Zhu, Q. Experimental studies on the effect of the pulverized coal concentration on lean-coal combustion in a lateral-ignition tiny-oil burner. Energy Fuels 2010, 24, 4161–4165. [Google Scholar] [CrossRef]
  13. Srdjan, B.; Miroslav, S.; Predrag, S. A numerical study of pulverized coal ignition by means of plasma torches in air-coal dust mixture ducts of utility boiler furnaces. Int. J. Heat Mass Transf. 2008, 51, 1970–1978. [Google Scholar]
  14. Liu, C.; Li, Z.; Jing, X.; Zong, Q.; Zhang, X.; Chen, Z.; Zhu, Q. Investigations on lean coal combustion for different primary air velocities in a lateral-ignition tiny-oil burner. J. Energy Eng. 2013, 139, 316–321. [Google Scholar] [CrossRef]
  15. Xu, D.; Fang, F.; Zhou, H.; Wang, H.; Min, H.; Yan, X. Experimental investigation on ignition of low-volatile pulverized coal in a tiny-oil burner in oxygen-enriched conditions. Adv. Mater. Res. 2012, 608–609, 1257–1261. [Google Scholar] [CrossRef]
  16. Liu, C.; Zhu, Q.; Li, Z.; Zong, Q.; Zhang, X.; Chen, Z. Influence of different oil feed rate on bituminous coal ignition in a full-scale tiny-oil ignition burner. Front. Energy 2013, 7, 406–412. [Google Scholar] [CrossRef]
  17. Zhou, H.; Mo, G.; Yang, Y.; Si, B.; Cen, K. Numerical investigation of gas-solid two-phase flow in a tiny-oil ignition cyclone burner for a 300-mw down-fired pulverized coal-fired boiler. J. Energy Eng. 2014, 140, 1–10. [Google Scholar] [CrossRef]
  18. Li, Z.; Liu, C.; Zhang, X.; Zeng, L.; Chen, Z. Numerical simulation of bituminous coal combustion in a full scale tiny-oil ignition burner: Influence of excess air ratio. Front. Energy 2012, 6, 296–303. [Google Scholar] [CrossRef]
  19. Launder, B.E.; Spalding, D.B. Lectures in Mathematical Models of Turbulence; Academic Press: Cambridge, MA, USA, 1972. [Google Scholar]
  20. Launder, B.E.; Spalding, D.B. The numerical computation of turbulent flows. Comput. Method. Appl. M 1974, 12, 269–289. [Google Scholar] [CrossRef]
  21. Klasona, T.; Baia, X.S.; Bahadorb, M.; Nilssonb, T.K.; Sundénb, B. Investigation of radiative heat transfer in fixed bed biomass furnaces. Fuel 2008, 187, 2141–2153. [Google Scholar] [CrossRef]
  22. Habibi, A.; Merci, B.; Heynderickxc, G.J. Impact of radiation models in CFD simulations of steam cracking furnaces. Comput. Chem. Eng. 2007, 31, 1389–1406. [Google Scholar] [CrossRef]
  23. Hottel, H.C.; Sarofim, A.F. Radiative Transfer; McGraw-Hill: New York, NY, USA, 1967. [Google Scholar]
  24. Hottel, H.C.; Sarofim, A.F. Radiative Transfer; McGraw-Hill Book Company: New York, NY, USA, 1969. [Google Scholar]
  25. Smith, T.F.; Shen, Z.F.; Friedman, J.N. Evaluation of coefficients for the weighted sum of gray gases model. J. Heat Transf. 1982, 104, 602–608. [Google Scholar] [CrossRef]
  26. Kobayashi, H.; Howward, J.B.; Sarofilm, A.F. Coal devolatilization at high temperatures. Symp. Int. Combust. 1977, 16, 411–425. [Google Scholar] [CrossRef]
  27. Ma, L.; Fang, Q.; Lv, D.; Zhang, C.; Chen, Y.; Chen, G.; Duan, X.; Wang, X. Reducing NOx emissions for a 600 MWe down-fired pulverized-coal utility boiler by applying a novel combustion system. Environ. Sci. Technol. 2015, 49, 13040–13049. [Google Scholar] [CrossRef]
  28. Hamon, M.; Gozlan, H. Predicting the combustion behavior of coal particles. Combust. Sci. Technol. 1971, 3, 231–243. [Google Scholar]
  29. Fried, M.A. Rate of combustion of size-grated fractions of char from a low rank coal between 1200 K and 2000 K. Combust. Flame 1969, 13, 237–252. [Google Scholar]
  30. Tian, D.; Zhong, L.; Tan, P.; Ma, L.; Fang, Q.; Zhang, C.; Zhang, D.; Chen, G. Influence of vertical burner tilt angle on the gas temperature deviation in a 700 MW low NOx tangentially fired pulverised-coal boiler. Fuel Process. Technol. 2015, 138, 616–628. [Google Scholar] [CrossRef]
  31. Fang, Q.; Musa, A.A.B.; Wei, Y.; Luo, Z.; Zhou, H. Numerical simulation of multi-fuel combustion in a 200 MWe tangentially fired utility boiler. Energy Fuels 2012, 26, 313–323. [Google Scholar] [CrossRef]
  32. Ma, L.; Fang, Q.; Tan, P.; Zhang, C.; Chen, G.; Lv, D.; Duan, X.; Chen, Y. Effect of the separated overfire air location on the combustion optimization and NOx reduction of a 600MWe FW down-fired utility boiler with a novel combustion system. Appl. Energy 2016, 180, 104–115. [Google Scholar] [CrossRef]
  33. Magnussen, B.F.; Hjertager, B.H. On mathematical modeling of turbulent combustion with special emphasis on soot formation and combustion. Symp. Combust. 1977, 16, 719–729. [Google Scholar] [CrossRef]
  34. Holmgren, D. Review of thermal conductivity of cast iron. Int. J. Cast Met. Res. 2005, 18, 331–345. [Google Scholar] [CrossRef]
  35. Sun, M.; Takayama, K. Conservative smoothing on an adaptive quadrilateral grid. J. Comput. Phys. 1999, 150, 143–180. [Google Scholar] [CrossRef]
  36. Kallinderis, Y. A finite volume navier-stokes algorithm for adaptive grids. Int. J. Numer. Methods Fluids 1992, 15, 193–217. [Google Scholar] [CrossRef]
  37. Sacomano-Filho, F.L.; Fukumasu, N.K.; Krieger, G.C. Numerical simulation of an ethanol turbulent spray flame with RANS and diffusion combustion model. J. Braz. Soc. Mech. Sci. Eng. 2013, 35, 189–198. [Google Scholar] [CrossRef]
  38. Sacomano Filho, F.L.; Hosseinzadeh, A.; Sadiki, A.; Janicka, J. On the interaction between turbulence and ethanol spray combustion using a dynamic wrinkling model coupled with tabulated chemistry. Combust. Flame 2020, 215, 203–220. [Google Scholar] [CrossRef]
  39. Sacomano Filho, F.L.; Dressler, L.; Hosseinzadeh, A.; Sadiki, A.; Krieger Filho, G.C. Investigations of evaporative cooling and turbulence flame interaction modeling in ethanol turbulent spray combustion using tabulated chemistry. Fluids 2019, 4, 187. [Google Scholar] [CrossRef] [Green Version]
Figure 1. Tiny oil ignition burner structure. (a) Schematic diagram of the burner’s components, (b) burner’s geometry, (c) 3D model for numerical simulation.
Energies 14 07597 g001aEnergies 14 07597 g001b
Figure 2. Thermal conductivity and specific heat of cast iron as a function of temperature.
Energies 14 07597 g002
Figure 3. Grid independence test along the axis. (a) Velocities, (b) gas temperature.
Energies 14 07597 g003
Figure 4. Simulation validation.
Energies 14 07597 g004
Figure 5. Temperature (K), Velocity field (m/s), O2, CO2, H2O (-), and light diesel oil mole fraction (-) of the burner before modification at the longitudinal cross section (XZ central cross section). (a) temperature (K), (b) velocity field (m/s), (c) O2 concentration field (mole fraction), (d) CO2 concentration field (mole fraction), (e) H2O concentration field (mole fraction), (f) light diesel oil concentration field (mole fraction).
Energies 14 07597 g005
Figure 6. Temperature field of the burner exit (XY cross section) under different extension distances (K). (a) 0 mm, (b) 100 mm, (c) 200 mm, (d) 300 mm, (e) 400 mm, (f) 500 mm.
Energies 14 07597 g006
Figure 7. Temperature field (K) of the longitudinal cross section (XZ central cross section) with different extension distance. (a) 0 mm, (b) 100 mm, (c) 200 mm, (d) 300 mm, (e) 400 mm, (f) 500 mm.
Energies 14 07597 g007
Figure 8. Temperature profile of the line with different extension distances (the lines are defined as shown in Figure 1).
Energies 14 07597 g008
Figure 9. Temperature field of the burner exit (XY cross section) for different oil feed rates when the extension distance was 300 mm and 400 mm. (i) Extension distance of 300 mm (K), (ii) extension distance of 400 mm (K).
Energies 14 07597 g009aEnergies 14 07597 g009b
Figure 10. Temperature along the x line and y line when the extension distance was 300 mm.
Energies 14 07597 g010
Figure 11. Temperature along the x line and y line when the extension distance was 400 mm.
Energies 14 07597 g011
Figure 12. Temperature field of the burner exit (XY cross section) for different oil feed rates when the extension distance was 400 mm (K). (a) 160 kg/h, (b) 140 kg/h, (c) 120 kg/h, (d) 100 kg/h, (e) 80 kg/h, (f) 70 kg/h, (g) 60 kg/h.
Energies 14 07597 g012
Figure 13. Temperature field at the longitudinal cross section (XZ central cross section) for different oil feed rates when the extension distance was 400 mm (K). (a) 160 kg/h, (b) 140 kg/h, (c) 120 kg/h, (d) 100 kg/h, (e) 80 kg/h, (f) 70 kg/h, (g) 60 kg/h.
Energies 14 07597 g013
Figure 14. Volatile reaction rate and char burnout rate at the longitudinal cross section (XZ central cross section) under different oil feed rates. (a) 160 kg/h, (b) 140 kg/h, (c) 120 kg/h, (d) 100 kg/h, (e) 80 kg/h, (f) 70 kg/h, (g) 60 kg/h.
Energies 14 07597 g014
Figure 15. Main parameters at the burner exit for different oil feed rates.
Energies 14 07597 g015
Figure 16. Temperature profile along the burner axis for different oil feed rates.
Energies 14 07597 g016
Table 1. Reaction kinetic parameters [30].
Reaction k i = A i e x p ( E i R T )
AiEi
Char combustion0.0043 kg/m2sPa8.37 × 107 J/kmol
Devolatilization reaction 13.75 × 10⁵ s−17.366 × 10⁷ J/kmol
Devolatilization reaction 21.46 × 10¹³ s−12.511 × 10⁸ J/kmol
Table 2. Proximate and ultimate analyses of the coal sample.
Proximate Analysis (wt %, Air-Dried)Ultimate Analysis (wt %, Air-Dried)Qar.net (kJ/kg)
Volatile MatterMoistureashFixed CarbonCHOSN
37.0015.0022.6625.3454.492.849.100.440.4620,650
Table 3. Ultimate analyses of light diesel.
Ultimate Analyses (wt %)Lower Heating Value (kJ/kg)
CH
83.3316.6742,700
Table 4. Simulation cases.
ItemOil Gun Extension Distance (mm)Oil Feed Rate (kg/h)
case 10250
case 2100250
case 3200250
case 4300250
case 5300210
case 6300160
case 7400250
case 8400210
case 9400160
case 10400140
case 11400120
case 12400100
case 1340080
case 1440070
case 16500250
Publisher’s Note: MDPI stays neutral with regard to jurisdictional claims in published maps and institutional affiliations.

