Article

The Effect of Hydraulic Fracture Geometry on Well Productivity in Shale Oil Plays with High Pore Pressure

by
Daniela A. Arias Ortiz
1,
Lukasz Klimkowski
1,2,
Thomas Finkbeiner
1 and
Tadeusz W. Patzek
1,*
1
The Ali I. Al-Naimi Petroleum Engineering Research Center, King Abdullah University of Science and Technology, Thuwal 23955-6900, Saudi Arabia
2
Faculty of Drilling, Oil and Gas, AGH University of Science and Technology, 30-059 Krakow, Poland
*
Author to whom correspondence should be addressed.
Energies 2021, 14(22), 7727; https://doi.org/10.3390/en14227727
Submission received: 20 September 2021 / Revised: 23 October 2021 / Accepted: 25 October 2021 / Published: 18 November 2021
(This article belongs to the Special Issue Development of Unconventional Reservoirs 2021)

Abstract

:
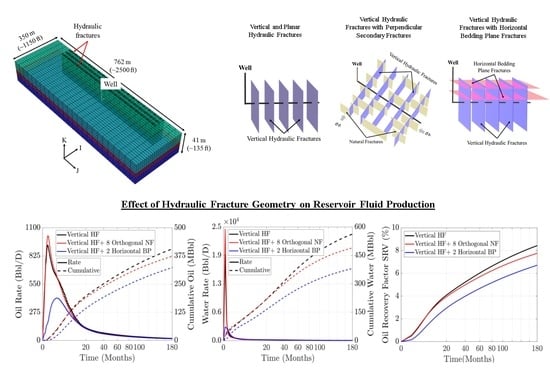
We propose three idealized hydraulic fracture geometries (“fracture scenarios”) likely to occur in shale oil reservoirs characterized by high pore pressure and low differential in situ stresses. We integrate these geometries into a commercial reservoir simulator (CMG-IMEX) and examine their effect on reservoir fluids production. Our first, reference fracture scenario includes only vertical, planar hydraulic fractures. The second scenario has stimulated vertical natural fractures oriented perpendicularly to the vertical hydraulic fractures. The third fracture scenario has stimulated horizontal bedding planes intersecting the vertical hydraulic fractures. This last scenario may occur in mudrock plays characterized by high pore pressure and transitional strike-slip to reverse faulting stress regimes. We demonstrate that the vertical and planar fractures are an oversimplification of the hydraulic fracture geometry in anisotropic shale plays. They fail to represent the stimulated volume geometric complexity in the reservoir simulations and may confuse hydrocarbon production forecast. We also show that stimulating mechanically weak bedding planes harms hydrocarbon production, while stimulated natural fractures may enhance initial production. Our findings reveal that stimulated horizontal bedding planes might decrease the cumulative hydrocarbon production by as much as 20%, and the initial hydrocarbon production by about 50% compared with the reference scenario. We present unique reservoir simulations that enable practical assessment of the impact of varied hydraulic fracture configurations on hydrocarbon production and highlight the importance of constraining present-day in situ stress state and pore pressure conditions to obtain a realistic hydrocarbon production forecast.

Graphical Abstract

1. Introduction

Development of the ultra-low permeability reservoirs, such as oil, condensate and dry gas mudrock (“shale”) plays, has provided additional hydrocarbon resources to meet the world’s growing demand for energy [1]. The development of these reservoirs relies on a combination of multi-stage completions and hydraulic stimulation along horizontal wells that are typically one to two miles long. Stimulation processes generate dominant propped induced fractures with permeability several orders of magnitude higher than the rock matrix, which enables and accelerates hydrocarbon production [2].
In hydraulic fracturing design, typical hydraulic fracture geometry is assumed to be elliptical, vertical with symmetrical bi-wings, and a propagation direction perpendicular to the least principal stress (S3) assumed to be the minimum principal horizontal stress (Shmin) [3,4]. However, a growing body of evidence suggests that hydraulic fracture geometries are often far more complex [5,6,7,8]. For example, interactions between induced hydraulic fractures and natural discontinuities, such as natural fractures and bedding planes, alter the dominant fracture geometry [9,10,11,12,13]. Geological and tectonic factors such as pre-existing natural fracture networks and present-day in situ stresses (orientation and magnitudes) determine a hydraulic fracture system’s actual geometry. Hydraulic fracture complexity is likely to increase in shale reservoirs with high pore pressure and small differential stress [14]. In these environments, pumping pressures are high, and net pressures are small, making it easier to induce hydraulic fractures and stimulate pre-existing natural discontinuities. This markedly impacts initial production rates and ultimate recovery factors.
Several researchers developed experimental, theoretical, and numerical models to study the factors that influence a hydraulic fracture’s geometric complexity in shale plays. Blanton [9,15] investigated the interaction between hydraulic fracture and pre-existing discontinuities (e.g., natural fractures). He identified horizontal differential stress and interaction angle as the most critical factors that control whether induced hydraulic fractures cross or divert from a pre-existing natural fracture. Other researchers validated this finding years later through tri-axial laboratory experiments [16,17,18,19]. These experiments also highlighted that pre-existing discontinuities could arrest hydraulic fracture propagation. Other studies also revealed that operational parameters such as fracturing fluid viscosity, pump rate, and treating pressure are governing parameters for directing hydraulic fracture propagation and final geometry [16,20,21,22,23].
Numerical simulation is a practical method used to study hydraulic fracture geometry in shale plays. The development of 3D fracture propagation models enabled several researchers to study the interplay between natural fractures, bedding planes, and hydraulic fracture propagation [24,25,26]. These models capture the primary physical mechanisms that govern complexity of hydraulic fracture systems.
Microseismic studies and field pilots have uncovered evidence of hydraulic fracture geometries that appear to deviate appreciably from an idealized geometry and include horizontal fracture components [27,28,29,30]. Such fracture geometries result in production volumes, and rates below customary forecasts [31]. Numerous studies have investigated various hydraulic fracture geometries, but only a few integrate these geometries into reservoir simulations. The integrated hydraulic fracture geometries are often non-planar dominant fractures with varied dipping angle, length, and aperture [32,33,34]. Furthermore, simulation studies include fractures appearing to have the “tree-like” and orthogonal geometries [6,7,35,36,37]. Such fracture networks are interpreted to result from the interactions among hydraulic fractures and pre-existing natural fractures. The presence and influence of the horizontal, mechanically weak bedding planes have not been discussed yet in these numerical simulation studies. Olorode et al. [32,35] discussed generation of horizontal fractures and assessed their effect on well productivity. They have concluded that reservoir fluid production increases as the surface area of induced fractures increases, but their study does not address the fracture closure mechanism. The studies have demonstrated that complex hydraulic fracture systems are still challenging to model and integrate into reservoir simulation analyses. Consequently, many studies lack an understanding of how these complexities impact production rates and ultimate recovery.
In this study, we conduct a parametric investigation that combines pre-existing natural fracture networks with hydraulic fracture systems. Specifically, we investigate three idealized but viable stimulation geometries (henceforth called “fracture scenarios”) that combine hydraulic and pre-existing natural fracture systems as well as mechanically weak horizontal bedding planes reported to exist in shale plays. We examine their effects on wellbore flow performance using a commercial reservoir simulator (CMG-IMEX). We consider the first fracture scenario the reference case since it includes only vertical hydraulically induced fractures. In the second fracture scenario, we add stimulated vertical natural fractures (“secondary fractures”) perpendicular to the hydraulic fractures. The third fracture scenario includes stimulated horizontal bedding plane fractures that intersect the vertical hydraulically induced fractures. This last scenario may occur in shale plays characterized by severe overpressure and small differential stresses or by transitional strike-slip to reverse faulting stress regimes in which the least principal stress (S3) is very close to the overburden (Sv). Such conditions are reported to exist, for example, in the Marcellus shale in southern West Virginia [27], and the Tuwaiq Mountain formation in the Jafurah Basin in Saudi Arabia [38,39]. The unique reservoir simulations discussed here enable us to understand the impact of varied hydraulic fracture and stimulated natural fracture geometries and bedding planes on hydrocarbon production. Furthermore, our work emphasizes the influence of constraining present-day in situ stress state (orientation and magnitudes) and pore pressure conditions on hydrocarbon production forecasting.

2. Materials and Methods

2.1. Numerical Simulation Model Description

Using a commercial black oil simulator (CMG-IMEX), we set up a shale reservoir model with two-phase flow of oil and water. The model dimension is 350 m (∼1150 ft) in the I-direction, 762 m (∼2500 ft) in the J-direction, and 41 m (∼135 ft) in the K-direction (Figure 1). The model comprises three horizons with the target zone in the middle. The horizontal wellbore is located in the center of the target horizon and is 2000 m (∼6600 ft) long.
We apply the dual-permeability (DK) method to model the shale play matrix and the natural fracture system. This method is standard and widely accepted to simulate unconventional shale plays [40]. The natural fracture system only exists within the stimulated reservoir volume and represents critically stressed natural fractures reactivated during hydraulic fracturing due to the increased pore pressure and associated local stress state perturbation [41]. Furthermore, we model hydraulically induced fractures (including horizontal bedding planes) with a locally spaced-logarithmically refined-dual permeability approach (LS-LR-DK) [40]. This approach is based on the DK model, which assumes an orthogonal natural fracture system with uniform fracture spacing. In our simulation model, natural fractures are spaced every 9 m (∼30 ft) in both the I- and J-directions, and their common height is equal to the reservoir thickness (i.e., 41 m or ∼135 ft). Furthermore, the stimulated reservoir volume (SRV) consists of vertical hydraulic fractures with similar properties. These fractures are distributed uniformly along the horizontal wellbore. This model generates a symmetrical reservoir with identical hydraulic fracture stages. Thus, we can simulate a single stage of the hydraulic fracturing process to limit computational time. In total, our model has 22 stages (Figure 2), and we multiply correspondingly the volume of reservoir fluids produced from a single stage by the number of stages [42,43]. The contribution of the exterior flow to the stimulated reservoir volume is minimal because we only consider the reactivation of natural fractures near the stimulated hydraulic fractures, and the matrix has ultra-low permeability [41]. Based on the reported massive stimulation jobs performed in mudrock plays worldwide [44,45,46,47,48,49], we estimate a total fracturing fluid volume injected into the rock of 12,700 m3 (∼80,000 bbls) distributed evenly among the 22 stages. We consider the same fracturing fluid volume for all fracture scenarios and predetermine the stimulated volume’s geometry based on each scenario. Then, the total fracturing fluid volume injected into the rock comprises the stimulated fracture volume and the leak-off volume.

2.2. Reservoir and Fluid Properties

The modeled formation is undersaturated during the studied production time. Thus, the bubble point pressure is below the reservoir pressure. The shale reservoirs in the U.S. and Saudi Arabia report pore pressure gradients between 0.014 MPa/m and 0.020 MPa/m (∼0.6 psi/ft–0.9 psi/ft) [38,44,46]. Thus, our study considers an overpressured reservoir with a reservoir fluid pressure gradient of 0.0195 MPa/m (∼0.85 psi/ft). The gas-oil and water-oil contacts are assumed to be outside the reservoir interval. The matrix compressibility is 1.0 × 10⁻⁹ Pa−1 (6.9 × 10⁻⁶ psi-1) [50,51,52]. Table 1 and Table 2 summarize the shale formation and reservoir fluid properties. In Table 2, the natural fracture properties describe the critically stressed fractures. These fractures form a well-connected network that contributes to fluid flow but has low storage capacity.

2.3. Relative Permeability Curves

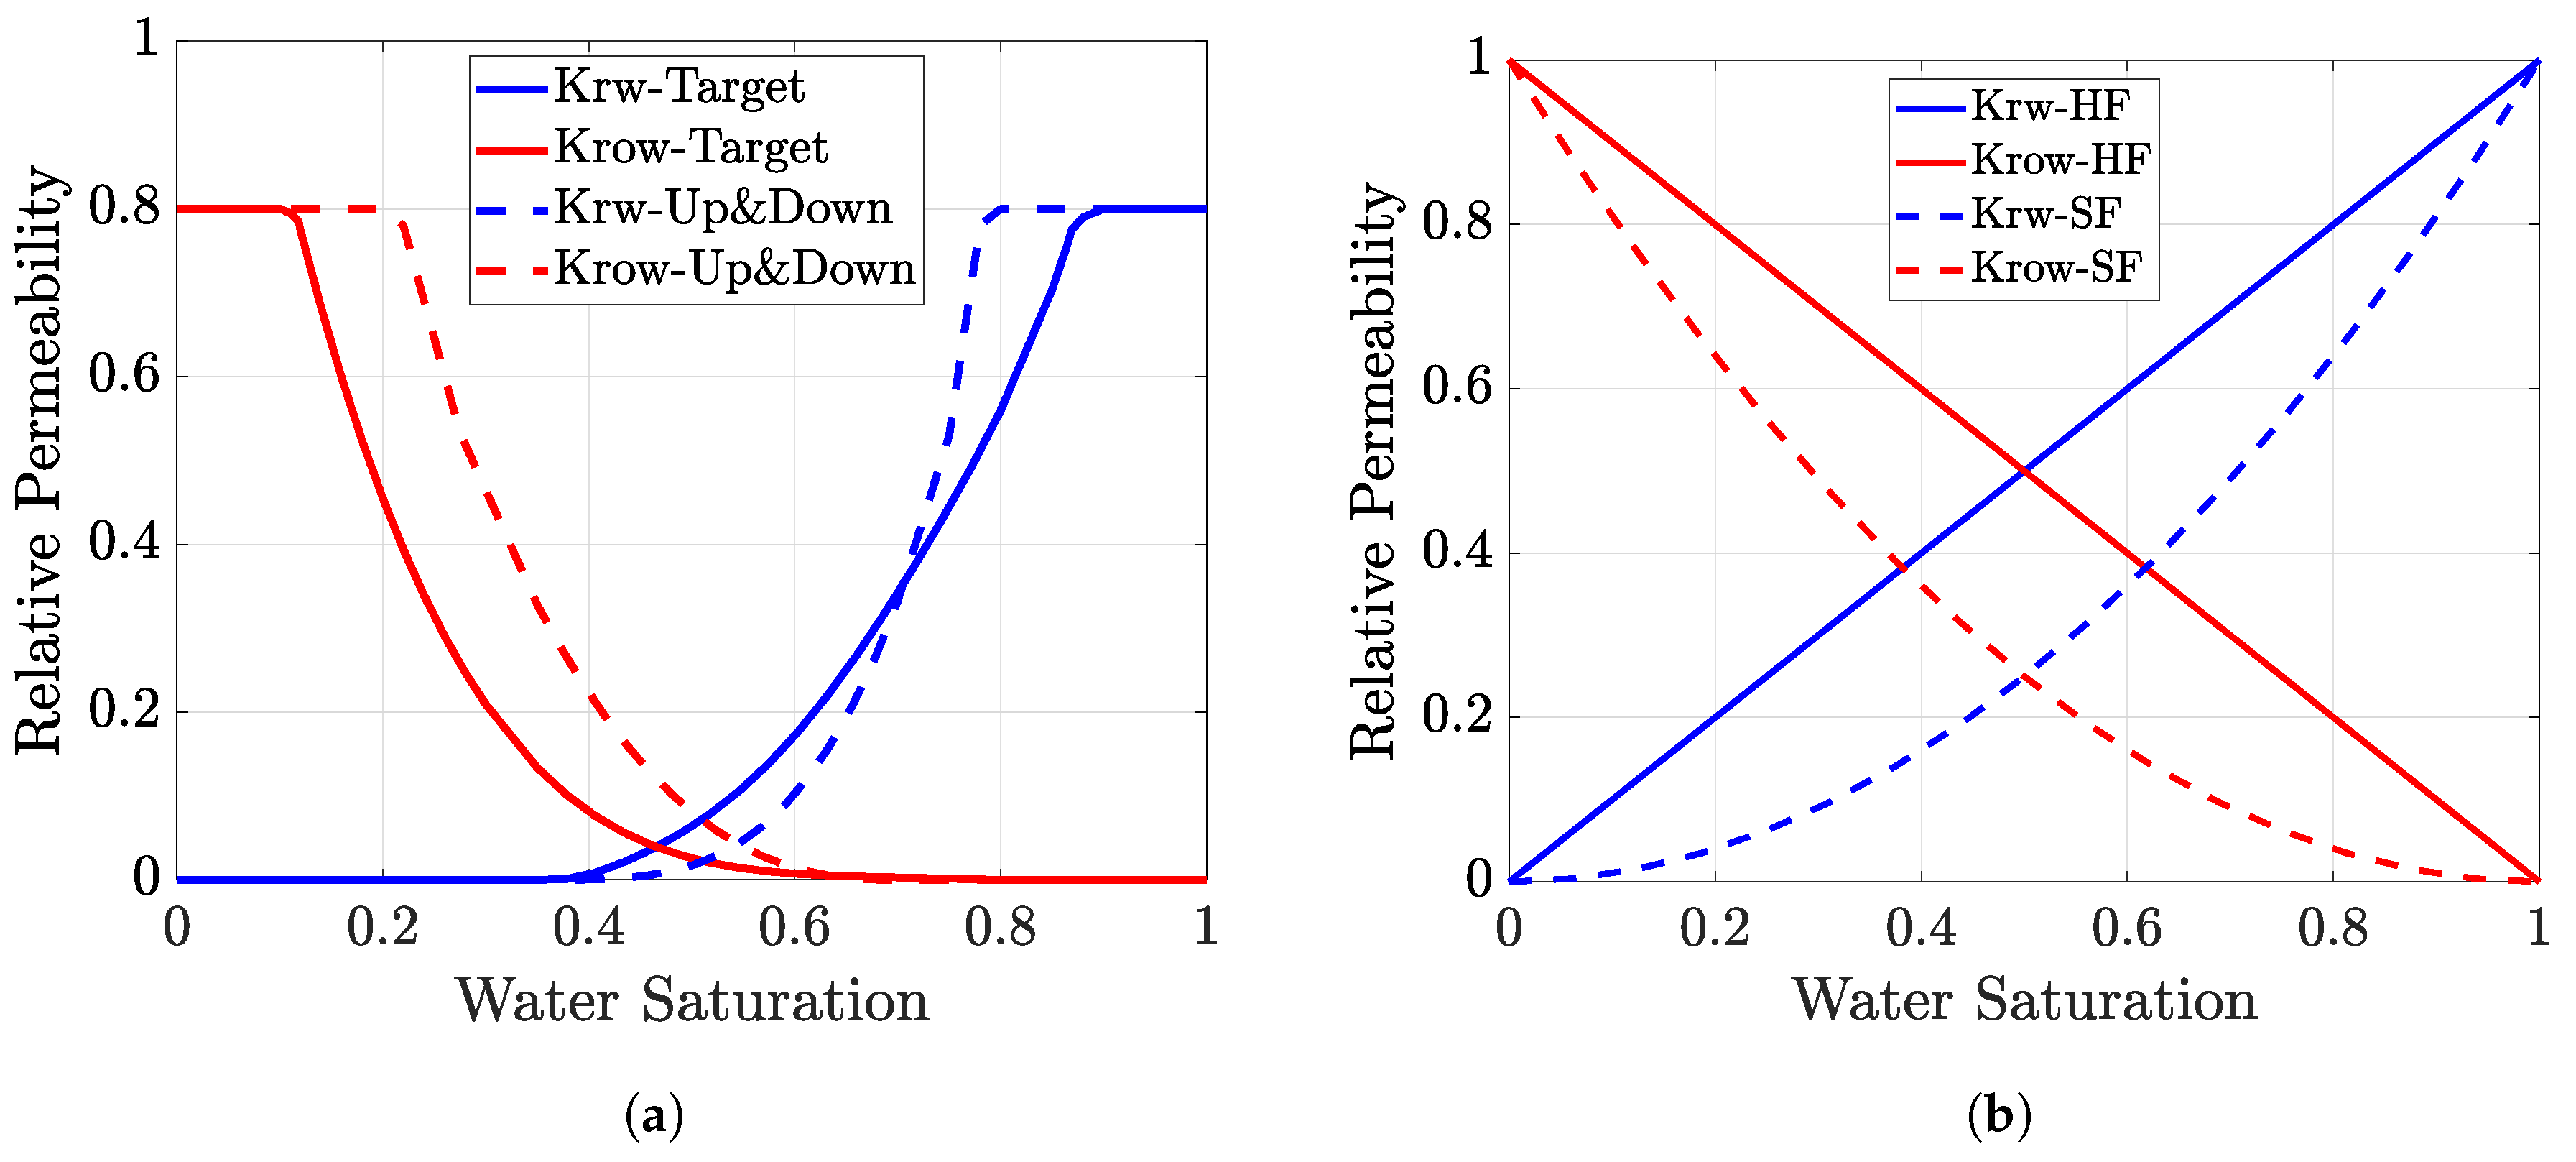
The two-phase flow (oil-water) relative permeability curves in this study are shown in Figure 3a,b for the rock matrix and the fractures, respectively.
We assume a mixed to oil-wet target zone, which is characteristic of an organic-rich formation [57]. The organic-rich formations have a total organic carbon (TOC) up to 14 wt. % in the U.S and the Jafurah Basin-Saudi Arabia [45,46]. Experimental studies have shown that kerogen maturation increases meso- and micro-porosity in the rock matrix [58]. These pores increase the residual hydrocarbon saturation and irreducible water saturation [58]. Figure 3a shows that relative permeability values vary in a narrow window of water saturation values (0.4–0.6). It leads to sharp hydrocarbon decline rates and an extended period with low water rates. Figure 3b shows an X-shaped relative permeability curve characteristic of hydraulic fractures. This shape indicates high conductivity with no influence of capillarity.

2.4. Pressure-Dependent Permeability

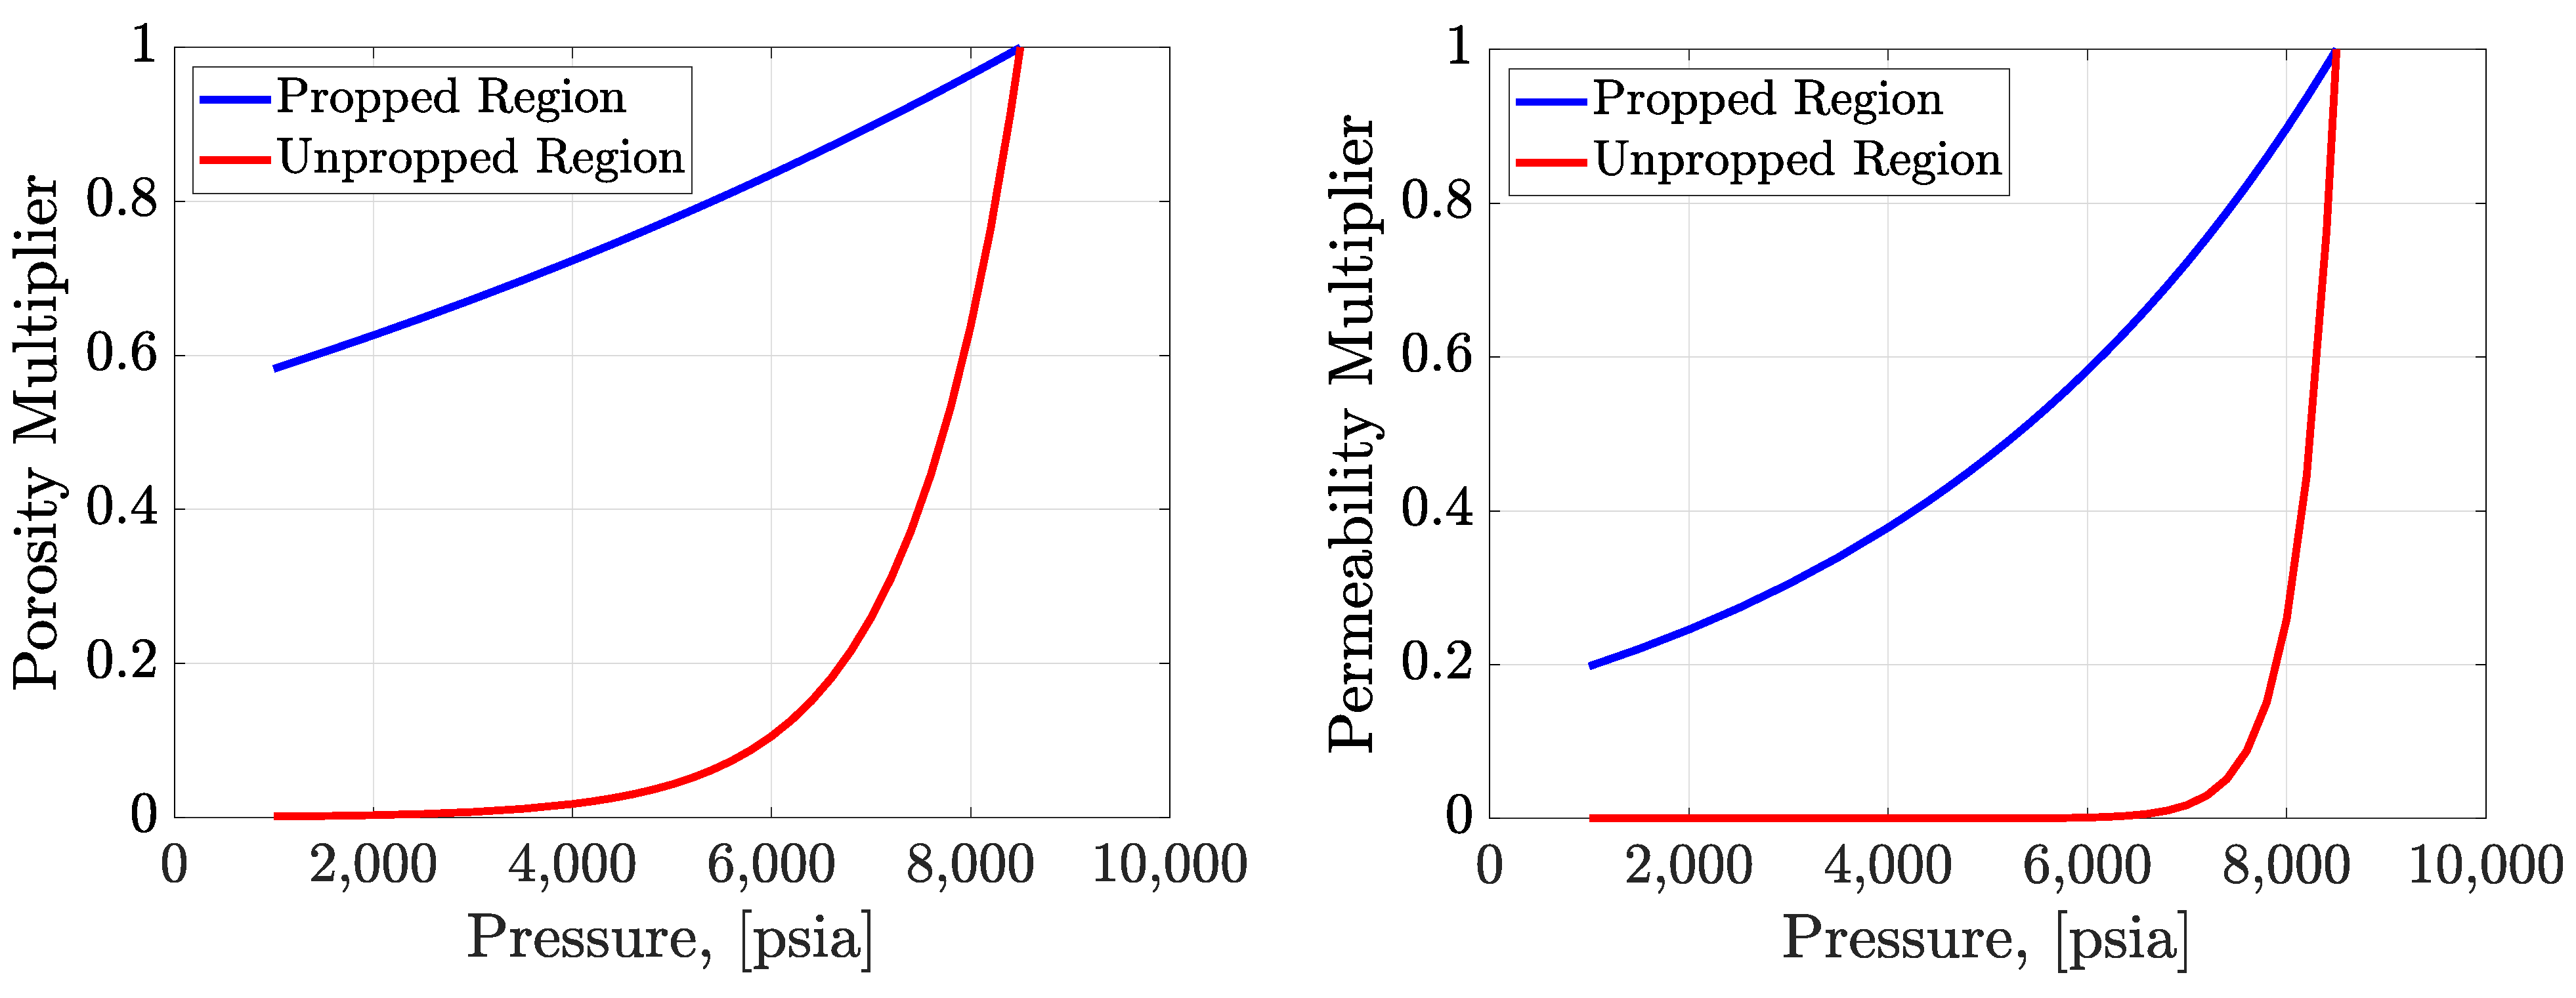
Hydraulically stimulated fractures close when fracturing fluid injection stops and the pressure in the fracture drops below the fracture closure pressure [59]. The fracture closure pressure corresponds to the least principal stress (S3 or Shmin in normal and strike-slip stress regimes) for the vertically induced hydraulic fractures, the overburden stress for horizontal bedding planes, and the maximum principal horizontal stress (SHmax) for the orthogonal natural fracture set (“secondary fractures”). We account for the fracture closure mechanism by implementing compaction curves to the reservoir simulation scenarios. These curves consist of pressure-dependent permeability and porosity multipliers assigned to the hydraulic fractures, bedding planes, and natural fractures grid blocks (Figure 4). Several studies have examined the relationship between effective stress, permeability, and porosity. The studies described the relationships using empirical models (e.g., power, exponential, and logarithmic models) that consider the confining pressure constant [60,61]. These studies revealed that permeability has a higher stress sensitivity than porosity [62]. We applied the following equations to calculate the permeability and porosity multipliers [55,63]:
ϕ ϕ i = e C f r a c   ×   P n e t
k k i = ϕ ϕ i 3 = e 3 ×   C f r a c   ×   P n e t
Here,
ϕ i: Initial porosity, fraction.
ki: Initial permeability, m2 (mD).
Pnet: Net pressure, MPa (psi). It is the difference between the initial pressure and the current pressure [55].
Cfrac: Coefficient of stress sensitivity, MPa−1 (psi−1).
Stimulated fracture permeability variation results in a declining conductivity that depends on the propped or unpropped nature of a respective fracture type. In our scenarios, the fracture conductivity reduces more slowly in a propped fracture region than in an unpropped fracture region [64]. Because secondary fractures and bedding planes have small apertures [65], we assume that proppant does not flow into these. Thus, orthogonal secondary natural fractures are self-propped due to naturally occurring roughness and horizontal bedding planes are unpropped. Furthermore, we consider that proppant settling in the vertical hydraulic fracture occurs near the wellbore, because of low viscosity fracturing fluid [66]. In this case, the distal parts of the vertical hydraulic fractures also remain unpropped. Figure 4 shows two compaction curves (red and blue lines). The red line represents the hydraulic fracture’s unpropped region (Figure 5b) and the horizontal bedding planes. In contrast, the blue line describes the hydraulic fracture’s propped zone (Figure 5b) and the secondary natural fracture set. Proppant support reduces the closure rate appreciably compared with the unpropped zone [55].

3. Hydraulic Fracture Geometry Scenarios

3.1. Reference Fracture Scenario: Vertical and Planar Hydraulic Fractures

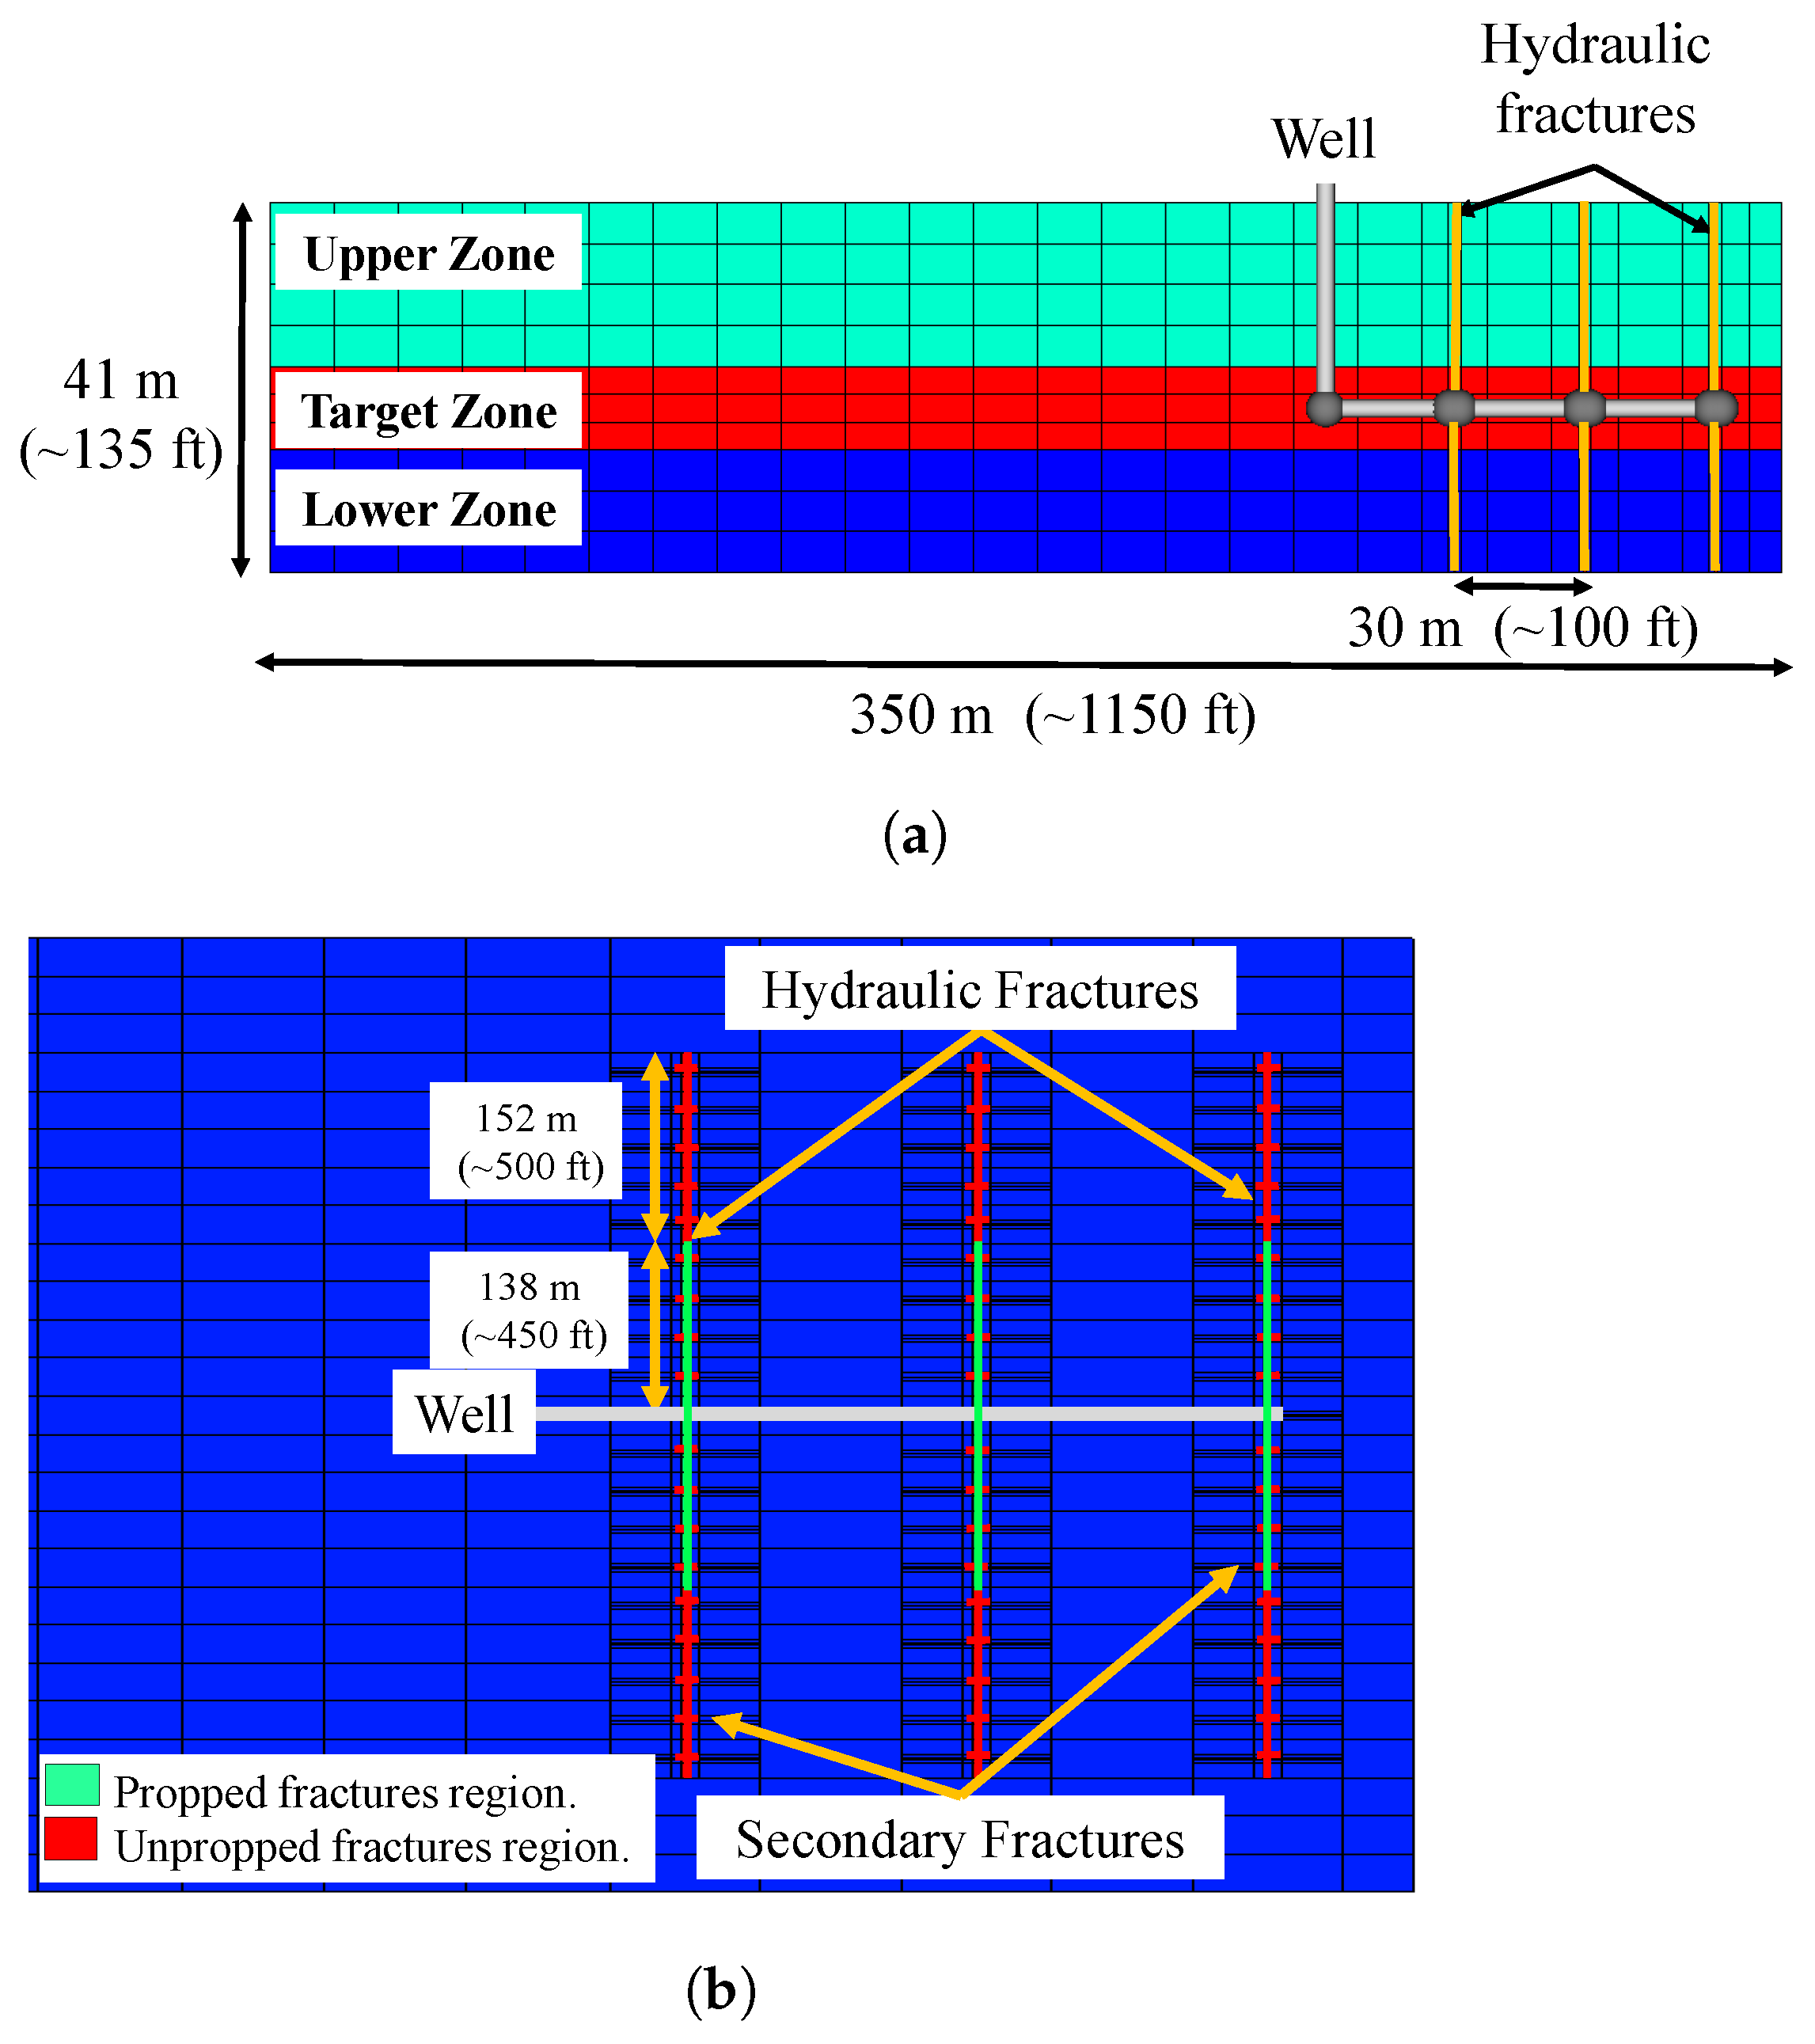
The reference simulation model is an idealized case that discretizes the rock into a matrix and an orthogonal natural fracture network. The model comprises a hydraulic fracture stage of three vertical and planar fractures spaced 30 m (∼100 ft) apart (Figure 5a). The hydraulic fractures have an assumed aperture of 9 mm (∼0.03 ft), a propped fracture half-length of 137 m (∼450 ft), and a permeability of 2000 mD. We assume that hydraulic fracture height is equal to reservoir thickness of 41 m or ∼135 ft (i.e., no out of zone growth). In this fracture scenario, the fracturing fluid volume per fracture is 190 m3 (∼1200 bbls). The hydraulic fracture dimensions are considered based on the literature reviewed presented in Table 2. We fixed the hydraulic fracture length and the fracturing fluid volume per fracture, assuming a proppant porosity of 0.4 (average sphere packing porosity [67]) we could estimate the hydraulic fracture aperture.
We assume vertical, bi-wing, and symmetrical hydraulic fractures and a secondary orthogonal, vertical natural fracture set (Figure 5b). This fracture scenario represents an ideal configuration that is commonly considered in hydraulic treatment designs [36,68,69]. This fracture geometry is likely to occur in hydrostatically overpressured shale plays, where the tectonic environment is characterized by low or intermediate horizontal compression (i.e., normal (Shmin < SHmax < Sv), trans-tensional (Shmin < SHmax∼Sv), and strike-slip (Shmin < Sv<SHmax) faulting stress regime) [70]. Under these conditions, hydraulic fractures are vertical and propagate in a direction perpendicular to the least principal stress (i.e., S3 = Shmin) [71,72]. Furthermore, they open in the direction of S3 [73]. In this scenario, net pressures higher than the difference between the principal horizontal stresses and the rock’s tensile strength combined with a high pumping rate are required to favor fracturing fluid leak-off into the secondary pre-existing natural fracture set and hydraulically open them [74]. Under these circumstances, the primary hydraulic fracture geometry is preserved [21,75]. A large stress difference between Shmin and the overburden (Sv) impedes fluid leakage from the hydraulic fractures into horizontal bedding planes [76].
The secondary natural fractures with an assumed aperture of 3 mm (∼0.01 ft) are narrower than the primary hydraulic fractures. We also assume that these secondary fractures are self-propped due to naturally occurring roughness and are filled with fracturing fluid at stimulation pressures. In contrast, hydraulic fractures have a propped and unpropped region simulated with two different compaction curves (Figure 5b).

3.2. Second Fracture Scenario: Vertical Hydraulic Fractures with Perpendicular Secondary Fractures

The second modeling fracture scenario consists of three vertical and planar hydraulic fractures and eight perpendicular secondary natural fractures (Figure 6). The hydraulic fracture half-length is 230 m (∼750 ft), which is shorter than the fracture half-length of the reference case. The reduction in length occurs due to the initiation of secondary fractures and their interaction with primary hydraulic fractures. We assume equal primary and secondary fracture aperture (7mm or ∼0.023 ft).
In this fracture scenario, we assume a shale play under a normal faulting stress regime, where the high pore pressure is responsible for the low difference between the principal horizontal stresses. Net pressures larger than the difference between Shmin and SHmax combined with high organic content (TOC>3 wt% [77]) favor the interaction between vertical hydraulic fractures and orthogonal pre-existing natural fractures (“secondary fractures”). Consequently, stimulation jobs hydraulically open the secondary fractures and create a stimulated interconnected orthogonal fracture network (Figure 7). Similarly to the reference case, this second fracture scenario does not consider horizontal bedding plane stimulation, because of the large difference between Sv and Shmin.

3.3. Third Fracture Scenario: Vertical Hydraulic Fractures with Horizontal Bedding Plane Fractures

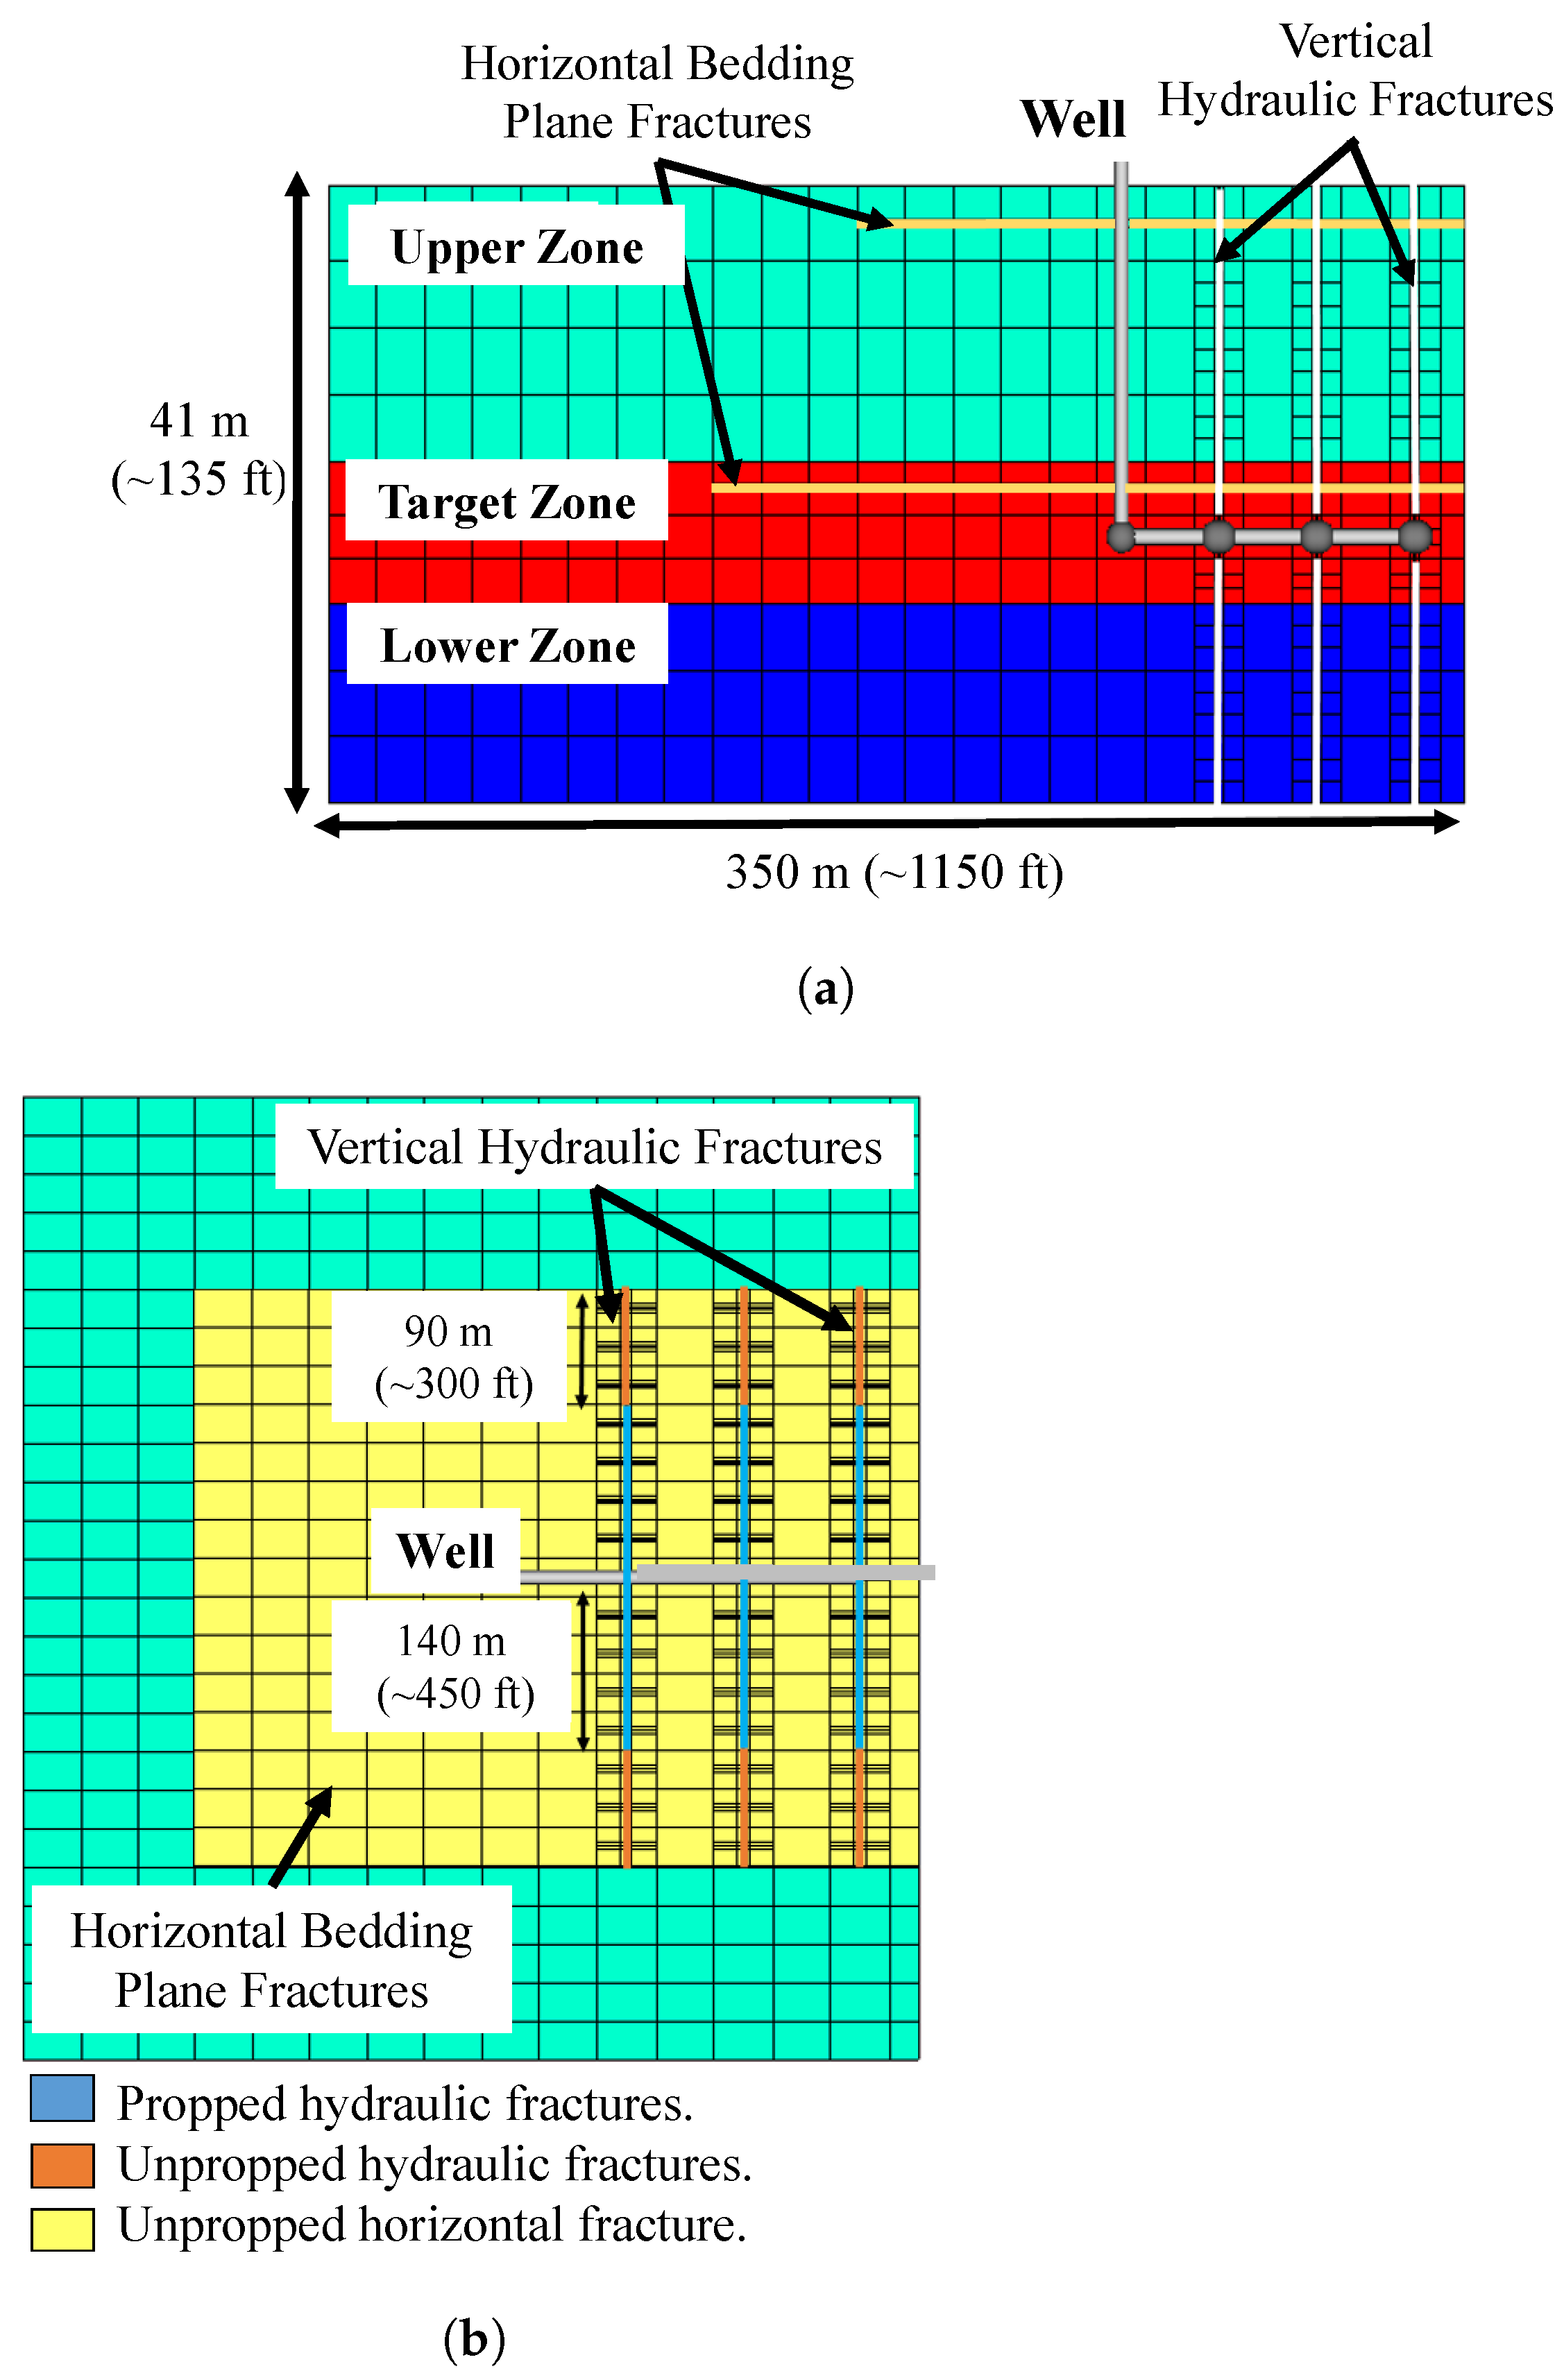
The third simulation configuration consists of three vertical and planar hydraulic fractures, and two stimulated horizontal bedding planes (Figure 8). The primary fracture half-length is 230 m (∼750 ft), and they are spaced uniformly every 30 m (∼100 ft) along the horizontal wellbore. Furthermore, we assume equal apertures for both primary hydraulic fractures and bedding planes (4 mm or ∼0.013 ft). The size of the stimulation job is the same as the other two simulation fracture scenarios presented before.
In this case, stimulation of horizontal bedding planes increases the hydraulic fracture configuration complexity (Figure 9). Horizontal bedding planes, mechanically weak owing to little cohesion, may be stimulated in shale plays in transitional strike-slip to reverse faulting stress regimes, in which Sv and Shmin are close in magnitudes and similar to the least principal stress (i.e., Shmin∼Sv∼S3). Such stress conditions have been reported in some unconventional source rock plays (e.g., the Marcellus Shale in southern West Virginia and the Tuwaiq Mountain formation in the Jafurah Basin, Saudi Arabia [27,38,39]).
These environments are characterized by high pore pressure, which highly reduces the effective stress magnitudes, and makes them close to each other [13]. Under these conditions, hydraulic fracturing may stimulate horizontal bedding planes when hydraulic communication occurs with the primary vertical hydraulic fractures. Horizontal bedding planes open to flow at high pumping rates and net pressures [22,76,79]. However, we assume that the aperture is not sufficiently large for proppants to enter, resulting in their closure during fracturing fluid flowback.
This hydraulically stimulated configuration results in simultaneous fracture growth in the vertical and horizontal directions. The fracturing fluid propagates more easily along laminations than across them due to high horizontal permeability in shale plays [11]. Despite this process, hydraulic fractures may continue to cross the bedding planes and promote their vertical propagation when the fracture’s pressure is sufficiently high [80].

4. Results and Discussion

Operators have applied large stimulation jobs in shale plays to achieve production at economical rates. In 2020, the expected mean value (P50) of fracturing fluid injected into U.S. shale plays, was about 60,600 m3 (∼380,000 bbls) for an average wellbore lengths of 2500 m (∼8200 ft). The mean proppant mass injected was 7500 tons (∼15 MM lbs) [48,49]. Similarly, hydraulic treatments in the Jafurah Basin in Saudi Arabia require large fracturing fluid volumes and proppant amounts. From published data, we deduce that total fracturing fluid volumes and proppant mass per wellbore are about 18,000 m3 (∼113,000 bbls) and 3600 tons (∼7.2 MM lbs) [44,45,47,81]. The average horizontal wellbore length in the Jafurah basin is approximately 1500 m (∼5000 ft) [45,53]. Some mudrock plays are further characterized by high pore pressure and a small difference between the principal stresses. For example, the Jafurah basin exhibits pore pressure gradients between 0.016 and 0.020 MPa/m (∼0.7–0.88 psi/ft) [38,44], and strike-slip faulting stress regime (Shmin∼0.96 psi/ft < Sv∼ 1.1 psi/ft < SHmax∼1.2 psi/ft) [38,44,82]. These environments combined with large fluid volume injection foster interactions between vertical hydraulic fractures and pre-existing discontinuities (e.g., natural fractures and bedding planes). Based on Haider et al. studies [83], 90% of the fracturing fluid injected into shale systems can be retained in the rock discontinuities and may result in hydrocarbon production below the forecast.
Therefore, we have studied the impact of rock discontinuities during hydraulic stimulation on wellbore flow performance in the overpressured shale plays. We have proposed three different hydraulic fracture geometries (“fracture scenarios”) and compared two simulation cases with the variable primary fracture conductivity for the scenario with horizontal fractures (fracture scenario #3). Figure 10 compares reservoir fluid production for the three fracture scenarios, assuming equal primary hydraulic fracture permeability of 2000 mD. This case assumes an efficient proppant placement and high conductivity in the vertical hydraulic fractures. The results show that cumulative fluid production slightly differs between the fracture scenarios #2 and #3. Table 3 compares the different parameters of the three proposed fracture scenarios. The reference fracture scenario produces an ultimate oil production of 407 Mbbl and ultimate water production of 564 Mbbl at 15 years. For this scenario, the oil production peaks at 931 bbl/d, and the water production peaks at 18,992 bbl/d. The ultimate recovery factor at 15 years is 8.5%. The table shows that the stimulation of secondary vertical, orthogonal natural fractures increases the initial water production by 29% and the initial oil production by 10%. These fractures are the highly conductive pathways that enhance reservoir production. Despite this, the orthogonal natural fractures close after a few months of production because of ineffective self-propping. Thus, such a configuration reduces cumulative reservoir fluid production after 15 years by an average of 10% compared to the reference fracture scenario. After 15 years, our model predicts an ultimate oil recovery factor of about 7.7%.
On the other hand, stimulated horizontal bedding planes reduce the initial water production by 40% and the initial oil production by 13%. In this case, the unpropped planes experience a rapid closure once pumping stops and fracturing fluid flowback starts. This closure disconnects a huge stimulated reservoir volume, which has a marked impact on well productivity. For this fracture scenario, we forecast a similar recovery factor as scenario #2 because we assume the same primary fracture length and conductivity in both scenarios.
The interaction between hydraulic fractures and bedding planes reduces the hydraulic fracture propagation energy. Thus, it creates narrower and shorter vertical hydraulic fractures [72], and generates poor proppant placement. For this reason, in the second simulation case (Figure 11), we reduce the vertical hydraulic fracture permeability in fracture scenario #3 by 90%. In this simulation case, fracture scenario #3 agrees well with reported wellbore flow performance in shale plays with high pore pressure and small differential stress. Figure 11 compares reservoir fluid production for the three fracture scenarios. Fracture scenarios #1 and #2 are the same as presented in the first simulation case. Despite this, the results show that horizontal fracture generation significantly reduces total fluid production. Ultimate oil recovery for fracture scenario #3 after 15 years is 6.7%.
Table 4 compares the different parameters of the three proposed fracture scenarios in the second simulation case. The results show that stimulating horizontal bedding planes reduces the initial water production by about 80% and initial oil production by about 50% compared to the reference fracture scenario. The cumulative oil production after 15 years is reduced by 20% resulting from rapid fracture closure and low hydraulic fracture conductivity.

5. Conclusions

  • The interactions among vertical hydraulic fractures and the orthogonal pre-existing natural fractures may initiate and hydraulically open secondary natural fractures. Our results show that these secondary fractures improve reservoir permeability and contribute to the initial hydrocarbon production when they reach conductivity similar to that of primary vertical hydraulic fractures. The presence of stimulated vertical orthogonal natural fractures enhances the initial oil production by about 10%.
  • We allow the stimulation of secondary orthogonal natural fractures to reduce the vertical hydraulic fracture length and aperture. The shortened primary fracture length combined with the rapid closure of secondary natural fractures, reduce the stimulated reservoir volume and harms long-term production. Thus, our results show that these two factors can reduce the cumulative oil production at 15 years by about 8% compared with the scenario with vertical hydraulic fractures only.
  • We assume that stimulation of the horizontal bedding planes reduces the primary vertical hydraulic fracture length and aperture. This may produce premature proppant screen-out and inefficient proppant placement into primary hydraulic fractures. Our results show that the lowered vertical hydraulic fracture conductivity combined with rapid horizontal fracture closure can reduce cumulative hydrocarbon production after 15 years by about 20% and the initial hydrocarbon production by about 50% compared with the vertical hydraulic fractures only (“ he reference fracture scenario”).
  • In hydraulic fracturing, it is crucial to constrain the present-day in situ stress state (magnitudes and orientation) and pore pressure conditions to understand the initiation and propagation mechanisms that control the final stimulated reservoir volume geometry. Only then realistic hydrocarbon production forecasts can be obtained. The assumption of vertical, symmetrical, and planar fractures may lead to unreliable hydrocarbon production forecasts. This last finding agrees with the studies performed by previous researchers [6,35,36,69]. The simplification of hydraulic fracture geometry can overestimate hydrocarbon production, primarily if the modeled formation is characterized by high pore pressure and a small difference between the principal stresses. These conditions enhance the fracturing fluid leakage into natural fractures and/or bedding planes.

Author Contributions

Conceptualization, D.A.A.O., L.K., T.F. and T.W.P.; methodology, D.A.A.O., L.K. and T.W.P.; software, D.A.A.O. and L.K.; validation, D.A.A.O., L.K., T.F. and T.W.P.; formal analysis, D.A.A.O. and L.K.; investigation, D.A.A.O.; resources, T.W.P.; writing—original draft preparation, D.A.A.O.; writing—review and editing, D.A.A.O., L.K., T.F. and T.W.P.; visualization, D.A.A.O.; supervision, L.K., T.F. and T.W.P.; project administration, T.W.P.; funding acquisition, T.W.P. All authors have read and agreed to the published version of the manuscript.

Funding

Daniela Arias Ortiz (PhD student) and Lukasz Klimkowski (Postdoctoral Fellow) were supported by baseline research funding from KAUST to Professor Tadeusz Patzek.

Acknowledgments

The authors thank the Ali I. Al-Naimi Petroleum Engineering Research Center (ANPERC) at King Abdullah University of Science and Technology (KAUST) for supporting this research. We also thank the financial support from KAUST through Professor Tadeusz Patzek baseline. Finally, we thank all the reviewers for their detailed, valuable, and timely suggestions that helped us improve our article’s quality.

Conflicts of Interest

The authors declare no conflict of interest.

Abbreviations

The following abbreviations are used in this manuscript:
BPBedding Planes
DKDual Permeability
HFHydraulic Fractures
LS-LR-DKLocally Spaced-Logarithmically Refined-Dual Permeability
NFNatural Fractures
RFRecovery Factor
SFSecondary Fractures
SRVStimulated Reservoir Volume
TOCTotal Organic Carbon

Nomenclature

ShminMinimum principal horizontal stress
SHmaxMaximum horizontal stress
SvOverburden stress
S3Least principal stress

References

  1. Schenk, C. World Oil and Gas Resource Assessments; Central Energy Resources Science Center, USGS: Menlo Park, CA, USA, 2021. Available online: https://www.usgs.gov/centers/cersc/science/world-oil-and-gas-resource-assessments?qt-science_center_objects=0#qt-science_center_objects (accessed on 30 August 2021).
  2. Su, Y.; Ren, L.; Meng, F.; Xu, C.; Wang, W. Theoretical Analysis of the Mechanism of Fracture Network Propagation with Stimulated Reservoir Volume (SRV) Fracturing in Tight Oil Reservoirs. PLoS ONE 2015, 10, e0125319. [Google Scholar] [CrossRef] [PubMed] [Green Version]
  3. Barree, R.D.; Conway, M.W.; Gilbert, J.V.; Woodroof, R.A. Evidence of Strong Fracture Height Containment Based on Complex Shear Failure and Formation Anisotropy. In Proceedings of the SPE Annual Technical Conference and Exhibition, Florence, Italy, 20–22 September 2010; Society of Petroleum Engineers: Florence, Italy, 2010; p. 20. [Google Scholar] [CrossRef]
  4. Ren, L.; Zhao, J.; Hu, Y. Hydraulic Fracture Extending into Network in Shale: Reviewing Influence Factors and Their Mechanism. Sci. World J. 2014, 2014, 847107. [Google Scholar] [CrossRef]
  5. Warpinski, N.R.; Mayerhofer, M.J.; Vincent, M.C.; Cipolla, C.L.; Lolon, E.P. Stimulating Unconventional Reservoirs: Maximizing Network Growth While Optimizing Fracture Conductivity. J. Can. Pet. Technol. 2009, 48, 39–51. [Google Scholar] [CrossRef]
  6. Yang, R.; Huang, Z.; Yu, W.; Li, G.; Ren, W.; Zuo, L.; Tan, X.; Sepehrnoori, K.; Tian, S.; Sheng, M. A Comprehensive Model for Real Gas Transport in Shale Formations with Complex Non-planar Fracture Networks. Sci. Rep. 2016, 6, 36673. [Google Scholar] [CrossRef] [Green Version]
  7. Chen, Z.; Liao, X.; Yu, W.; Sepehrnoori, K.; Zhao, X.; Li, X.; Sun, H. A Diagnostic Approach to Identify Complex Fracture Geometries in Unconventional Reservoirs Using a Semi-analytical Model. In Proceedings of the SPE/AAPG/SEG Unconventional Resources Technology Conference, Austin, TX, USA, 24–26 July 2017; p. 27. [Google Scholar] [CrossRef]
  8. Yu, W.; Xu, Y.; Weijermars, R.; Wu, K.; Sepehrnoori, K. A Numerical Model for Simulating Pressure Response of Well Interference and Well Performance in Tight Oil Reservoirs with Complex-Fracture Geometries Using the Fast Embedded-Discrete-Fracture-Model Method. SPE Reserv. Eval. Eng. 2017, 21. [Google Scholar] [CrossRef]
  9. Blanton, T.L. Propagation of Hydraulically and Dynamically Induced Fractures in Naturally Fractured Reservoirs. In Proceedings of the SPE Unconventional Gas Technology Symposium, Louisville, Kentucky, 18–21 May 1986; Society of Petroleum Engineers: Louisville, Kentucky, 1986; p. 15. [Google Scholar] [CrossRef]
  10. Chuprakov, D.A.; Prioul, R. Hydraulic Fracture Height Containment by Weak Horizontal Interfaces. In Proceedings of the SPE Hydraulic Fracturing Technology Conference, The Woodlands, TX, USA, 3–5 February 2015; Society of Petroleum Engineers: The Woodlands, TX, USA, 2015; p. 17. [Google Scholar] [CrossRef]
  11. Li, H.; Zou, Y.; Valko, P.P.; Ehlig-Economides, C. Hydraulic Fracture Height Predictions in Laminated Shale Formations Using Finite Element Discrete Element Method. In Proceedings of the SPE Hydraulic Fracturing Technology Conference, The Woodlands, TX, USA, 9–11 February 2016; Society of Petroleum Engineers: The Woodlands, TX, USA, 2016; p. 17. [Google Scholar] [CrossRef]
  12. Tang, J.; Wu, K.; Zeng, B.; Huang, H.; Hu, X.; Guo, X.; Zuo, L. Investigate effects of weak bedding interfaces on fracture geometry in unconventional reservoirs. J. Pet. Sci. Eng. 2018, 165, 992–1009. [Google Scholar] [CrossRef]
  13. Guo, Y.; Yang, C.; Wang, L.; Xu, F. Study on the Influence of Bedding Density on Hydraulic Fracturing in Shale. Arab. J. Sci. Eng. 2018, 43, 6493–6508. [Google Scholar] [CrossRef]
  14. Prabhakaran, R.; De Pater, H.; Shaoul, J. Pore pressure effects on fracture net pressure and hydraulic fracture containment: Insights from an empirical and simulation approach. J. Pet. Sci. Eng. 2017, 157, 724–736. [Google Scholar] [CrossRef]
  15. Blanton, h.L. An Experimental Study of Interaction Between Hydraulically Induced and Pre-Existing Fractures. In Proceedings of the SPE Unconventional Gas Recovery Symposium, Pittsburgh, Pennsylvania, 16–18 May 1982; Society of Petroleum Engineers: Pittsburgh, PA, USA, 1982; p. 13. [Google Scholar] [CrossRef]
  16. Beugelsdijk, L.J.L.; de Pater, C.J.; Sato, K. Experimental Hydraulic Fracture Propagation in a Multi-Fractured Medium. In Proceedings of the SPE Asia Pacific Conference on Integrated Modelling for Asset Management, Yokohama, Japan, 25–26 April 2000; Society of Petroleum Engineers: Yokohama, Japan, 2000; p. 8. [Google Scholar] [CrossRef]
  17. Zhou, J.; Chen, M.; Jin, Y.; Guangqing, Z. Analysis of fracture propagation behavior and fracture geometry using a tri-axial fracturing system in naturally fractured reservoirs. Int. J. Rock Mech. Min. Sci. 2008, 45, 1143–1152. [Google Scholar] [CrossRef]
  18. Zhou, J.; Jin, Y.; Chen, M. Experimental investigation of hydraulic fracturing in random naturally fractured blocks. Int. J. Rock Mech. Min. Sci. 2010, 47, 1193–1199. [Google Scholar] [CrossRef]
  19. Liu, Z.; Chen, M.; Zhang, G. Analysis of the Influence of a Natural Fracture Network on Hydraulic Fracture Propagation in Carbonate Formations. Rock Mech. Rock Eng. 2014, 47, 575–587. [Google Scholar] [CrossRef]
  20. Warpinski, N.R. Hydraulic Fracturing in Tight, Fissured Media. J. Pet. Technol. 1991, 43, 146–209. [Google Scholar] [CrossRef]
  21. de Pater, C.J.; Beugelsdijk, L.J.L. Experiments and numerical simulation of hydraulic fracturing in naturally fractured rock. In Proceedings of the Alaska Rocks 2005, The 40th U.S. Symposium on Rock Mechanics (USRMS), Anchorage, Alaska, 25–29 June 2005; American Rock Mechanics Association: Anchorage, Alaska, 2005; p. 12. [Google Scholar]
  22. Yushi, Z.; Shicheng, Z.; Zhou, T.; Xiang, Z.; Guo, T. Experimental Investigation into Hydraulic Fracture Network Propagation in Gas Shales Using CT Scanning Technology. Rock Mech. Rock Eng. 2015, 49. [Google Scholar] [CrossRef]
  23. Hou, B.; Zhang, R.; Zeng, Y.; Fu, W.; Muhadasi, Y.; Chen, M. Analysis of hydraulic fracture initiation and propagation in deep shale formation with high horizontal stress difference. J. Pet. Sci. Eng. 2018, 170, 231–243. [Google Scholar] [CrossRef]
  24. Izadi, G.; Moos, D.; Cruz, L.; Gaither, M.; Chiaramonte, L.; Johnson, S. Fully Coupled 3-D Hydraulic Fracture Growth in the Presence of Weak Horizontal Interfaces. In Proceedings of the SPE Hydraulic Fracturing Technology Conference and Exhibition, The Woodlands, TX, USA, 24–26 January 2017; Society of Petroleum Engineers: The Woodlands, TX, USA, 2017; p. 15. [Google Scholar] [CrossRef]
  25. Huang, B.; Liu, J. Fully three-dimensional propagation model of horizontal borehole hydraulic fractures in strata under the effect of bedding planes. Energy Explor. Exploit. 2018, 36, 1189–1209. [Google Scholar] [CrossRef]
  26. Tang, J.; Zuo, L.; Xiao, L.; Wu, K.; Qian, B.; Yin, C.; Ehlig-Economides, C.; You, X. A 3-D Hydraulic Fracture Propagation Model Applied for Multiple-Layered Formation. In Proceedings of the International Petroleum Technology Conference, Beijing, China, 26–28 March 2019; p. 20. [Google Scholar] [CrossRef]
  27. Alalli, A.; Zoback, M. Microseismic evidence for horizontal hydraulic fractures in the Marcellus Shale, southeastern West Virginia. Lead. Edge 2018, 37, 356–361. [Google Scholar] [CrossRef]
  28. Celleri, H.M.; Castez, M.F.; Serebrinsky, S.; Sánchez, M.; Álvarez, J.P.; Winograd, E.A.; Vitolo, M. Hydraulic Fracture Propagation in Strike-Slip Regime With Weak Interfaces. In Proceedings of the 53rd U.S. Rock Mechanics/Geomechanics Symposium, New York, NY, USA, 23–26 June 2019; American Rock Mechanics Association: New York, NY, USA, 2019; p. 9. [Google Scholar]
  29. Nicholson, A.K.; Hawkes, R.V.; Bachman, R.C. Close Encounters in the 3rd Dimension: Using Diagnostic Fracture Injection Tests DFITs from the Alberta Duvernay Shale Formation to Quantify Simultaneous Horizontal- & Vertical-Plane Hydraulic Fracture Growth. In Proceedings of the SPE Hydraulic Fracturing Technology Conference and Exhibition, The Woodlands, TX, USA, 5–7 February 2019; Society of Petroleum Engineers: The Woodlands, TX, USA, 2019; p. 21. [Google Scholar] [CrossRef]
  30. Kowan, J.; Schanken, L.; Jacobi, R. Conclusive Proof of Weak Bedding Planes in the Marcellus Shale and Proposed Mitigation Strategies. In Proceedings of the SPWLA 61st Annual Logging Symposium, Virtual, 24 June–29 July 2020. [Google Scholar] [CrossRef]
  31. Waters, G. Hydraulic Fracture Geometries in Laminated Rocks when Initiated from Horizontal Wells Drilled in Tectonically Stressed Environments. In Proceedings of the Second EAGE/SPE/AAPG Shale Gas Workshop, Dubai, United Arab Emirates, 21–24 September 2014; European Association of Geoscientists and Engineers: Dubai, United Arab Emirates, 2014; pp. 1–3. [Google Scholar] [CrossRef] [Green Version]
  32. Olorode, O.M.; Freeman, C.M.; Moridis, G.J.; Blasingame, T. High-Resolution Numerical Modeling of Complex and Irregular Fracture Patterns in Shale Gas and Tight Gas Reservoirs. In Proceedings of the SPE Latin America and Caribbean Petroleum Engineering Conference, Mexico City, Mexico, 16–18 April 2012; Society of Petroleum Engineers: Mexico City, Mexico, 2012; p. 25. [Google Scholar] [CrossRef] [Green Version]
  33. Yu, W.; Luo, Z.; Javadpour, F.; Varavei, A.; Sepehrnoori, K. Sensitivity analysis of hydraulic fracture geometry in shale gas reservoirs. J. Pet. Sci. Eng. 2014, 113, 1–7. [Google Scholar] [CrossRef]
  34. Yu, W.; Wu, K.; Sepehrnoori, K.; Xu, W. A Comprehensive Model for Simulation of Gas Transport in Shale Formation with Complex Hydraulic-Fracture Geometry. SPE Reserv. Eval. Eng. 2017, 20, 547–561. [Google Scholar] [CrossRef]
  35. Olorode, O.; Freeman, C.M.; Moridis, G.; Blasingame, T.A. High-Resolution Numerical Modeling of Complex and Irregular Fracture Patterns in Shale-Gas Reservoirs and Tight Gas Reservoirs. Spe Reserv. Eval. Eng. 2013, 16, 443–455. [Google Scholar] [CrossRef]
  36. Lin, M.; Chen, S.; Ding, W.; Chen, Z.; Xu, J. Effect of Fracture Geometry on Well Production in Hydraulic-Fractured Tight Oil Reservoirs. J. Can. Pet. Technol. 2015, 54, 183–194. [Google Scholar] [CrossRef]
  37. Xu, Y.; Cavalcante Filho, J.S.A.; Yu, W.; Sepehrnoori, K. Discrete-Fracture Modeling of Complex Hydraulic-Fracture Geometries in Reservoir Simulators. SPE Reserv. Eval. Eng. 2017, 20, 403–422. [Google Scholar] [CrossRef]
  38. Bartko, K.M.; Arnaout, I.H.; Asiri, K.S.; McClelland, K.M.; Mulhim, N.I.; Tineo, R.; Gurmen, M.N.; Al-Jalal, Z.; Pantsurkin, D.; Emelyanov, D.Y. From the Backyard Dune to Fracturing a Highly Tectonically Complex Formation in Saudi Arabia. In Proceedings of the SPE Hydraulic Fracturing Technology Conference and Exhibition, The Woodlands, TX, USA, 24–26 January 2017; Society of Petroleum Engineers: The Woodlands, TX, USA, 2017; p. 18. [Google Scholar] [CrossRef]
  39. Ameen, M. Borehole Imaging of Natural Fractures and Stress Indicators in the Jurassic Carbonate Shale Plays, Eastern Saudi Arabia. In Proceedings of the Sixth EAGE Shale Workshop, Bordeaux, France, 28 April 2019. [Google Scholar] [CrossRef]
  40. Rubin, B. Accurate Simulation of Non Darcy Flow in Stimulated Fractured Shale Reservoirs. In Proceedings of the SPE Western Regional Meeting, Anaheim, CA, USA, 27–29 May; Society of Petroleum Engineers: Anaheim, CA, USA, 2010; p. 16. [Google Scholar] [CrossRef]
  41. Zhu, W.; He, X.; Khirevich, S.; Patzek, T.W. Fracture sealing and its impact on the percolation of subsurface fracture networks. Earth Space Sci. Open Arch. 2021, 30. [Google Scholar] [CrossRef]
  42. Chaudhary, A.S.; Ehlig-Economides, C.A.; Wattenbarger, R.A. Shale Oil Production Performance from a Stimulated Reservoir Volume. In Proceedings of the SPE Annual Technical Conference and Exhibition, Denver, CO, USA, 30 October–2 November 2011; Society of Petroleum Engineers: Denver, CO, USA, 2011; p. 21. [Google Scholar] [CrossRef] [Green Version]
  43. Aybar, U.; Yu, W.; Eshkalak, M.O.; Sepehrnoori, K.; Patzek, T. Evaluation of production losses from unconventional shale reservoirs. J. Nat. Gas Sci. Eng. 2015, 23, 509–516. [Google Scholar] [CrossRef]
  44. Al-Momin, A.; Kurdi, M.; Baki, S.; Mechkak, K.; Al-Saihati, A. Proving the Concept of Unconventional Gas Reservoirs in Saudi Arabia through Multistage Fractured Horizontal Wells. In Proceedings of the SPE Asia Pacific Unconventional Resources Conference and Exhibition, Brisbane, Australia, 9–11 November 2015; Society of Petroleum Engineers: Brisbane, Australia, 2015; p. 18. [Google Scholar] [CrossRef]
  45. Hakami, A.; Al-Mubarak, A.; Al-Ramadan, K.; Kurison, C.; Leyva, I. Characterization of carbonate mudrocks of the Jurassic Tuwaiq Mountain Formation, Jafurah basin, Saudi Arabia: Implications for unconventional reservoir potential evaluation. J. Nat. Gas Sci. Eng. 2016, 33, 1149–1168. [Google Scholar] [CrossRef]
  46. Zoback, M.D.; Kohli, A.H. Unconventional Reservoir Geomechanics: Shale Gas, Tight Oil, and Induced Seismicity; Cambridge University Press: Cambridge, MA, USA, 2019. [Google Scholar] [CrossRef]
  47. Abaza, B.; Baki, S.; Sadykov, A.; Mechkak, K.; Rueda, J. Determining the Magnitude of Interference among Adjacent Wells in a Saudi Arabian Unconventoinal Formation. In Proceedings of the International Petroleum Technology Conference, Dhahran, Saudi Arabia, 13–15 January 2020; International Petroleum Technology Conference: Dhahran, Saudi Arabia, 2020; p. 13. [Google Scholar] [CrossRef]
  48. Saputra, W.; Kirati, W.; Hughes, D.; Patzek, T. Forecast of Economic Gas production in the Marcellus. AAPG Bull. 2021. [Accepted]. [Google Scholar]
  49. Saputra, W.; Kirati, W.; Patzek, T.W. Generalized extreme value statistics, physical scaling and forecasts of gas production in the Haynesville shale. J. Nat. Gas Sci. Eng. 2021, 94, 104041. [Google Scholar] [CrossRef]
  50. Patzek, T.; Male, F.; Marder, M. A simple model of gas production from hydrofractured horizontal wells in shales. AAPG Bull. 2014, 98, 2507–2529. [Google Scholar] [CrossRef]
  51. Patzek, T.W.; Saputra, W.; Kirati, W. A Simple Physics-Based Model Predicts Oil Production from Thousands of Horizontal Wells in Shales. In Proceedings of the SPE Annual Technical Conference and Exhibition, San Antonio, TX, USA, 9–11 October 2017; Society of Petroleum Engineers: San Antonio, TX, USA, 2017; p. 26. [Google Scholar] [CrossRef] [Green Version]
  52. Saputra, W.; Kirati, W.; Patzek, T. Generalized Extreme Value Statistics, Physical Scaling and Forecasts of Oil Production in the Bakken Shale. Energies 2019, 12, 3641. [Google Scholar] [CrossRef] [Green Version]
  53. Al-Mulhim, N.I.; Korosa, M.; Ahmed, A.; Hakami, A.; Sadykov, A.; Baki, S.; Asiri, K.S.; Al Ruwaished, A. Saudi Arabia’s Emerging Unconventional Carbonate Shale Resources: Moving to Horizontals with an Integrated Engineering and Geosciences Approach. In Proceedings of the SPE Asia Pacific Unconventional Resources Conference and Exhibition, Brisbane, Australia, 9–11 November 2015; Society of Petroleum Engineers: Brisbane, Australia, 2015; p. 15. [Google Scholar] [CrossRef]
  54. Yu, W.; Hu, X.; Liu, M.; Wang, W. Investigation of the Effect of Natural Fractures on Multiple Shale-Gas Well Performance Using Non-Intrusive EDFM Technology. Energies 2019, 12, 932. [Google Scholar] [CrossRef] [Green Version]
  55. Liao, K.; Zhang, S.; Ma, X.; Yushi, Z. Numerical Investigation of Fracture Compressibility and Uncertainty on Water-Loss and Production Performance in Tight Oil Reservoirs. Energies 2019, 12, 1189. [Google Scholar] [CrossRef] [Green Version]
  56. Shar, M.; Abro, W.; Mahesar, A.; Lee, K. Simulation Study to Evaluate the Impact of Fracture Parameters on Shale Gas Productivity. Mehran Univ. Res. J. Eng. Technol. 2020, 39, 432–442. [Google Scholar] [CrossRef]
  57. Ivanova, A.; Mitiurev, N.; Cheremisin, A.; Orekhov, A.; Kamyshinsky, R.; Vasiliev, A. Characterization of Organic Layer in Oil Carbonate Reservoir Rocks and its Effect on Microscale Wetting Properties. Sci. Rep. 2019, 9, 10667. [Google Scholar] [CrossRef] [PubMed] [Green Version]
  58. Ojha, S.P.; Misra, S.; Sinha, A.; Dang, S.; Tinni, A.; Sondergeld, C.; Rai, C. Relative Permeability and Residual Saturation Estimates for Organic-Rich Shale Samples from Bakken, Wolfcamp, Eagle Ford and Woodford Formations. In Proceedings of the SPE Annual Technical Conference and Exhibition, San Antonio, TX, USA, 9–11 October 2017; Society of Petroleum Engineers: San Antonio, TX, USA, 2017; p. 17. [Google Scholar] [CrossRef]
  59. Zoback, M.; Barton, C.; Brudy, M.; Castillo, D.; Finkbeiner, T.; Grollimund, B.; Moos, D.; Peska, P.; Ward, C.; Wiprut, D. Determination of stress orientation and magnitude in deep wells. Int. J. Rock Mech. Min. Sci. 2003, 40, 1049–1076. [Google Scholar] [CrossRef]
  60. Xiao, W.; Li, T.; Li, M.; Zhao, J.; Zheng, L.; Li, L. Evaluation of the stress sensitivity in tight reservoirs. Pet. Explor. Dev. 2016, 43, 115–123. [Google Scholar] [CrossRef]
  61. Dou, H.; Zhang, H.; Yao, S.; Sun, D.Z.T.; Ma, S.; Wang, X. Measurement and evaluation of the stress sensitivity in tight reservoirs. Pet. Explor. Dev. 2016, 43, 1116–1123. [Google Scholar] [CrossRef]
  62. Wang, H.; Ji, B.; Lv, C.; Zhang, L.; Li, X.; Cui, C.; Yu, H.; Nie, J. The stress sensitivity of permeability in tight oil reservoirs. Energy Explor. Exploit. 2019, 37, 1364–1376. [Google Scholar] [CrossRef]
  63. Aguilera, R. Effect of Fracture Compressibility on Gas-in-Place Calculations of Stress-Sensitive Naturally Fractured Reservoirs. In Proceedings of the SPE Unconventional Resources Conference/Gas Technology Symposium, Calgary, AB, Canada, 15–17 May 2006. [Google Scholar] [CrossRef]
  64. Zheng, S.; Manchanda, R.; Sharma, M.M. Modeling Fracture Closure with Proppant Settling and Embedment during Shut-In and Production. SPE Drill. Complet. 2020, 35, 668–683. [Google Scholar] [CrossRef]
  65. Shiozawa, S.; McClure, M. Simulation of proppant transport with gravitational settling and fracture closure in a three-dimensional hydraulic fracturing simulator. J. Pet. Sci. Eng. 2016, 138, 298–314. [Google Scholar] [CrossRef] [Green Version]
  66. Wang, J.; Elsworth, D. Role of proppant distribution on the evolution of hydraulic fracture conductivity. J. Pet. Sci. Eng. 2018, 166, 249–262. [Google Scholar] [CrossRef]
  67. Zhang, W.; Thompson, K.E.; Reed, A.H.; Beenken, L. Relationship between packing structure and porosity in fixed beds of equilateral cylindrical particles. Chem. Eng. Sci. 2006, 61, 8060–8074. [Google Scholar] [CrossRef]
  68. Chunlou, L.; LaFollette, R.; Sookprasong, A.; Wang, S. Characterization of Hydraulic-Fracture Geometry in Shale-Gas Reservoirs. J. Pet. Technol. 2014, 66, 125–128. [Google Scholar] [CrossRef]
  69. Nandlal, K.; Weijermars, R. Drained rock volume around hydraulic fractures in porous media: Planar fractures versus fractal networks. Pet. Sci. 2019, 16, 1064–1085. [Google Scholar] [CrossRef] [Green Version]
  70. Zhang, J.J. Applied Petroleum Geomechanics; Gulf Professional Publishing: Cambridge, MA, USA, 2019; pp. 441–481. [Google Scholar] [CrossRef]
  71. Zhou, J.; Xue, C. Experimental Investigation of Fracture Interaction between Natural Fractures and Hydraulic Fracture in Naturally Fractured Reservoirs. In Proceedings of the SPE Europec featured at EAGE Conference and Exhibition, Vienna, Austria, 23–26 May 2011. [Google Scholar] [CrossRef]
  72. Jalili, S.; Ahangari, K. Effects of different stress regimes on hydraulic fracture geometry: A particle flow code approach. Innov. Infrastruct. Solut. 2017, 2. [Google Scholar] [CrossRef] [Green Version]
  73. Hubbert, M.K.; Willis, D.G. Mechanics Of Hydraulic Fracturing. Trans. AIME 1957, 210, 153–168. [Google Scholar] [CrossRef]
  74. Guo, T.; Zhang, S.; Zou, Y.; Xiao, B. Numerical simulation of hydraulic fracture propagation in shale gas reservoir. J. Nat. Gas Sci. Eng. 2015, 26, 847–856. [Google Scholar] [CrossRef]
  75. Lee, H.P.; Olson, J.E.; Holder, J.; Gale, J.F.W.; Myers, R.D. The interaction of propagating opening mode fractures with preexisting discontinuities in shale. J. Geophys. Res. Solid Earth 2015, 120, 169–181. [Google Scholar] [CrossRef]
  76. Tan, P.; Jin, Y.; Zhou, Y.; Hou, B.; Zhang, R.; Chang, Z.; Fan, M. Laboratory investigation of shale rock to identify fracture propagation in vertical direction to bedding. J. Geophys. Eng. 2018, 15. [Google Scholar] [CrossRef] [Green Version]
  77. Boggs, S., Jr. Carbonaceous Sedimentary Rocks, 2nd ed.; Cambridge University Press: Cambridge, MA, USA, 2009; pp. 527–555. [Google Scholar] [CrossRef]
  78. Weng, X.; Kresse, O.; Cohen, C.E.; Wu, R.; Gu, H. Modeling of Hydraulic Fracture Network Propagation in a Naturally Fractured Formation. In Proceedings of the SPE Hydraulic Fracturing Technology Conference, The Woodlands, TX, USA, 24–26 January 2011; Society of Petroleum Engineers: The Woodlands, TX, USA, 2011; p. 18. [Google Scholar] [CrossRef]
  79. Cooke, M.L.; Underwood, C.A. Fracture termination and step-over at bedding interfaces due to frictional slip and interface opening. J. Struct. Geol. 2001, 23, 223–238. [Google Scholar] [CrossRef]
  80. Huang, B.; Liu, J. Experimental Investigation of the Effect of Bedding Planes on Hydraulic Fracturing Under True Triaxial Stress. Rock Mech. Rock Eng. 2017, 50, 2627–2643. [Google Scholar] [CrossRef]
  81. Rueda, J.; Valbuena, J.; Al-Momen, A.; Al-Mulhim, N. Applying Rate Transient Analysis (RTA) to Assist Fracturing Technique Selection in Unconventional Wells in Saudi Arabia. In Proceedings of the SPE/AAPG/SEG Unconventional Resources Technology Conference, Denver, CO, USA, 22–24 July 2019; Unconventional Resources Technology Conference: Denver, CO, USA, 2019; p. 10. [Google Scholar] [CrossRef]
  82. Rueda, J.; Valbuena, J.; Baki, S.; Mechkak, K.; Mohannad, M.; Momin, A.; Mulhim, N. Measuring Fracture Network Pressures during Fracturing and Production in Unconventionals in Saudi Arabia. In Proceedings of the SPE Middle East Oil and Gas Show and Conference, Manama, Bahrain, 18–21 March 2019; Society of Petroleum Engineers: Manama, Bahrain, 2019; p. 12. [Google Scholar] [CrossRef]
  83. Haider, S.; Saputra, W.; Patzek, T. The Key Factors That Determine the Economically Viable, Horizontal Hydrofractured Gas Wells in Mudrocks. Energies 2020, 13, 2348. [Google Scholar] [CrossRef]
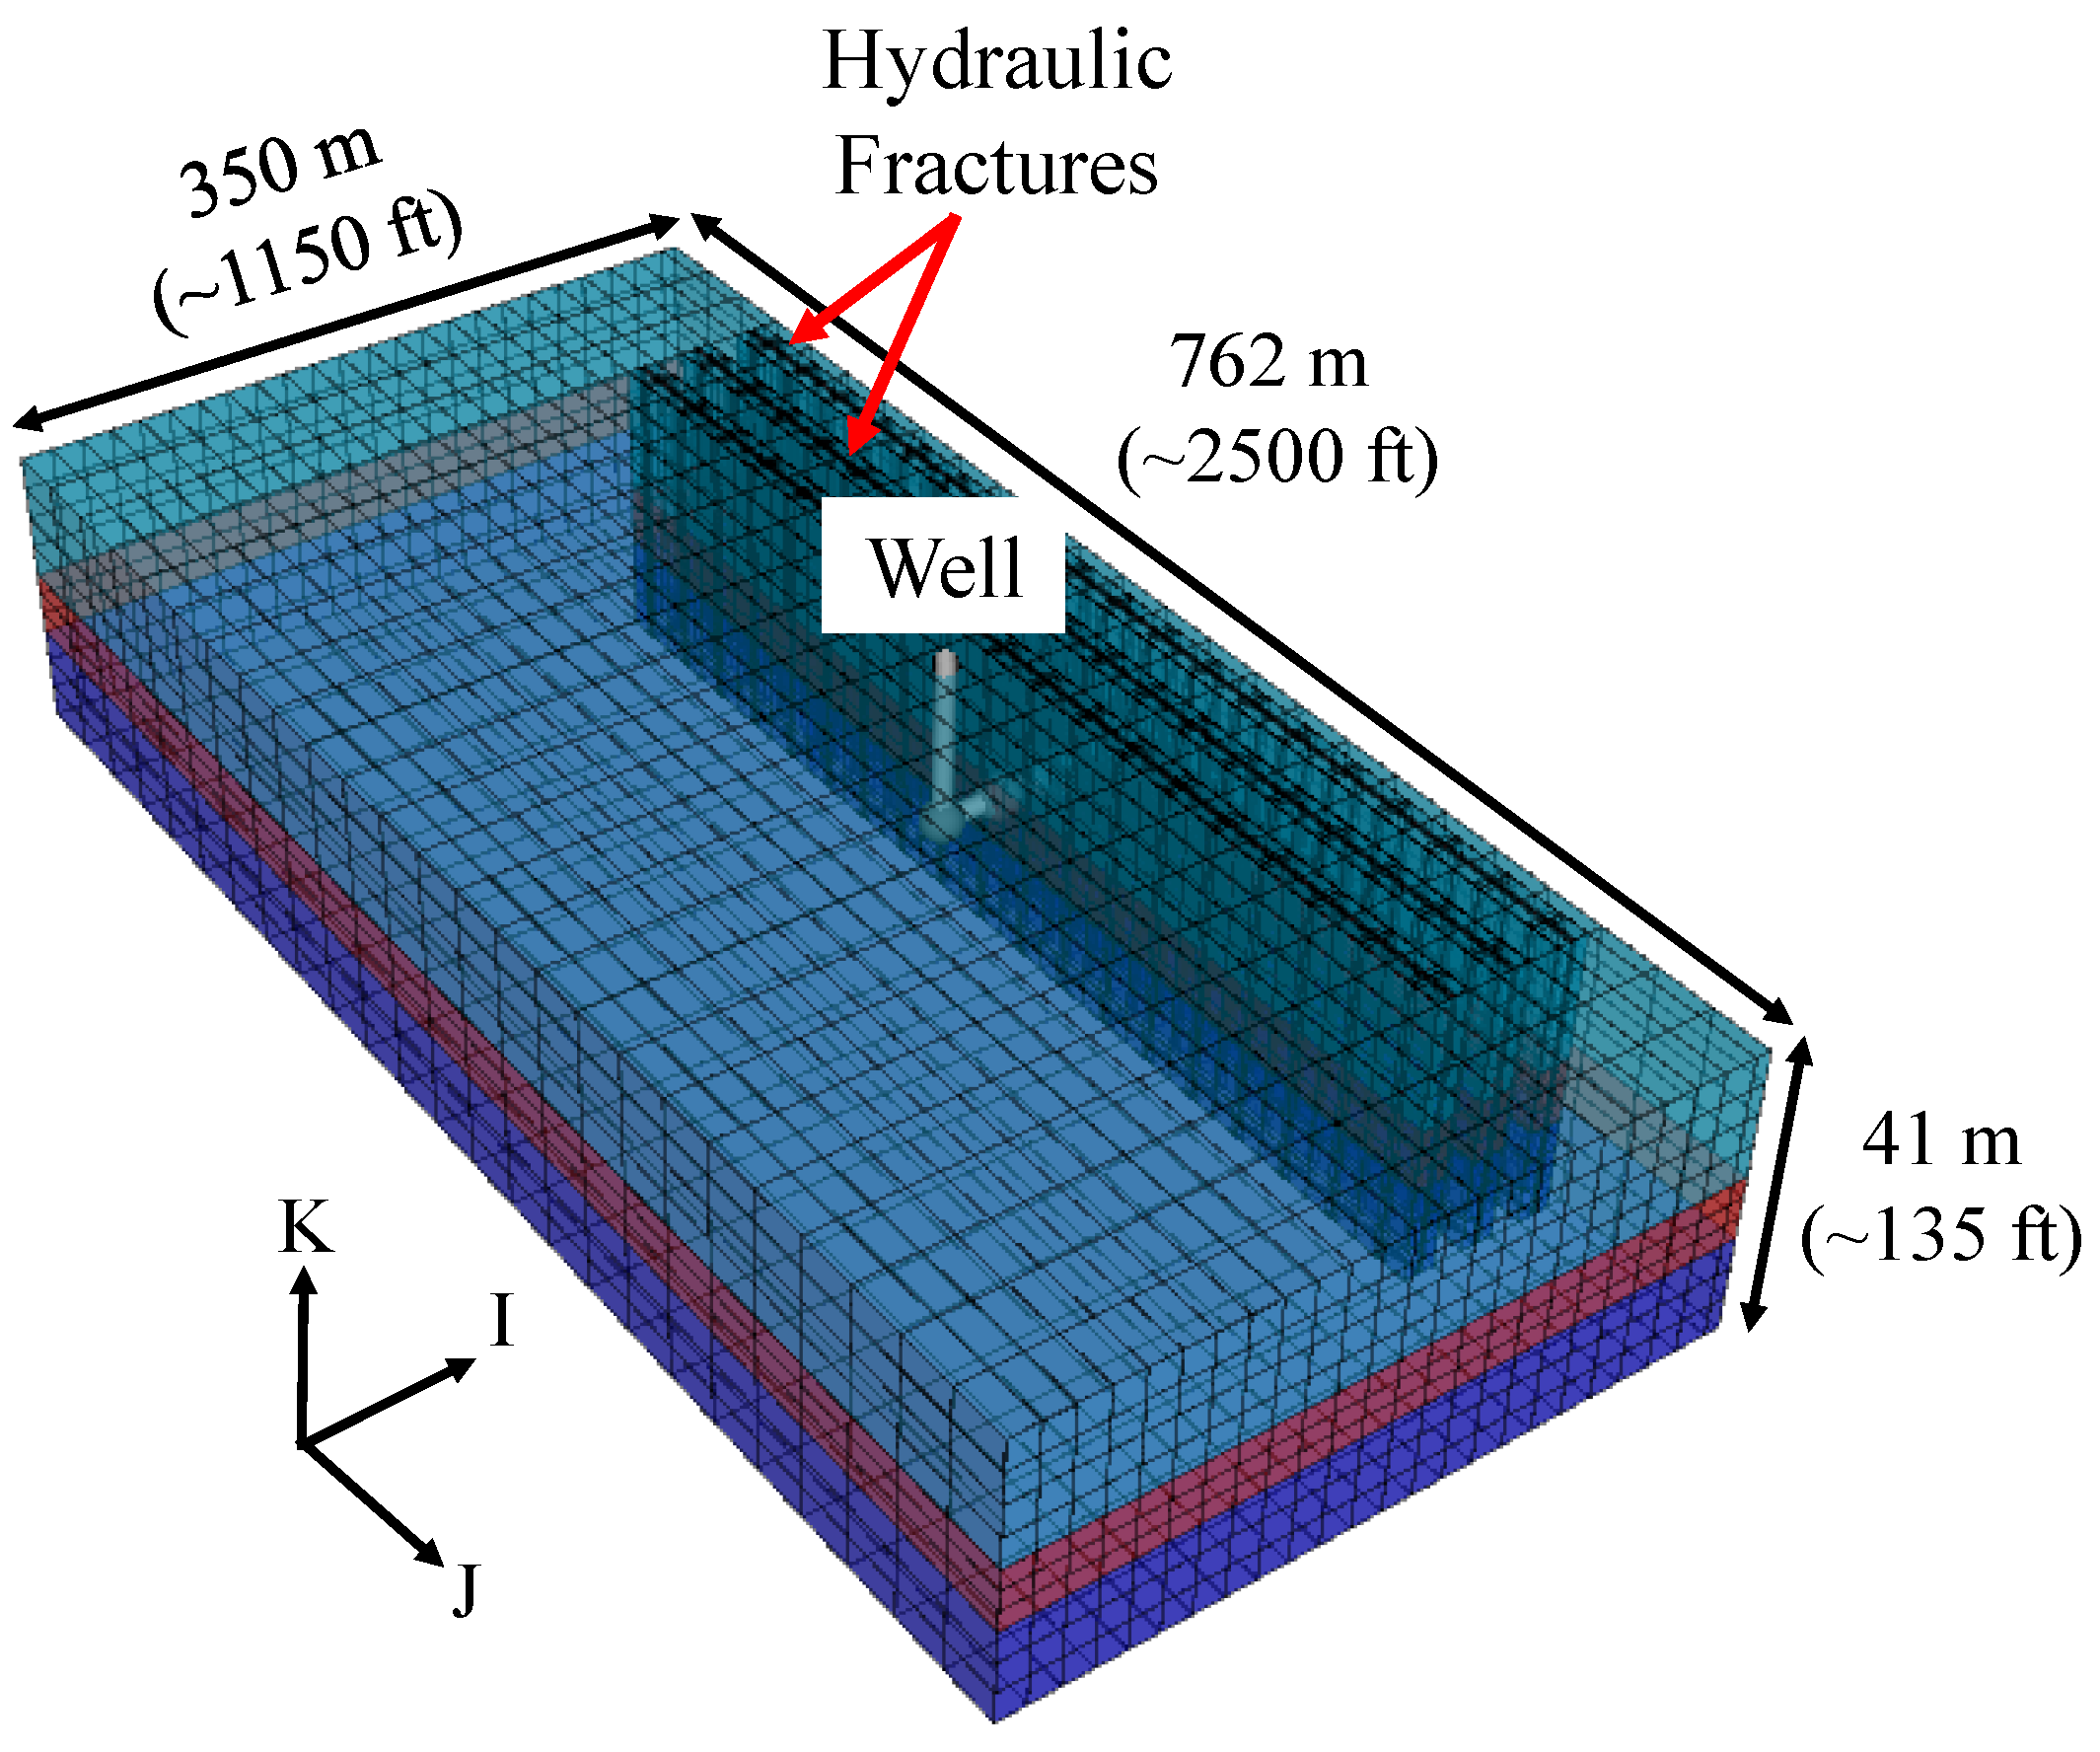
Figure 1. Reservoir model (CMG-IMEX).
Energies 14 07727 g001
Figure 2. Comparison between the multi-stage model (including 22 stages) and the single-stage model.
Energies 14 07727 g002
Figure 3. Water-Oil relative permeability curves. (a) Rock matrix relative permeability curves: solid curves represent the target zone and dashed curves the upper and lower zone (Up&Down). (b) Fracture relative permeability curves: solid curves represent the hydraulic fractures (HF), and dashed curves represent secondary fractures (SF).
Energies 14 07727 g003
Figure 4. Compaction curves for the propped (blue line) and the unpropped (red line) zone of the hydraulic fractures, (a) Porosity multipliers and (b) Permeability multipliers.
Energies 14 07727 g004
Figure 5. Reference numerical simulation model. (a) Cross-view of the model along the wellbore and (b) map view of the model.
Energies 14 07727 g005
Figure 6. Vertical hydraulic fractures with perpendicular secondary fractures. (a) Cross-view of the model along the wellbore and (b) map view of the model.
Energies 14 07727 g006
Figure 7. Schematic figure of an orthogonal fracture network. Adapted from: [78].
Energies 14 07727 g007
Figure 8. Vertical hydraulic fractures with horizontal bedding plane fractures. (a) Cross-view of the model along the wellbore and (b) map view of the model.
Energies 14 07727 g008
Figure 9. Schematic figure of the horizontal bedding plane fractures. Adapted from: [28,32].
Energies 14 07727 g009
Figure 10. Simulation case 1: 15 years of reservoir fluid production obtained by varying hydraulic fracture geometry. Fracture scenario #1 is the reference case, which has only three vertical hydraulic fractures (HF) (black line). Fracture scenario #2 has three vertical hydraulic fractures and eight orthogonal natural fractures (NF) (red line). Fracture scenario #3 has three vertical hydraulic fractures and two horizontal bedding planes (BP) (blue line). All the fracture scenarios have a uniform vertical hydraulic fracture permeability of 2000 mD.
Energies 14 07727 g010
Figure 11. Simulation case 2: 15 years of reservoir fluid production obtained by varying hydraulic fracture geometry. Fracture scenario #1 is the reference case, which only has three vertical hydraulic fractures (HF) (black line). Fracture scenario #2 has three vertical hydraulic fractures and eight orthogonal natural fractures (NF) (red line). Fracture scenario #3 has three vertical hydraulic fractures and two horizontal bedding planes (BP) (blue line). The fracture scenarios #1 and #2 have a vertical hydraulic fracture permeability of 2000 mD. Fracture scenario #3 has a vertical hydraulic fracture permeability reduced by 90% (200 mD).
Energies 14 07727 g011
Table 1. Reservoir horizon properties.
LayerThicknessInitial Water SaturationPorosityPermeability
[m][ft][fraction][fraction][mD]
Upper zone18600.580.053.1 × 10 5
Target zone9300.200.0714.0 × 10 5
Lower zone14450.600.042.0 × 10 5
Table 2. Shale play and fluid properties.
ParameterSI UnitField Unit
Reservoir temperature138 C280 F
Initial reservoir pressure (a)58.6 MPa8500 psi
Vertical-horizontal permeability ratio (kv/kh)0.10.1
Initial water saturation in the natural fracture network0.20.2
Reservoir compressibility (b)1.0 × 10 9 Pa−16.9 × 10 6 psi−1
Reservoir thickness41 m135 ft
Reservoir depth (c)3000 m10,000 ft
Natural fracture permeability (d)1.97 × 10 14 m2200 mD
Natural fracture aperture (d)0.03 mm0.0001 ft
Natural fracture porosity0.00000670.0000067
Number of stages (e)2222
Number of clusters per stage (e)33
Hydraulic fracture spacing (f)30.5 m100 ft
Hydraulic fracture permeability1.97 × 10 12 m22000 mD
Hydraulic fracture propped half-length (f)137 m450 ft
Hydraulic fracture unpropped half-length152 m500 ft
Hydraulic fracture aperture (f)9 mm0.031 ft
Oil bubble point pressure23.44 MPa3400 psi
Oil API density45.645.6
Oil density at stock tank conditions798.2 kg/m349.8 lbm/ft3
Gas specific gravity0.86510.8651
Water compressibility1.30 × 10 10 Pa−19.0 × 10 6 psi−1
Water density at stock tank conditions996.9 kg/m362.2 lbm/ft3
Based on: a [38,44,46], b [50,51,52], c [44,53], d [22,54,55,56], e [45,47,48,49], f [38,55,56].
Table 3. Simulation case 1: production comparison after 15 years between fracture scenarios #2 and #3, and the reference scenario #1. The reference fracture scenario comprises 3 vertical hydraulic fractures (HF), fracture scenario #2 has 3 vertical hydraulic fractures and 8 orthogonal natural fractures (NF), and fracture scenario #3 has 3 vertical hydraulic fractures and 2 horizontal bedding planes (BP). The permeability of vertical hydraulic fractures is assumed to be the same (2000 mD) in all three scenarios.
ParameterReference Fracture ScenarioFracture Scenario #2Fracture Scenario #3
Water rate peak [Bbl/d]18,99224,54611,666
Oil rate peak [Bbl/d]9311022807
Ultimate water production [MBbl]564491480
Ultimate oil production [MBbl]407374368
Recovery factor [%]8.57.77.6
Comparison with reference scenario
Water rate peak [%]-29−40
Oil rate peak [%]-10−13
Ultimate water production [%]-−13−15
Ultimate oil production [%]-−8−10
Table 4. Simulation case 2: production comparison after 15 years between fracture scenarios #2 and #3, and the reference fracture scenario #1. The reference scenario comprises 3 vertical hydraulic fractures (HF), fracture scenario #2 has 3 vertical hydraulic fractures and 8 orthogonal natural fractures (NF), and fracture scenario #3 has 3 vertical hydraulic fractures and 2 horizontal bedding planes (BP). In this case, vertical hydraulic fractures’ permeability is assumed to be the 2000 mD for scenarios #1 and #2. Scenario #3 has a vertical hydraulic fracture permeability of 200 mD.
ParameterReference Fracture ScenarioFracture Scenario #2Fracture Scenario #3
Water rate peak [Bbl/d]18,99224,5463027
Oil rate peak [Bbl/d]9311022414
Ultimate water production [MBbl]564491381
Ultimate oil production [MBbl]407374324
Recovery factor [%]8.57.76.7
Comparison with reference scenario
Water rate peak [%]-29−84
Oil rate peak [%]-10−55
Ultimate water production [%]-−13−32
Ultimate oil production [%]-−8−20
Publisher’s Note: MDPI stays neutral with regard to jurisdictional claims in published maps and institutional affiliations.