
Utilization of Thermally Activated Building System with Horizontal Ground Heat Exchanger Considering the Weather Conditions

Abstract
:1. Introduction
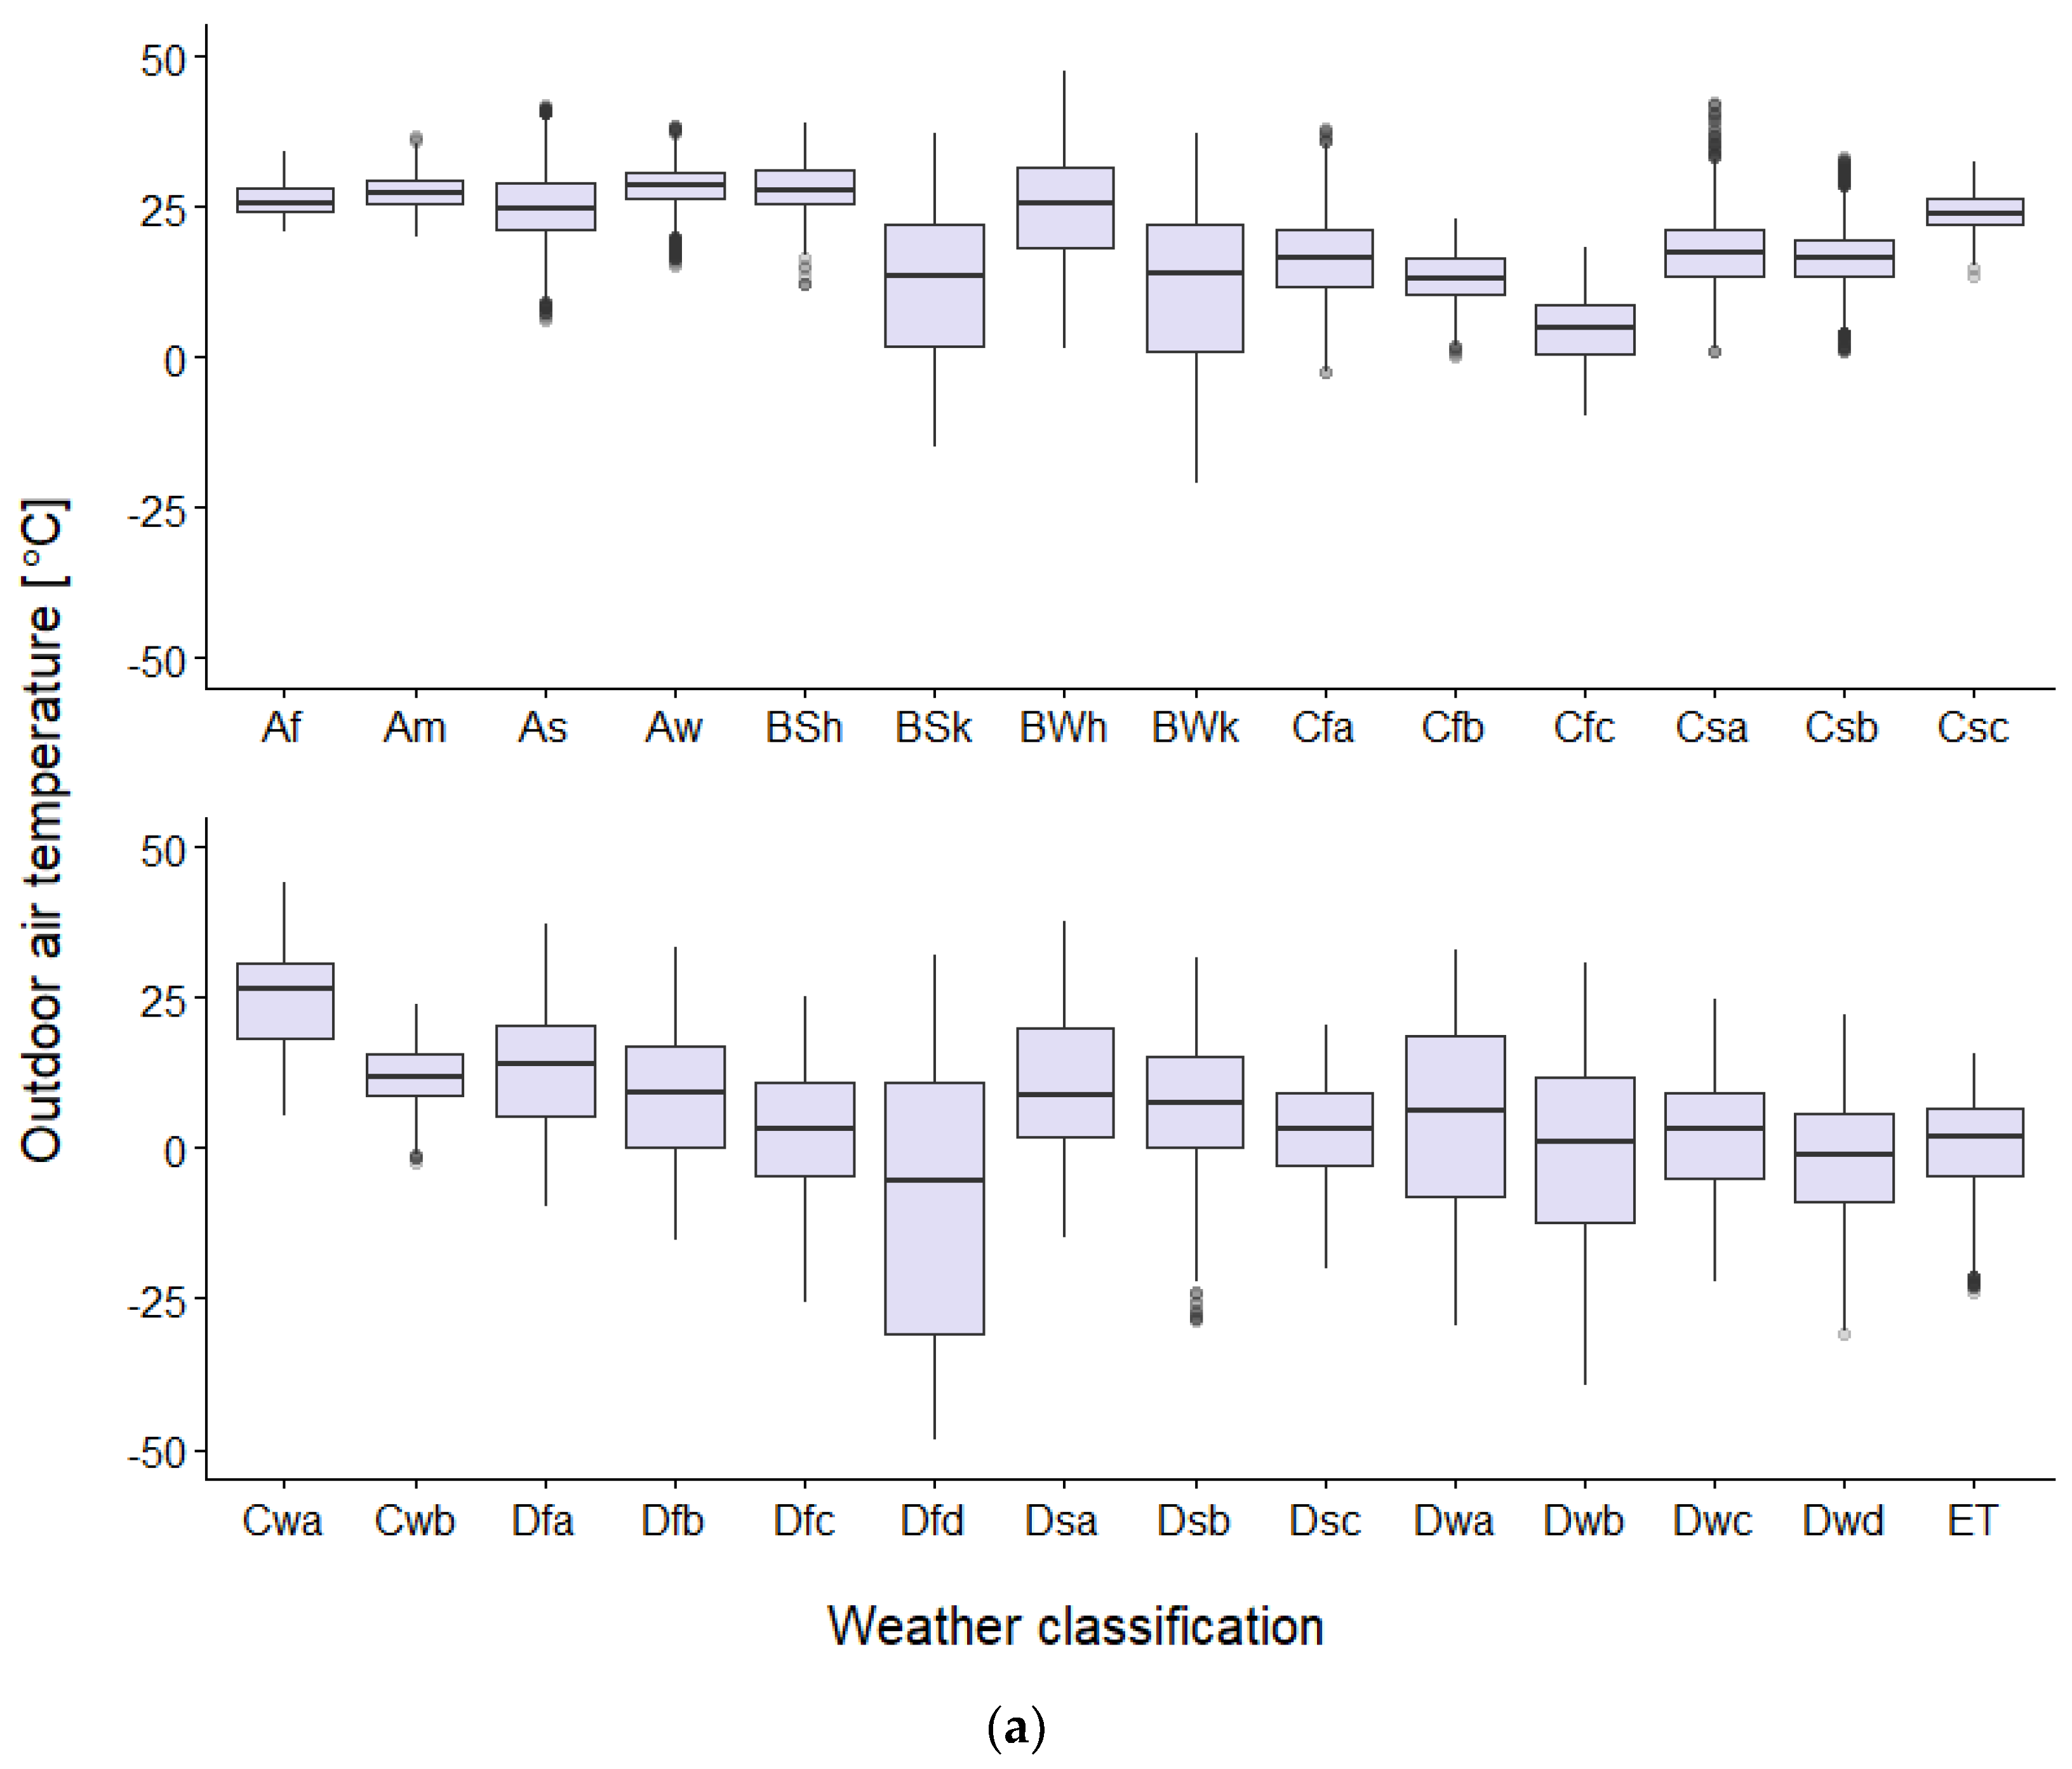
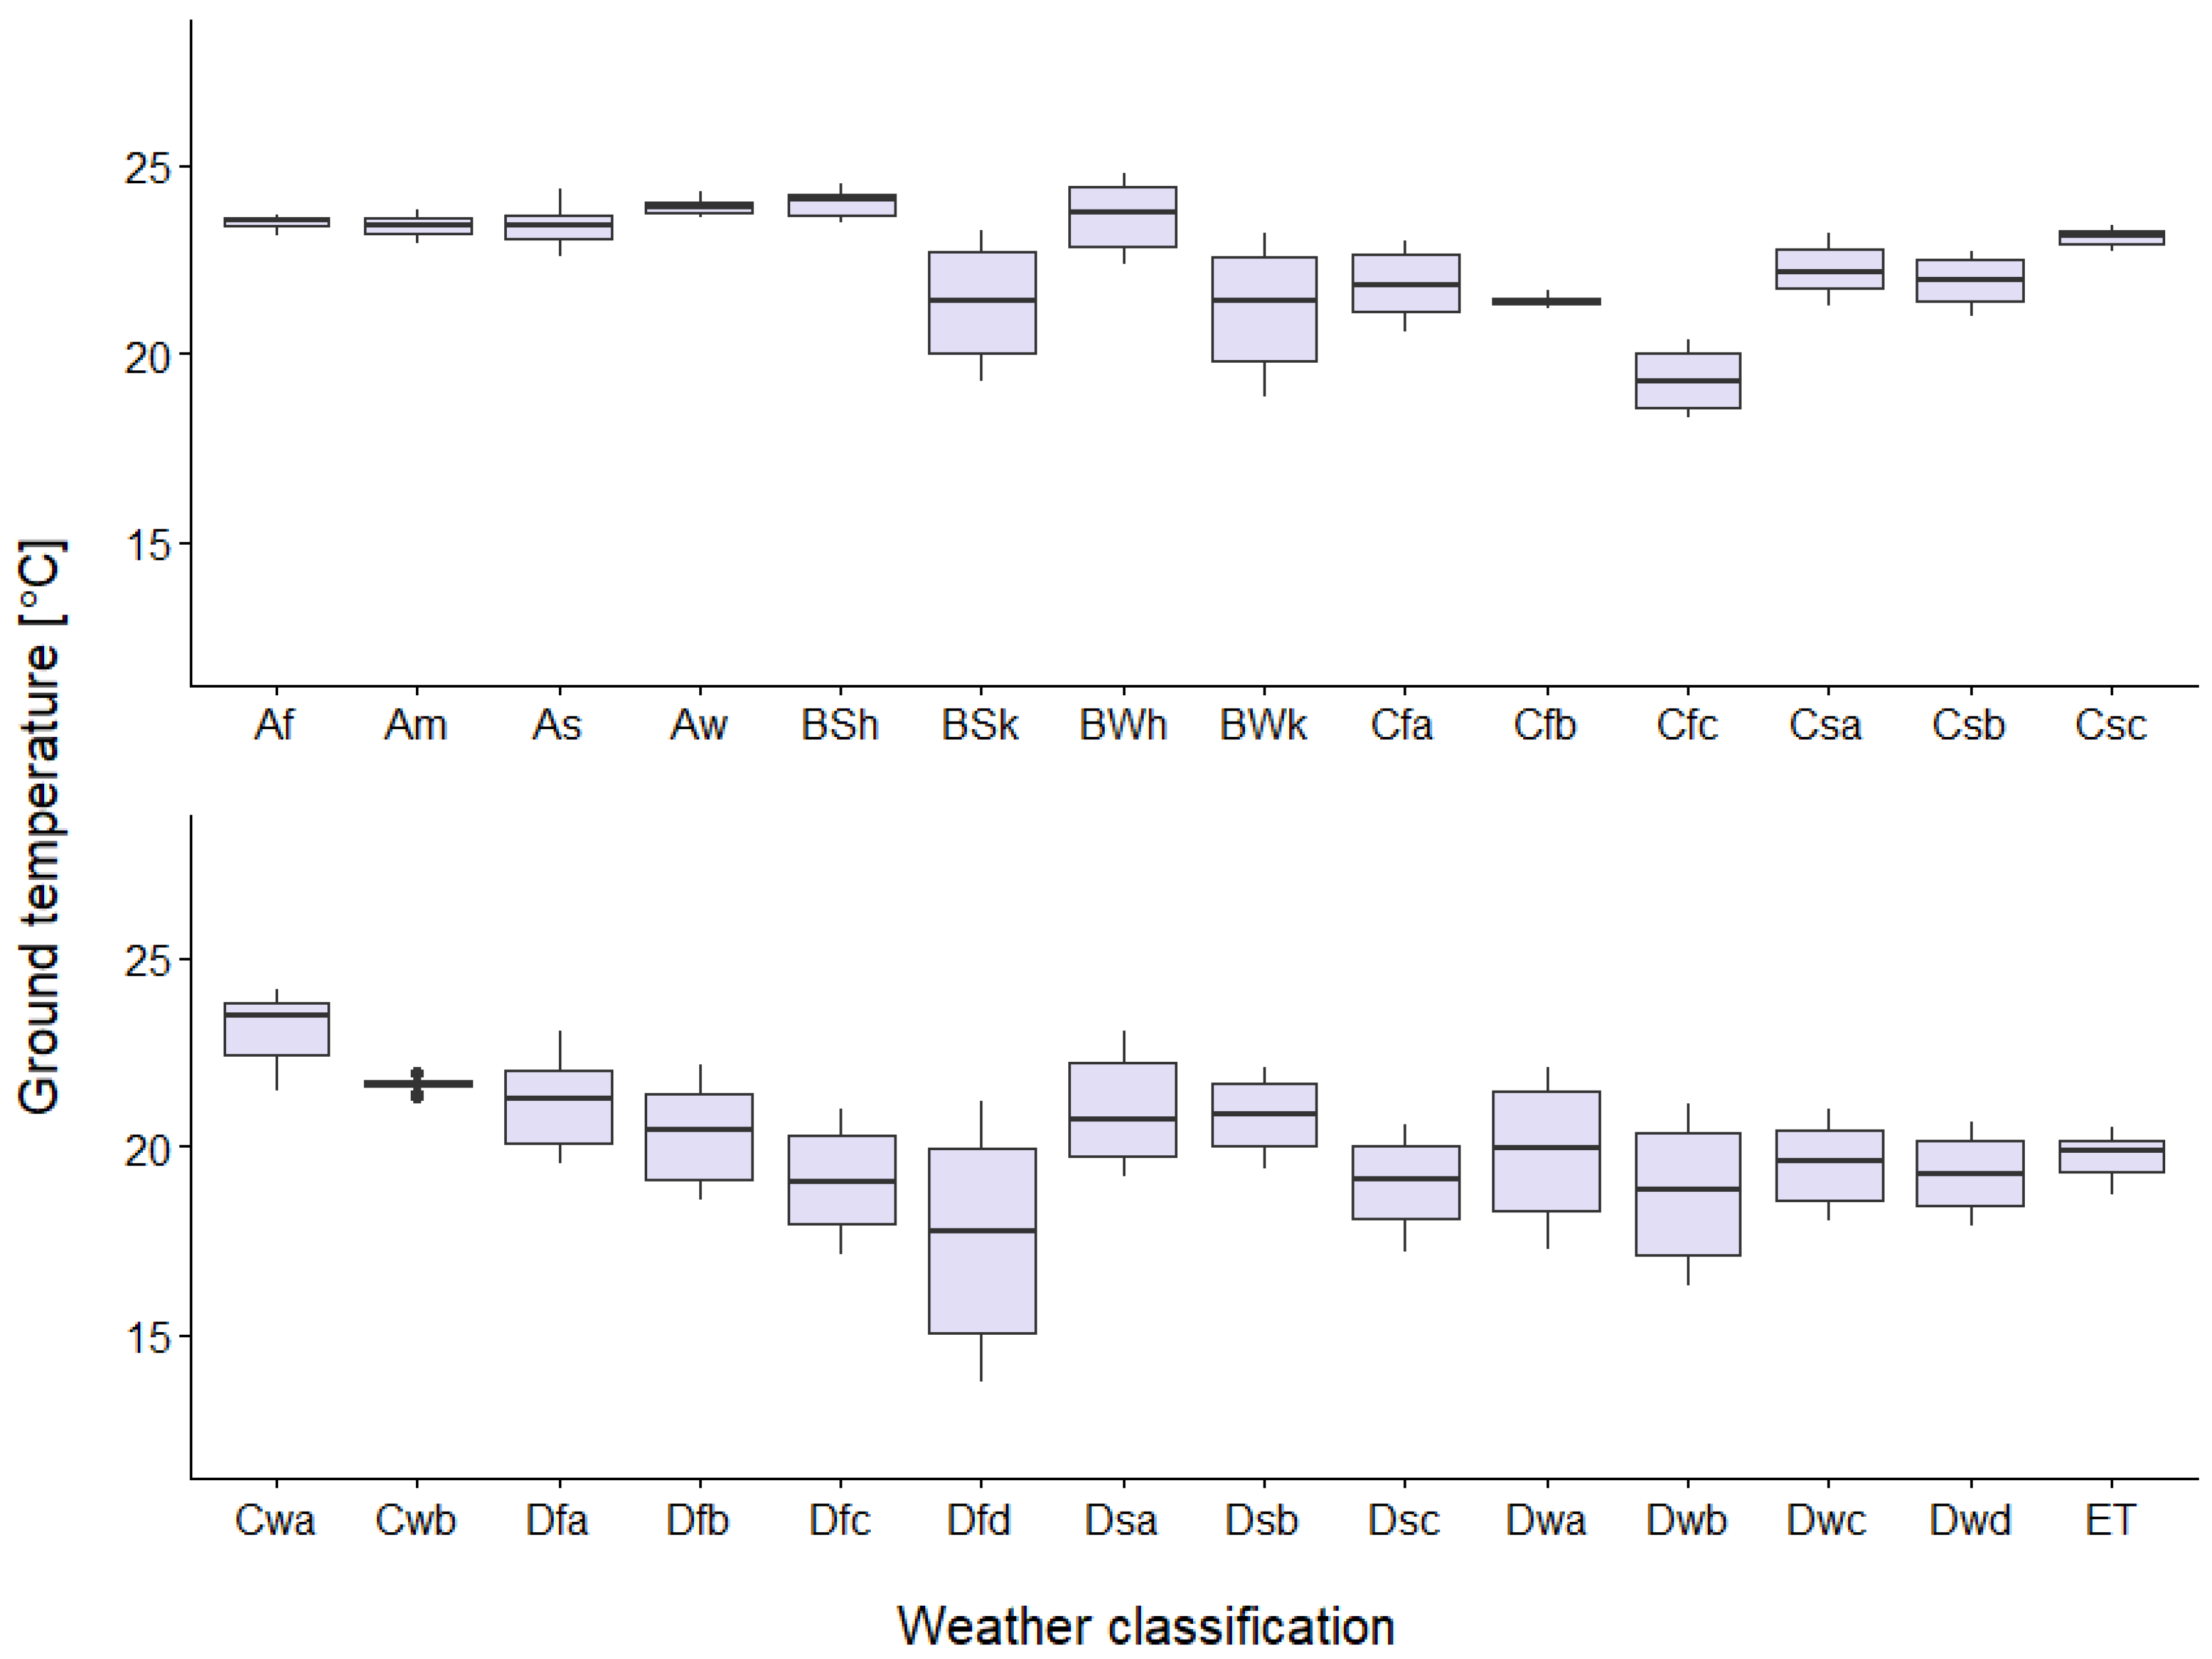
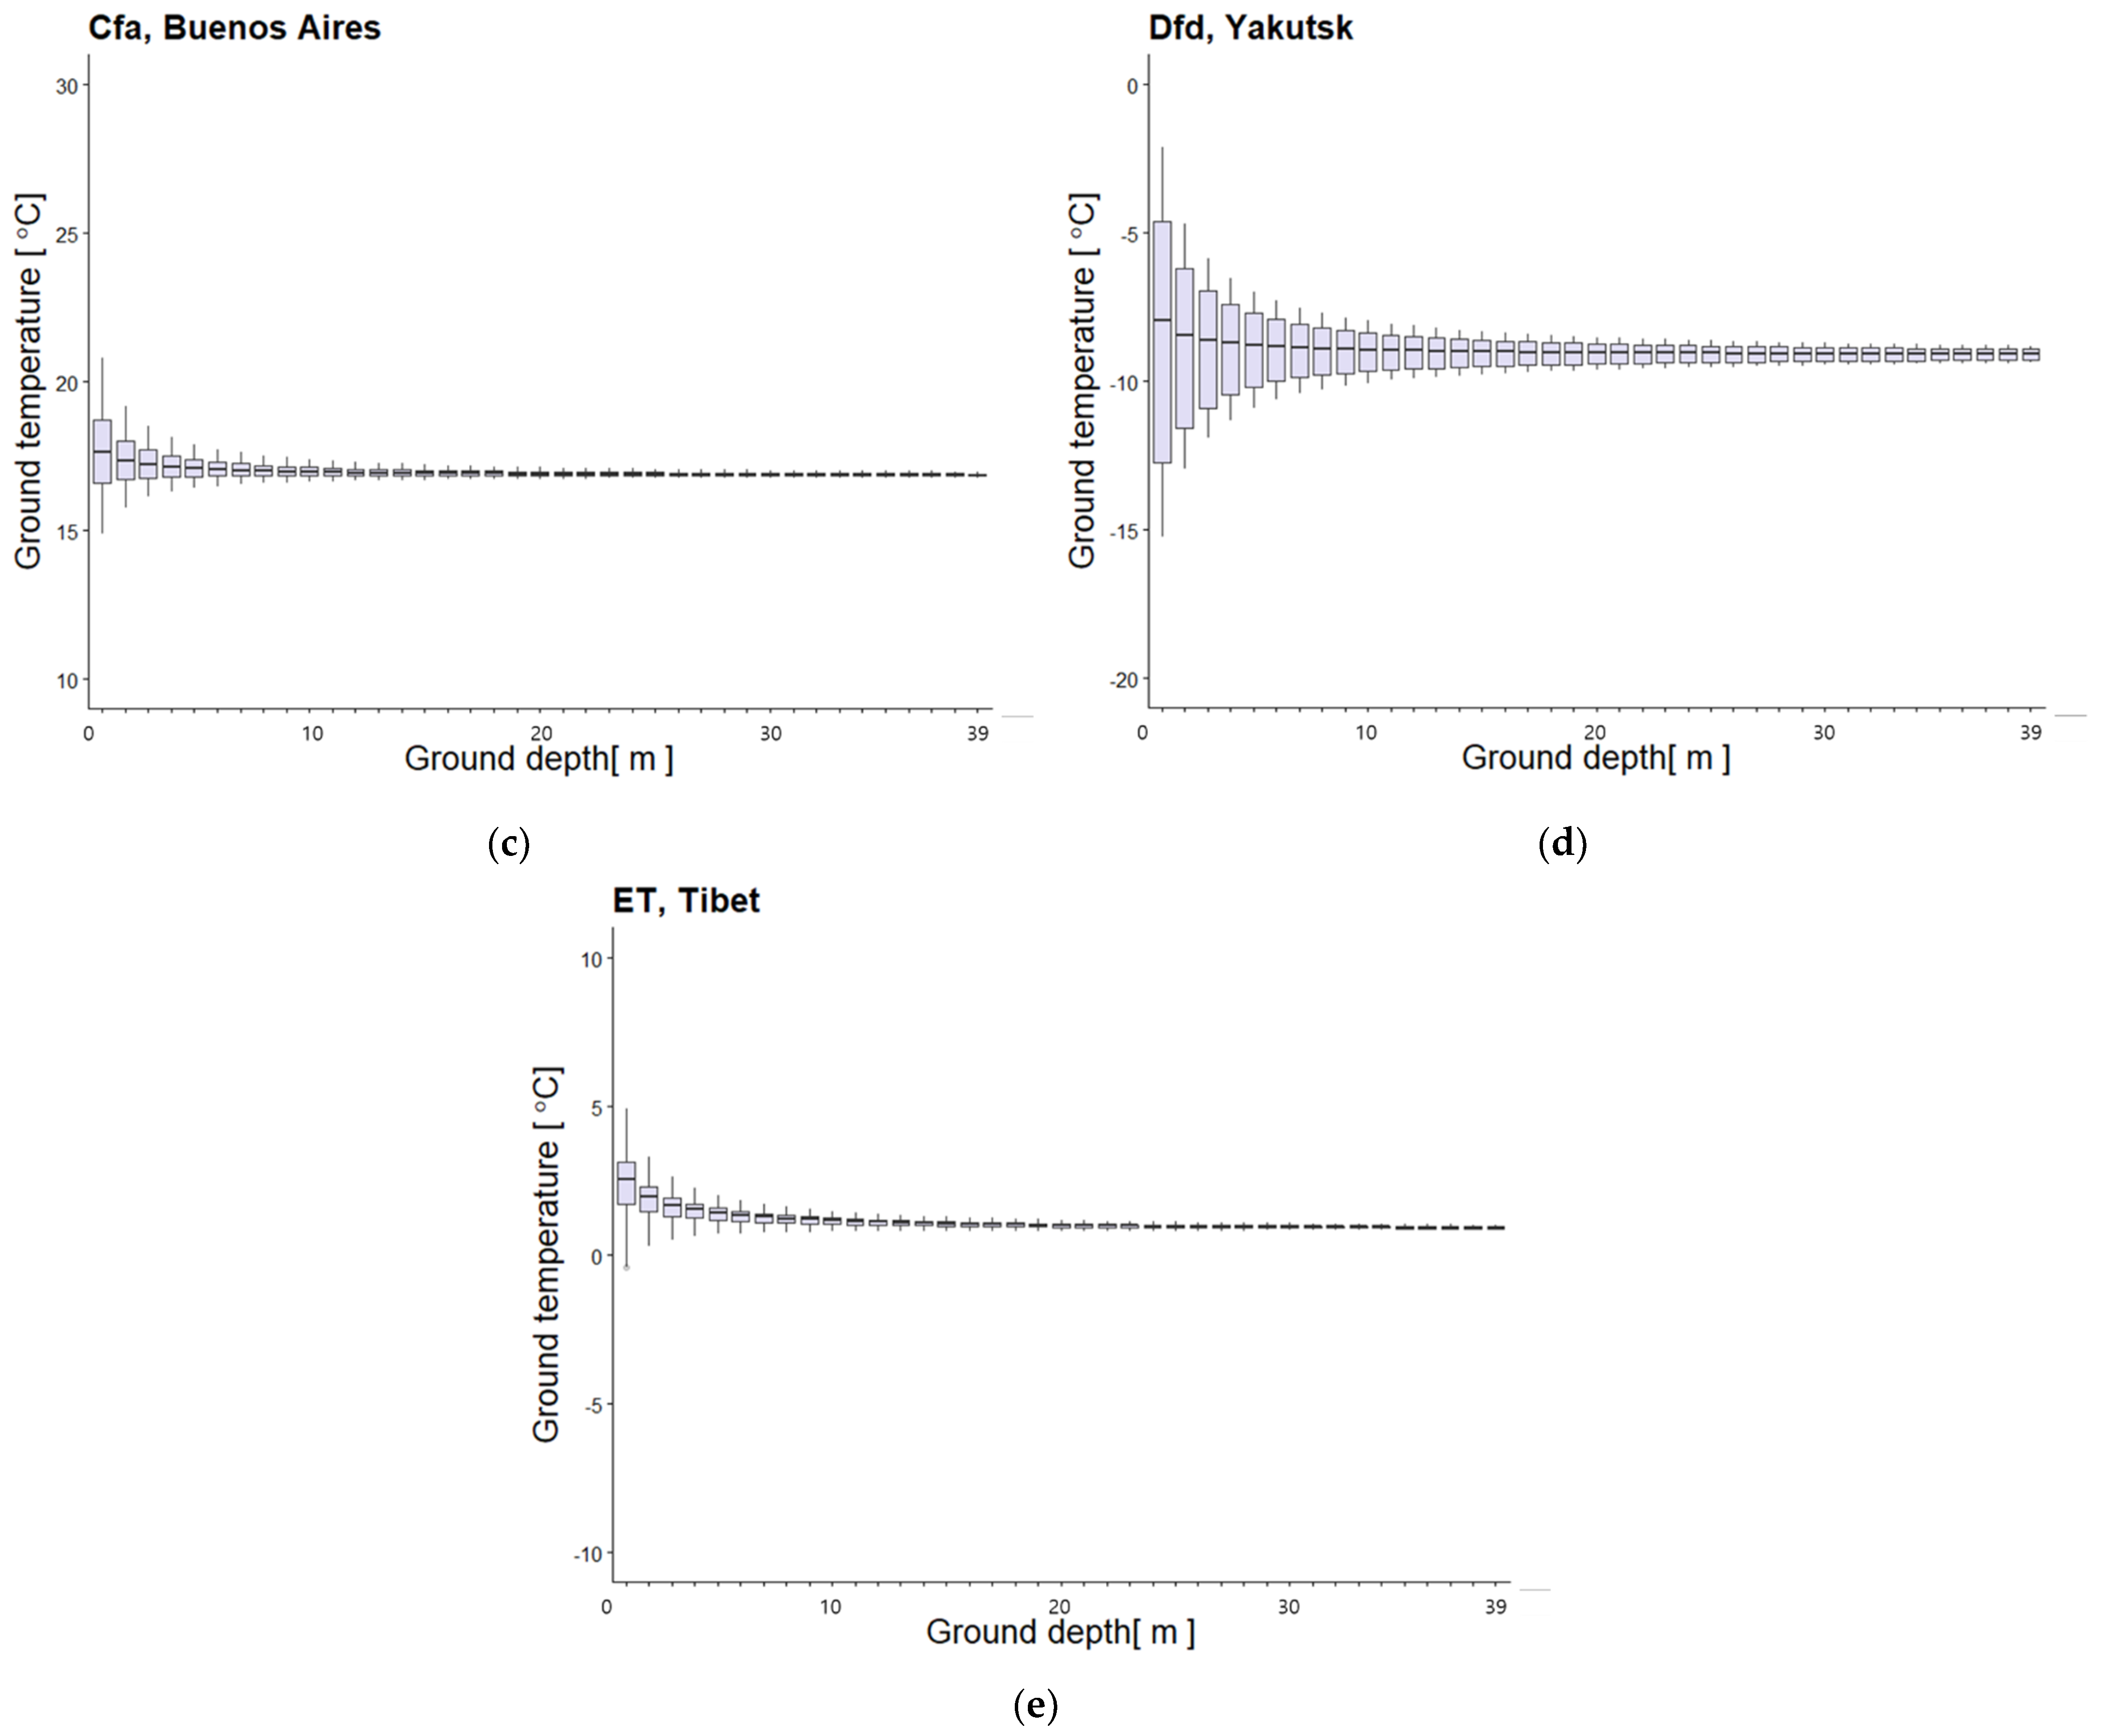
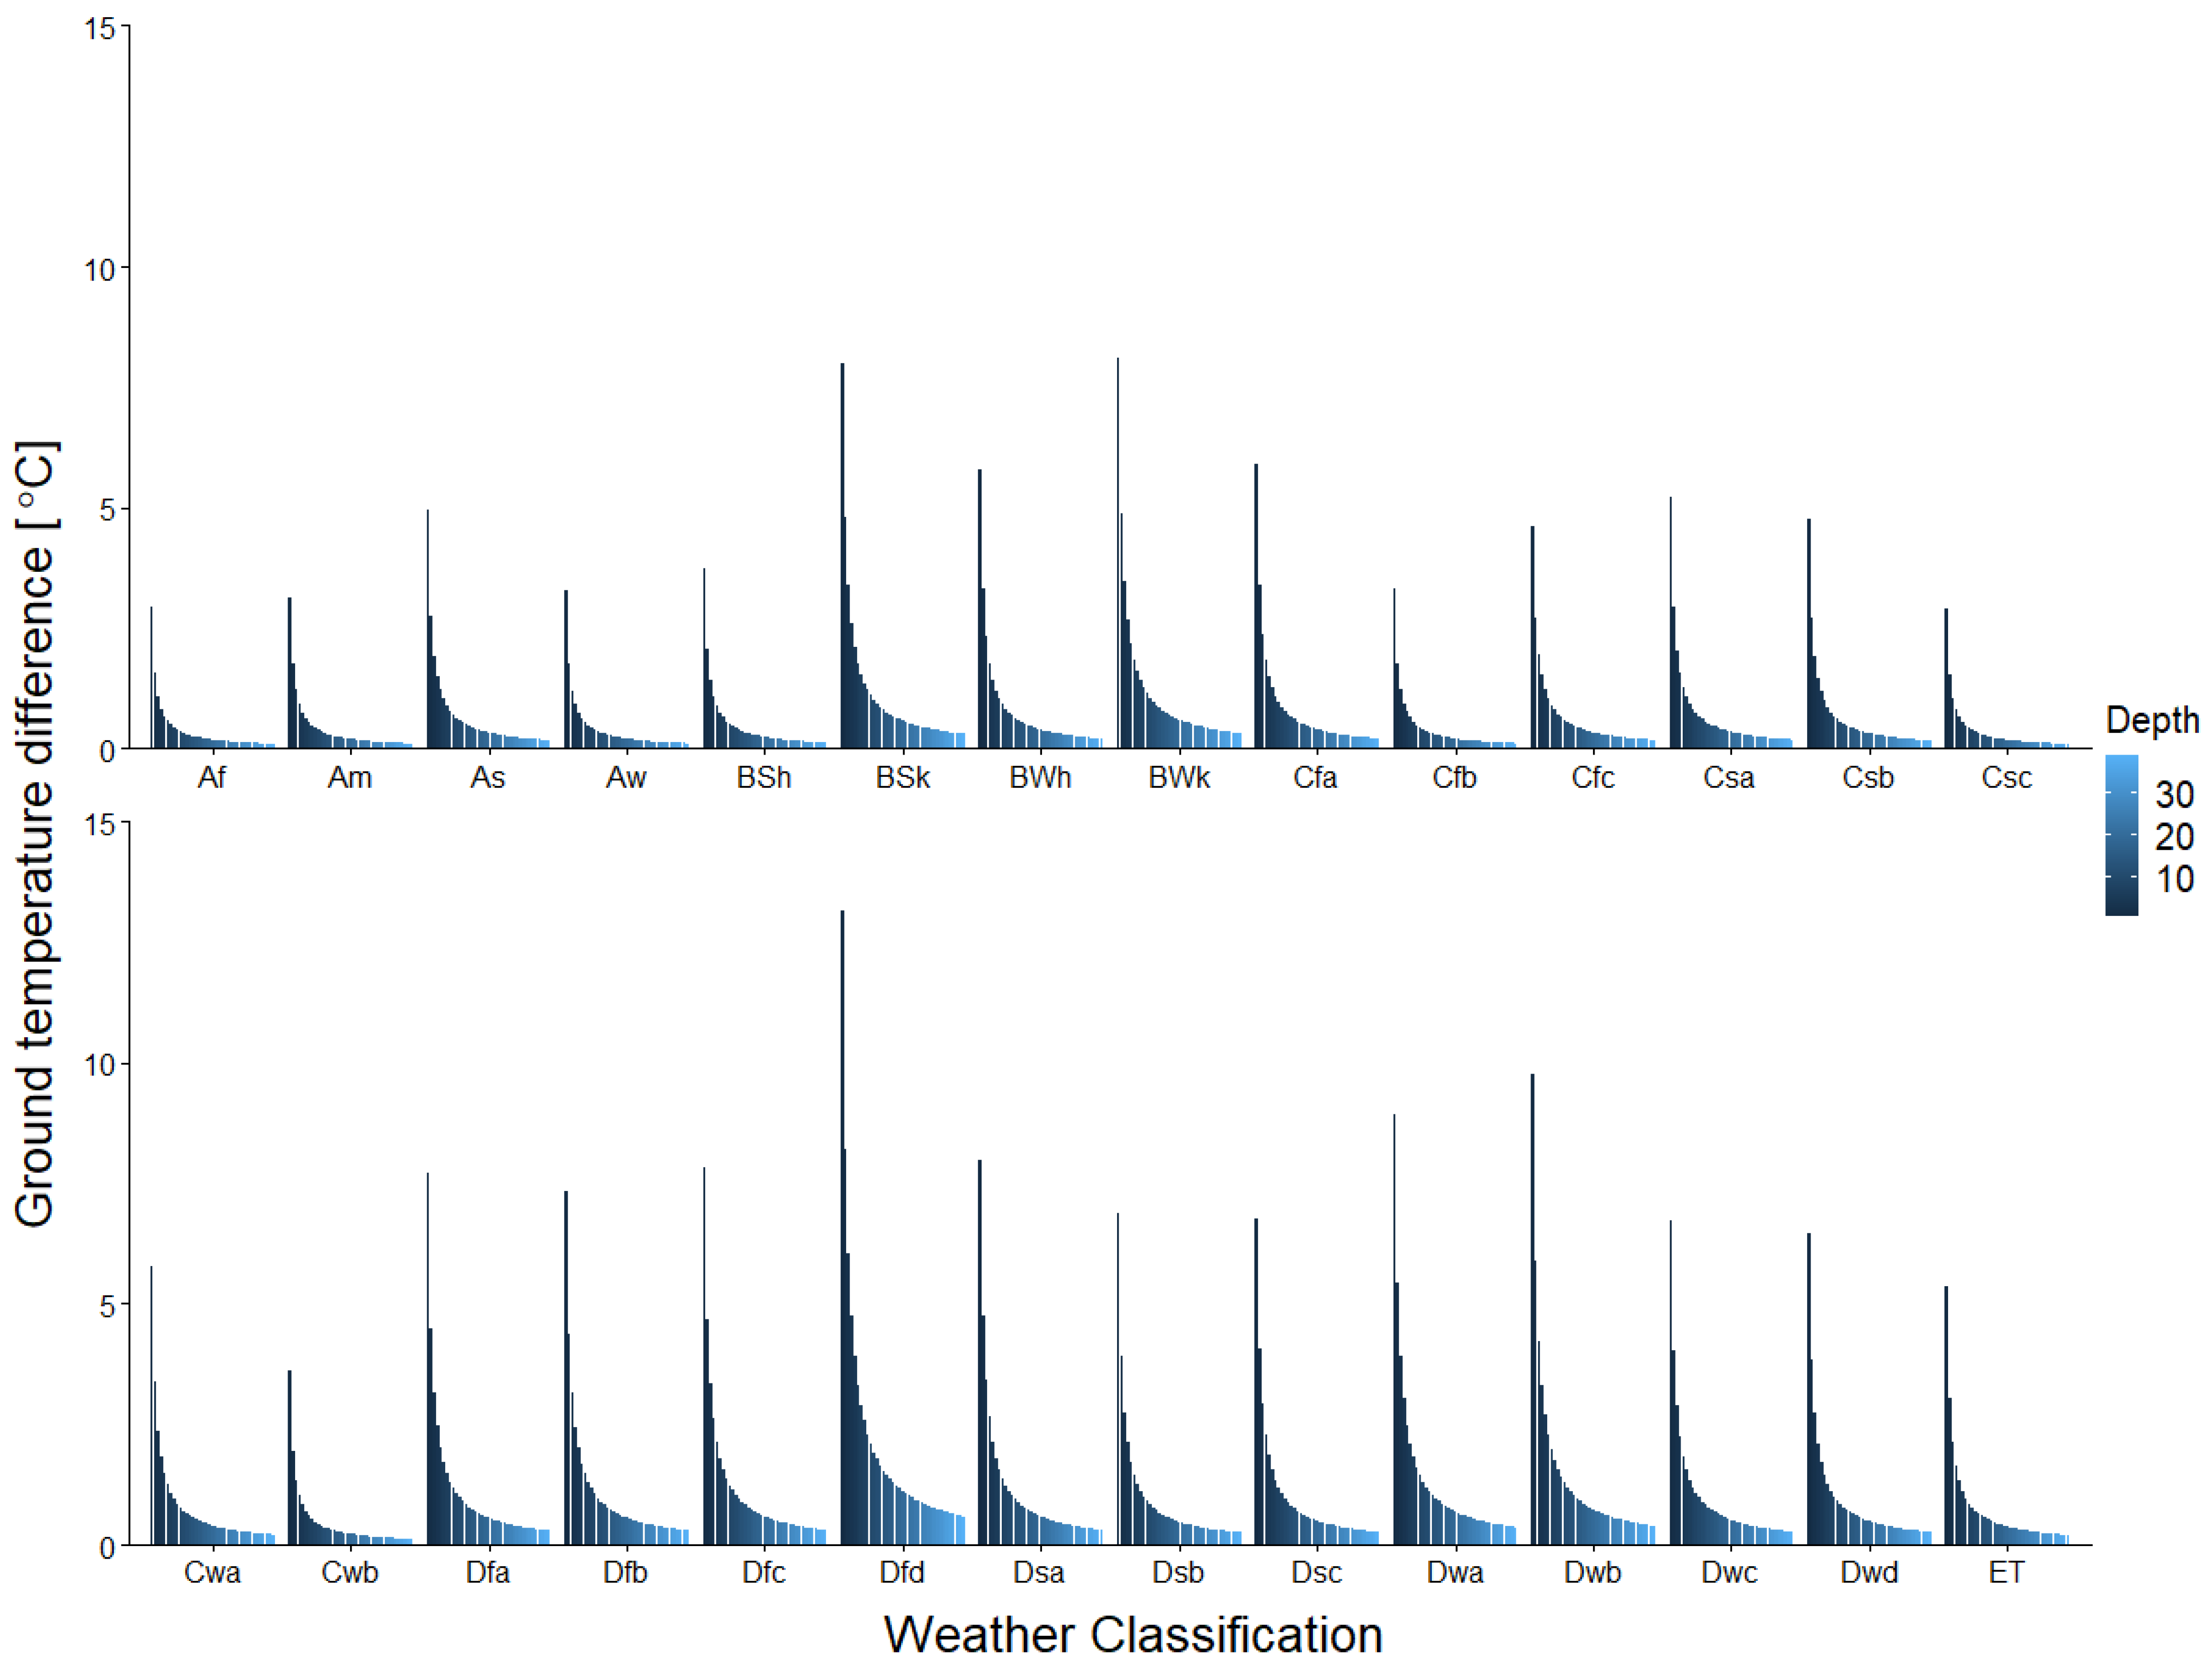
2. Analysis of Ground Temperature in Various Conditions
2.1. Selection of Weather Locations
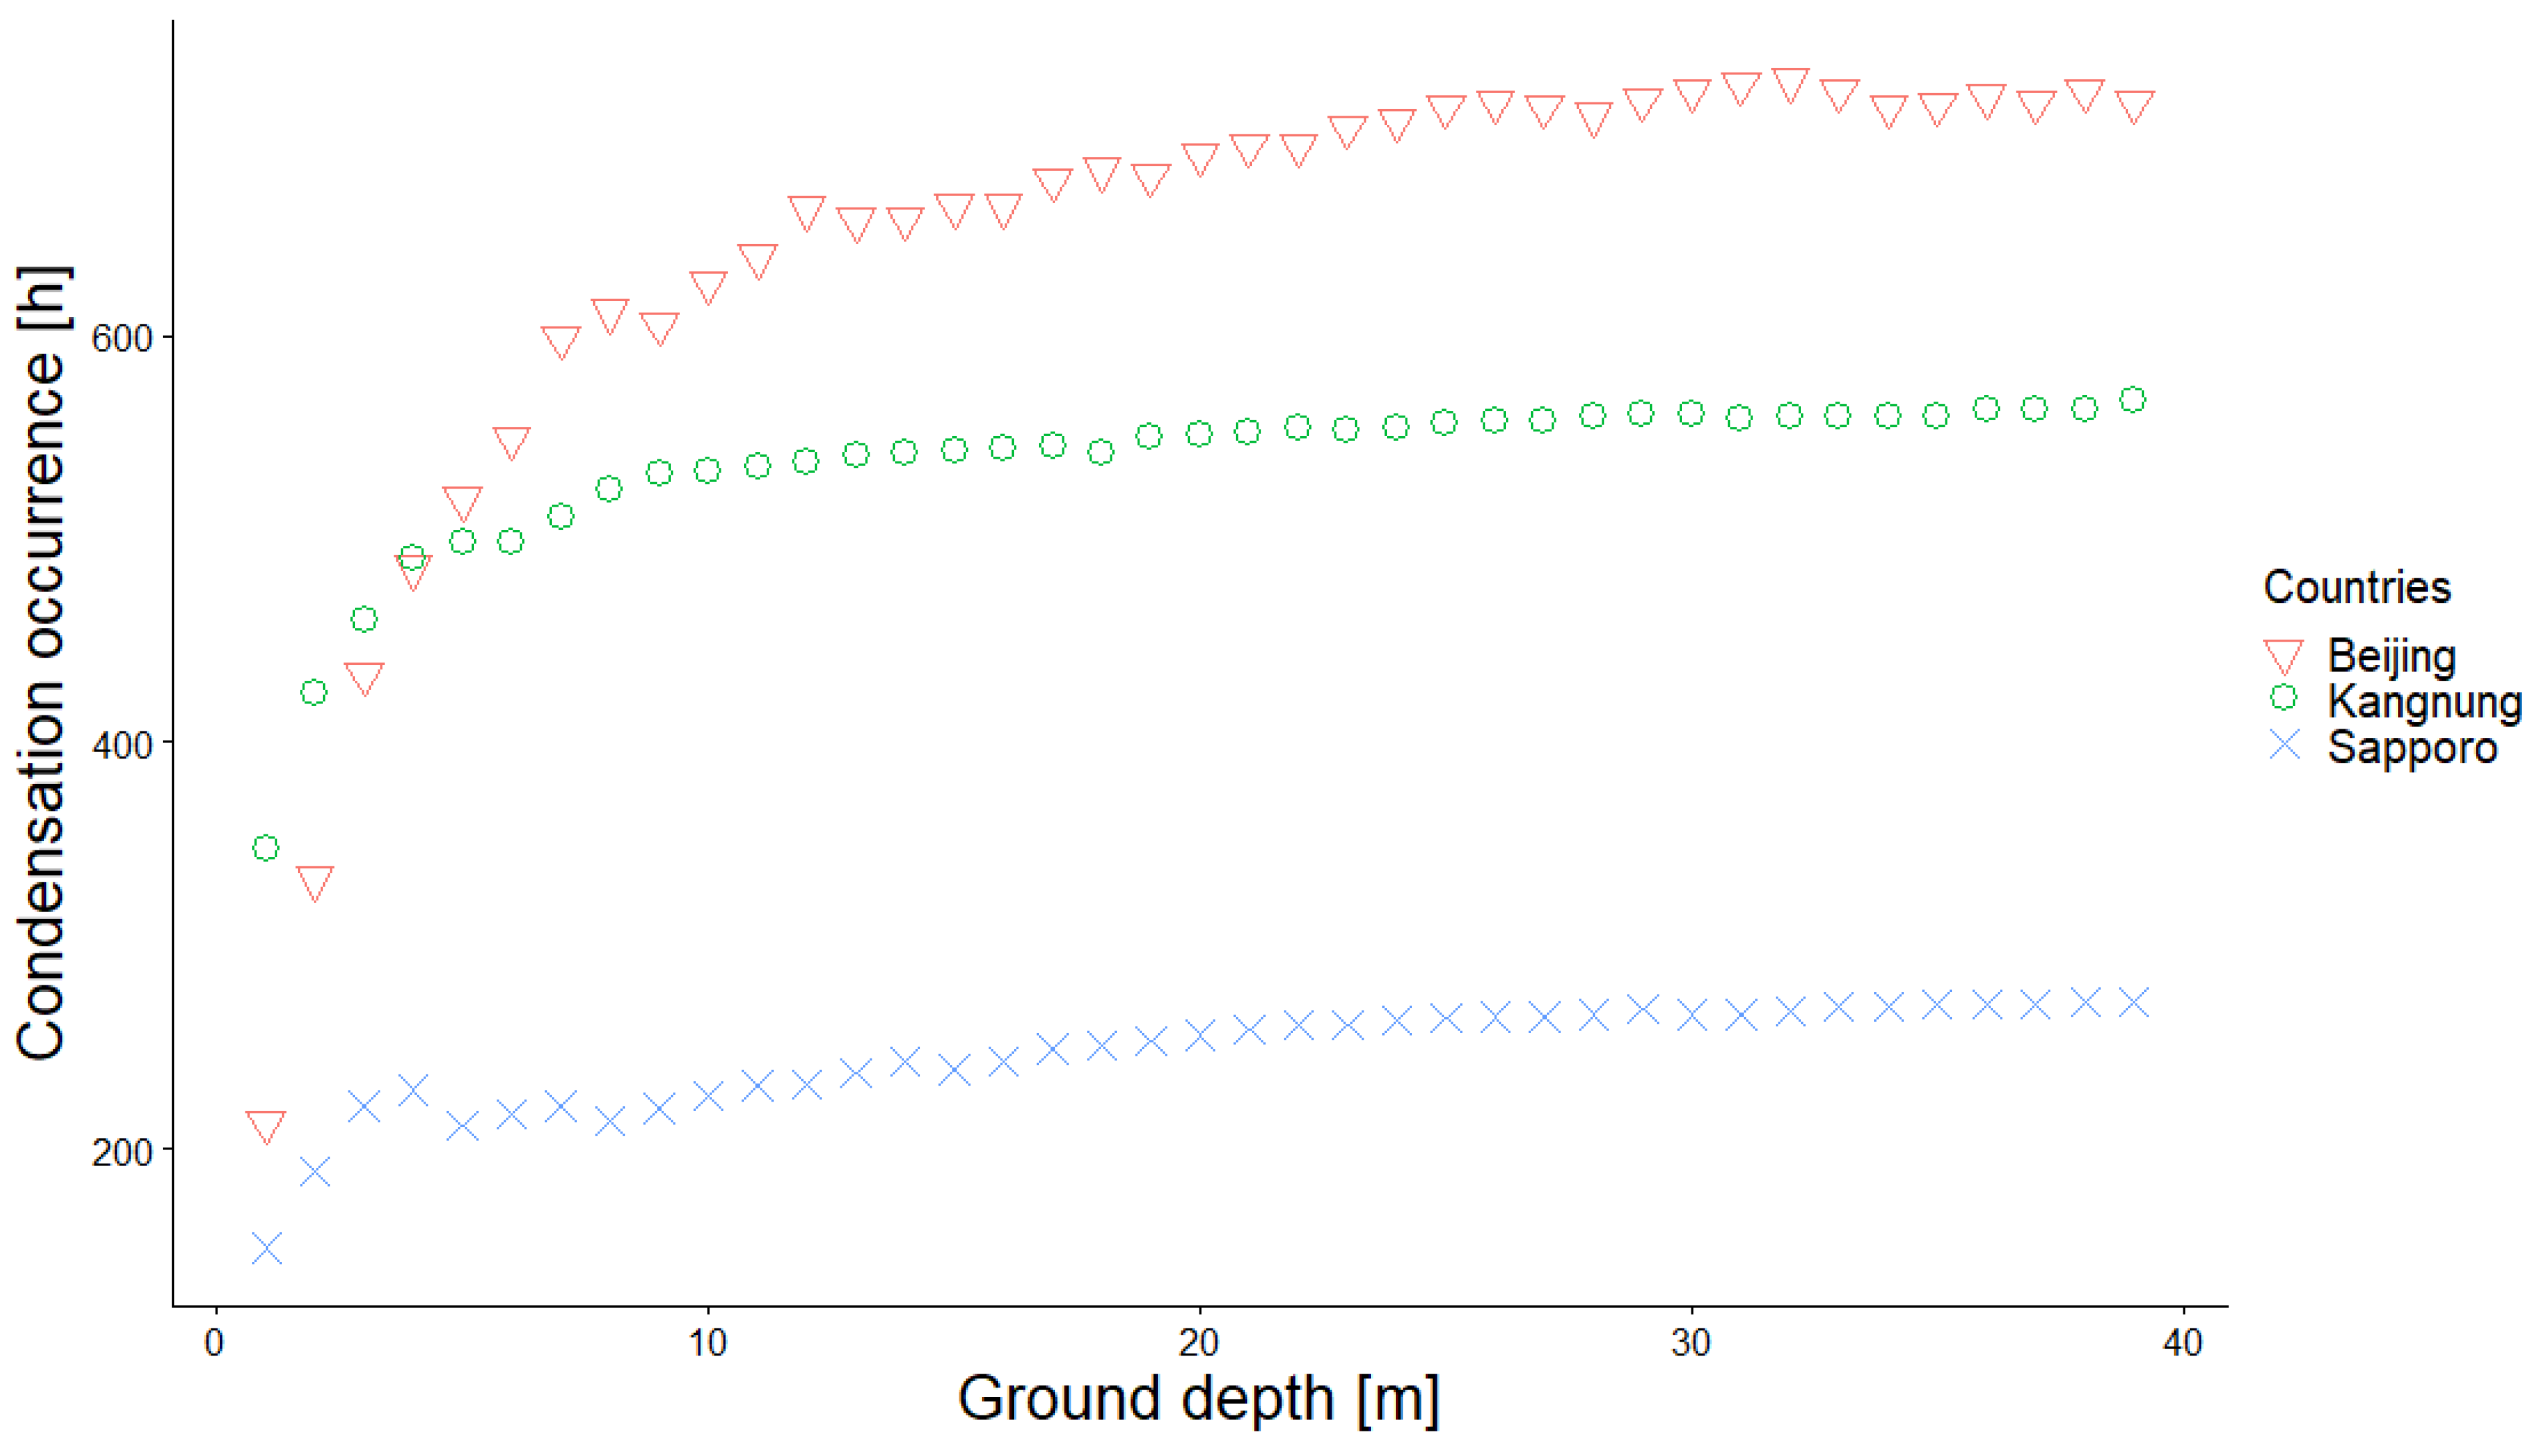
2.2. Analysis of Ground Temperature and Parameters to Consider in TABS
3. Results and Discussions
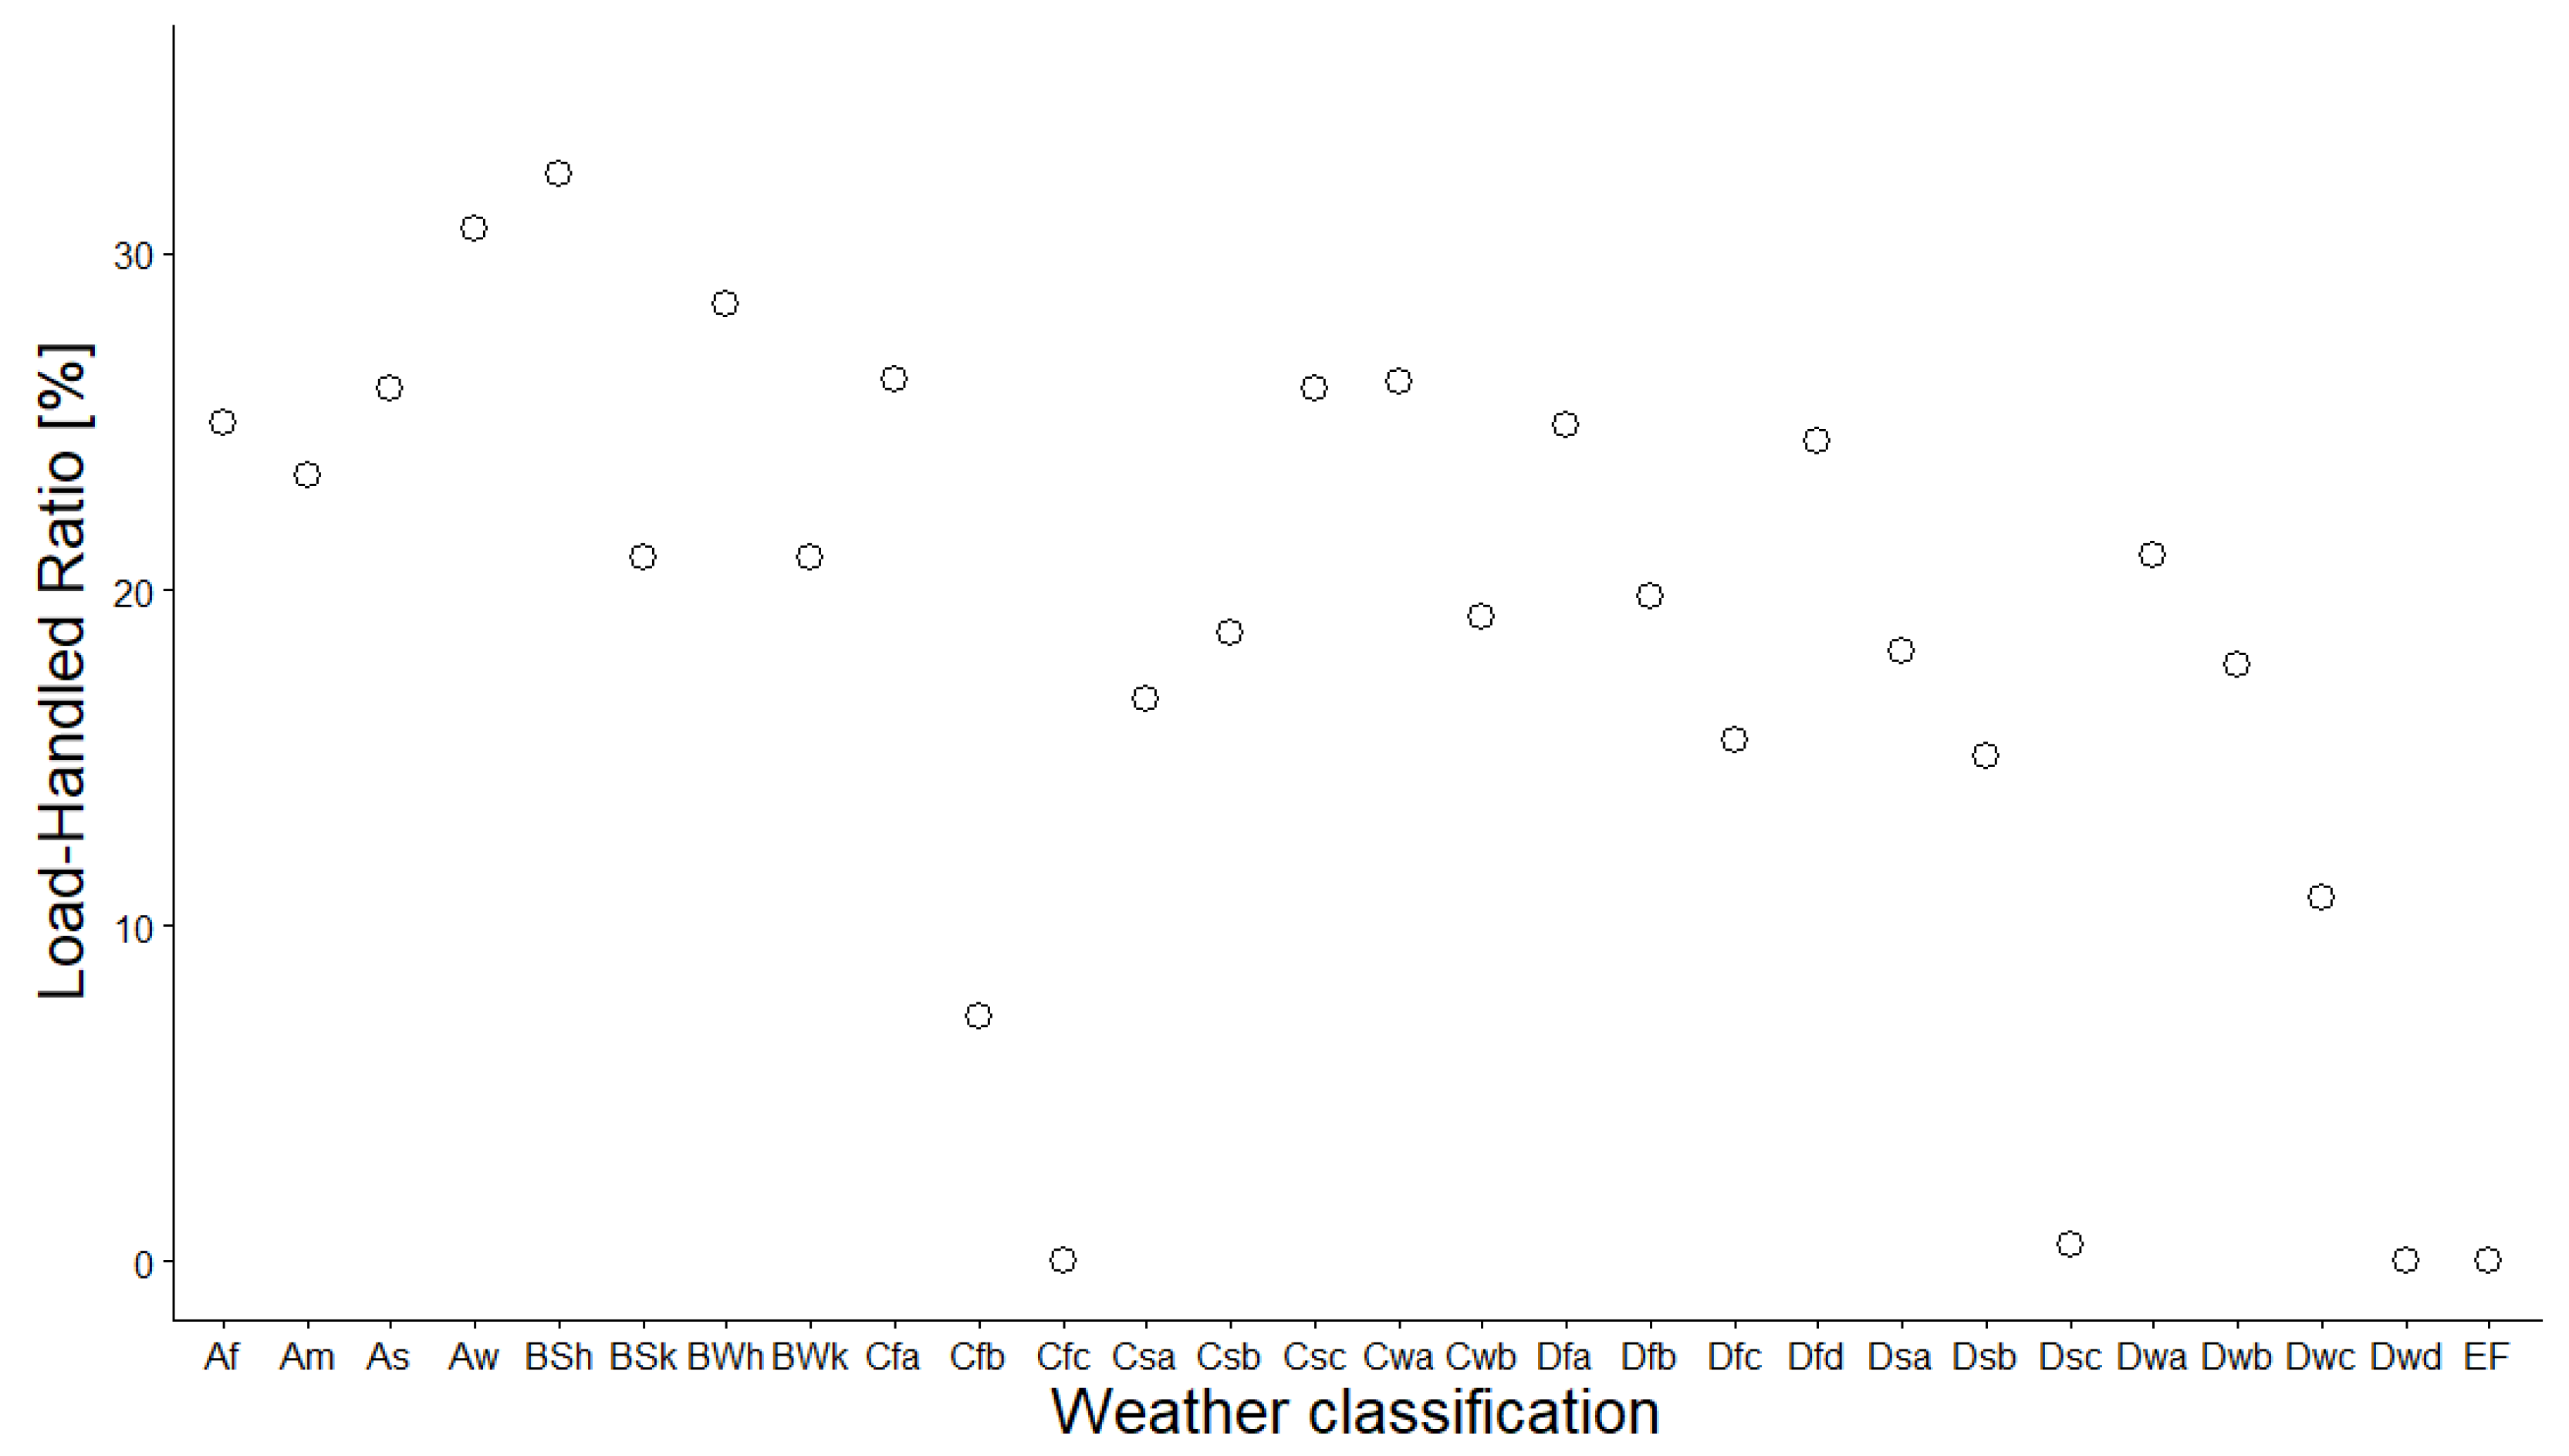
3.1. Simulation Setup and Load-Handled Ratio of TABS
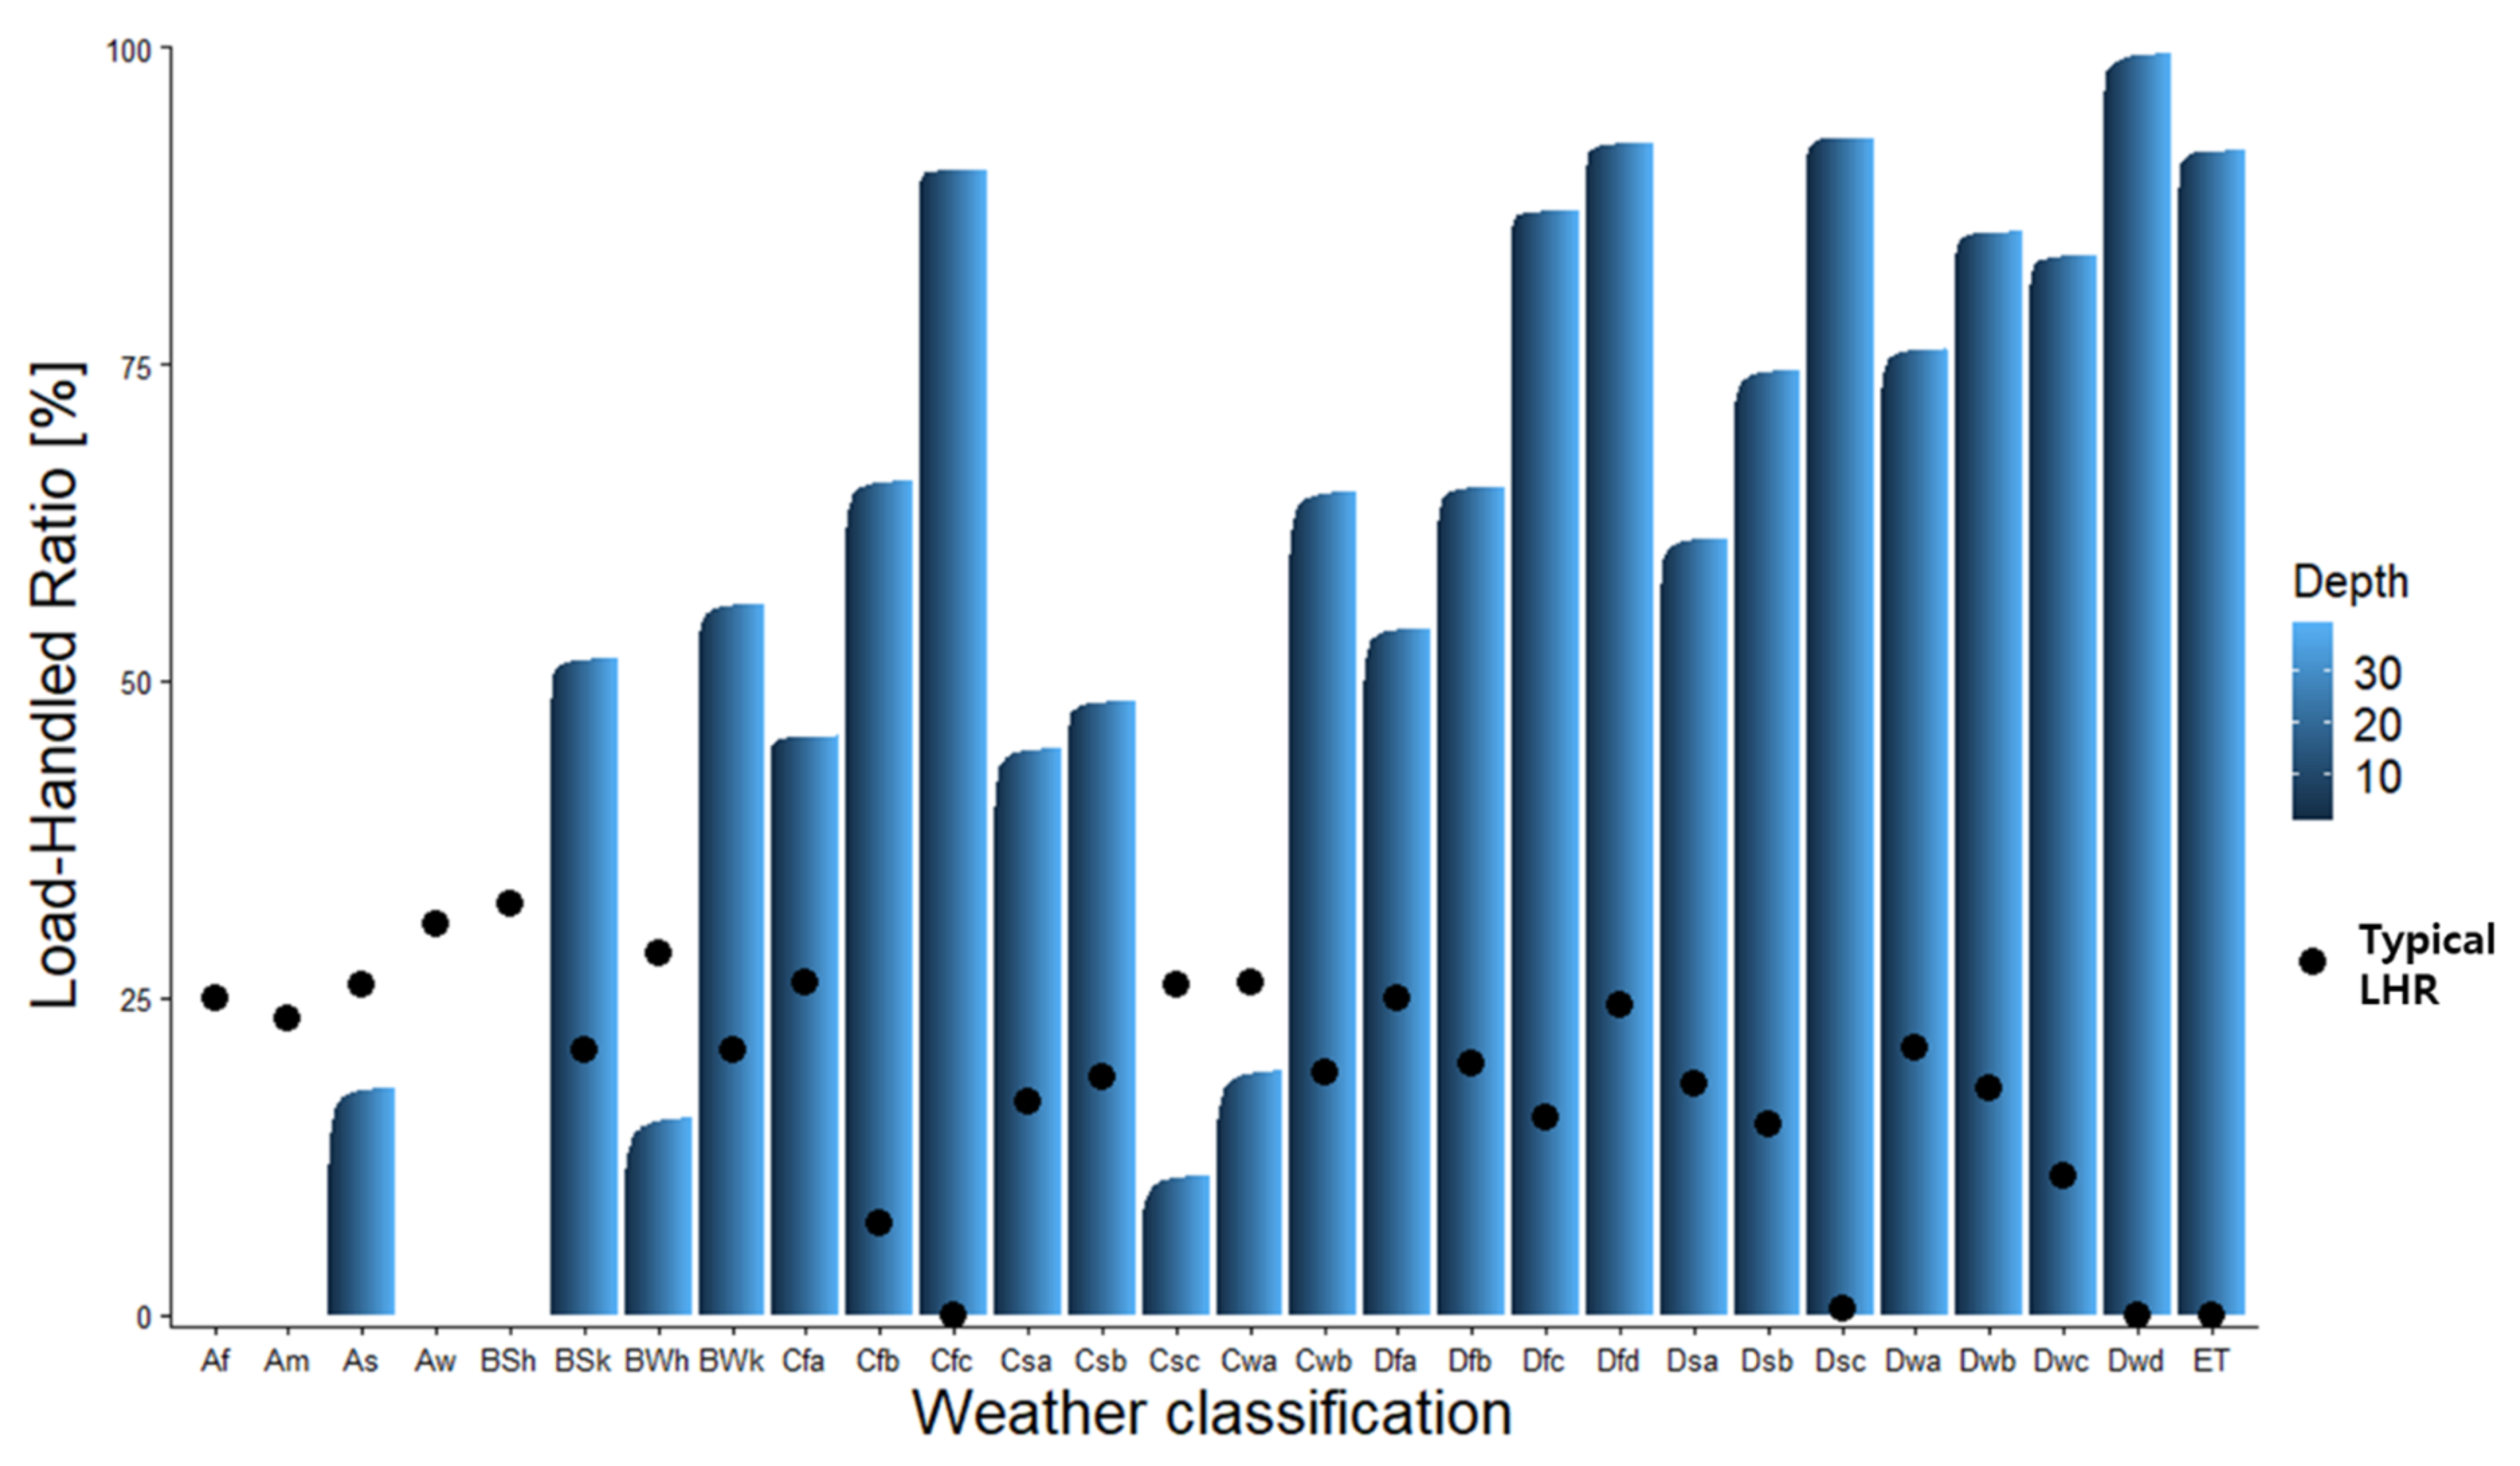
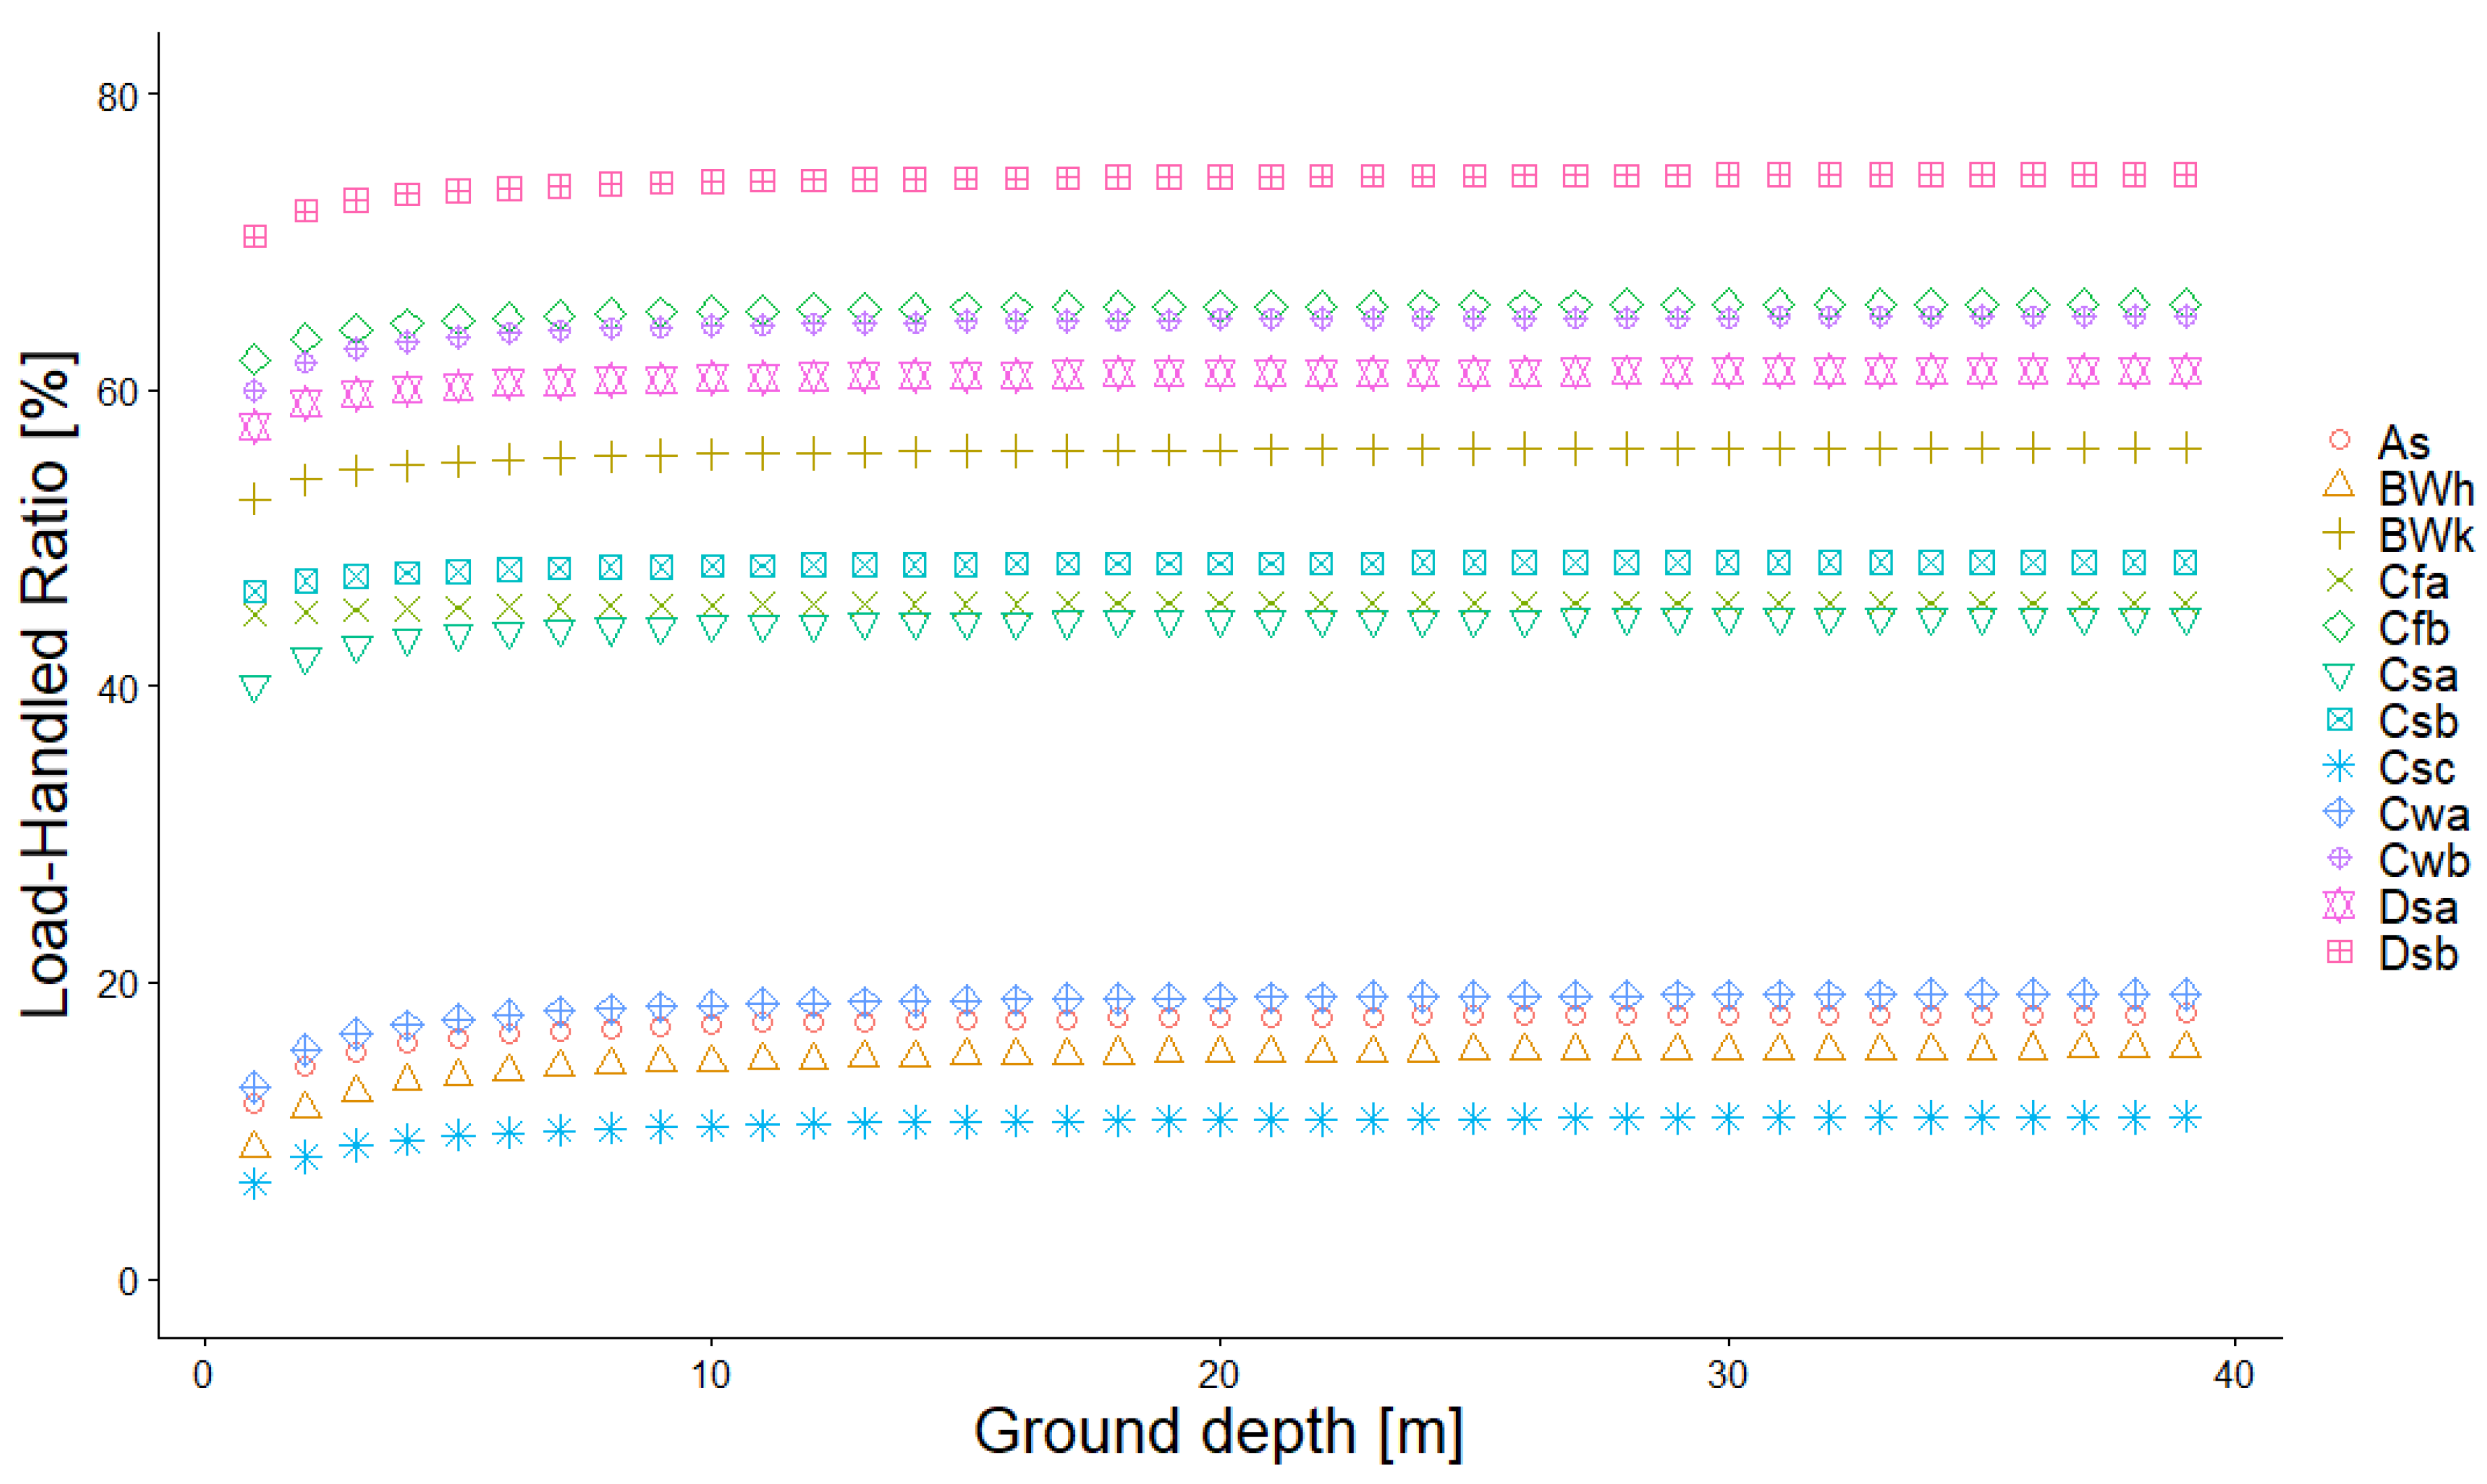
3.2. Load Handled Ratio According to Ground System Depth
4. Conclusions
Author Contributions
Funding
Institutional Review Board Statement
Informed Consent Statement
Conflicts of Interest
References
- Turner, W.J.N.; Walker, I.S.S.; Roux, J. Peak load reductions: Electric load shifting with mechanical pre-cooling of residential buildings with low thermal mass. Energy 2015, 82, 1057–1067. [Google Scholar] [CrossRef]
- Reilly, A.; Kinnane, O. The impact of thermal mass on building energy consumption. Appl. Energy 2017, 198, 108–121. [Google Scholar] [CrossRef] [Green Version]
- Elarga, H.; Fantucci, S.; Serra, V.; Zecchin, R.; Benini, E. Experimental and numerical analyses on thermal performance of different typologies of PCMs integrated in the roof space. Energy Build. 2017, 150, 546–557. [Google Scholar] [CrossRef] [Green Version]
- Gao, Y.; Xu, J.; Yang, S.; Tang, X.; Zhou, Q.; Ge, J.; Xu, T.; Levinson, R. Cool roofs in China: Policy review, building simulations, and proof-of-concept experiments. Energy Policy 2014, 74, 190–214. [Google Scholar] [CrossRef] [Green Version]
- Bevilacqua, P.; Bruno, R.; Arcuri, N. Green roofs in a Mediterranean climate: Energy performances based on in-situ experimental data. Renew. Energy 2020, 152, 1414–1430. [Google Scholar] [CrossRef]
- Baeten, B.; Rogiers, F.; Helsen, L. Reduction of heat pump induced peak electricity use and required generation capacity through thermal energy storage and demand response. Appl. Energy 2017, 195, 184–195. [Google Scholar] [CrossRef]
- Chung, W.J.; Lim, J.-H. Cooling operation guidelines of thermally activated building system considering the condensation risk in hot and humid climate. Energy Build. 2019, 193, 226–239. [Google Scholar] [CrossRef]
- Babiak, J.; Olesen, W.B.; Petráš, D.; Olsen, B.W.; Petras, D.; Babiak, J.; Bjaren, W.; Olesen, D.P. Low Temperature Heating and High Temperature Cooling; REHVA: Brussels, Belgium, 2007; ISBN 2960046862. [Google Scholar]
- Rijksen, D.O.O.; Wisse, C.J.J.; van Schijndel, A.W.M.W.M. Reducing peak requirements for cooling by using thermally activated building systems. Energy Build. 2010, 42, 298–304. [Google Scholar] [CrossRef]
- Olesen, B.W.; Sommer, K.; Duchting, B. Control of slab heating and cooling systems studied by dynamic computer simulations. ASHRAE Trans. 2002, 108, 698. [Google Scholar]
- Olesen, B.W. Thermo Active Building Systems: Using Building Mass To Heat and Cool. ASHRAE J. 2012, 54, 44–52. [Google Scholar]
- Schmelas, M.; Feldmann, T.; Wellnitz, P.; Bollin, E. Adaptive predictive control of thermo-active building systems (TABS) based on a multiple regression algorithm: First practical test. Energy Build. 2016, 129, 367–377. [Google Scholar] [CrossRef]
- Schmelas, M.; Feldmann, T.; Bollin, E. Adaptive predictive control of thermo-active building systems (TABS) based on a multiple regression algorithm. Energy Build. 2015, 103, 14–28. [Google Scholar] [CrossRef]
- Arghand, T.; Javed, S.; Trüschel, A.; Dalenbäck, J.O. A comparative study on borehole heat exchanger size for direct ground coupled cooling systems using active chilled beams and TABS. Energy Build. 2021, 240, 110874. [Google Scholar] [CrossRef]
- Huchtemann, K.; Müller, D. Combined simulation of a deep ground source heat exchanger and an office building. Build. Environ. 2014, 73, 97–105. [Google Scholar] [CrossRef]
- Bockelmann, F.; Plesser, S.; Soldaty, H. Rehva 20: Advanced System Design and Operation of GEOTABS Buildings; REHVA: Brussels, Belgium, 2013; ISBN 9782930521121. [Google Scholar]
- Lim, J.H.; Song, J.H.; Song, S.Y. Development of operational guidelines for thermally activated building system according to heating and cooling load characteristics. Appl. Energy 2014, 126, 123–135. [Google Scholar] [CrossRef]
- Zhou, K.; Mao, J.; Li, Y.; Hua, Z. Comparative study on thermal performance of horizontal ground source heat pump systems with Dirichlet and Robin boundary conditions on ground surface. Energy Convers. Manag. 2020, 225, 113469. [Google Scholar] [CrossRef]
- Cui, Y.; Zhu, J.; Twaha, S.; Chu, J.; Bai, H.; Huang, K.; Chen, X.; Zoras, S.; Soleimani, Z. Techno-economic assessment of the horizontal geothermal heat pump systems: A comprehensive review. Energy Convers. Manag. 2019, 191, 208–236. [Google Scholar] [CrossRef]
- Geiger, R. Klassifikationen der Klimate nach W. Köppen. In Landolf-Börnstein:Zahlenwerte und Funktionen aus Physik, Chemie, Astronomie, Geophysik und Technik, (Alte Serie); Springer: Berlin/Heidelberg, Germany, 1954; Volume 3, pp. 603–607. [Google Scholar]
- Geiger, R. Berarbeitete Neuausgabe von Geiger, R: Köppen-Geiger/Klima der Erde. Wandkarte (Wall Map) 1: 16 Mill; Klett-Perthes: Gotha, Germany, 1961. [Google Scholar]
- Thornthwaite, C.W. An Approach toward a Rational Classification of Climate; American Geographical Society: New York, NY, USA, 1948; Volume 38. [Google Scholar]
- Trewartha, G. An Introduction to Climate, 5th ed.; McGraw-Hill: New York, NY, USA, 1968. [Google Scholar]
- Feddema, J.J. A Revised Thornthwaite-Type Global Climate Classification. Phys. Geogr. 2005, 26, 442–466. [Google Scholar] [CrossRef]
- EnergyPlus Weather Data. Available online: https://energyplus.net/weather (accessed on 23 August 2021).
- Kruis, N.; Krarti, M. KivaTM: A numerical framework for improving foundation heat transfer calculations. J. Build. Perform. Simul. 2015, 8, 449–468. [Google Scholar] [CrossRef]
- Dinh, B.H.; Go, G.H.; Kim, Y.S. Performance of a horizontal heat exchanger for ground heat pump system: Effects of groundwater level drop with soil–water thermal characteristics. Appl. Therm. Eng. 2021, 195, 117203. [Google Scholar] [CrossRef]
- Amadeh, A.; Habibi, M.; Hakkaki-Fard, A. Numerical simulation of a ground-coupled heat pump system with vertical plate heat exchangers: A comprehensive parametric study. Geothermics 2020, 88, 101913. [Google Scholar] [CrossRef]
- Deru, M.; Field, K.; Studer, D.; Benne, K.; Griffith, B.; Torcellini, P.; Liu, B.; Halverson, M.; Winiarski, D.; Rosenberg, M.; et al. U.S. Department of Energy Commercial Reference Building Models of the National Building Stock; National Renewable Energy Laboratory: Golden, CO, USA, 2011. [Google Scholar]
- Witte, M.J.; Henninger, R.H.; Glazer GARD Analytics, J.; Crawley, D.B. Testing and validation of a new building energy simulation program. In Proceedings of the Proceedings, Building Simulation, International Building Performance Simulation Association (IBSPA), Rio de Janeiro, Brazil, 13 August 2001; pp. 353–360. [Google Scholar]
- Chantrasrisalai, C.; Ghatti, V.; Fisher, D.E.; Scheatzle, D.G. Experimental validation of the EnergyPlus low-temperature radiant simulation. ASHRAE Trans. 2003, 109, 614–623. [Google Scholar]
- Witte, M.J.; Henninger, R.H.; Crawley, D.B. Experience testing EnergyPlus with the ASHRAE 1052-RP building fabric analytical tests. In Proceedings of the SimBuild 2004 IBPSA-USA National Conference, Boulder, CO, USA, 4–6 August 2004; pp. 1–8. [Google Scholar]
- ASHRAE. Standard 55: Thermal ENvironmental Conditions for Human Occupancy; ASHRAE: Atlanta, GA, USA, 2013. [Google Scholar]
- Park, S.H.; Chung, W.J.; Yeo, M.S.; Kim, K.W. Evaluation of the thermal performance of a Thermally Activated Building System (TABS) according to the thermal load in a residential building. Energy Build. 2014, 73, 69–82. [Google Scholar] [CrossRef]


| Main Climate Classification | Koppen- Geiger Class | Koppen–Geiger Sub-Climate Type | Country | City |
|---|---|---|---|---|
| Equatorial | Af | Fully humid | Malaysia | Kuching |
| Am | Monsoonal | Philippines | Manila | |
| As | Summer dry | India | Indore | |
| Aw | Winter dry | Thailand | Bangkok | |
| Arid | BSh | Steppe hot | Kenya | Garissa |
| BSk | Steppe cold | China | Beijing | |
| BWh | Desert hot | Egypt | Kharga | |
| BWk | Desert cold | China | Kuqa | |
| Warm Temperate | Cfa | Fully humid hot summer | Argentina | Buenos Aires |
| Cfb | Fully humid warm summer | Colombia | Bogota | |
| Cfc | Fully humid cool summer | Iceland | Reykjavik | |
| Csa | Summer dry hot summer | Morocco | Casablanca | |
| Csb | Summer dry warm summer | South Africa | Cape Town | |
| Csc | Summer dry cool summer | United States | Kahului | |
| Cwa | Winter dry hot summer | India | New Delhi | |
| Cwb | Winter dry warm summer | Peru | Cusco | |
| Cwc | Winter dry cool summer | lack of pixel and no weather file | ||
| Snow | Dfa | Fully humid hot summer | Korea | Kangnung |
| Dfb | Fully humid warm summer | Japan | Sapporo | |
| Dfc | Fully humid cool summer | United States | Anchorage | |
| Dfd | Fully humid extremely continental | Russia | Yakutsk | |
| Dsa | Summer dry hot summer | Unites States | Ogden-Hill | |
| Dsb | Summer dry warm summer | United States | Flagstaff-Pulliam | |
| Dsc | Summer dry cool summer | United States | Homer | |
| Dsd | Summer dry extremely continental | No weather file | ||
| Dwa | Winter dry hot summer | China | Harbin | |
| Dwb | Winter dry warm summer | Russia | Irkutsk | |
| Dwc | Winter dry cool summer | China | Xinghai | |
| Dwd | Winter dry extremely continental | China | Qumarleb | |
| Polar | EF | Polar frost | No weather file | |
| ET | Polar tundra | China | Tibet | |
| Conditions | Contents |
|---|---|
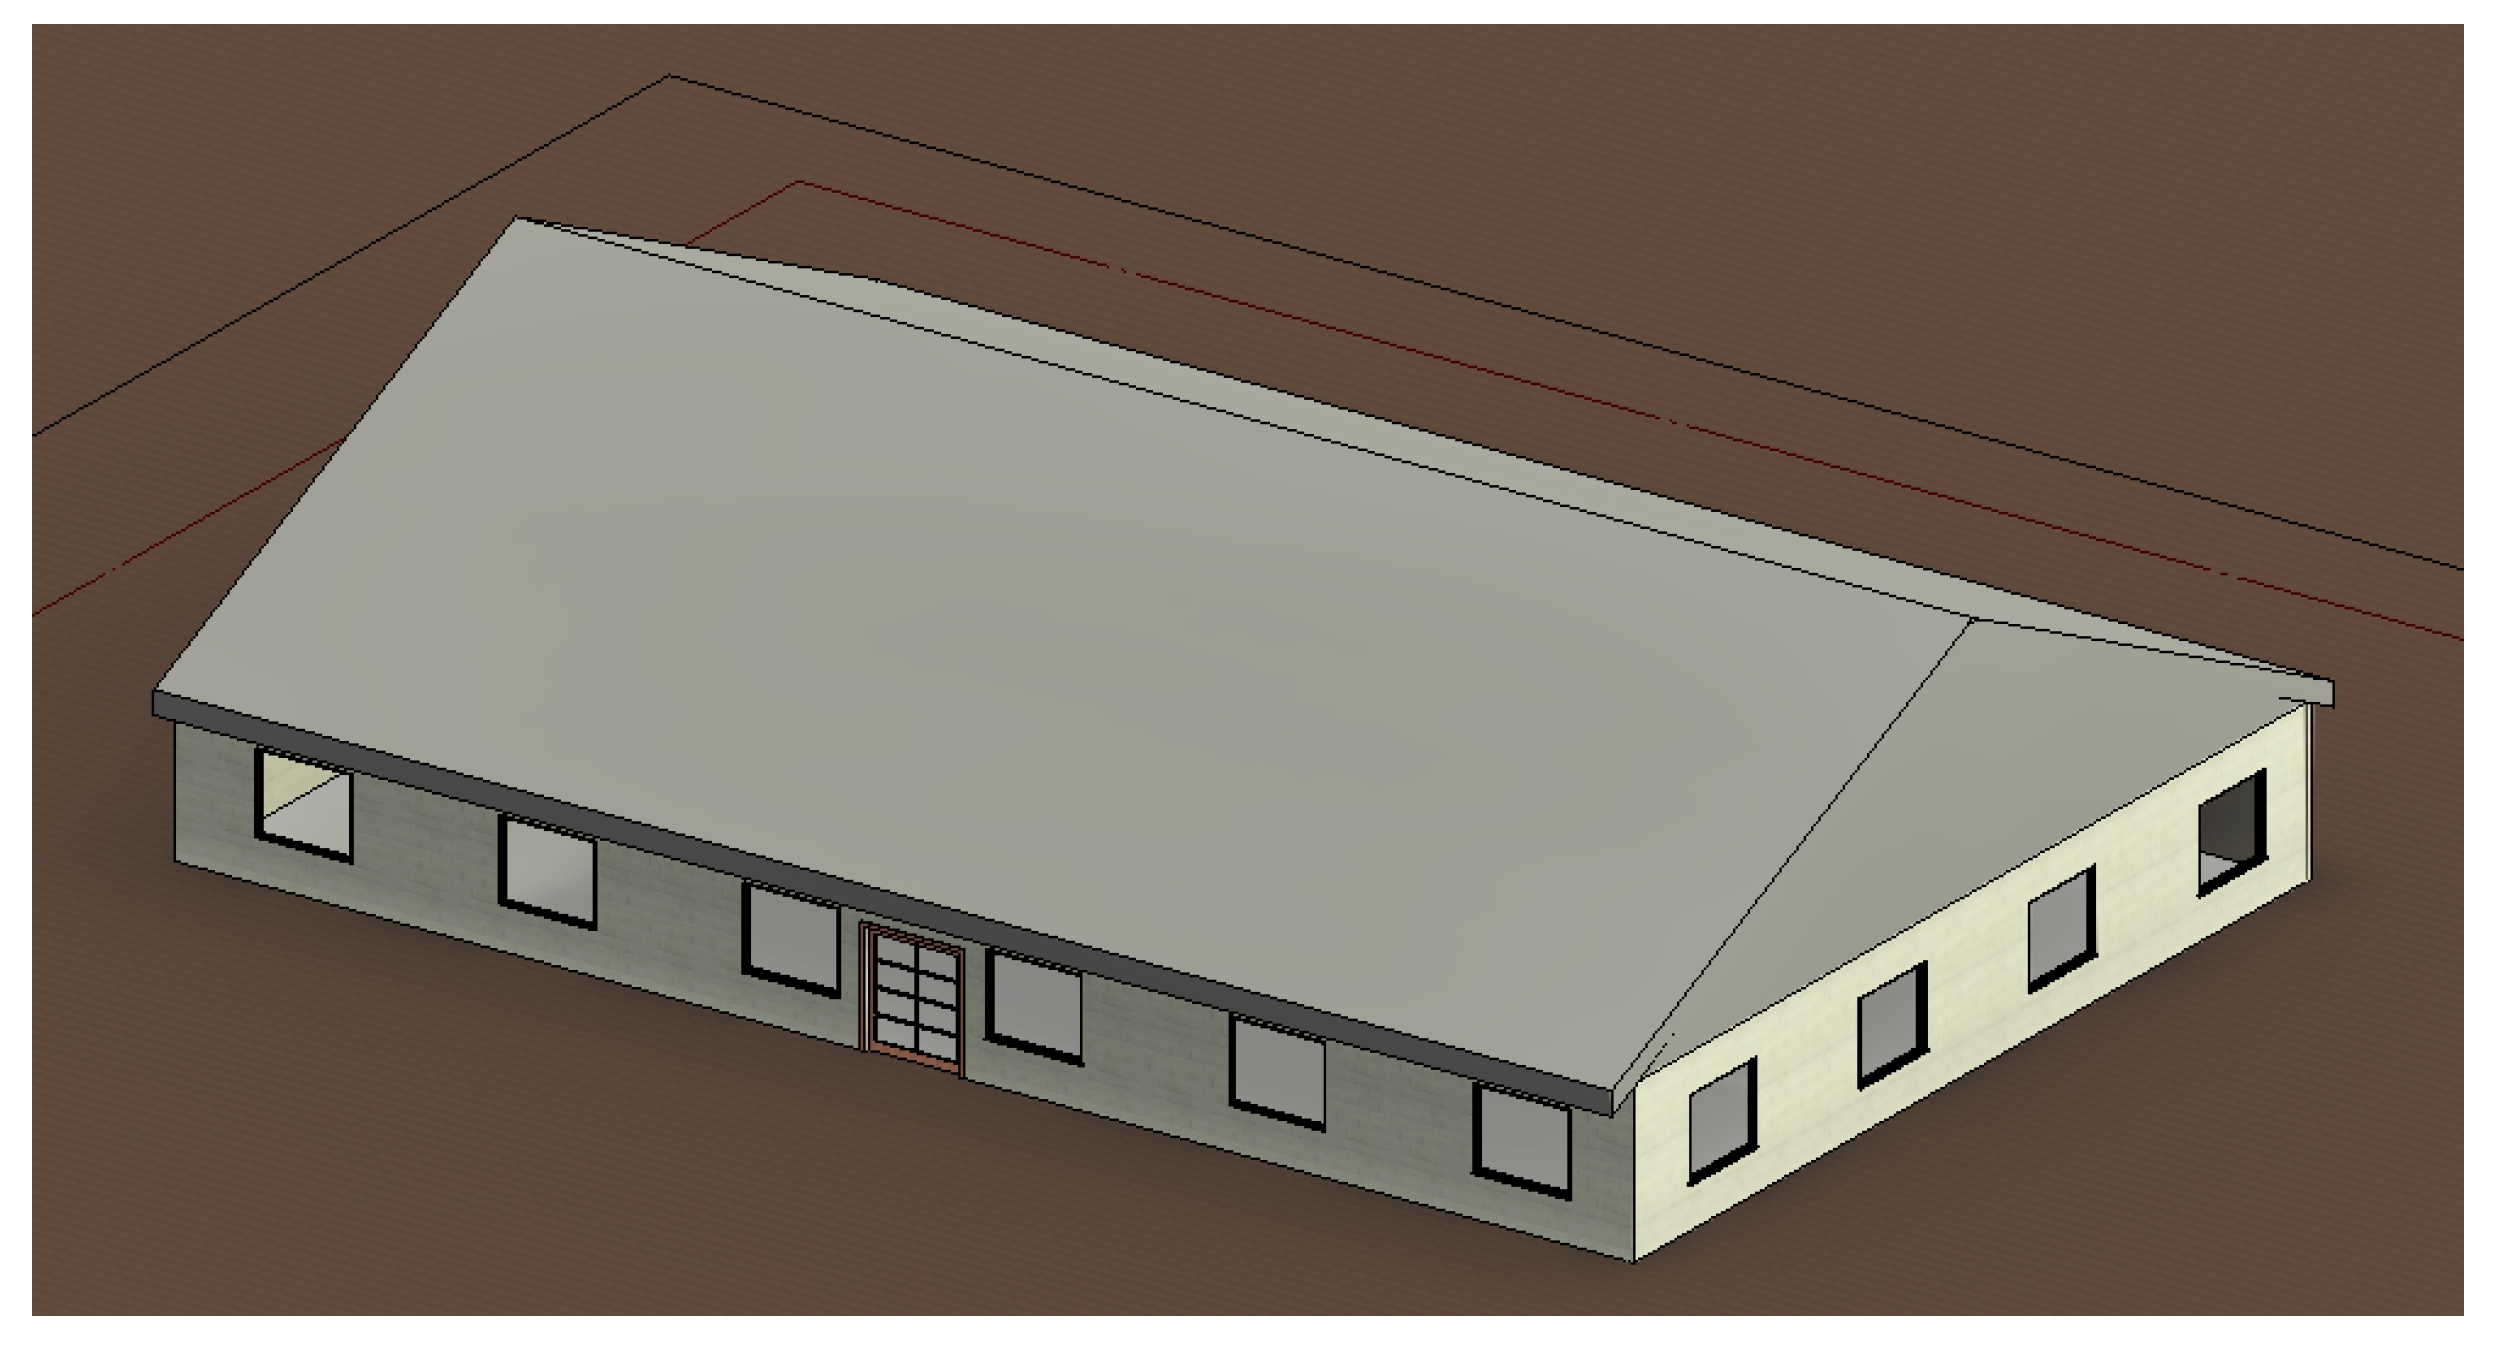
| Zone area | 511 m2 (27.69 m × 18.46 m) |
| U-value of the wall | 0.698 W/m2 K |
| SHGC and U-value of windows | 0.391, 3.241 W/m2 K |
| Wall construction | 0.025 m Stucco, 0.203 m concrete, 0.066 m insulation, 0.013 m gypsum board |
| Ceiling construction | 0.146 m insulation, 0.203 m concrete, 0.013 m gypsum board |
| Internal heat gain | People: 18.58 m2/person Lighting: 10.76 W/m2 Equipment: 10.76 W/m2 |
| Setpoint temperature | 24 °C (summer) |
| Infiltration rate | 0.34 ACH |
| Occupancy schedule | Office working hours (weekdays from 09:00 to 18:00) |
Publisher’s Note: MDPI stays neutral with regard to jurisdictional claims in published maps and institutional affiliations. |
© 2021 by the authors. Licensee MDPI, Basel, Switzerland. This article is an open access article distributed under the terms and conditions of the Creative Commons Attribution (CC BY) license (https://creativecommons.org/licenses/by/4.0/).
Share and Cite
Chung, W.J.; Park, S.H. Utilization of Thermally Activated Building System with Horizontal Ground Heat Exchanger Considering the Weather Conditions. Energies 2021, 14, 7927. https://doi.org/10.3390/en14237927
Chung WJ, Park SH. Utilization of Thermally Activated Building System with Horizontal Ground Heat Exchanger Considering the Weather Conditions. Energies. 2021; 14(23):7927. https://doi.org/10.3390/en14237927
Chicago/Turabian StyleChung, Woong June, and Sang Hoon Park. 2021. "Utilization of Thermally Activated Building System with Horizontal Ground Heat Exchanger Considering the Weather Conditions" Energies 14, no. 23: 7927. https://doi.org/10.3390/en14237927