Article

CFD Modelling of the Thermal Performance of Fruit Packaging Boxes—Influence of Vent-Holes Design

1
Department of Electromechanical Engineering, University of Beira Interior, 6201-001 Covilhã, Portugal
2
C-MAST—Center for Mechanical and Aerospace Science and Technologies, 6201-001 Covilhã, Portugal
3
TJ Moldes, Embra, P.O. BOX 198, 2431-966 Marinha Grande, Portugal
*
Author to whom correspondence should be addressed.
Energies 2021, 14(23), 7990; https://doi.org/10.3390/en14237990
Submission received: 23 October 2021 / Revised: 16 November 2021 / Accepted: 19 November 2021 / Published: 30 November 2021
(This article belongs to the Special Issue Renewable Energy Solutions for Baltic–Nordic Region 2021)

Abstract

:
The shelf life of perishable products depends mainly on the conservation of air temperature. Packaging boxes are usually used to accommodate food products during cold storage and transport and/or display. The design of the vent-holes of the packaging box must promote cold airflow and remove the field heat of the produce after harvest at a short time. This study describes the influence of the vent-holes design and its performance during cold storage. The cooling performance of the different packaging boxes is evaluated experimentally and numerically using Computational Fluid Dynamics (CFD). Three new packaging box configurations with the same size but different vent-holes design (size, shape and position) and a reference box are modelled. The transient three-dimensional CFD model predicts the airflow pattern and temperature distribution within the different packaging boxes. The best thermal performance packaging achieved a fruit model temperature 1.5 K to 5 K lower than the other configurations at the end of 8 h of cooling. These predictions allow the development of new packaging box designs that promote the shelf-life extension of perishable products.

1. Introduction

The post-harvest life of fresh horticulture goods is mostly determined by temperature, which is a significant element in defining the physiological and biological characteristics of the products [1]. After harvest, over 13–38% of food products are wasted before reaching the client, owing to inappropriate management [2]. For reduced losses in these perishable commodities rapid removal of field heat and maintenance of the correct temperature throughout storage is needed [3,4,5,6]. Maintaining appropriate temperature reduces the loss of nutrients, color, texture, and physiological qualities of harvested items [4]. The most frequent method for removing field heat from a product is forced air cooling. Packages with products are stacked inside the chamber, and the generated pressure difference forces air to flow through the packaging to remove field heat and maintain the products’ desired temperature [7,8]. Meanwhile, optimizing the cold chain is a primary emphasis for improving overall cold chain logistics efficiency, as the energy required to preserve these climacteric products consumes about 8% of global electrical power [5]. In recent years, a number of researchers [3,4,5,6,7,8,9] have approved various experimental and numerical strategies for predicting airflow and thermal behavior within cold chain storage to improve uniform cooling in a short amount of time.
The time taken to remove the field heat from the products mainly depends on the airflow rate, stacking pattern, and the vent hole design of the packaging boxes [8,9,10]. Defraeye et al. [3] revealed the temperature heterogeneity between the packaging box stacked in pallets and within the fruits placed inside the packaging box during storage. This uneven thermal distribution within the fruits affects the quality of the products before reaching the customer. To overcome the pallets’ thermal heterogeneity, the packaging box vent must be redesigned to enhance the airflow penetration and induce even airflow distribution [10,11]. Mukama et al. [12] predicted that the produce cooling rate and uniformity depend on the vent hole shape, size, and position, which elevates the airflow during the cooling process and maintains the optimum temperature during storage. Han et al. [7] stated that the packaging vents must be designed so they should not be blocked by the tray and the products placed inside the packaging box. O’Sullivan et al. [13] showed the overall performance of forced–air cooling process is determined by the time and energy required to remove the field heat of the products. It is showed that the reduction in aerodynamic resistance increases the efficiency of the horticulture cold chain storage.
Recent advancements in numerical methods and computational tools lead to their use to analyze and modify the horticulture storage design [3,4,5,6]. The fluid flow, heat transfer during the transport and cold storage in the post-harvest agricultural products are predicted by different mathematical models. The set of governing equations tends to predict mass, momentum, and heat transfer by numerically solving through computational fluid dynamics (CFD) [12,13,14]. Several numerical studies were developed in cold storage, but very few studies were performed to design vents in the packaging boxes [7,15,16]. These studies were performed either with a single vent design, modifying the number of trays or different vents, which lags in comparison with the experimental work. This study aims to evaluate the effect of vent hole design on peach fruit cooling behavior by combining experimental and numerical modelling. The three-dimensional transient CFD model predicts the dynamic airflow pattern and temperature distribution within the packaging box configurations during the cooling phase. A multi-parameter approach using CFD is applied to assess the best three different packaging boxes having the exact dimensions, with varying shapes of the vent, including its size and location. These results can be used in the development of high-performance packaging that is able to extend the shelf life of products by maintaining a uniform low conservation temperature for a longer time.

2. Materials and Methods

2.1. Physical Model

In this study, the airflow and thermal behavior within the three different packaging boxes with the same dimension but with different vent hole shape, size, and position are compared with the reference configuration R (a worldwide known brand of packaging boxes for fruits). The configurations of the three different packaging boxes are shown in Figure 1. These vent-holes design configurations were proposed considering the scientific research developed for airflow and heat transfer within perishable food products. Configuration A has a single wall thickness of 1.5 mm with a varying vent hole diameter of 3 mm external and 10 mm internal. Configuration B has a single wall thickness of 1.5 mm with a rectangular curved opening located at the top portion of the box, having dimensions of 70 mm × 7.5 mm of vent opening. Configuration C has a double wall of thickness 1.5 mm, refrigerated air enters through holes in diameter of 3 mm to 6 mm unaligned to the duct’s airflow direction. These three configurations have the same box dimension of (597 × 400 × 88.5 mm). The reference configuration R has dimensions of (602 × 400 × 155 mm), having a single wall thickness of 1.5 mm with rectangular vents of 40 mm × 7 mm. Total open area of Packaging box A, B, and C is 2670.4 mm2, 4244.2 mm2, and 508.9 mm2.

2.2. Experimental Procedure

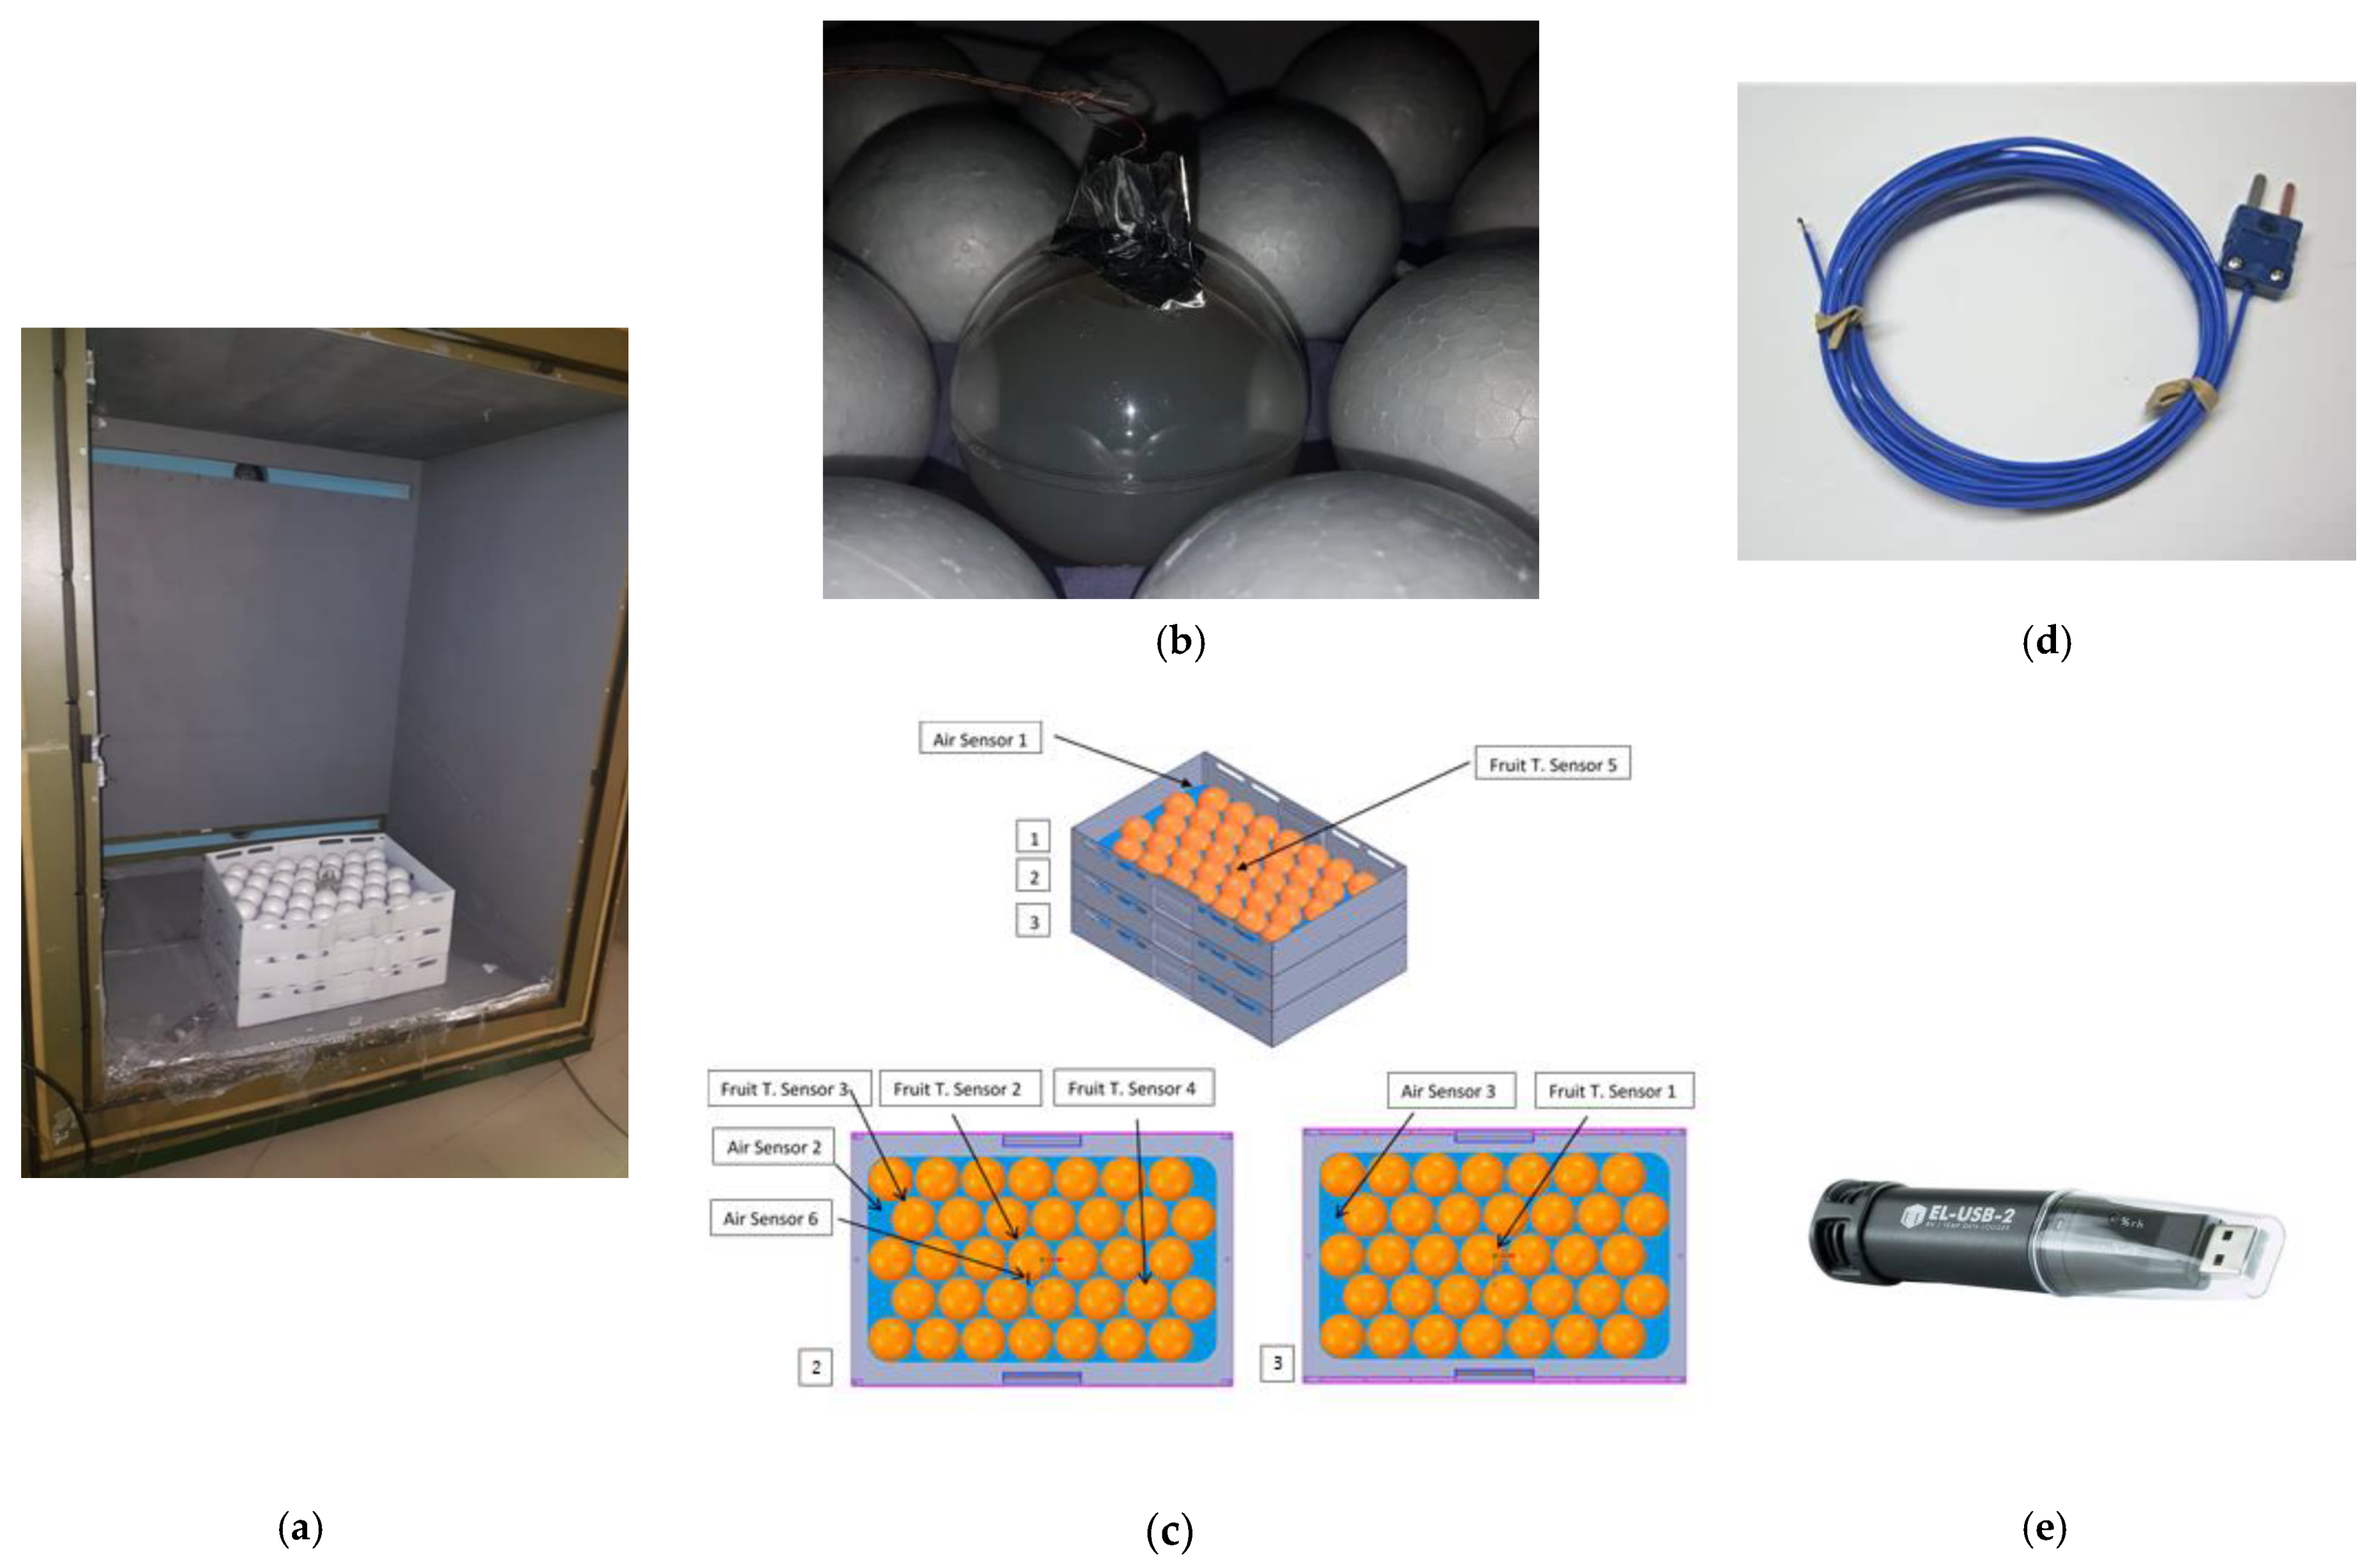
The packaging boxes are placed inside the cold chamber shown in Figure 2a to predict the thermal behavior within the different packaging boxes. Peach fruit is considered for this experiment, but since these fruits are harvested between June and August and due to their limited availability, fruit simulators in Figure 2b were used to perform the experimental task. Their location inside the box is shown on Figure 2c. Each box contains fruit simulators and polystyrene balls in the alveoli trays in a staggered pattern [17]. The fruit simulators were made from agar-water solution with a volumetric concentration of 5%, which replicates peach fruits’ properties. To reduce the experimental cost, a total of five acrylic balls are filled with agar–water solution and the remaining tray is positioned with polystyrene balls. Three agar fruit models are placed in the middle layers, and other layers of top and bottom are positioned with a single agar fruit model.
Thermocouples type T shown in Figure 2d were inserted in the center of the agar balls to measure the fruit temperature, while thermo-hygrometers as shown in Figure 2e were used to measure the air temperature inside the boxes with an accuracy of 0.55 °C. The experimental tests started with the cold chamber and fruits simulators at a temperature of 295 K. The cooling process was started, and the experimental tests were conducted until no significant temperature changes were measured (variations with magnitude similar to equipment measurement error). Thus, the end time for the experiments was set to 8 h. The experiments were performed starting with the package type A, in experiment 1, and the procedures were completed in a similar way for the other packages. For each configuration, three experiments were completed, with the average and standard deviation values of the three used for analysis.

2.3. Computational Model

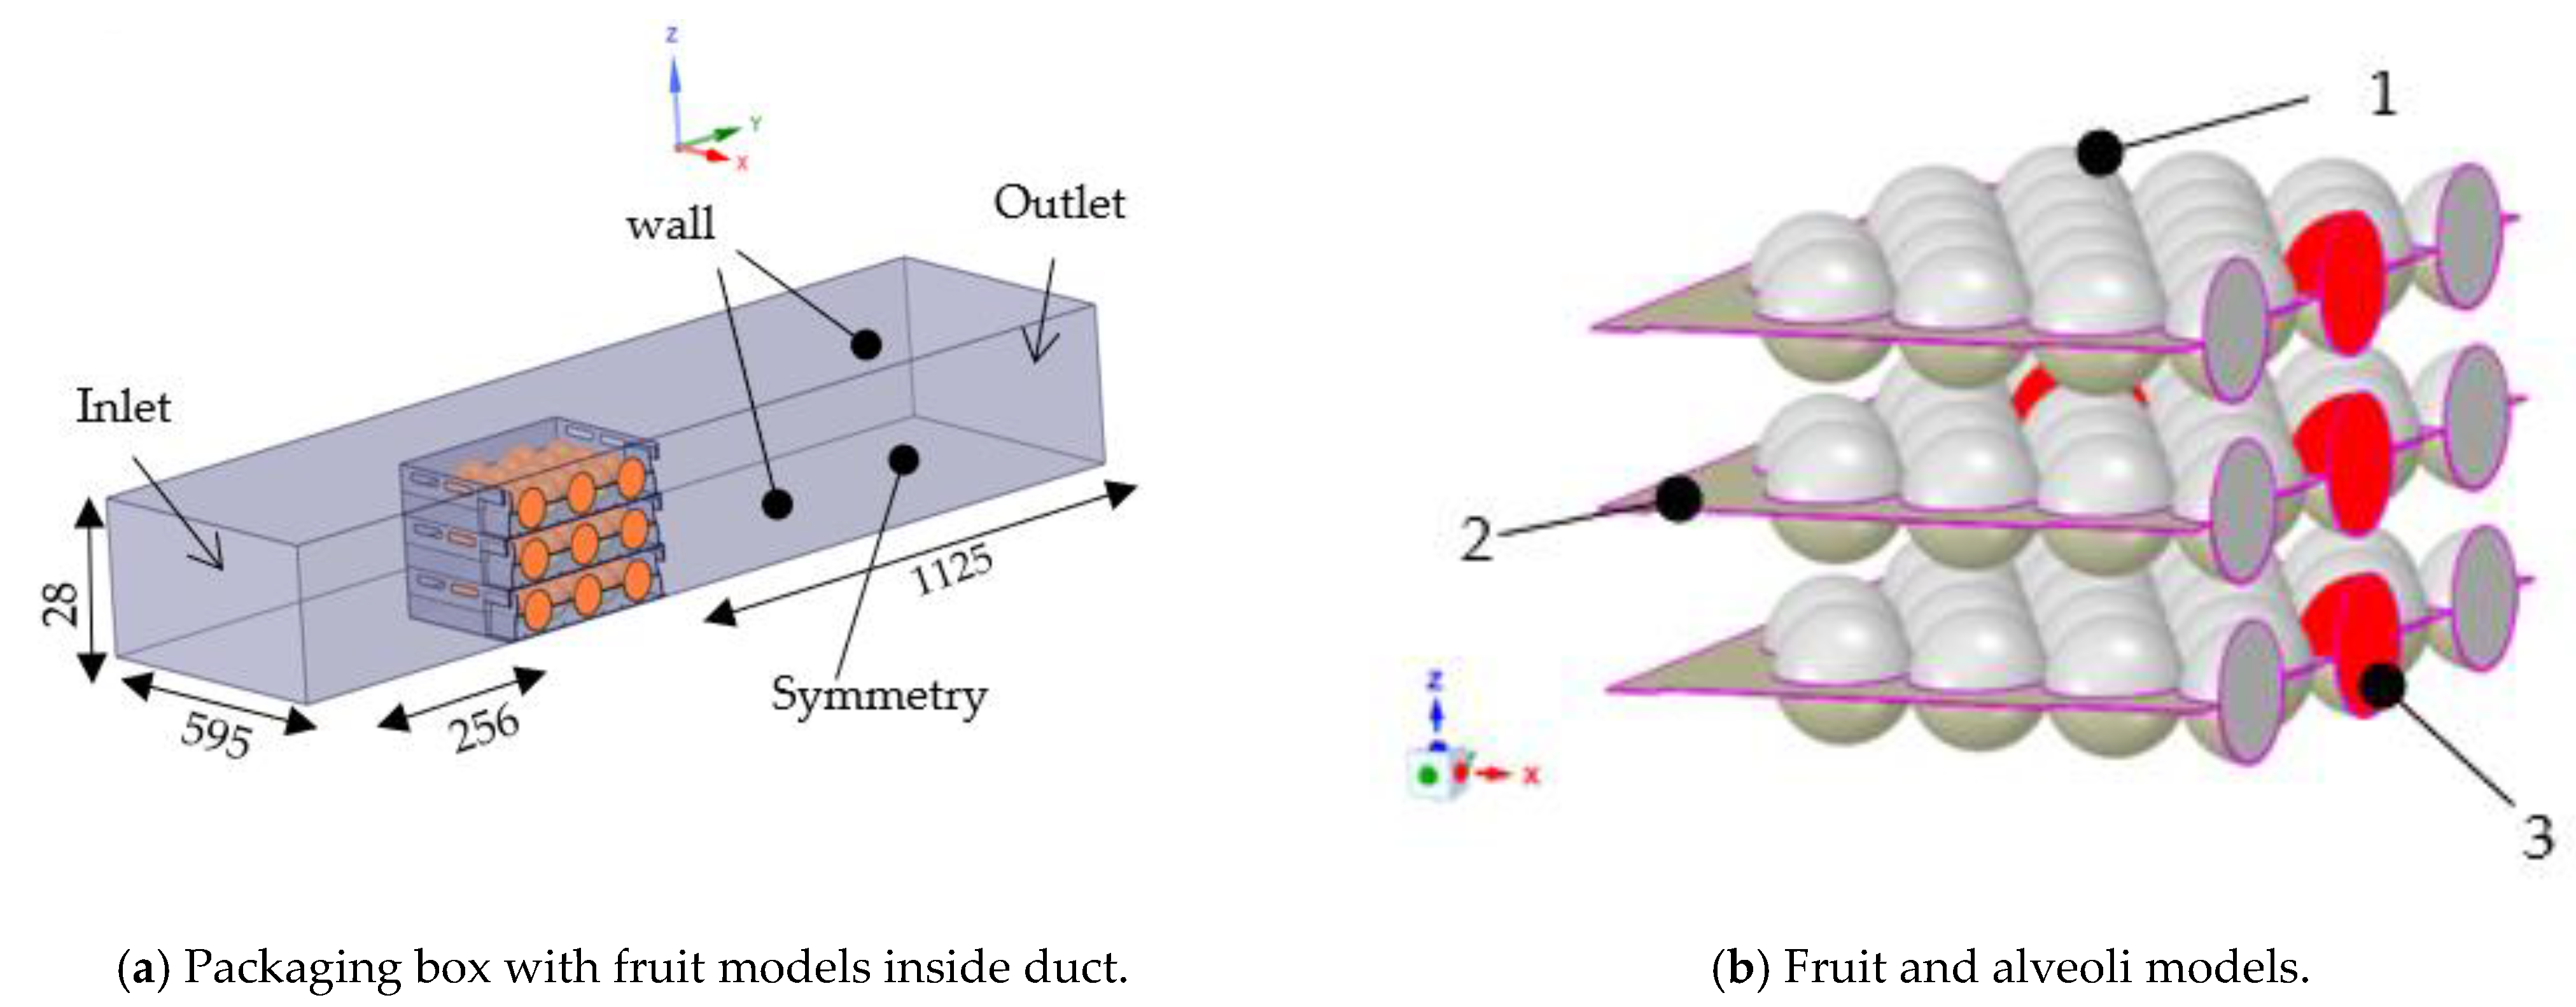
For this study, a 3D computational model of a refrigeration duct with a packaging box with fruit models placed in an alveoli tray is modeled as shown in Figure 2. Individual fruits are modeled as spheres with a diameter of 70 mm and the fruit models are positioned in the alveoli tray with a thickness of 1.5 mm See Figure 3b. Due to symmetry, only half of the physical geometry is modelled allowing to reduce the extent of the computational model, reducing the computing resources (time and memory). Although experiments were conducted inside cold chambers, several authors [10,15,16] performed numerical predictions inside a duct to reduce the computational cost, and the results were compared with the experimental work conducted inside cold rooms. The duct model is a simplification in terms of control volume number, and consequently of memory and processing requirements of the cold room model. Additionally, the flow inside the boxes only occurs in one direction in both models, so that the duct model can be used for prediction purposes. In the cold room model, the cell count from vent hole dimension to cold room dimension is several orders of magnitude, requiring a very large number of control volumes that have a significant impact in the memory required and processing time. The features of air flow and heat transfer through vent holes fine geometry (with diameter of 1.5–5 mm) must be captured with very fine mesh to have better computational results, which adversely increases the cell count when modeled inside cold chambers.
Three packaging with different vent hole configurations are modeled. Each packaging box includes alveoli trays with fruits. These packaging boxes are tested inside the duct with the dimensions shown in Figure 3a. Results are compared with the Reference model R. The airflow entering through packaging box is along the direction of positive y in Figure 3a and the convective mode of heat transfer is predominant between the model and cold air entering the duct.
The computational domain has two subdomains of a free air-fluid zone and solid zone (packaging box, alveoli tray, fruit model). The fruit model considers solid zones with two different solid properties, polystyrene and fruit models, as shown in Figure 3b. This condition was required to simulate the experimental set-up described in [17,18,19,20]. As the buoyancy and radiation effects are assumed negligible, they are not taken into account. The density, specific heat capacity and thermal conductivity of the packaging box, alveoli tray, polystyrene balls and agar fruit models are considered constant values [21,22], as shown in Table 1.

2.4. Mathematical Model

The unsteady flow is solved using Reynold’s-average Navier-Stokes equation. The conservation of mass, momentum and energy are given by Equations (1)–(3).
u = 0
( u ) t + ( ( u u ) ) · ( ( u + μ t ρ a ) u ) = s U 1 ρ a P
( ρ a C P a ) ( T a t + U T a ) = ( ( k a + k t ) T a ) + Q a
where ρ a   is the air density (kg/m3), t is time (s), U is the velocity vector (m/s), µ is the dynamic viscosity of air (kg/m·s), p is the pressure (Pa) and s U (m/s2) is the momentum source term. c p a is the air specific heat capacity (J/kg·K) and Ta (K) is the air temperature, k a   (W/m·K) is the thermal conductivity of air, k t (W/m·K) is the turbulent thermal conductivity and it is even function of viscosity. Heat transfer in fruit model is given by Equation (4).
( ρ s c p s ) ( T s t ) = ( k s T s ) + Q s
where ρ s (kg/m3), is the density of the fruit model, c p s (J/kg·K) is the heat capacity of the fruit model, Q s is heat of respiration (W·m−3) and it is assumed negligible. T s (K) is the produce temperature, k s (W/m·K) is thermal conductivity of the fruit model.
Simplifications were considered in the mathematical model. No drying of fruits was considered during cooling process. Only air flow and heat transfer through convection and conduction are modelled. No mass transfer or transport is considered in the simulation.

2.5. Simulation Setup

3D model of packaging box having fruits in alveoli tray is discretized into a set of control volumes, and the meshing was performed (Figure 4) using Ansys Fluent V19. Each packaging box is converted into unstructured tetra hex elements. Due to its complexity having vent with a diameter of 3–6 mm very fine mesh near the box models is performed to capture the features of the model. Two different meshes with 14 million and 21 million were tested. The average relative error of temperature predictions was Erel = 0.021% with a convergence criterion of λ = 1 × 10 4 for residues of continuity, k, ω and velocity, and λ = 1 × 10 6 for energy. Therefore, the simulations were developed with the coarser mesh of 14 million elements. The value of the y+ is around 0.32, 0.40, 0.34, 0.43 for models A,B,C and R. The elements’ quality is maintained with average value of skewness of 0.25 and a maximum value of 0.75 in complex regions, assisting in a better-converged solution.
The accuracy of the CFD model depends on the turbulence modelling used. RANS turbulence modelling is generally preferred in food engineering compared to the Large-eddy simulations. Fine grid generation and detailed input conditions make it complex when used in the stacks of packages placed inside the cold chambers. Regarding the boundary layer modelling Wall functions are preferred over the Low Reynolds Number modelling since LRNM requires high-resolution mesh. However, Wall functions lead to inaccurate predictions, particularly the convective heat transfer [23]. Defraeye et al. [24] performed flow over a spherical body and evaluated the flow parameters such as drag coefficient, Nusselt number, recirculation length and stated that the SST k-ω model performed better with less than 5% error. K-Ɛ models did not perform well with the Low Reynolds number modelling of the boundary layer.
In this study, SST k-ω model is used as most of the cold chain applications [10,11,12] results have better accuracy and convergence when compared with the other two models. The boundary condition must be defined at each surface on the fluid domain. The boundary conditions used in the model are airflow Inlet, airflow Outlet, Wall and Symmetry. The symmetry boundary condition is imposed on half of the computational domain with normal velocity component, and gradients were assumed to be zero [7,25]. Additionally, it reduces the overall computational cost. The airflow Inlet is set with a constant velocity of U = 0.45 m/s with a refrigerated airflow inlet temperature of Tinlet = 278 K. Airflow at the outlet is defined as Pressure outlet p0 = 0 Pa. Turbulence parameters at inlet and outlet are defined by turbulence intensity and length scale. The turbulence intensity is set to 5% based in common estimations of the incoming turbulence intensity. The length scale of 1 m comes from the duct size. The following solution methods are used for the analysis [23,24,25,26,27,28,29,30] in which semi–Implicit (SIMPLE) method is used for the pressure-linked equations. Second order upwind is used for the pressure, momentum and turbulence parameters. Using patch, the fruit models and the solid packaging boxes are set with initial temperature of 295 K. we imposed convergence criterion of 10−4 for continuity, momentum and turbulence and 10−6 for energy equations. After defining the air temperature and velocity monitors for the post processing solution, the solver is initialized with standard initialization. Transient analysis of 8 h was performed with time step of 60 s with 20 iterations per time step and specified value of time steps are set. Predictions are monitored and data are exported at the end of each hour of simulation. The simulation time was set to 8 h because in the experimental tests performed there were no temperature changes at the end of this time [17,18,19,20]. The numerical simulation took around 16 h to converge, being performed on an Intel ® Xeon ® CPU @ (3.47 GHz) with 256 GB of RAM.

3. Analysis and Discussion of Results

Temperature Distribution within Different Packaging Box Configuration

A comparative representation of the thermal heterogeneity is shown in Table 2. The average volume temperature at the fruit simulator, Polystyrene fruit model, alveoli cartonboard and air inside the packaging box for each configuration at the end of simulation (8 h) is listed. The initial temperature was the same for each model, 295 K.
The numerical predictions were analyzed in three-section vertical planes along the x-z axis (x1, x2, x3), and in one horizontal plane along the x-y axis placed at the middle height of the middle box. The location of these planes is shown in Figure 5a.
Figure 5b shows the prediction of the thermal distribution at each packaging box at the end of 8 h simulation. From the temperature contours, the section plane x2 in configurations A and C has a higher temperature at the end of the simulation.
This temperature heterogeneity is developed due to the fruit simulator solid models and their material properties. The airflow entering through the vents must penetrate between the models, which generates high pressure and reduces the velocity before reaching the other end of the box.
The maximum temperature value is predicted in configuration C due to the design of the packaging box. Configuration C is the only model the vent holes are unaligned to the airflow direction, and this phenomenon generates higher resistance to the airflow entering the packaging box. The section plane x1 in all the configurations depicts a significant change in temperature between stacking layers. The bottom layer of fruit models has a relatively higher temperature than the others as they are grounded and lag in free airflow movement. The top layer has more uniform heat removal in all the models as they are exposed to the flow region, while the other two boxes have constrained airflow behavior and airflow enters only through the vent holes.
Considering predictions shown in Table 2 and Figure 5b–e, packaging boxes and alveoli followed by polystyrene balls have best heat removal. With different material properties between the solids, it clearly shows that configuration B has comparatively the highest heat removal. The total vent area opening is much higher, enabling airflow to pass through the packaging box with maximum velocity without resistance to the airflow behavior. Configuration R follows in terms of heat removal, and it is followed by configuration B. Single-walled configuration with rectangular vent opening tends to enhance the packaging box’s airflow with small pressure drop, and consequently air velocity reduction. Configuration C has the highest thermal heterogeneity due to the position and the design of vents. The double-walled configuration with a vent opening of 3 mm in diameter generates a high pressure when the airflow entering the packaging box. Additionally, these vents are unaligned to the airflow, which significantly increases the pressure drop, reducing air velocity and increasing the time taken to reach the fruit models and another end of the box. With the low velocity and high pressure, the time taken to attain uniform airflow within the packaging box is relatively higher, affecting the harvest placed inside. The packaging box’s performance depends mainly on time taken to remove the field heat from the products.
The results are validated by the comparison with experimental results of thermocouples measurements positioned inside fruit simulators as shown in Figure 6 [17]. The time-averaged relative error of fruit temperature is 0.54%, 1.39% and 0.26% for Configurations A, B and C, respectively. At the end of the 8 h-simulation the absolute error of temperature in the fruit simulator placed in the middle tray is 273.9 K, 275 K and 274.2 K for configurations A, B and C, respectively. Despite this small variation, the numerical results follow the trend of the experimental ones. At the end of the 8-h test, the temperature of the agar ball is reduced 13.4 K, 16.5 K and 11.4 K for configurations A, B and C, respectively. It was predicted a temperature reduction of 15.2 K in the fruit simulator placed inside the reference configuration R. The design of packaging box Configuration C significantly reduces the air pressure drop along the box. The fruit simulator placed in this box has the highest temperature at the end of the simulation. Model B has the maximum cooling rate. Fruit temperature achieves a constant temperature after 7 h while model R takes nearly 8 h to reach the steady state. Packaging box C has the higher temperature at the end of the simulation, and from the comparison it is predicted that the design of this configuration significantly reduces the air pressure drop along the box. The unaligned vent hole generates maximum pressure from the results, which increases the time to remove the field heat, and it creates a cooling heterogeneity during the storage.
From the analysis of Figure 6, packaging box B shows the best heat removal along time, both numerically and experimentally. Thus, this configuration is able to extend the shelf life of products stored inside this box as it is able to reduce their initial temperature faster than the other configurations, including the reference one.
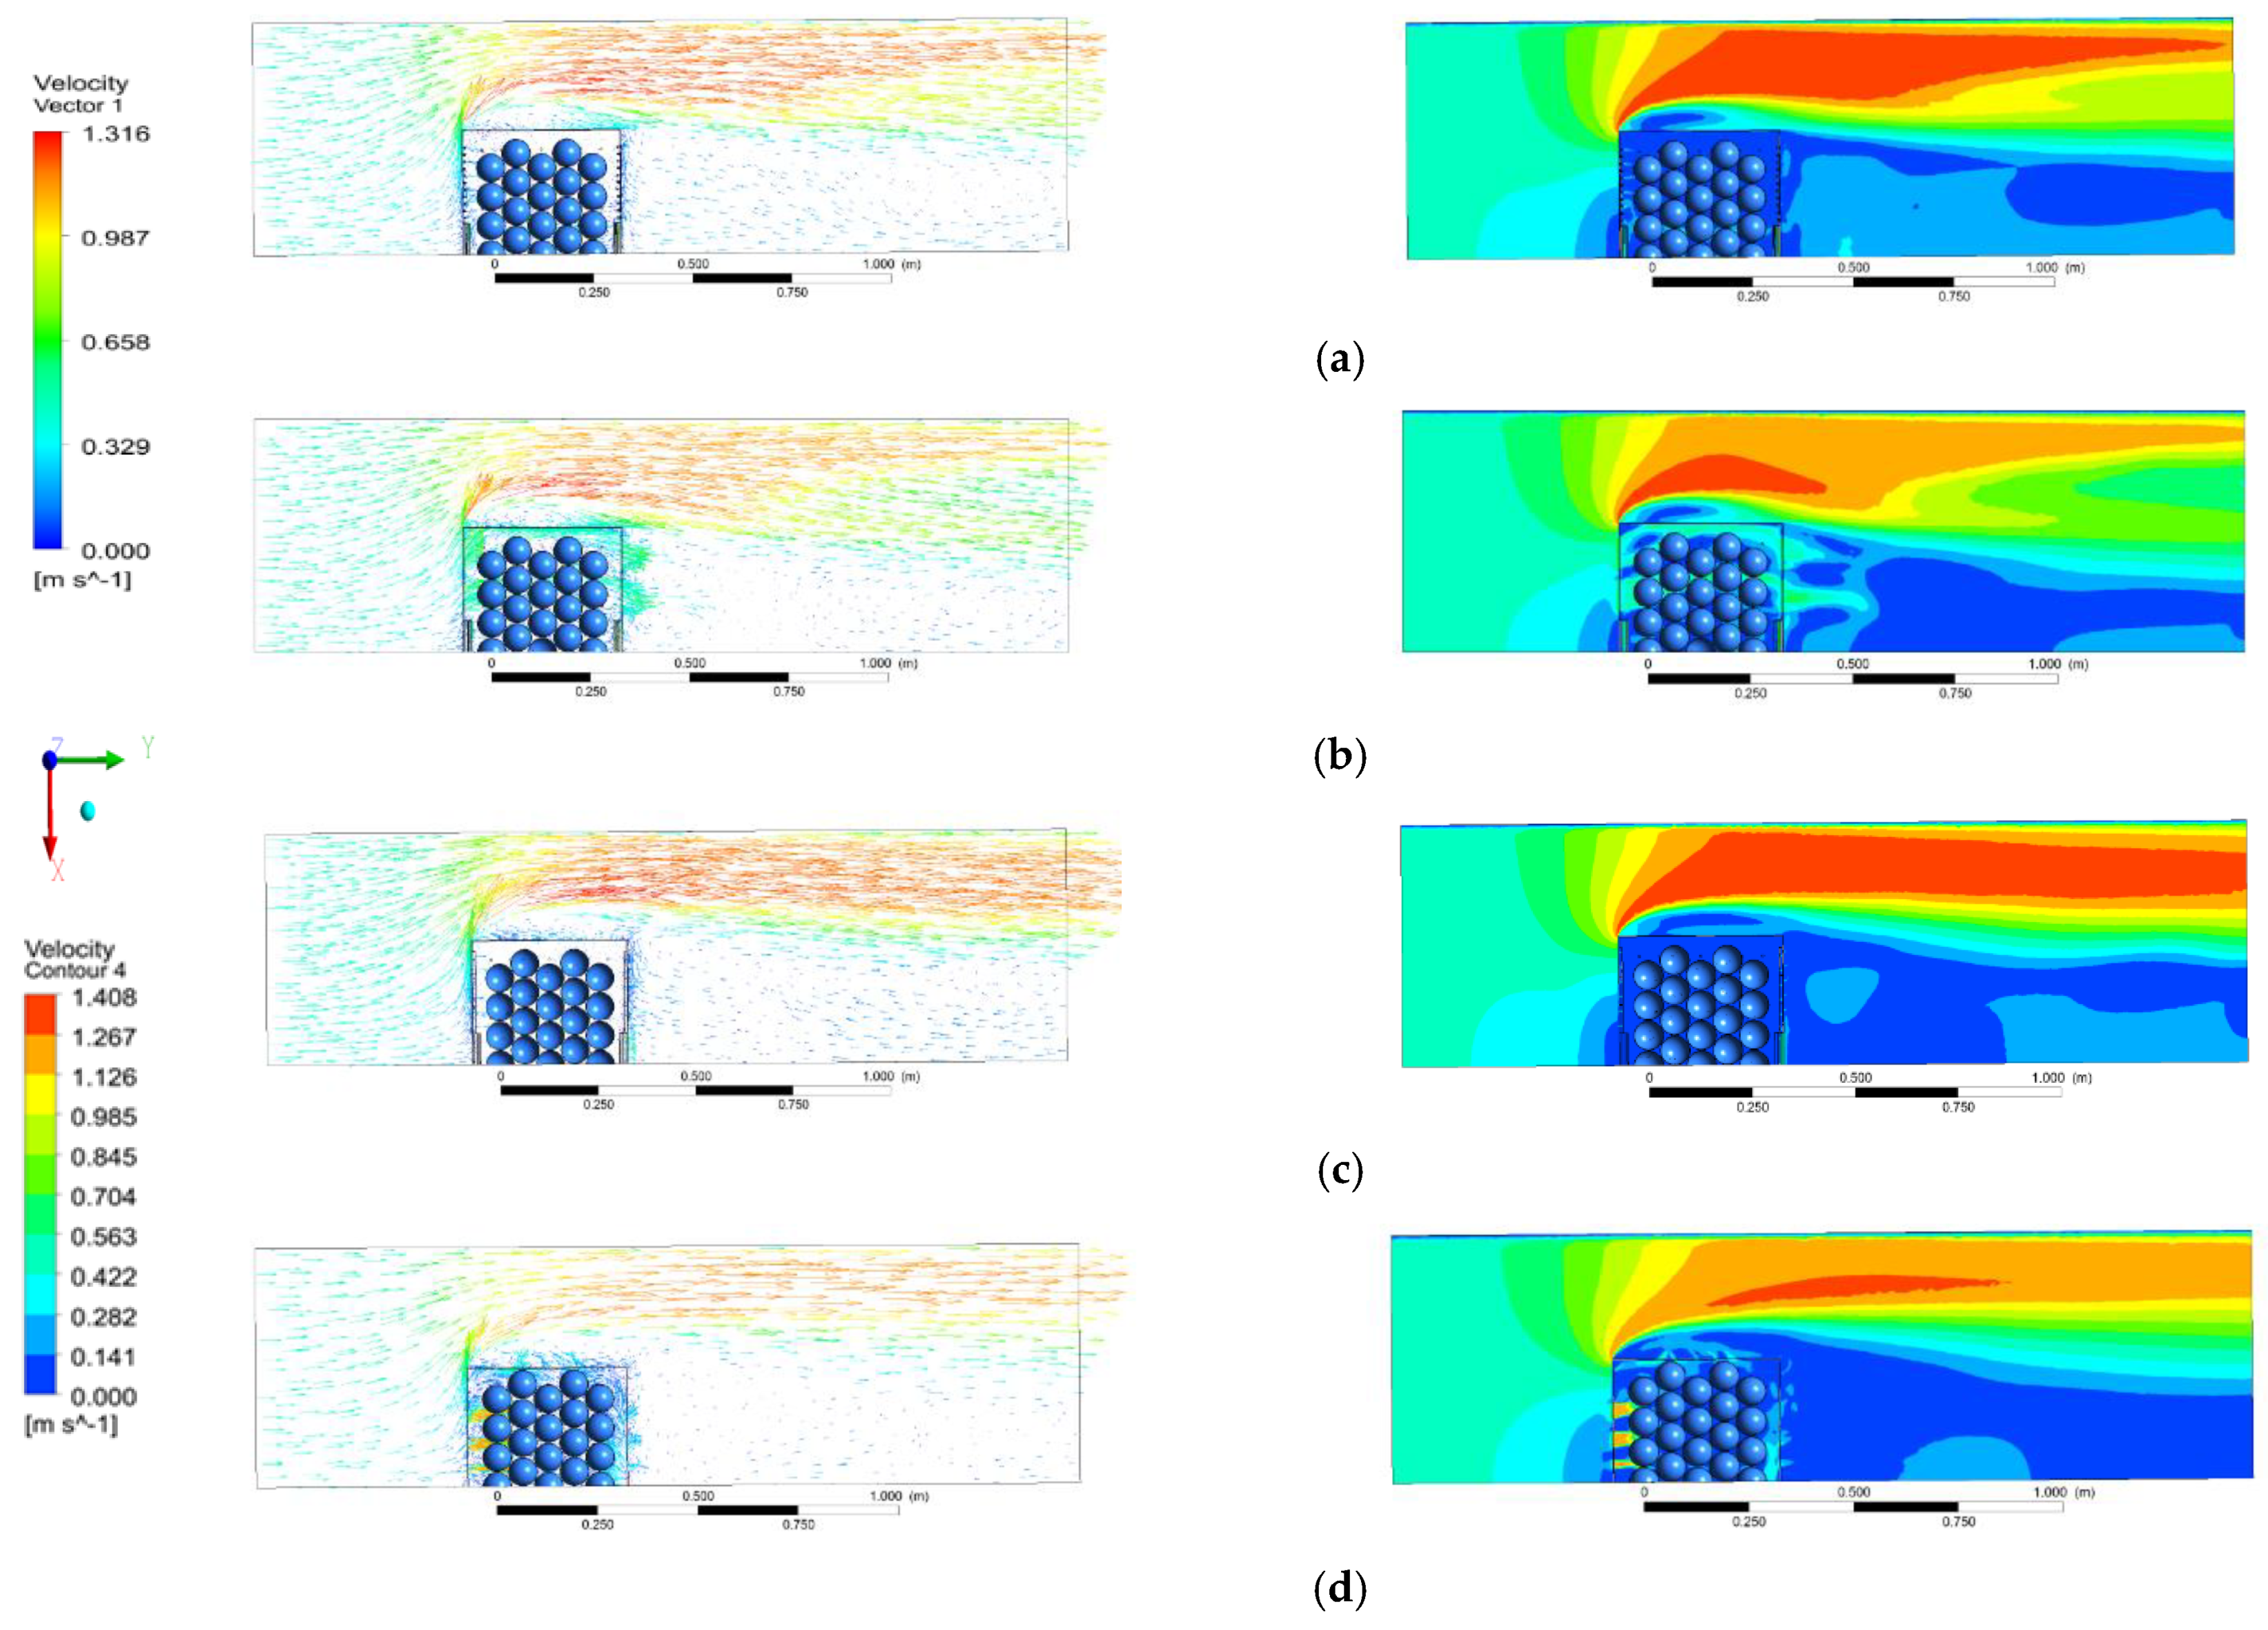
Figure 7 depicts the representation of airflow within the different packaging configurations. To have a better view inside of fluid domain, the model is sectioned along the x-y plane. Velocity vector shows the local airflow direction along the section plane. Airflow enters the domain with an air velocity of 0.45 m/s. A separation occurs due to high pressure in the region near to the packaging box flow when this constant airflow reaches it. Configurations B and R have more even airflow when it penetrates through the vents. Gruyters et al. [16] stated that increasing the airflow increases the pressure drop over a package design. In the design of packaging box configuration B, the resistance to airflow is lower compared to other configurations. The airflow entering the packaging box penetrates through the fruit models. It leaves the packaging box due to the vent hole’s position designed symmetrically to the airflow region. Considering the velocity contours, configurations A and C have very low velocity entering the packaging box. Configuration A vents’ design allows the airflow to pass through the region significantly higher compared to the configuration C. Though configuration A has a varying diameter of 3 mm and 6 mm, the vents’ design aligned to the flow allows the airflow to enter the packaging box.
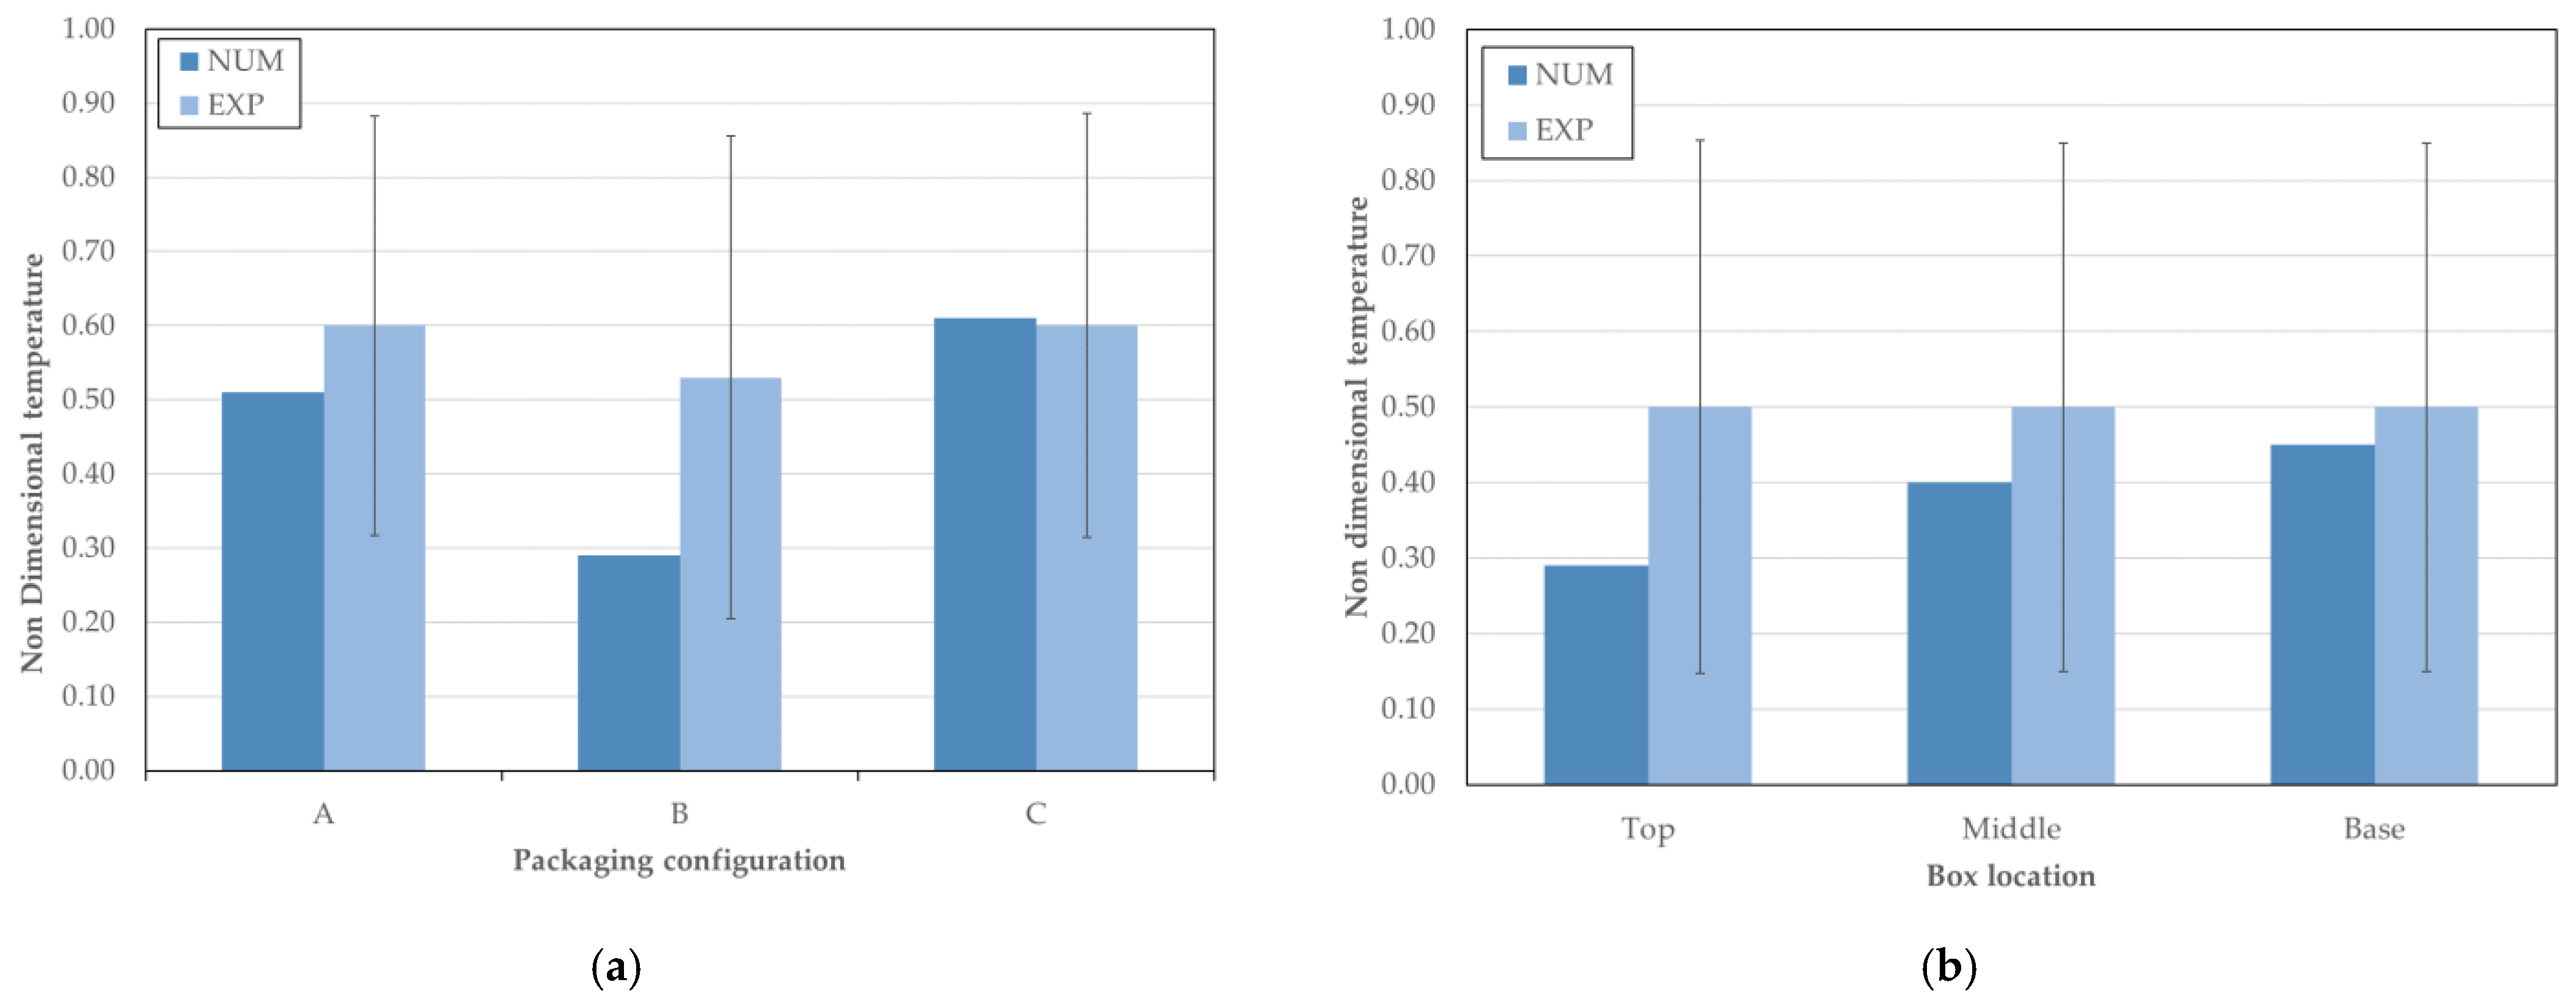
Furthermore, to have more insight into the thermal performance within the packaging box, the temperature of the fruit model in each packaging box is studied, and the results are compared with the experimental data, as shown in Figure 8. For this study, model B is considered to perform the best thermal removal as shown in Figure 6. The packaging box is arranged in a staggered pattern of base mid and top. The results depict that the temperature non-uniformity was high between the fruits in different layers of the box. The box placed at the top removes heat much better than the bottom since it is open and exposed to the surrounding air. Contrarily, the box at the base and middle have higher temperature since the airflow reaches the box only through the vents and hand holes, leading to an uneven temperature distribution during storage. Figure 9 shows the corresponding standard deviation error bars calculated from the fruit simulator temperature at the end of 8 h cooling. The predicted temperature profile stays within the standard error bars of the experimental data. This prediction shows that the numerical results are consistent with the experimental work and that slight discrepancies are acceptable with the different parameters controlling the simulation and experiment. Some research work [5,28,31,32,33] suggested these differences are admissible.

4. Conclusions

This work describes a multi-parameter 3D transient CFD model to predict the fruit models’ airflow and thermal behavior stored in a packaging box placed inside a duct using forced air cooling. The airflow pattern and thermal behavior were investigated between three packaging configurations, and results were compared with the reference configuration model. It shows that thermal distribution inside the box is heterogeneous due to the position and the vent holes’ design. Though configuration A has a varying diameter aligned to the airflow, the pressure generated near the vents restricts the airflow from entering the vent holes at high velocity and increases the uneven thermal distribution between the products placed inside the packaging box. The variation in model B design vent holes across the carton wall distributed air evenly between the fruits and cooled more efficiently and uniformly than other packaging designs. Model C double-wall vents reduce the cooling performance due to the position of vents, restricting the refrigerated air flow entering through the vents. Compared to box B, the temperature difference is around 2 K, significantly affecting the cold chamber’s overall performance during long-term storage. Nevertheless, this design can hold the temperature of the product when kept outside the refrigerated environment.
A detailed study using CFD with different packaging boxes was performed, and configuration B is identified with more uniform cooling followed by the configurations R and A. At the end of 8 h of cooling, the agar ball temperature is predicted to be lower by 1.5 K to 5 K in configuration B than in the other configurations. The future work aims to evaluate the heating phase (when boxes are extracted from the refrigeration chamber) and develop a complete flow behavior with pallets placed in the cold storage. Reducing the time taken to remove the field heat from the products, conversely, increases the overall performance of the cold chain storage.

Author Contributions

Conceptualization, P.D.G. and P.D.S.; methodology, P.D.G. and P.D.S.; validation, P.D.G. and P.D.S.; formal analysis, A.I., J.C., P.D.G. and P.D.S.; investigation, A.I. and J.C.; resources, P.D.G., P.D.S., and N.A.; data curation, A.I., J.C., P.D.G. and P.D.S.; writing—original draft preparation, A.I. and J.C.; writing—review and editing, P.D.G. and P.D.S.; supervision, P.D.G. and P.D.S.; project administration, P.D.G. and N.A.; Funding acquisition, P.D.G., P.D.S. and N.A. All authors have read and agreed to the published version of the manuscript.

Funding

This study is within the activities of project “Pack2Life—High performance packaging”, project IDT in consortium n.° 33792, call n.° 03/SI/2017, Ref. POCI-01-0247-FEDER-033792, promoted by COMPETE 2020 and co-funded by FEDER within Portugal 2020.

Institutional Review Board Statement

Not applicable.

Informed Consent Statement

Not applicable.

Data Availability Statement

Not applicable.

Acknowledgments

The authors thank the opportunity and financial support to carry on this project to Fundação para a Ciência e Tecnologia (FCT) and R&D Unit “Centre for Mechanical and Aerospace Science and Technologies” (C-MAST), under project UIDB/00151/2020.

Conflicts of Interest

The authors declare no conflict of interest.

References

  1. Defraeye, T.; Cronjé, P.; Berry, T.; Opara, U.L.; East, A.; Hertog, M.; Verboven, P.; Nicolai, B. Towards integrated performance evaluation of future packaging for fresh produce in the cold chain. Trends Food Sci. Technol. 2015, 44, 201–225. [Google Scholar] [CrossRef]
  2. Pathare, P.B.; Opara, U.L.; Vigneault, C.; Delele, M.A.; Al-Said, F.A.-J. Design of packaging vents for cooling fresh horticultural produce. Food Bioprocess. Technol. 2012, 5, 2031–2045. [Google Scholar] [CrossRef]
  3. Wu, W.; Defraeye, T. Identifying heterogeneities in cooling and quality evolution for a pallet of packed fresh fruit by using virtual cold chains. Appl. Therm. Eng. 2018, 133, 407–417. [Google Scholar] [CrossRef]
  4. Zhao, C.-J.; Han, J.-H.; Yang, X.-T.; Qian, J.-P.; Fan, B.-L. A review of computational fluid dynamics for forced-air cooling process. Appl. Energy 2016, 168, 314–331. [Google Scholar] [CrossRef]
  5. Han, J.-H.; Zhao, C.-J.; Qian, J.-P.; Ruiz-Garcia, L.; Zhang, X. Numerical modeling of forced-air cooling of palletized apple: Integral evaluation of cooling efficiency. Int. J. Refrig. 2018, 89, 131–141. [Google Scholar] [CrossRef]
  6. Han, J.-H.; Badia-Melis, R.; Yang, X.-T.; Ruiz-Garcia, L.; Qian, J.-P.; Zhao, C.-J. CFD simulation of airflow and heat transfer during forced-air precooling of apples. J. Food Process. Eng. 2017, 40, e12390. [Google Scholar] [CrossRef]
  7. Han, J.-H.; Qian, J.-P.; Zhao, C.-J.; Yang, X.-T.; Fan, B.-L. Mathematical modelling of cooling efficiency of ventilated packaging: Integral performance evaluation. Int. J. Heat Mass Transf. 2017, 111, 386–397. [Google Scholar] [CrossRef]
  8. Defraeye, T.; Lambrecht, R.; Tsige, A.A.; Delele, M.A.; Opara, U.L.; Cronjé, P.; Verboven, P.; Nicolai, B. Forced-convective cooling of citrus fruit: Package design. J. Food Eng. 2013, 118, 8–18. [Google Scholar] [CrossRef] [Green Version]
  9. Wu, W.; Cronjé, P.; Nicolai, B.; Verboven, P.; Opara, U.L.; Defraeye, T. Virtual cold chain method to model the postharvest temperature history and quality evolution of fresh fruit–A case study for citrus fruit packed in a single carton. Comput. Electron. Agric. 2018, 144, 199–208. [Google Scholar] [CrossRef]
  10. Berry, T.M.; Defraeye, T.; Nicolai, B.; Opara, U.L. Multiparameter analysis of cooling efficiency of ventilated fruit cartons using CFD: Impact of vent hole design and internal packaging. Food Bioprocess. Technol. 2016, 9, 1481–1493. [Google Scholar] [CrossRef]
  11. Delele, M.A.; Ngcobo, M.E.K.; Getahun, S.T.; Chen, L.; Mellmann, J.; Opara, U.L. Studying airflow and heat transfer characteristics of a horticultural produce packaging system using a 3-D CFD model. Part I: Model development and validation. Postharvest Biol. Technol. 2013, 86, 536–545. [Google Scholar] [CrossRef]
  12. Mukama, M.; Ambaw, A.; Opara, U.L. Advances in design and performance evaluation of fresh fruit ventilated distribution packaging: A review. Food Packag. Shelf Life 2020, 24, 100472. [Google Scholar] [CrossRef]
  13. O’Sullivan, J.L.; Ferrua, M.J.; Love, R.; Verboven, P.; Nicolaï, B.; East, A. Forced-air cooling of polylined horticultural produce: Optimal cooling conditions and package design. Postharvest Biol. Technol. 2017, 126, 67–75. [Google Scholar] [CrossRef]
  14. Getahun, S.; Ambaw, A.; Delele, M.A.; Meyer, C.J.; Opara, U.L. Analysis of airflow and heat transfer inside fruit packed refrigerated shipping container: Part I–Model development and validation. J. Food Eng. 2017, 203, 58–68. [Google Scholar] [CrossRef]
  15. Han, J.W.; Zhao, C.J.; Yang, X.T.; Qian, J.P.; Fan, B.L. Computational modeling of airflow and heat transfer in a vented box during cooling: Optimal package design. Appl. Therm. Eng. 2015, 91, 883–893. [Google Scholar] [CrossRef]
  16. Gruyters, W.; Defraeye, T.; Verboven, P.; Berry, T.; Ambaw, A.; Opara, U.L.; Nicolai, B. Reusable boxes for a beneficial apple cold chain: A precooling analysis. Int. J. Refrig. 2019, 106, 338–349. [Google Scholar] [CrossRef]
  17. Leitão, F.; Madhan, S.K.; Silva, P.D.; Gaspar, P.D. Experimental testing of the thermal response of different food alveoli solutions for packaging boxes. In Proceedings of the World Congress on Engineering (WCE 2021), London, UK, 7–9 July 2021. [Google Scholar]
  18. Madham, S.K.; Leitão, F.; Silva, P.D.; Gaspar, P.D.; Duarte, D. Experimental tests of the thermal behaviour of new sustainable bio-packaging food boxes. Procedia Environ. Sci. Eng. Manag. 2021, 8, 215–223. [Google Scholar]
  19. Curto, J.; Ilangovan, A.; Leitão, F.; Gaspar, P.D.; Silva, P.D.; Alves, N. Impact on cooling behaviour of vent-holes design on fruit packaging boxes: Experimental and numerical study. In Proceedings of the 14th World Congress in Computational Mechanics (WCCM) ECCOMAS Congress 2020, Paris, France, 11–15 January 2021. [Google Scholar]
  20. Leitão, F.; Silva, P.D.; Gaspar, P.D.; Pires, L.C.; Gonçalves, A.R.; Duarte, D. Experimental study of thermal performance of different fruit packaging box designs. Energies 2021, 14, 3588. [Google Scholar] [CrossRef]
  21. Bergman, T.L.; Lavine, A.S.; Incropera, F.P.; DeWitt, D.P. Fundamentals of Heat and Mass Transfer, 8th ed.; John Wiley and Sons Inc.: Hoboken, NJ, USA, 2017. [Google Scholar]
  22. Zhang, M.; Che, Z.; Chen, J.; Zhao, H.; Yang, L.; Zhong, Z.; Lu, J. Experimental determination of thermal conductivity of water-agar gel at different concentrations and temperatures. J. Chem. Eng. Data 2011, 56, 859–864. [Google Scholar] [CrossRef]
  23. Defraeye, T.; Blocken, B.; Carmeliet, J. CFD analysis of convective heat transfer at the surfaces of a cube immersed in a turbulent boundary layer. Int. J. Heat Mass Transf. 2010, 53, 297–308. [Google Scholar] [CrossRef] [Green Version]
  24. Defraeye, T.; Verboven, P.; Nicolai, B. CFD modelling of flow and scalar exchange of spherical food products: Turbulence and boundary-layer modelling. J. Food Eng. 2013, 114, 495–504. [Google Scholar] [CrossRef] [Green Version]
  25. Ambaw, A.; Bessemans, N.; Gruyters, W.; Gwanpua, S.G.; Schenk, A.; De Roeck, A.; Nicolai, B.M. Analysis of the spatiotemporal temperature fluctuations inside an apple cool store in response to energy use concerns. Int. J. Refrig. 2016, 66, 156–168. [Google Scholar] [CrossRef] [Green Version]
  26. Dehghannya, J.; Ngadi, M.; Vigneault, C. Mathematical modeling of airflow and heat transfer during forced convection cooling of produce considering various package vent areas. Food Control 2011, 22, 1393–1399. [Google Scholar] [CrossRef]
  27. Malekjani, N.; Jafari, S.M. Simulation of food drying processes by Computational Fluid Dynamics (CFD); recent advances and approaches. Trends Food Sci. Technol. 2018, 78, 206–223. [Google Scholar] [CrossRef]
  28. Ilangovan, A.; Gaspar, P.D.; Silva, P.D.; Duarte, D. A parametric study and performance evaluation of the different vent hole configuration for fruit packaging using Compu-tational Fluid Dynamics. In Proceedings of the 6th IIR International Conference on Sustainability and the Cold Chain (ICCC 2020), Nantes, France, 26–28 August 2020; pp. 508–515. [Google Scholar]
  29. Nanga, R.; Curto, J.; Gaspar, P.D.; Silva, P.D. Numerical parametric study of the influence of the arrangement of fruit packaging boxes in the fluid flow and heat transfer. In Proceedings of the III Environmental Innovations: Advances in Engineering, Technology and Management (EIAETM Conference), Online Conference, 7 September–1 October 2021. [Google Scholar]
  30. Ilangovan, A.; Gaspar, P.D.; Silva, P.D.; Gonçalves, A.R.; Sampaio, A.M.; Pontes, A.J.; Alves, N. CFD parametric study of the thermal performance of different fruit packaging box designs. In Proceedings of the AIP Conference Proceedings, 15th International Symposium on Numerical Analysis of Fluid Flows, Heat and Mass Transfer–Numerical Fluids 2020 (ICNAAM 2020), Rhodes, Greece, 17–23 September 2020. [Google Scholar]
  31. O’Sullivan, J.; Ferrua, M.J.; Love, R.; Verboven, P.; Nicolaï, B.; East, A. Modelling the forced-air cooling mechanisms and performance of polylined horticultural produce. Postharvest Biol. Technol. 2016, 120, 23–35. [Google Scholar] [CrossRef] [Green Version]
  32. Ilangovan, A.; Silva, P.D.; Gaspar, P.D. Airflow and thermal behavior within peaches packaging box using Computational Fluid Dynamics—A preliminary study. KnE Eng. 2020, 5, 222–231. [Google Scholar] [CrossRef]
  33. Badia-Melis, R.; Mc Carthy, U.; Ruiz-Garcia, L.; Garcia-Hierro, J.; Robla Villalba, J.I. New trends in cold chain monitoring applications-A review. Food Control 2018, 86, 170–182. [Google Scholar] [CrossRef]
Figure 1. Packaging box configurations: (a1,b1,c1,d1) 2D front view considering the airflow direction; (a3,b2,c2,d2) 3D trimetric view. (a) Configuration A. (a1) 2D Front view. (a2) side view of vent. (a3) 3D trimetric view. (b) Configuration B. (b1) 2D front view. (b2) 3D trimetric view. (c) Configuration C. (c1) 2D front view. (c2) 3D trimetric view. (d) Configuration R. (d1) 2D front view. (d2) 3D trimetric view.
Energies 14 07990 g001
Figure 2. Cold Chamber Model and equipments used to record temperature. (a) Packaging box with fruit models inside chamber. (b) Agar fruit model. (c) Positions of the sensors in the different packages. (d) Measurement equipment—Thermocouple. (e) Measurement equipment—Thermo-hygrometer.
Energies 14 07990 g002
Figure 3. CAD Model: (a) Packaging box with fruit models; (b) Fruit models placed in the alveoli: Legend: (1) Polystyrene balls, (2) Alveoli tray (3) Fruit Simulator model (all dimensions are in mm).
Energies 14 07990 g003
Figure 4. Computational domain: (a) Tetra hex mesh of the 3D model; (b) section view along x-y plane.
Energies 14 07990 g004
Figure 5. Temperature distribution after 8 h of simulation with section planes along x-z axis.
Energies 14 07990 g005
Figure 6. Numerical prediction of the temperature variation in the center point of Agar fruit model in the middle tray during the 8-h test.
Energies 14 07990 g006
Figure 7. Velocity vector and contour along x-y axis at 8 h of cooling. (a) Configuration A. (b) Configuration B. (c) Configuration C. (d) Configuration R.
Energies 14 07990 g007
Figure 8. Comparison of temperature distribution within packaging configuration B at different box positions with experimental data.
Energies 14 07990 g008
Figure 9. Comparison of numerical and experimental data of non-dimensional temperature: Average values and standard deviation. (a) Three different packaging boxes. (b) Packaging configuration B at different layer (Base, Middle and Top).
Energies 14 07990 g009
Table 1. Thermophysical properties of materials used in CFD models.
Physical ParametersFruit Simulator PolystyreneAlveoli TrayPackaging Box Polypropylene
Density (kg/m3)100016930800
Thermal conductivity (W/m·K)0.5500.0400.1800.150
Specific heat capacity (J/kg·K)4.1981.2101.3401.200
Table 2. Average volume temperature (K) after 8 h of cooling.
ModelsFruit SimulatorPolystyrene BallsAlveoliPackaging Box
A279.9278.2278.3278.1
B278.9278.1278.1278.0
C281.0278.4278.5278.2
R279.2278.0278.1278.0
Publisher’s Note: MDPI stays neutral with regard to jurisdictional claims in published maps and institutional affiliations.