1. Introduction
The electric distribution utilities are responsible for supplying energy to an extensive number of consumers spanned across vast geographic regions. This service is provided through the electrical grid, which is also spread along the utility operating area. In this scenario, distribution utilities should allocate and manage resources all over its concession area, aiming to provide its services considering energy quality goals while reducing operational costs.
Workforce planning aims to optimally allocate and size work teams to perform a given task on a specific time horizon. This problem includes the proposition (strategic planning) of operational facilities (depots) where the teams start their daily work routine, sizing (tactical planning) the number of workers in each depot and finally distributing (operational planning) each staff member in a work schedule. These studies are necessarily based on some spatio-temporal service demand predictions, which must be conducted for different forecasting horizons (long, medium and short term) and also for distinct geographical scales (city, district, zone).
The strategic planning algorithm receives location data of the forecasted services and, with this data, optimizes the positioning of operational bases (depots), taking into consideration the actual bases. As a result, the system can indicate the opening or closing of some bases if it seems necessary to reduce costs and improve services quality and efficiency. Depots are related to real locations that are used as stations from where work teams can be dispatched during working hours. Strategic planning has a long-term impact (years, for example), and the actions proposed by companies in this context may include employee training quality policies and infrastructure location [
1,
2].
The tactical planning algorithm is responsible for sizing the number of electricians per depot within the region being studied and involves more detailed decisions such as stock levels of spare parts, production rates, outsourcing, hiring, and allocation of employees. Discussions about this activity can be observed in [
3,
4,
5,
6]. This algorithm receives the number of electricians available on the existing bases as well as the location of these bases, and unlike strategic planning, it covers a medium-term period (weeks to months). With this information on hand, the sizing of the necessary teams for dealing with the forecasted services can be done, resulting in the required number of teams and works per depot to deal with this predicted service demand.
The operational planning algorithm is responsible for defining the work schedule of the workforce crew. With user-defined schedules and the number of available electricians per base, this algorithm allocates the electricians along with the schedules, forming teams to deal with the service demand forecasted and to minimize idle time. This algorithm consists of a short-term horizon (hours to weeks) and encompasses the detailed actions needed to achieve immediate goals [
5]. As a result, this returns the schedule that best fits the scale of the demand and maximizes the productivity of the workforce.
As previously mentioned, the planning algorithms should receive the respective spatio-temporal service demand forecasting. These projections are directly related to the technical features of each work. The demand for planned actions such as inspections and preventive maintenance could be provided by maintenance programming strategies [
7]. Other planned works, including commercial services, such as new consumer connections or power cuts due to the lack of payment or frauds, can also be furnished by specialized algorithms [
8].
Unplanned services related to power outages cannot be programmed, but their demand should also be forecasted. This prediction is very important for distribution system operation, enabling preventive actions that aim to improve power system resilience [
9]. The literature shows analytics and machine learning algorithms that process the service orders (SOs) historical data along with meteorological information aiming to provide short-term predictions of the spatio-temporal distribution of power outages in the concession area [
10,
11,
12]. These algorithms require historical meteorological data and also its predictions, which jeopardize its application in utilities without this kind of information. Given the high level of uncertainty involved in predicting climate events, this forecasting strategy is not recommended for long-term studies like the ones required by workforce planning. In fact, to the best knowledge of the authors’ knowledge, the literature does not present an algorithm for long-term prediction of the number of power outages distributed in a geographic region.
The historical data regarding the executed service orders (SOs) represents a huge database including different types of information, such as location (latitude and longitude), technical features (type of work, execution time) and so on. Big data, according to [
13], refers to extremely large data sets of varying types of data, being a combination of structured, semi-structured, and unstructured data, which can be collected, stored, and later analyzed to provide insights for organizations and used in machine learning projects, predictive modeling, and other advanced analytics. In [
14], big data is cited as a massive amount of information (exceeding many zettabytes), which requires other techniques than commonly used software to gather, store, and process data within a short time. These big data algorithms can be applied to extract valuable insights from operational databases such as executed service orders (SOs) exploited through the entire concession area.
This paper shows a Python-based big data analytics algorithm for spatio-temporal service orders (SOs) demand forecasting in electric distribution utilities. This algorithm is a module of the Intelligent Workforce Planning System called AWDEC (Aplicação Web para Dimensionamento de Equipes de Campo—Brazilian acronym for Web-based Workforce Planning System). This platform was developed for Brazilian electric distribution utilities, and it is split into four modules, such as spatio-temporal forecasting; strategic planning (depots allocation); tactical planning (field teams sizing); and operational planning (field teams scheduling). The optimization planning modules use optimization techniques, such as Particle Swarm and Mixed-Integer Linear Programming, for solving the respective problems. These techniques have several different applications in energy systems, as reported in [
15,
16,
17].
The forecasting module is responsible for services demand prediction based on the work history provided by the distribution utility. The prediction is produced for each location under the responsibility of the energy company and each month along the year, taking into account typical workweeks to project the hourly SOs demand. The forecasted emergency SOs demand, which is related to power outages, is stochastically distributed considering its historical and geographical spread, projecting the impacted consumers and its individual interruption indexes. These individual indexes are considered in the financial penalties estimation algorithm regarding interruption duration goal violations, which is one of the costs to be minimized in the strategic planning model (depots allocation).
This web-based platform is already being used by eleven distribution utilities from the Energisa group in all Brazilian geographical regions. Due to the sheer complexity of this system, this paper is dedicated to the forecasting module with an emphasis on emergency services demand prediction. As previously mentioned, and also stated in [
3], to the best of the authors’ knowledge, this is the first proposal of a spatio-temporal service orders demand prediction algorithm for distribution utilities that integrate different time horizons (year, month, weeks, days and hours) and distinct geographic divisions (locations and squares). Aiming to provide an adaptive algorithm that automatically represents the patterns presented in the service order time-series from each location, a seasonal mean average strategy was selected. This algorithm is flexible for dealing with different situations regarding data availability, and it also represents weather seasonality, one of the main causes of power outages in distribution systems [
3].
2. Methodology
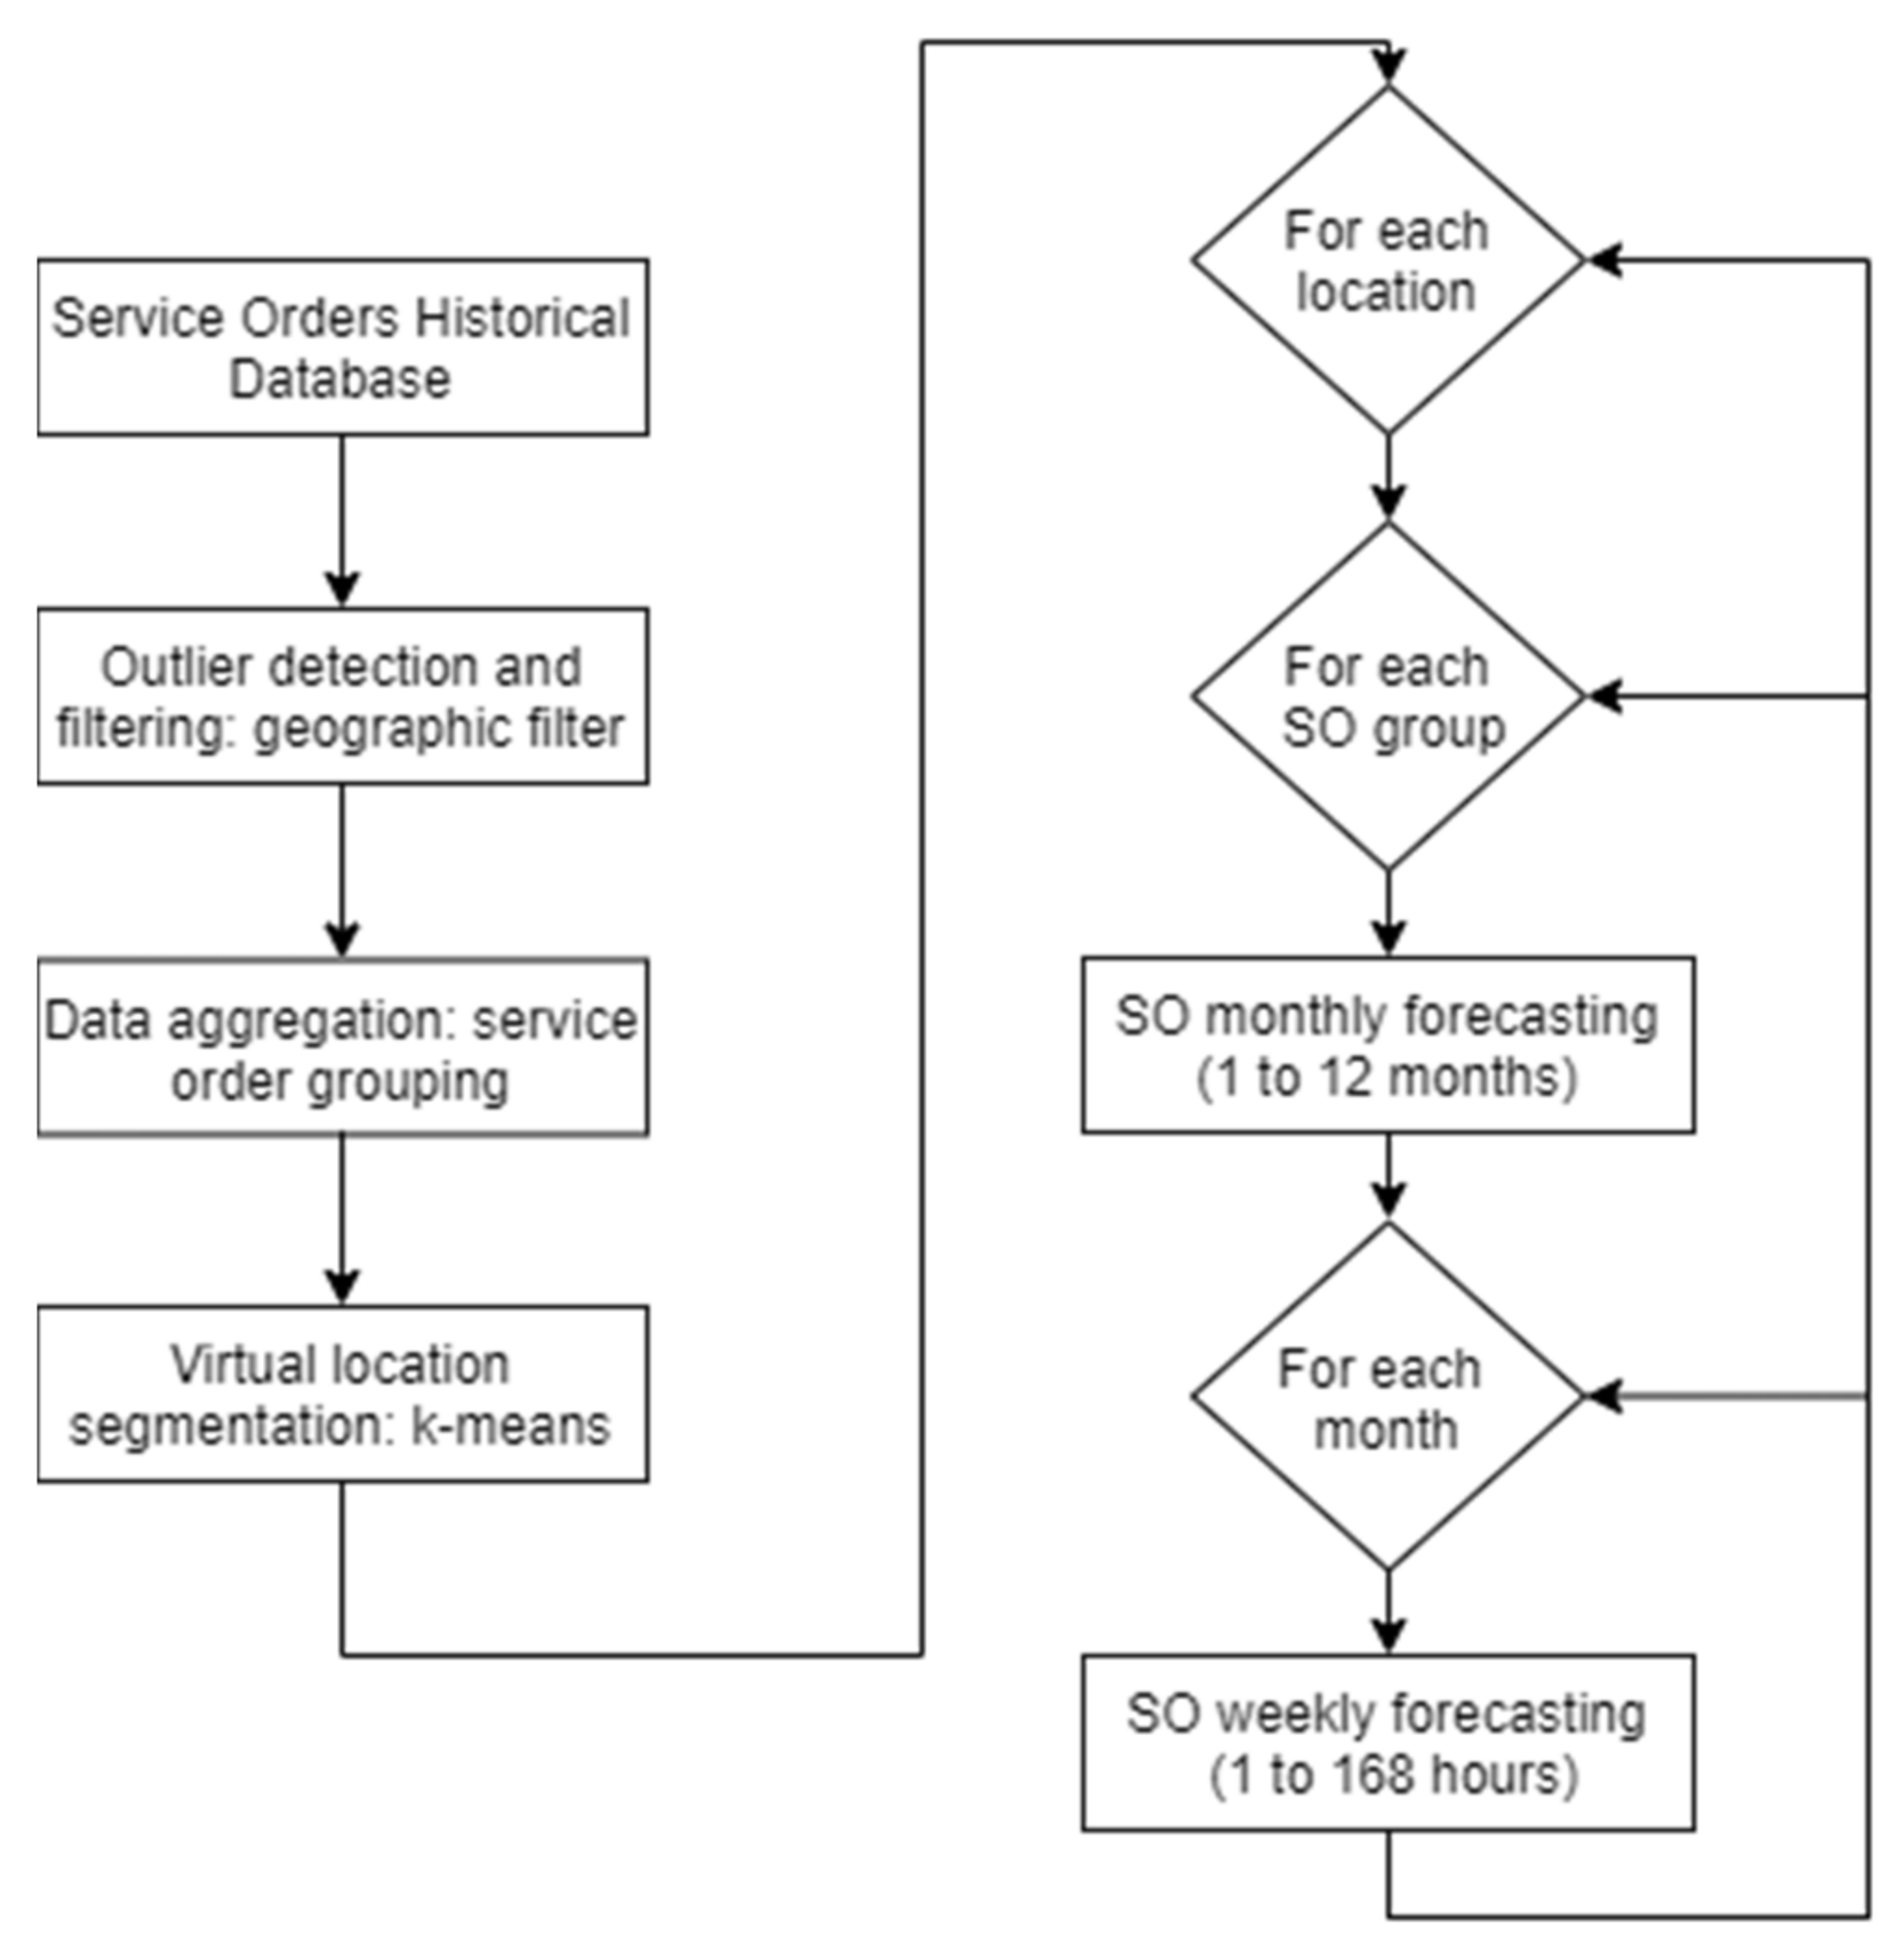
The proposed algorithm processes the historical data related to the service orders executed by the field teams all around the utility concession area, providing spatio-temporal predictions of the number of services to be executed in different time scales (year, month, week, day and hour) and geographic divisions (city, squares). The algorithm needs to filter the historical database that aims to detect and also correct possible outliers related to missing geographic coordinates and/or bad registers of this information. Emergency services related to power outages are geographically distributed in a more detailed way, sorting the affected consumers in order to estimate the time without energy for each client. This duration is compared with individual time goals for each consumer, providing financial penalties that must be paid by the utilities for its clients.
Figure 1 summarizes the proposed spatio-temporal forecasting algorithm, and
Figure 2 points out the main features regarding the distribution of the monthly predicted emergency services. Each step of the proposed algorithm will be shown in the next subsections.
2.1. Geographic Filter of Emergency Service Orders
This functionality is responsible for verifying if the 2-tuple <latitude, longitude> from an order belongs to a certain municipality. It depends on two premises: (1) geographic coordinates are described in the WGS-84 cartographic system; (2) cartographic limits of municipalities are available in a geographic base.
Geographical coordinates can be described according to a wide range of cartographic systems, but those provided by the GPS (Global positioning system) are represented in WGS-84. GPS receivers can provide coordinates in other cartographic systems, but such receivers need to be configured to do so. It is not common to find dedicated GPS receivers configured with cartographic systems other than the WGS-84, and usually, the transformation between systems is conducted offline after the coordinates have been exported to a file. In the case of the cell phone′s native GPS receivers, there is no possibility of such configuration. Thus, it is highly probable that any coordinates provided to the application will be represented in WGS-84, even if the user is not aware of it.
The IBGE (Brazilian Institute of Geography and Statistics) provides data from the twelfth census operation carried out in Brazil, known as the 2010 Census. Until the publication date of this article, the next and newer census was not accomplished. Among the various census data, it is available as the base of the municipal territorial limits, which represents the current situation of the Brazilian administrative political division, on a scale compatible with 1:250,000, without cartographic generalization or redundant points suppression. For each state, the group of municipalities is made available in shapefile format, referenced to the Brazilian Geodesic System (currently SIRGAS 2000). For this work, the bases of municipal networks of all Brazilian states were obtained from the IBGE FTP portal [
18].
Note that the latitude and longitude coordinates used in this project are given in WGS-84 and that these were matched against municipal boundaries described in a different cartographic system called SIRGAS 2000 [
19], it is very common to make a direct comparison between points described in the two systems because they are significantly similar. The maximum error in an operation like this, under very specific conditions, is up to 70 cm. In the case of the coordinate validation proposed herein, such maximum error value is fully acceptable, and therefore there was no motivation to implement a coordinate transformation.
The coordinates validation was constructed in Python 3.x, and the reading of the shapefiles of the municipal mesh was carried out with a library called Fiona [
20]. The algorithm is quite straightforward: a test is performed on all polygons to verify that the point to be validated (latitude, longitude) is within it, and then it is verified that the polygon found has the same name as the desired municipality. The routine to check whether a point is inside any polygon was taken from the classical literature on geometric modeling for detecting points inside concave and convex polygons [
21].
The methodology used to calculate the prediction of SOs depends on the historical database related to SOs execution (time and location). Therefore, it is first necessary to prepare the data before the application of the forecasting algorithm. This is required to filter out gross errors. This process starts at filtering the history of service orders (SO) completed, for it is required to assess the consistency of the variety of information that encompasses this data; in particular, the confirmation of the geo-coordinates referring to the location where the SO was executed. This information is vital for the accuracy of the estimation of the volume of services demand per location. In the case that this information is missing from the records of executed services, the coordinate is replaced by the coordinate of the first client affected by this service. If the client’s coordinates are also missing, the coordinates are replaced by the centroid of the region. Records of services without affected clients are populated with client information from the ones geographically closer to the coordinates of the service.
2.2. Service Order Grouping
The services to be performed by the distribution utilities field teams vary both in technical terms and also in commercial aspects. For instance, works related to power outages include distinct activities going from protective device reclosing to a transformer substitution. The myriad of service types requires some aggregation aiming to identify temporal patterns without jeopardizing the workforce planning objectives.
The service orders (SOs) are classified into 3 categories: Emergency, Scheduled Regulated and Scheduled Non-Regulated. The emergency SOs must be handled as soon as possible to meet the limits set by [
22]. For this category, the calculation of the time the client remains off the power grid starts after three minutes without electricity supply. On the other hand, Regulated Scheduled SOs also generated payback but can be completed in a longer period (a few days) compared to the emergency ones. Lastly, Non-Regulated Scheduled SOs do not generate any penalties to the utility. Thus, it is of great importance to focus on Emergency occurrences. All service types are lumped together into their general categories; that is, all emergency service orders go to the Emergency Occurrence Service Block meanwhile all the planned services (maintenance, for example) go into Schedule Service blocks, which are further split into Regulated and Non-Regulated blocks.
The average execution and preparation times are calculated based on history.
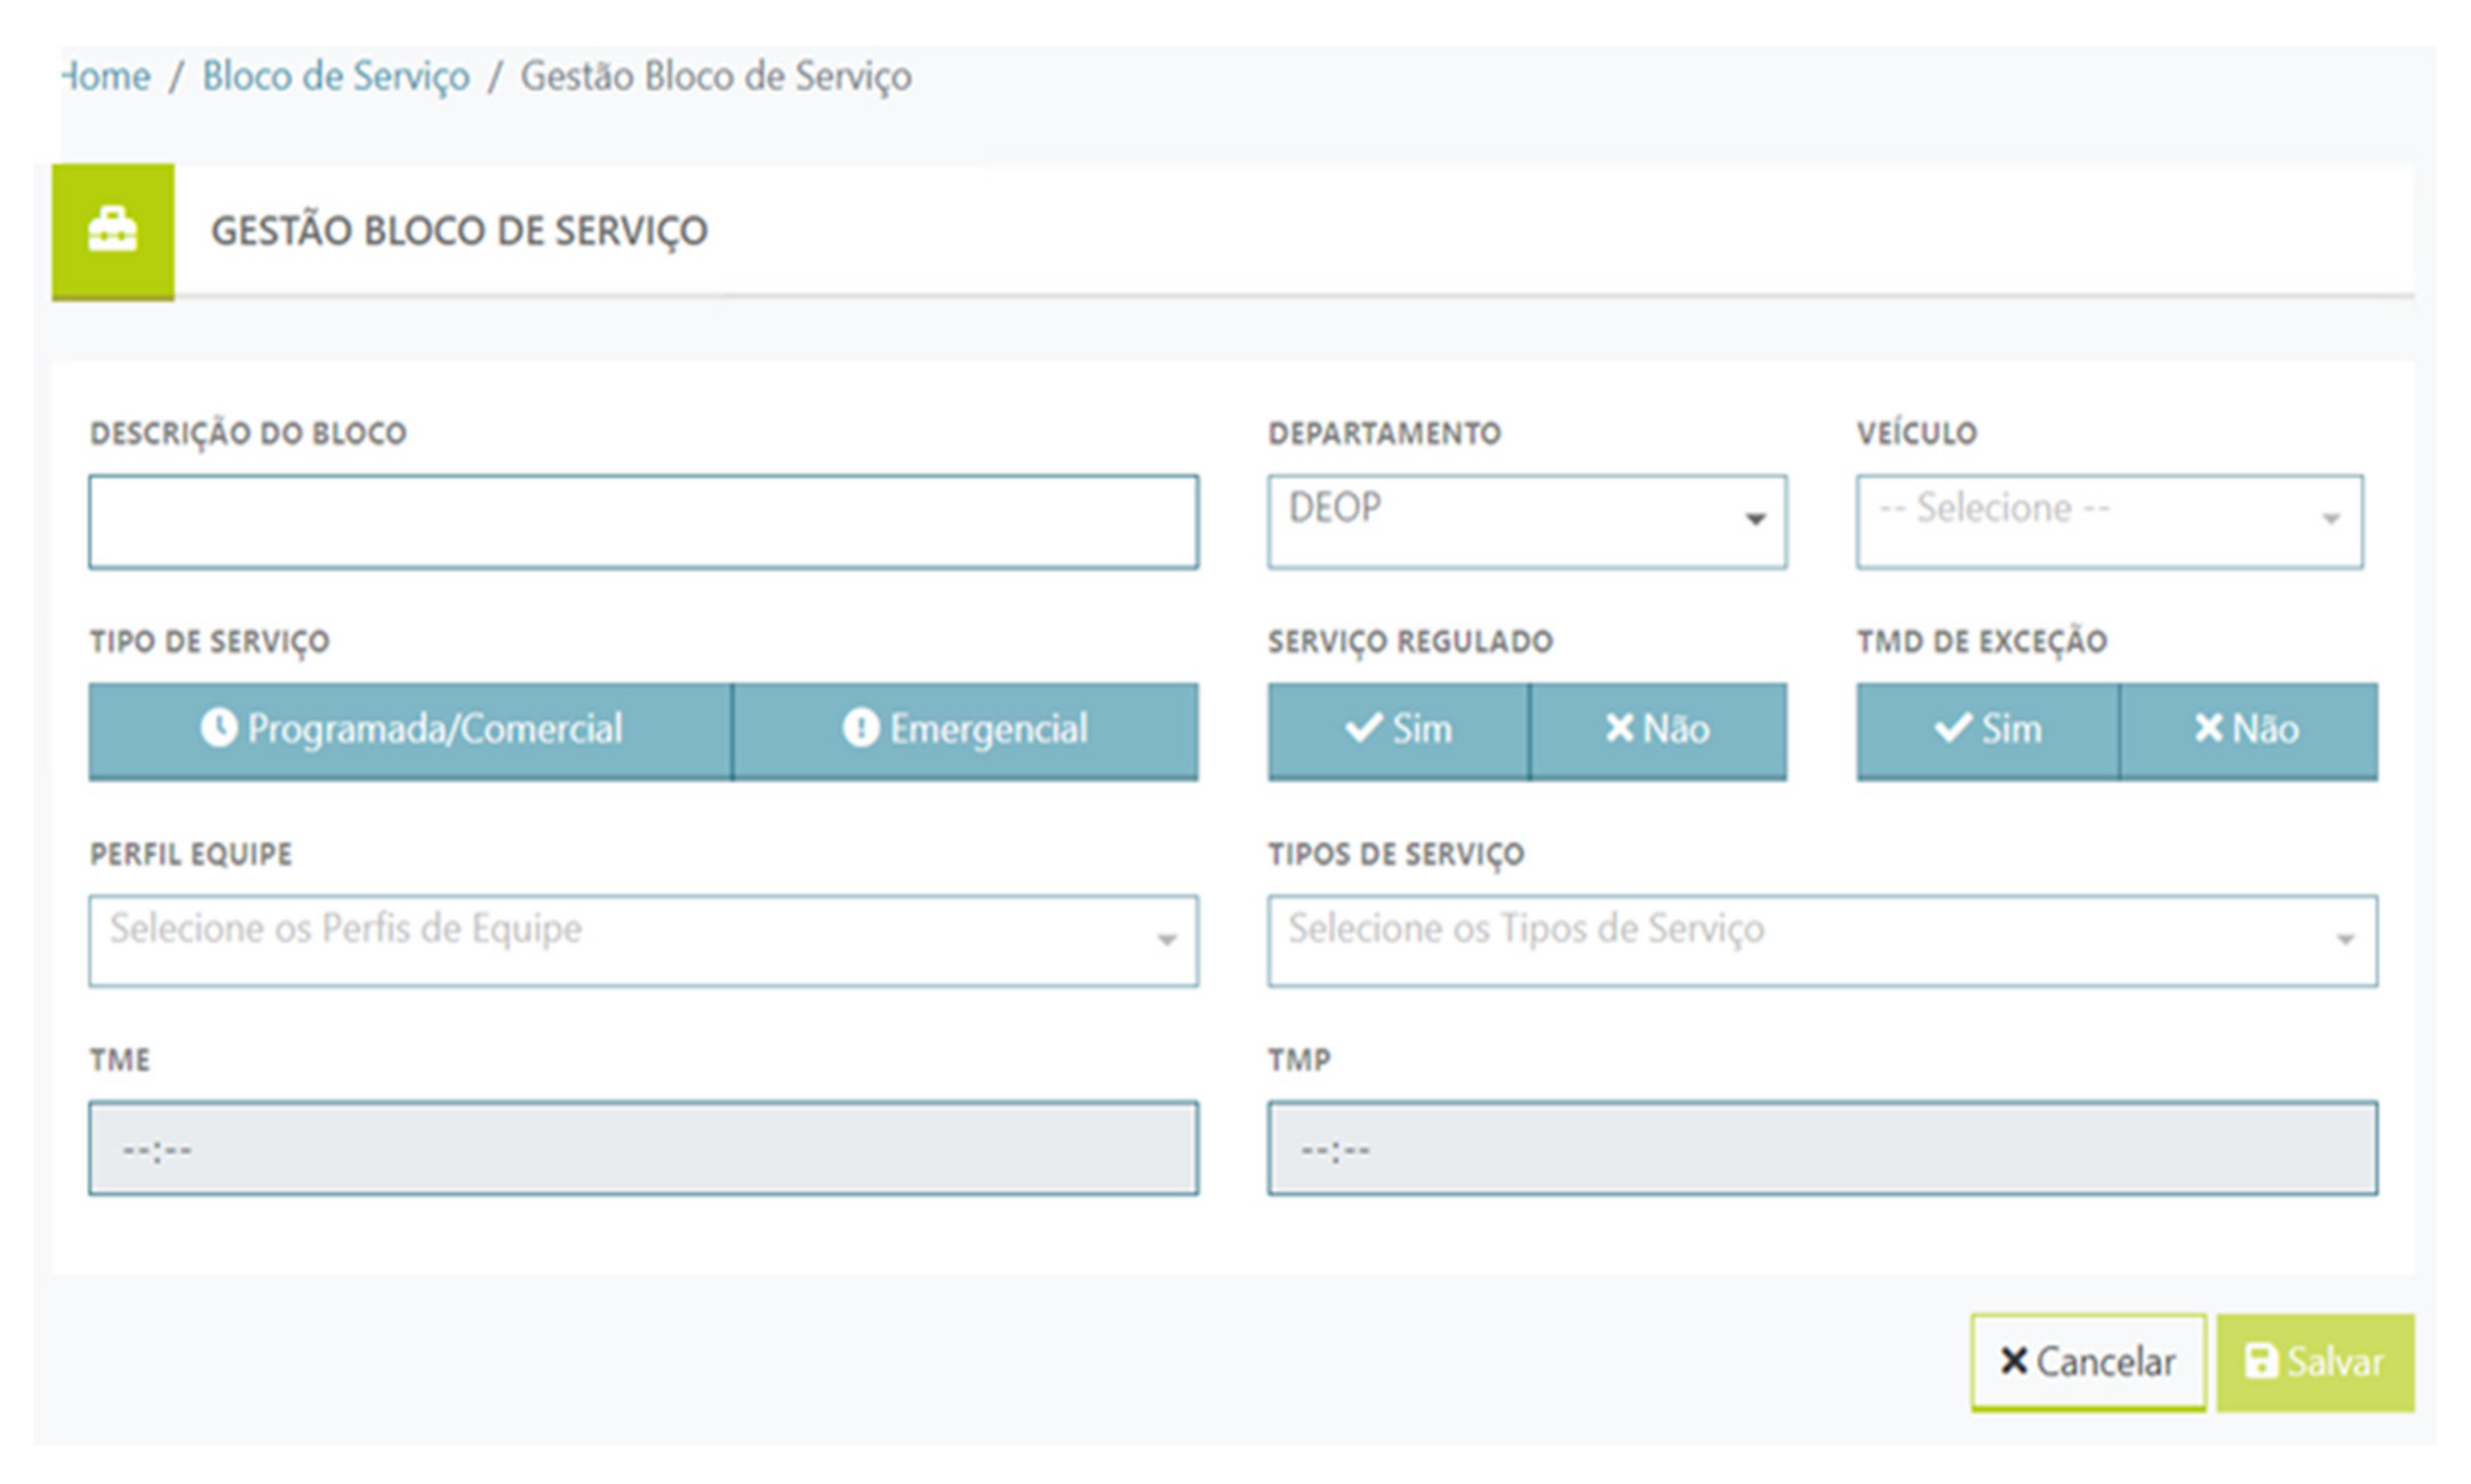
Figure 3 shows the contents of each Service Block.
For each Service Block, a description can be added, what type of vehicle will be used to attend these types of SOs (which has an impact on cost and payback in the Modules that come after Forecast Planning), what kind of service it is (emergency or business), what electrician profiles it uses and what Services it draws from the database based on the information provided.
Each location is represented by latitude and longitude pairs. Locations, where there is a base, are represented by the latitude and longitude of the corresponding base. To represent the locations without bases, a centroid’s latitude and longitude are calculated from the geographic distribution of the several different types of SOs belonging to the preferred locations. The distance between locations is the distance between its bases/centroids, as shown in
Figure 4. The considered distances are the actual distances for existing roads obtained via Google API, represented by the dotted lines. Afterward, the system verifies if a pair of latitude and longitude belong to a specific city.
2.3. Virtual Location
Another fundamental functionality is the creation of Virtual Locations. Some states are so big in Brazil that utilities split them into multiple locations. For Energisa Sergipe, a utility in Brazil, the capital of Sergipe is Aracaju, which due to its sheer size it was split into two virtual locations, Aracaju 10,001 and Aracaju 10,002, which ends up dividing the SOs among the two. This division is conducted automatically using the traditional k-means algorithm.
2.4. Monthly Service Demand Forecast by Location
A monthly forecast is calculated for each location and each service type block. The predicted monthly volume of SOs is given by Equation (1):
where:
is the average amount of SOs in Service Block j in location i predicted for the month m;
(n) is the amount of SOs in Service Block j in location i executed in month m in year n;
N is the number of available years in the history database.
This equation model represents the yearly seasonality inherent in the historical data, which is, for the predominantly aerial distribution power system in Brazil [
23], highly important considering how the rainy season is one of the most common causes of problems that generate SOs in the power system.
2.5. Forecast of Hourly Service Demand by Location
The hourly forecast consists of a breakdown of the predicted monthly volume of SOs according to the historical distribution of this amount in each hour of the respective month for each day of the week. Therefore, this modeling also takes into account the daily and weekly seasonality, that is, the SO execution pattern as a function of the hour of the day and the day of the week. For example, some SOs are not executed outside business hours.
Service orders that can be scheduled and are not subject to regulatory deadlines restrictions [
24] are not carried out outside business hours or on weekends. Thus, for each month, and also for each location and each service, it is estimated, for each hour of the day of the week, the proportion between the number of SOs completed in the respective hour to the total volume of SOs executed in the respective month. This estimate takes into account the entire historical, i.e., the hourly proportion is calculated considering all annual records for that respective month. For example, the historical data of two whole years, the proportion for a given month considers the SOs executed in each month in these two years. The construction of this typical week allows the distribution of the monthly volume foreseen in each month in hourly values necessary for the Tactical and Operational Modules (sizing and allocation of teams in scales).
Mathematically, the hourly ratio can be calculated by Equation (2):
where:
is the total SO volume of Service Block j in location i for the month m;
is the amount of SOs in Service Block j, in the location i, completed on the month m in year n;
is the number of days of week d, in month m of all years available in the historical database;
is the amount of SOs in Service Block j, in the location i, completed in the month m at hour h of year n;
is the participation factor that represents the proportion of the quantity of SOs in Service Block j, in location i, completed in the month m, at hour h, at a day of the week d to the total amount of SOs in Service Block j, in location i, executed in month m in all of the history data.
2.6. Spatial Forecast of Emergency Service Orders Demand by Location
The emergency services orders (ESOs) monthly spatial forecasting for each location is stochastically distributed along the geographic area, projecting the impacted consumers and its individual interruption indexes. These individual indexes are considered in the financial penalties estimation algorithm regarding interruption duration goal violations, which is one of the costs to be minimized in the strategic planning model (operational facilities allocation).
The algorithm is based on bi-dimensional histograms, calculated through the geographical division of each location in sub-regions called squares. This division enables the automatic and non-parametric estimation of the probability distribution of ESOs along the location geographical area for each month. This estimative is obtained through the ratio between the number of ESOs executed in each square and the total number of ESOs in the respective location at the analyzed month. This algorithm allows the automatic identification of regions with more incidence of ESOs.
The application of histograms requires the definition of the number of squares where the geographical region will be divided. The automation of this process can be conducted through the automatic estimation of the area of each square. The lateral size of each square can be estimated using the following expression [
25]:
where
represents the lateral square size through the
x direction (latitude or longitude);
N is the total number of ESOs executed in the analyzed location along the historical data;
is the coordinate (latitude or longitude) from the
i-th ESO executed the considered location; and
the coordinate sample mean (latitude or longitude) estimated from the ESOs executed in the analyzed location.
Given the lateral sizes of each square, the bi-dimensional histogram from historical ESOs for each location on a monthly basis can be estimated as follows:
The probability distribution of ESOs along the geographical area allows the allocation of ESOs monthly predicted demand according to this proportion. Once divided, the number of ESOs in each square is randomly drawly between the customers belonging to the respective square. Considering an averaged energy restoring time-related to each ESO, this customer attribution gives an estimation of the outage duration for each client. After the distribution process for each square is complete, the outage time for each customer is estimated on a Brazilian regulatory basis (monthly, quarterly and annually), providing the financial penalties estimation related to these three individual goals violations.
3. Results and Discussions
The spatio-forecasting algorithm shown in
Section 3 is implemented in AWDEC and is available for 11 distribution utilities in Brazil. Due to manuscript size limitations, its results will be illustrated considering historical executed SOs databases from two utilities: Energisa Sergipe and Energisa Tocantins. These selected utilities represent extreme cases, which are related to small (Sergipe state—782,000 consumers, 21,910 km
2) and vast (Tocantins state—601,423 consumers, 277,621 km
2) geographical areas. For both cases, the algorithm considered historical SOs data from 5 years (2016–2020).
The output of these studies is the spatio-temporal forecasting for all service orders in the cities within the state’s territory. The focus of the results will be on the largest locations (where most of the SOs are concentrated) for each state, which is Aracaju for Sergipe state and Palmas for the Tocantins state.
As was discussed previously, when a region is too big, it could be split into Virtual Locations that represent the whole, where each part contains the service orders within their area, which ultimately belongs to the original region. In
Figure 5, the distribution of the service orders has been divided and plotted in this case for the upper part of Aracaju, identified by the number 10,001. It is worth noting that the darker color in the image is to give more emphasis to the emergency SOs. As for the plot itself, what is shown is a finished automatically generated Dashboard with the results of the Forecasting Module from the AWDEC implemented at Energisa group in Brazil. The second part of the region is identified by 10,002 and also belongs to Aracaju, where the remaining SOs of the region can be found and shown in
Figure 6.
These proportions divide the total volume of SOs from a Service Block from a location, for every month of the year, into hours of a day for up to 4 weeks (hourly distribution of SOs for the month), as can be seen in
Figure 7 where the hourly demands of SOs forecasted are shown throughout the day.
The performance of the Spatial Forecasting Module is illustrated in
Figure 8, where the first 5 months of 2021 are compared for the biggest city of the state of Sergipe (Aracaju) in Brazil. The yellow triangles are the executed ESOs present in the first 5 months of the history of 2021, whereas the red dots are the forecasted SOs. At a quick glance, it can be seen that the prediction is quite precise, even when considering how out of the ordinary 2020 was for the country’s energy companies in general, including Brazilian energy distribution companies [
26,
27]. Comparing the total executed SOs from history (5770) and the total forecasted services (5688), the difference is less than 2%, showing that the system has good accuracy.
Another study was conducted with its historical data, completely unrelated to the state of Sergipe. The state chosen was the Tocantins and its largest city, Palmas, for the comparison. This city has an uneven distribution of service orders due to its sheer size and population concentration, as can be seen in
Figure 9. The less populated areas show an uneven distribution of the SOs, and based on the historical data, it can be inferred that for the year 2021, there has been an unusually large number of emergency service orders happening in the first 5 months when the total volume is compared, where 6304 SOs have been executed, while 5438 were forecasted. In this special case, it is worth looking at a monthly comparison.
The importance of consistent historical data can be inferred from
Table 1. Even though the data of the past 3 years for this city has been consistent for the most part, certain months, in particular, February, are shown to be outliers, where it is visible that for the year of 2018 the total number of emergency service orders plummeted compared to the following years and even in comparison to the other months of the same year. Additionally, even while being fed data like this, the Forecasting Module is capable of maintaining a conservative estimate with an acceptable degree of accuracy since an outlier like that is not a common occurrence.
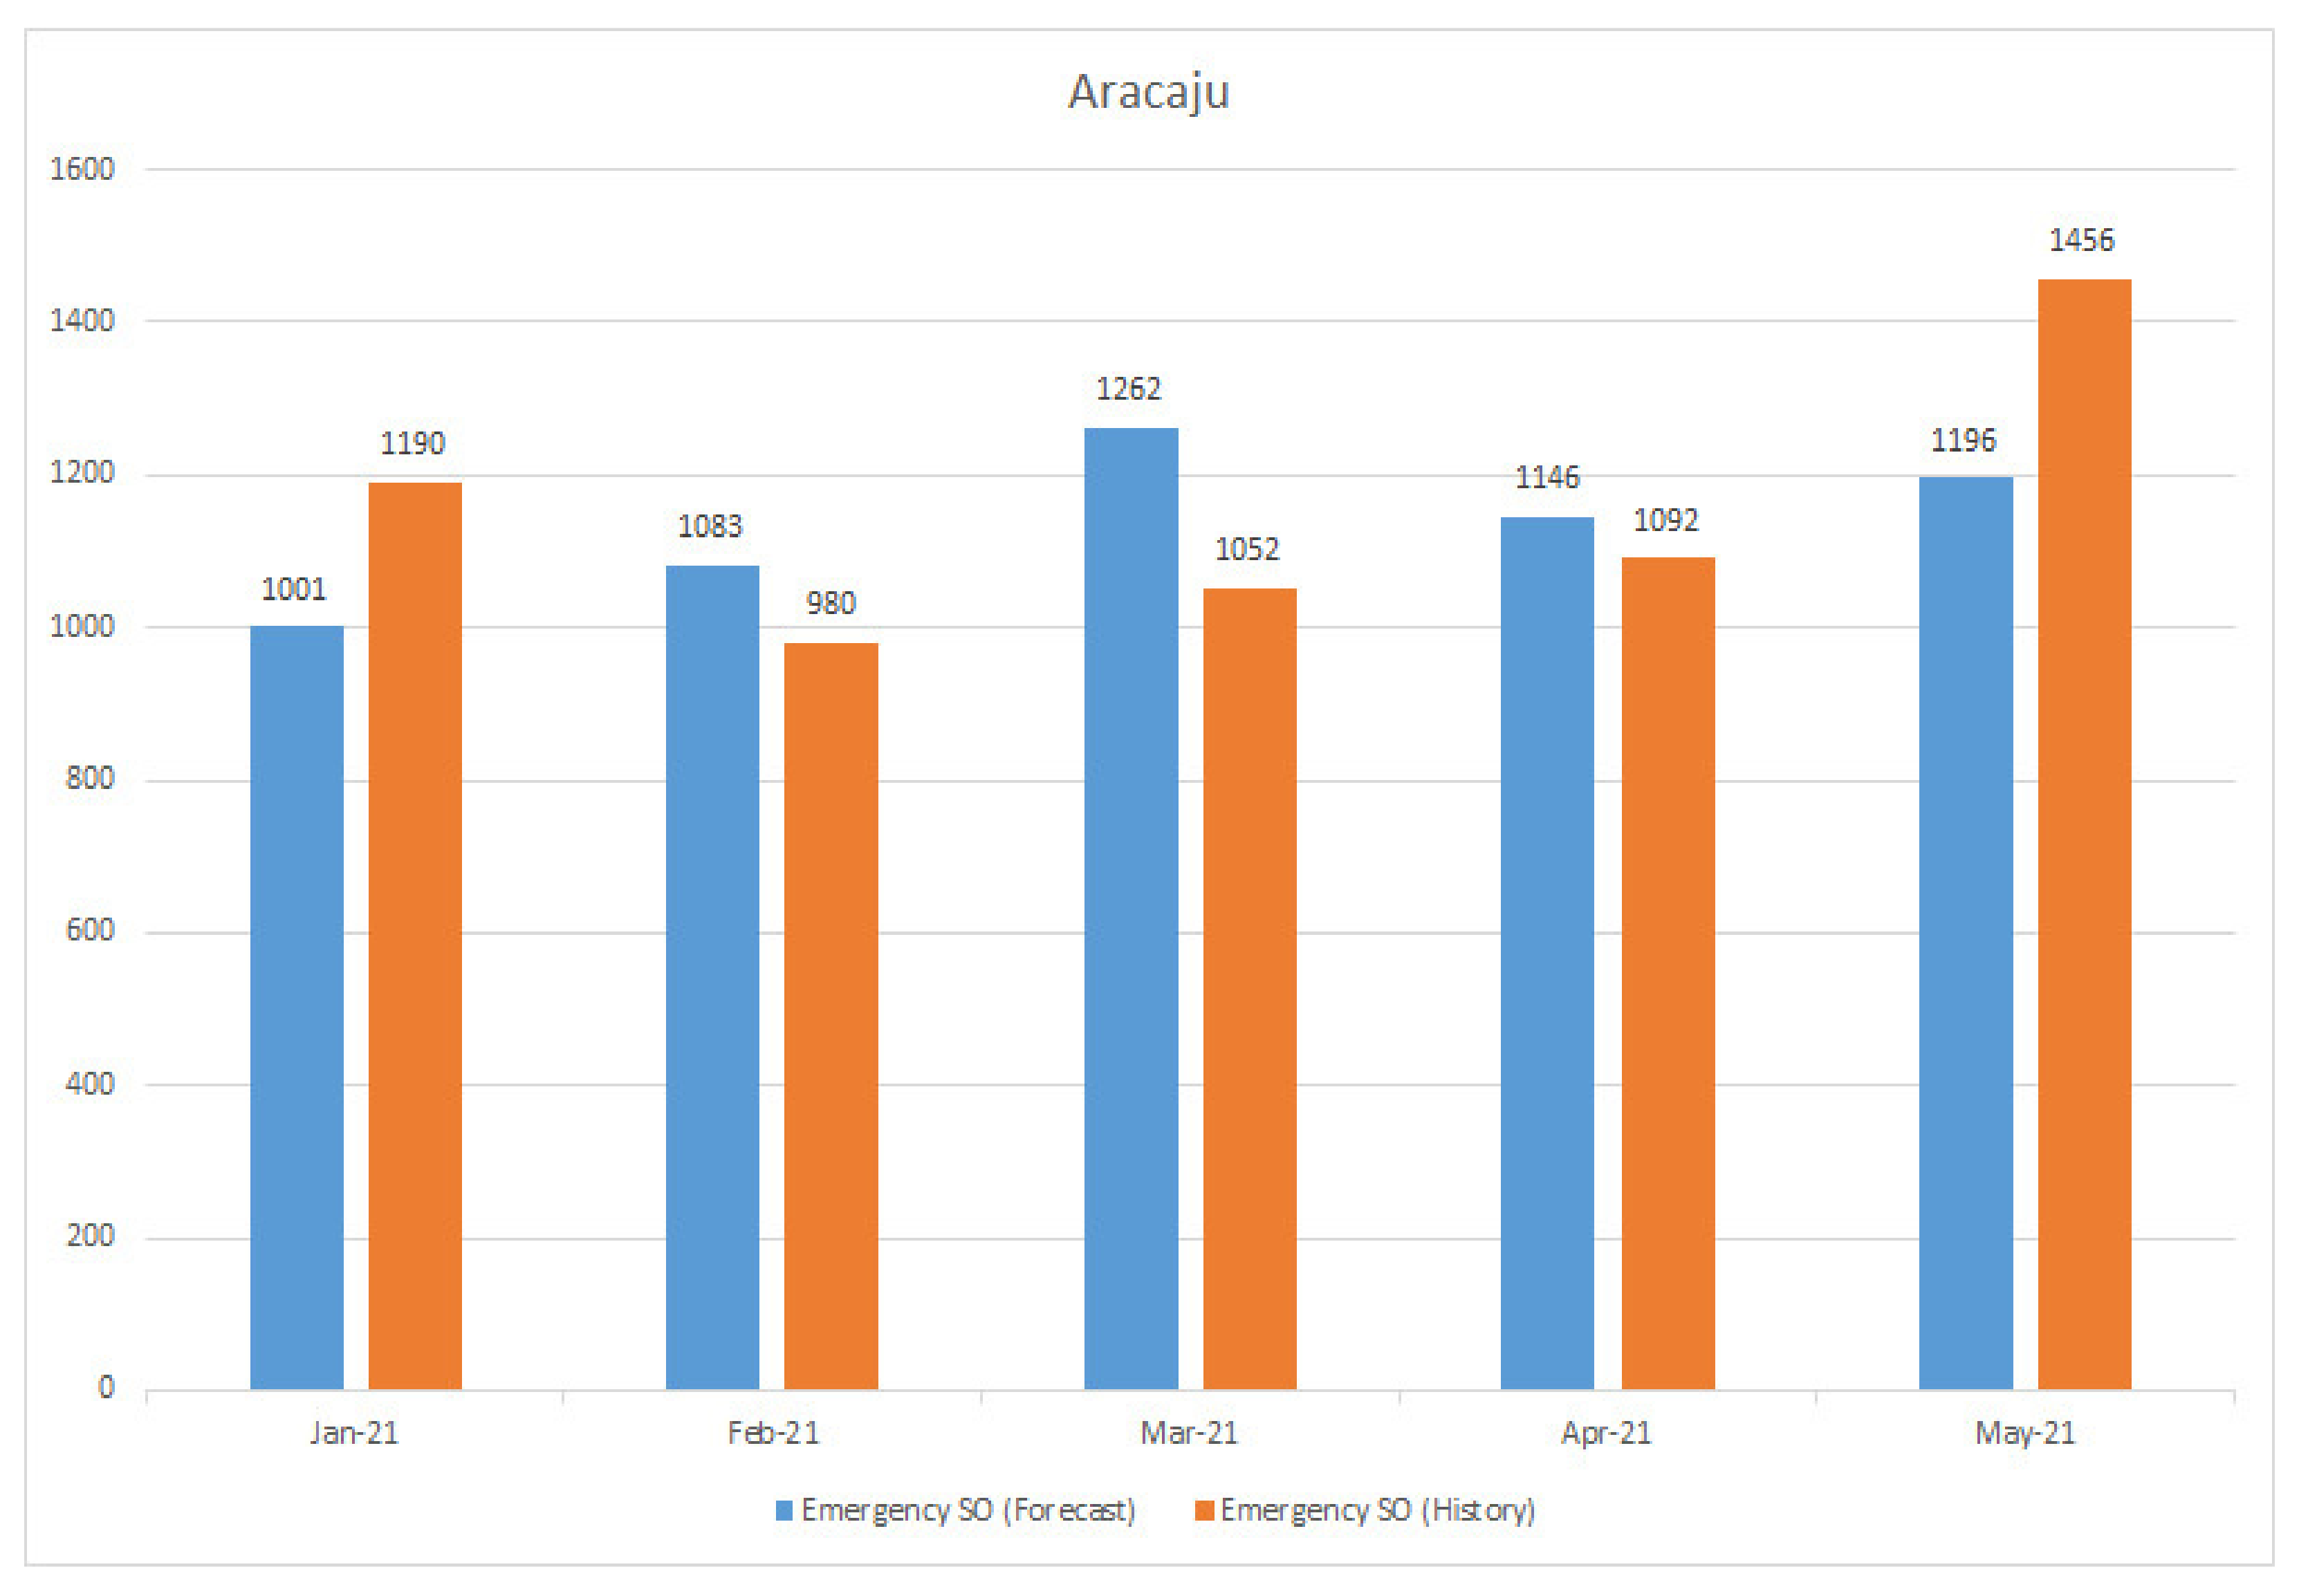
The resulting forecast for the first five months of 2021 for Aracaju can be found in
Figure 10, alongside the executed ESOs for the first 5 months. As for the state of Tocantins, the main city is Palmas, and the forecasting is illustrated for the same period (January to May 2021) in
Figure 11. Based on the comparison of the first 5 months, it can be inferred that the prediction for the latter half of the year will be accurate enough to represent the volume of expected emergency service orders.
Two scenarios can be inferred from this. The first is that, while the spatial distribution is very close as a whole when comparing the total prediction of SOs with the executed SOs from history data having less than 2% of the difference for Aracaju, the side-by-side comparison for each month shows that as a whole, the importance of the total forecasted volume of services is quite high since the foreplaning for what to expect is what matters. The second, following the trend inherited from the years of data, is the fact that there is a tendency of increasing the number of emergency services caused by the rainy season from April to the end of July in Aracaju (a seaside town in Brazilian Northeast) and from October to April in Palmas (Brazilian Central Plateau). This climate impact causes an increase in problems that can affect the distribution system and consumers directly, such as falling trees due to strong winds during heavy rains.


 ,
, 


