Abstract
For a few years the multi-physics modelling of the resonance cavity (resonator) of MW-class continuous-wave gyrotrons, to be employed for electron cyclotron heating and current drive in magnetic confinement fusion machines, has gained increasing interest. The rising target power of the gyrotrons, which drives progressively higher Ohmic losses to be removed from the resonator, together with the need for limiting the resonator deformation as much as possible, has put more emphasis on the thermal-hydraulic and thermo-mechanic modeling of the cavity. To cope with that, a multi-physics simulator has been developed in recent years in a shared effort between several European institutions (the Karlsruher Institut für Technologie and Politecnico di Torino, supported by Fusion for Energy). In this paper the current status of the tool calibration and validation is addressed, aiming at highlighting where any direct or indirect comparisons with experimental data are missing and suggesting a possible roadmap to fill that gap, taking advantage of forthcoming tests in Europe.
1. Introduction
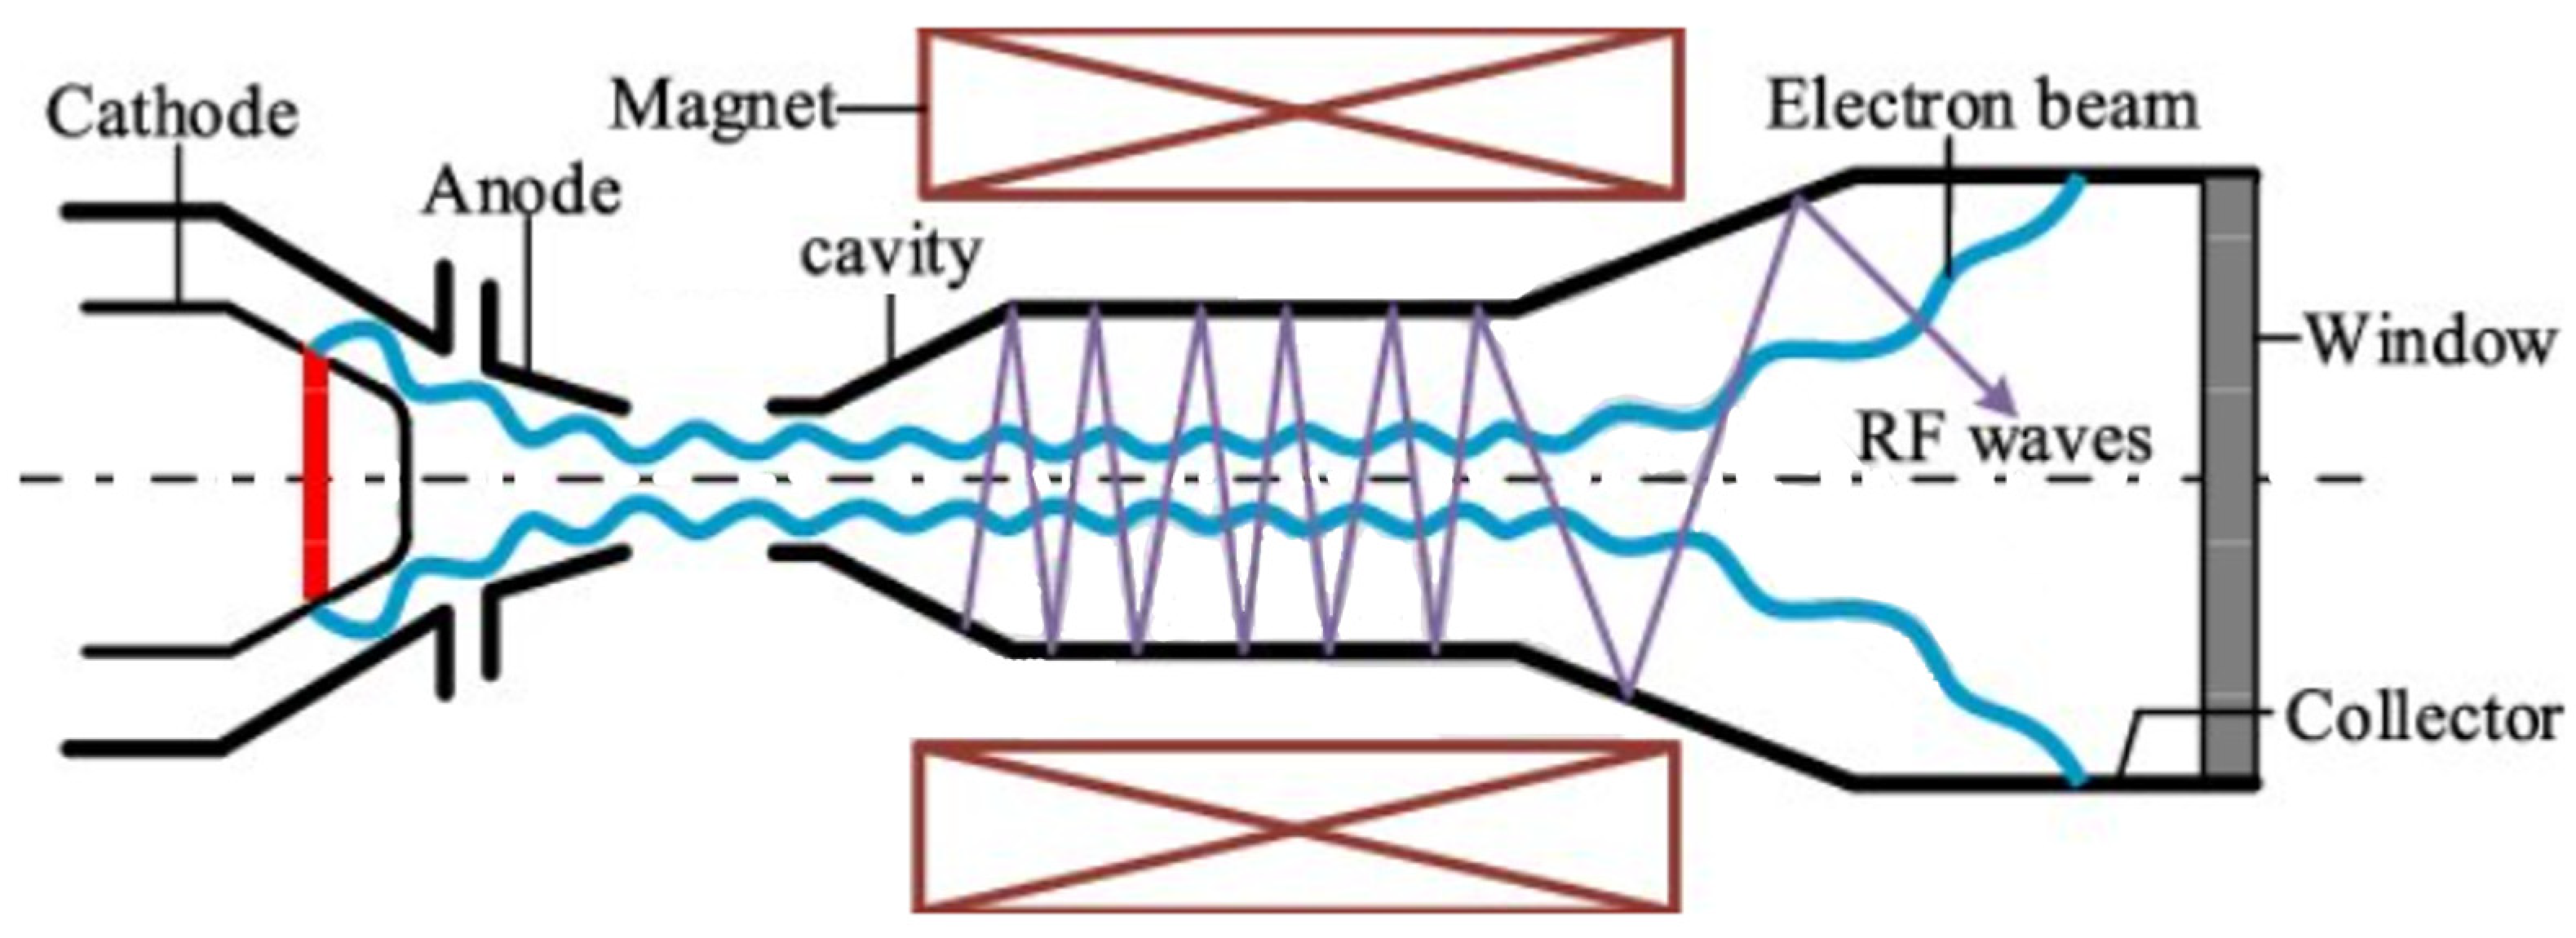
In the magnetic confinement machines for nuclear fusion, gyrotrons [1] are employed to heat the plasma [2,3,4,5] by injecting a microwave beam at a frequency equal to the electron rotation frequency in the magnetic field which confines the plasma or its harmonics [6]. The microwaves are generated in the so-called resonator or cavity of the gyrotron, see Figure 1, where an electron beam produced by a magnetron-injection gun interacts with an electromagnetic wave, excited therein at its resonance frequency [7]. In the partial conversion of the electrons kinetic energy in microwaves, part of the energy is lost by the system and deposited by induced parasitic currents (Ohmic losses) in the resonator inner wall. Besides the capability of exhausting the power deposited in the cavity, an accurate control of its thermal deformation [8] is needed in order not to lose the optimum resonance regime, avoiding at the same time the plastic (permanent) deformation of the resonator. Those aspects are strictly related. Indeed, the heat released in the resonator, driving the thermal deformation, depends on the interaction between the electrons and the electromagnetic wave, affected in turn by the deformation in a complex thermal-hydraulic, thermo-mechanic and electro-dynamic multi-physics problem, similar to some extent to those encountered in other fields related to nuclear fusion, for instance, that of superconducting magnets [9,10].
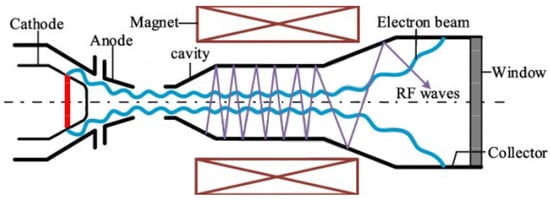
Figure 1.
Schematic view of the interaction between the electron beam (blue solid line) and the electromagnetic wave in the resonator, producing the microwaves (in purple).
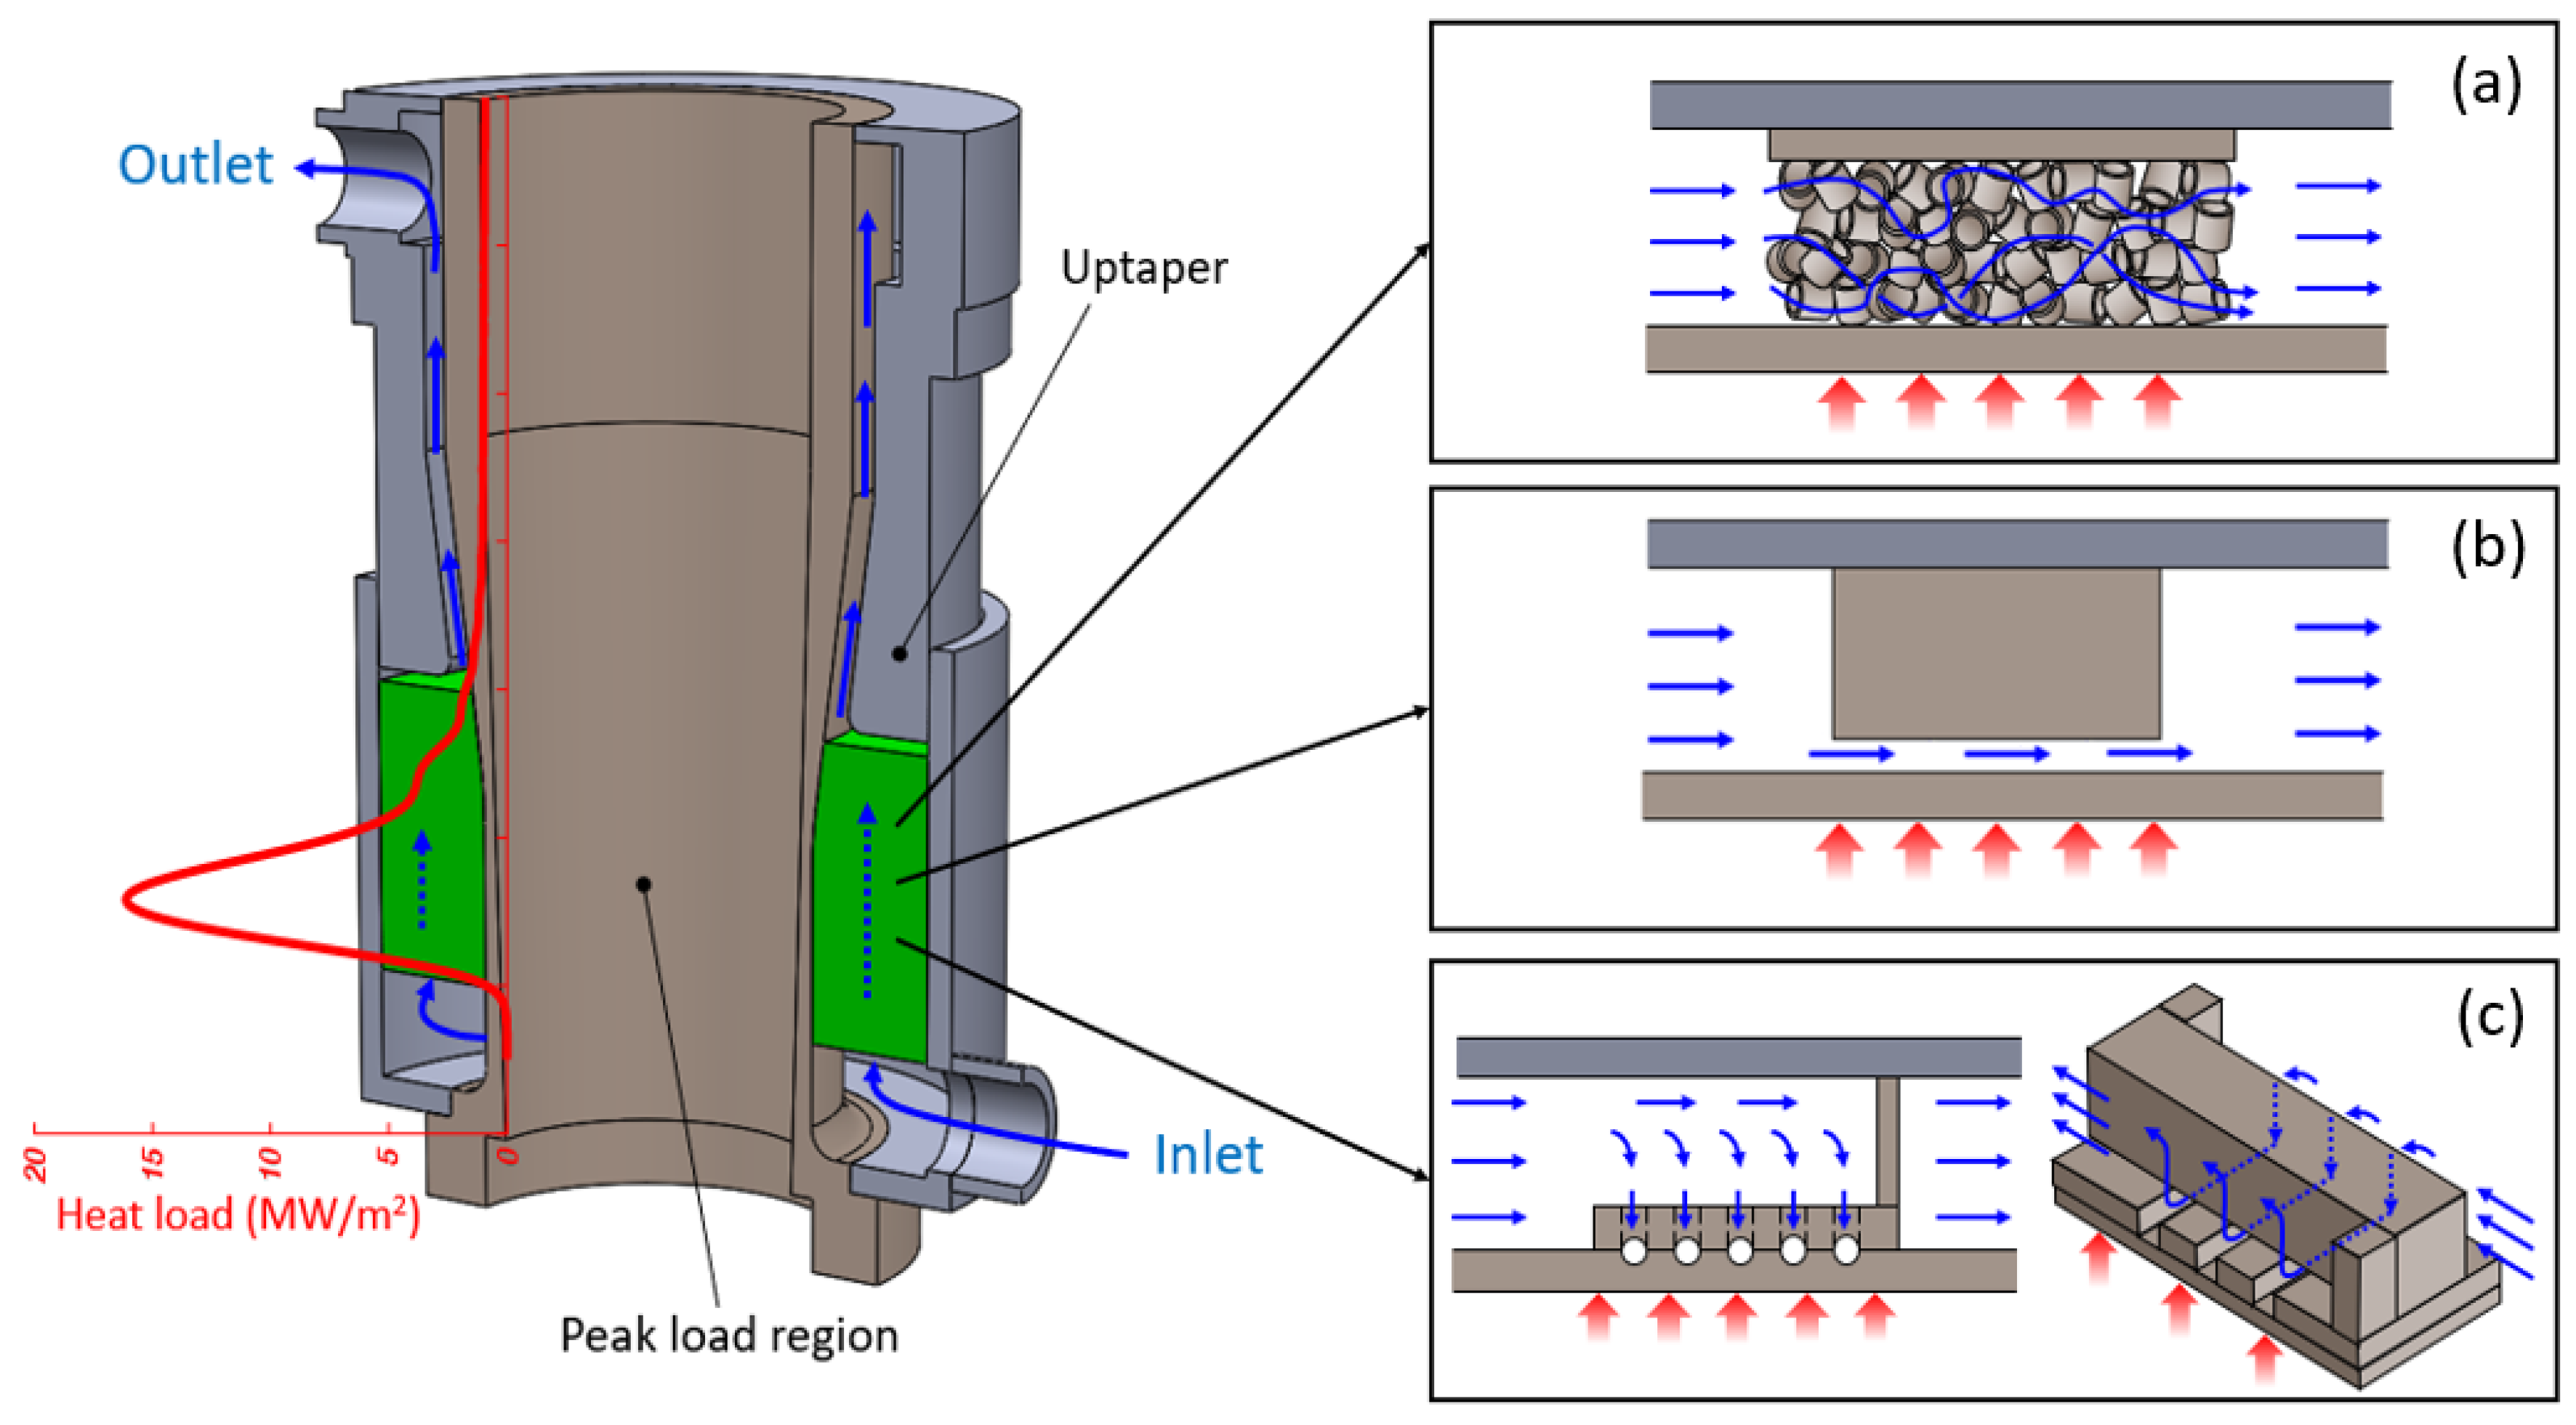
Since the Ohmic heating of the internal surface of the gyrotron resonator can reach peaks up to 25 MW/m2 [6], the component needs to be actively cooled. The coolant, which is typically subcooled water at room temperature and weakly pressurized to a few tenths of MPa, flows in an annular space around the cavity, limiting its thermal expansion and the related thermal stresses. Different techniques are currently adopted by different manufacturers to enhance the heat removal, and namely:
- A porous metal matrix made of mm-size copper Raschig rings (RR) [11], brazed together using an Au alloy. This solution has been adopted so far for the tubes manufactured in Europe. Cavities cooled using RR are inserted in the 140 GHz, 1 MW gyrotrons currently installed at W7-X [12], in the dual frequency devices commissioned in the TCV at the EPFL (Lausanne Switzerland) [11,13], and in the EU 1 MW 170 GHz first industrial prototype gyrotron [14] targeting ITER specifications [15,16]. RR-cooled cavities are also under design for the upgraded 1.5 MW gyrotron for W7-X [17] and for the next version of the EU 1 MW 170 GHz gyrotron. A sketch of this cooling configuration is shown in Figure 2a.
 Figure 2. Schematic view of the gyrotron resonator, with different cooling strategies: (a) Raschig rings, (b) longitudinal mini-channels, (c) azimuthal micro-channels. The fluid path is highlighted with blue arrows. An example of a typical heat load distribution along the cavity axis is also reported in red in the left sketch.
 - Longitudinal mini-channels (i.e., channels with a characteristic dimension of the cross section of the order of the millimeter, see Figure 2b), probably adopted in the 170 GHz, 1 MW Japanese gyrotrons [18] for ITER [19]. This technique is under consideration in Europe as an alternative for the upgrade of the W7-X gyrotrons to 1.5 MW.
- Azimuthal micro-channels (i.e., channels with a characteristic dimension of the cross section below the millimeter), most likely adopted in the Russian design of the MW-class gyrotrons, on which very rare info in published literature is present. A sketch of this configuration is reported in Figure 2c.
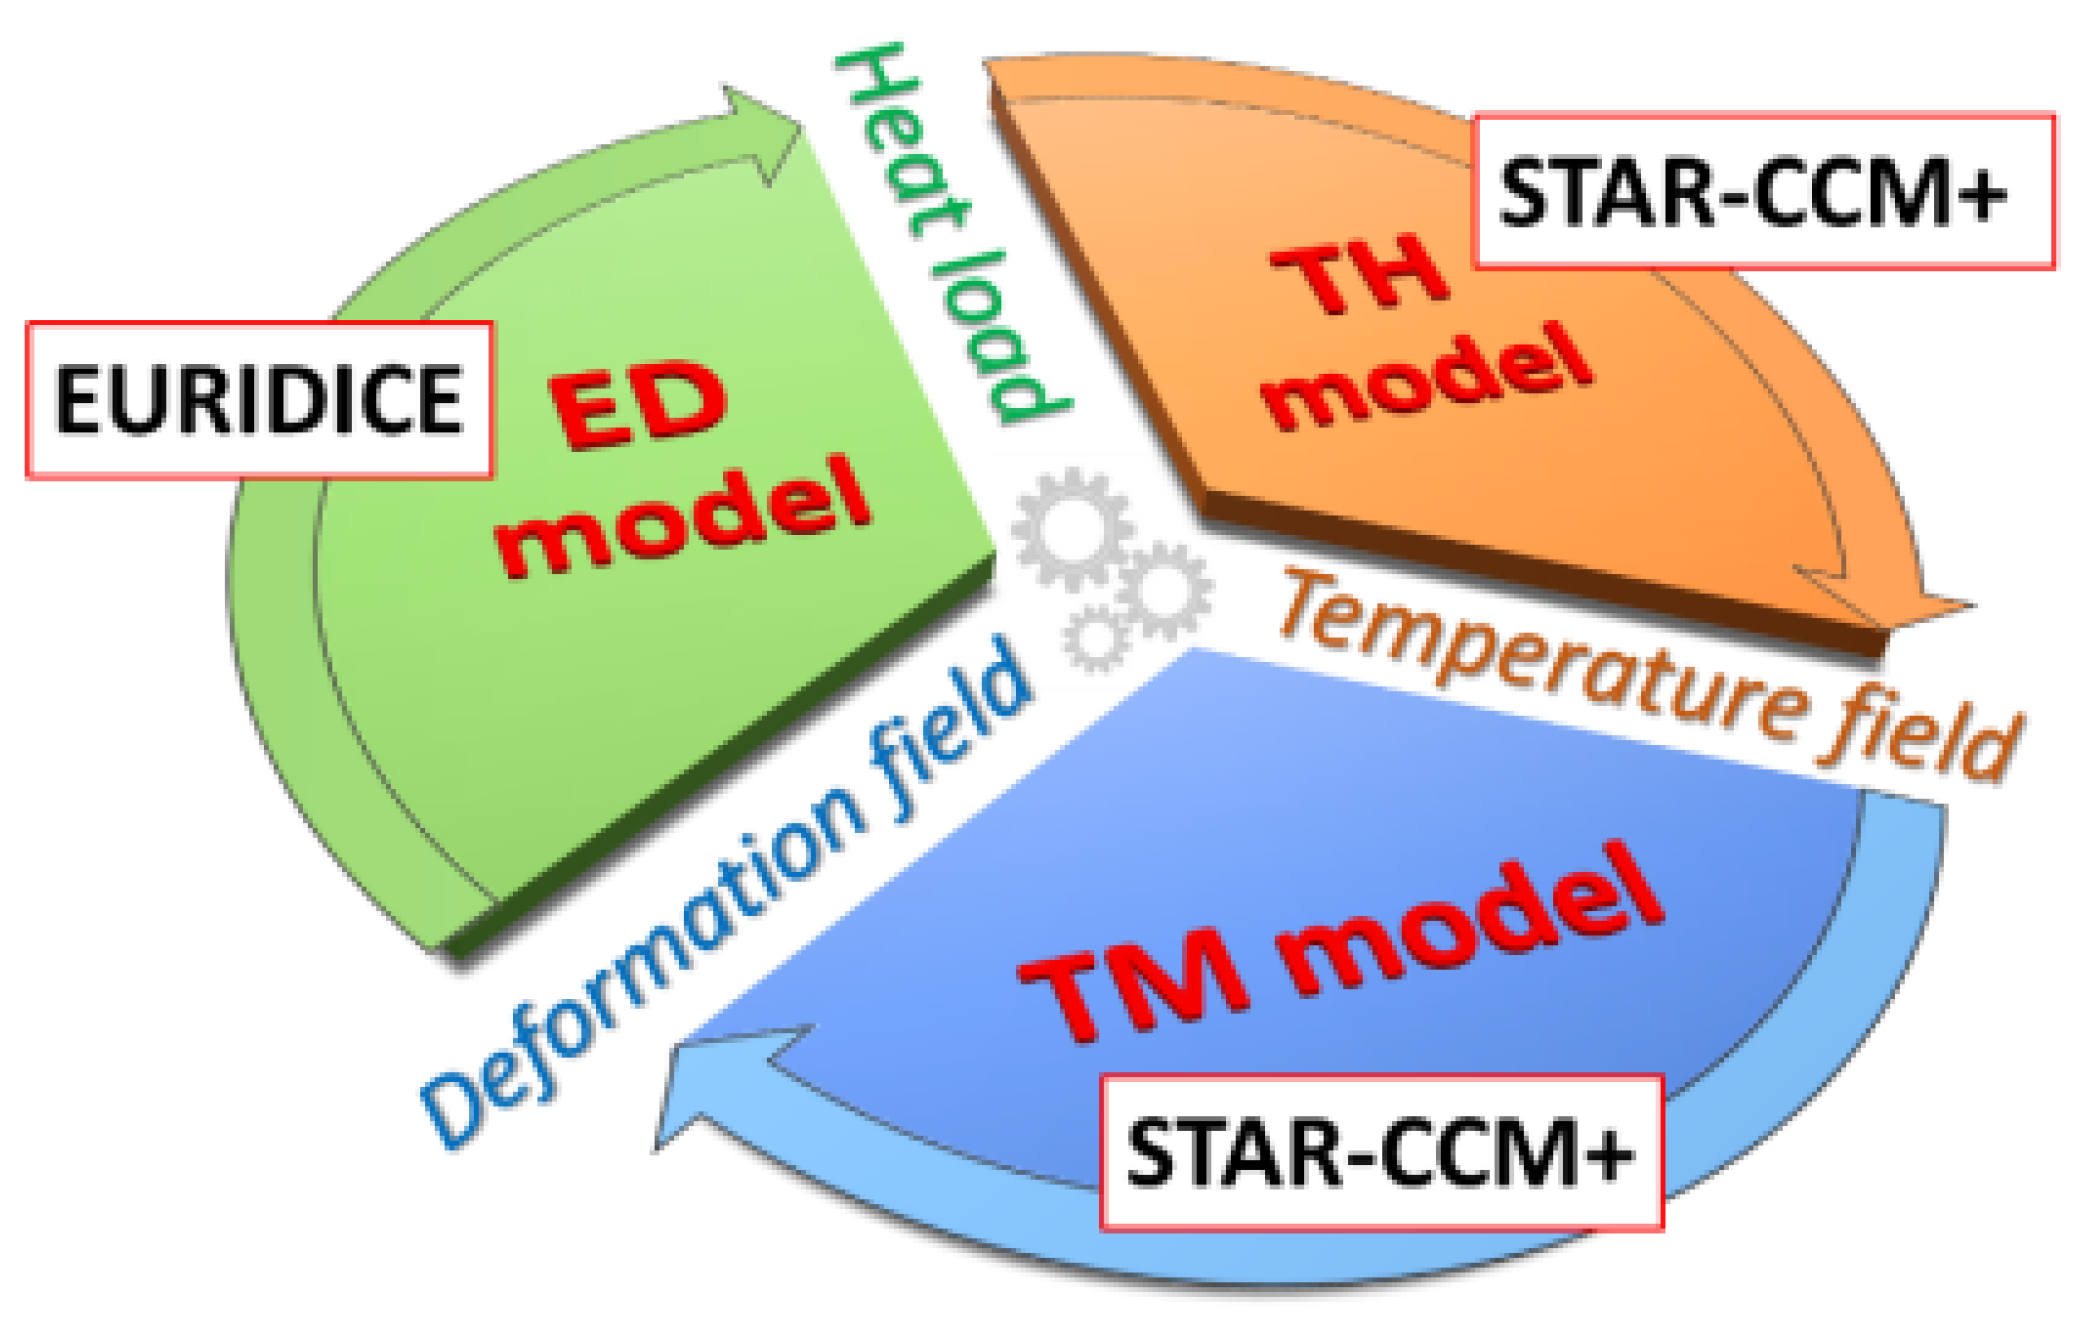
The numerical modelling of the resonator dynamic response to the heat load in operation is one of the key issues for the efficient design and optimization of a new high-performance device [20]. It has already been proven that a proper model for the resonator should be a multi-physics model [21], as it should include at least an electro-dynamic (ED) model to compute the heat load on the cavity surface from the radio-frequency (RF) wave interacting with the electron beam, a thermal-hydraulic (TH) model to compute the temperature of the cavity and a thermo-mechanical (TM) model to compute the cavity deformation. Note that the three ED, TH and TM models are intrinsically connected: the heat load resulting from the ED model is the driver of the TH model, the cavity temperature is the driver of the TM model and the deformation of the cavity affects the RF wave frequency and spatial structure (hence the beam-wave interaction) and becomes the driver of the ED model. Attempts on multi-physics modelling, schematically reported in Figure 3, started some time ago [22]. However, the modeling reached a fully self-consistent status only when the multi-physics tool for the integrated simulation of the cavity (MUCCA) was consolidated [21,23].

Figure 3.
Structure of the MUCCA tool, with the TH, TM and ED modules highlighted, together with their interactions. The software used for the different modules is also reported.
After some calibration of the key parameters was performed in the early stages of development, taking advantage of the few experimental data which were available back then, the tool has been already widely adopted to suggest possible improvements of the design of the cavity of the European gyrotron for ITER [24,25], as well as that of the Swiss TCV. However, systematic validation of the MUCCA tool, both as far as its different modules and the whole coupled models are concerned, has not been fully addressed so far, also because of the lack of a wide and controlled experimental database.
In view of the large number of experimental campaigns addressing different gyrotrons and cavity mock-ups, currently ongoing or foreseen in the near future, a more systematic validation of the tool can now be planned. While several studies were carried out in the past few years on specific aspects of the modelling of the resonator, the aim of this paper is first to perform for the first time a comprehensive evaluation of the calibration and partial validation exercises done so far for the multi-physics modelling of the gyrotron cavity, before moving to the description of present and future tests in regards to their possible contribution to the validation of the model.
2. Status of the Simulator Calibration
Three types of the physical quantities involved in the multi-physics gyrotron model can be encountered, namely: (i) directly measurable, albeit with some uncertainty (e.g., gyrotron output power, inlet-outlet temperature difference), (ii) not directly measurable but calculated (e.g., magnetic field values, electron beam parameters) and (iii) neither directly measured nor strictly calculated (e.g., thermal conductivity of the RR block), whose value can be tuned to fit the measurement/calculation. The calibration procedure described in this section refers to this last type of physical quantities and will be analyzed for each of the models involved in the cavity simulator.
2.1. Calibration of the ED Model
The beam-wave interaction in the gyrotron cavity is simulated using the code package EURIDICE [26], which is based on the slow-variables, self-consistent gyrotron interaction model [27]. The surface density, ρ, of Ohmic losses on the cavity wall (heat flux) is related to the RF wave generated in the cavity through the electrical conductivity, σ, of the wall [28], as shown in Equation (1):
Here, Ht is the RF magnetic field component tangential to the cavity wall, δ = [2/(μσω)]1/2 is the skin depth, ω = 2πf is the angular frequency of the wave, and μ is the permeability of the wall (μ = μ0 = 4π × 10−7 H/m for gyrotron cavities). The dependence of the conductivity on the temperature profile along the cavity (provided by the TH simulation) is taken into account by using an appropriate material database, e.g., [29] in the case the cavity wall is made of Glidcop. In addition, a correction factor for the Ohmic loading ρ, due to a typical 0.1 μm rms surface roughness of the cavity wall, is calculated using the Hammerstad/Bekkadal formula [30] and is inserted in Equation (1) as a multiplication factor.
The beam-wave interaction model itself contains physical quantities related to the electrons (energy, velocity etc.) and to the RF wave (amplitude, frequency etc.) as well as universal constants, therefore, a calibration is not actually needed. On the other hand, the electrical conductivity, σ, and its dependence on temperature and surface roughness are nominally known from experimental/empirical data. Consequently, there could be, in principle, room for calibration of the conductivity value. However, this has not been pursued because the used data are considered to be well-established. In addition, the calibration of σ would be challenging because the difference in the results of the ED model incurred using a different conductivity value can be masked by the uncertainty with respect to the internal losses between the gyrotron cavity and the load, where the gyrotron output power is measured.
2.2. Calibration of the TH Model
As far as the TH model is concerned, the conjugate heat transfer in the cavity is solved. Typically, Reynolds-averaged Navier–Stokes (RANS) equations are used for the fluid domain as a fair engineering compromise between accuracy and computational effort and also in view of the fact that the flow thermal-hydraulics is, for the problem at hand, enslaved to the evaluation of the temperature field in the cavity wall. A delicate aspect is always the selection of a suitable turbulence model for the coolant flow within the cooling structure adopted for the refrigeration of the cavity. In the case of RR, mini-channels and micro-channels, the SST-Menter κ–ω model has been widely used [31,32,33] for the simulation of all the different devices (see more on that in the validation section below). This model is able to work as a standard κ–ω model in the near wall region and as the κ–ε model in the fully turbulent region, through a blending function adding a cross diffusion term in the main stream. No specific calibration has been done on the default parameters of the turbulence model, such as the adjustable constants , , or β in the transport equations for the turbulent kinetic energy κ and for the specific rate of dissipation of the turbulent kinetic energy, ω; see [34] for more details.
For the simulations of the cavities equipped with RRs, an additional uncertainty concerns the effective thermal conductivity, , of the metal matrix, which is actually unknown. The RR matrix was generated in the simulations by means of the discrete element modeling (DEM) approach, and the rings have point contacts with each other. The soldering material, actually contributing to enlarging the thermal contact between the rings, is typically not modelled (see [31] for more details). A lower bound for the value of to be used in the simulations has been identified via the analysis οf the experimental results from a first planar cavity mock-up equipped with RRs, tested in 2015 at the Areva premises in Le Creusot, France [35]. The planar mock-up, shown in Figure 4a,b, had a planar circular target, exposed in a vacuum chamber to the heating provided by an electron beam gun on a 33 mm × 33 mm surface; see Figure 4c. On the back of the target, a RR block was placed. Subcooled water, flowing inside the mock-up, provided the active cooling of the target, passing through the RR matrix. The value of was a key parameter to allow a proper evaluation of the heat removed from the target. The effectiveness of the cooling was assessed via measurement of the temperature of the heated surface using an infrared camera (no accurate calorimetry was possible, unfortunately, due to the lack of temperature measurement at the outlet of the mock-up). The IR camera was calibrated to accurately measure a surface temperature larger than TIR = 350 °C. However, that temperature was never reached in the test campaign, despite the variation of the water flow rate from 90 L/min down to 50 L/min (the minimum value which was tested), even for very large heat loads (up to 25 MW/m2).
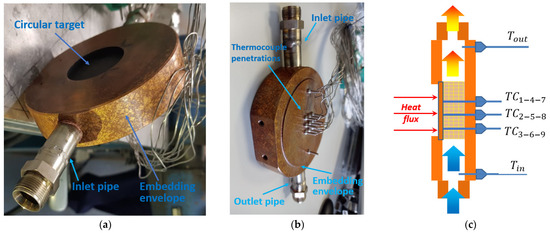
Figure 4.
Cavity planar mock-up equipped with RR: (a) front/side view with the circular heated target in evidence, (b) back view with the instrumentation (thermocouples), (c) sample cross section.
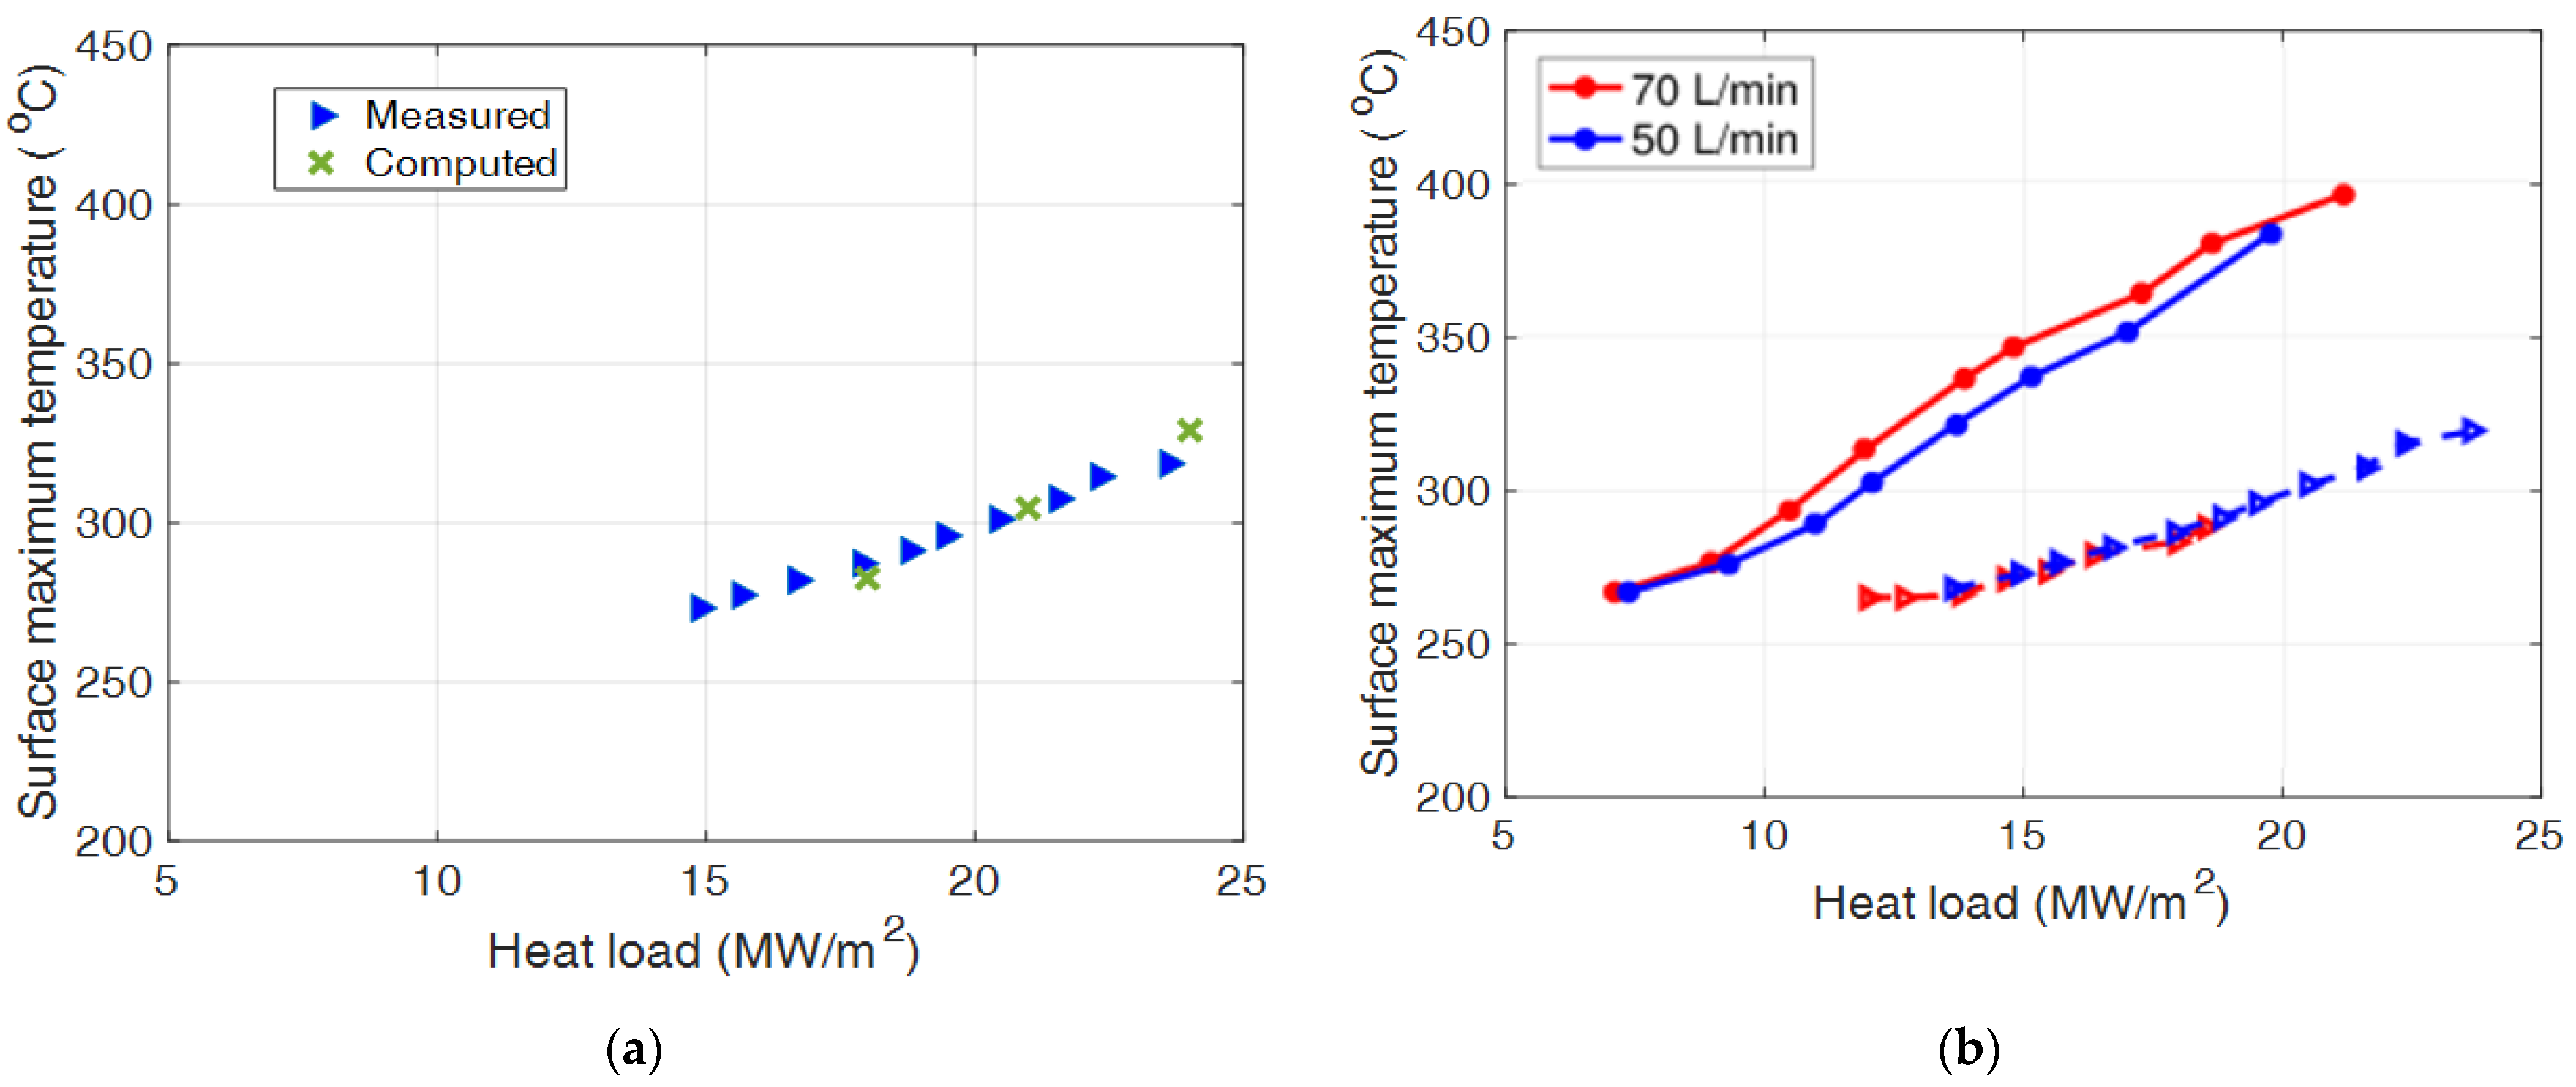
The fact that a surface value of TIR was never reached in the tests allowed the lower bound for to be calibrated to 2000 W/m·K in the simulations, which kept the computed surface temperature below TIR in the worst case (lowest flow rate). Such a (unphysically) high value is justified by the fact that, as mentioned already, in the simulations mimics the product of the value of the physical conductivity and of the actual finite area of the thermal contact among the rings, which was not accurately modelled. The simulated results, with the calibrated = 2000 W/m·K for the case with the lowest flow rate tested, i.e., 50 L/min, are collected in Figure 5a, showing a good agreement with the experimental points measured with the IR camera, of which, however, the reliability is unknown at such low temperatures. The planar mock-up was also equipped with 9 thermocouples (TC) in the RR matrix, specifically in contact with the back side of the target, but the calibration of the model could not rely on them because of the uncertainty about the exact position of the TC heads (in proper thermal contact with the target, or within a ring, or surrounded by water). Note also that, in the simulations reported in Figure 5a, no radiative losses from the mock-up were considered. Some boiling of the water was also detected in the simulations, due to the high temperature reached also in the RR region, where the saturation temperature was estimated at 169 °C. The boiling regime was handled using the Rohsenow boiling model [36] in a VOF multiphase flow simulation [37], but no specific calibration was possible for the parameters it includes.
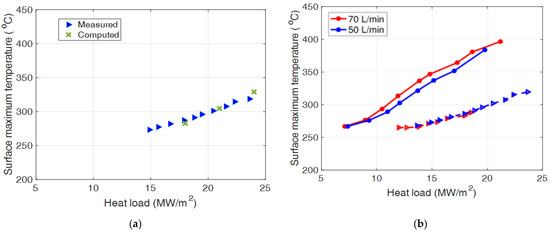
Figure 5.
Cavity planar mock-ups equipped with RR: surface temperature measured as a function of the heating power. (a) 2015 test campaign with a water flow rate of 50 L/min: experimental data measured via the IR camera (blue symbols) and computed data with the calibrated model (green symbols). (b) Comparison between the data from the 2015 test campaign (triangles), measured with the IR camera, and the data from the 2016 test campaign (circles), measured with the pyrometer, with a water flow rate of 50 L/min (blue lines and symbols) and 70 L/min (red lines and symbols).
In view of the issues with the sample instrumentation discussed above [38], a test campaign on a second planar mock-up equipped with RR was performed in 2016, again at the Areva premises, in the same test rig as the first one, to confirm the results obtained in the first test campaign. The instrumentation also included a pyrometer, calibrated against a thermocouple for temperatures above 300 °C. The heat flux was on a square surface slightly smaller than that in the 2015 campaign (28 mm × 28 mm). At a comparable flow rate and heat flux, the values measured in 2016 were expected to be below those of 2015 because of the total deposited power scales with the extension of the heated surface. Unfortunately, the 2016 results turned out to be significantly higher than those of the 2015 test campaign; see Figure 5b. Note that in 2016 the radiative losses from the heated surface were measured calorimetrically (and turned out to be 10–15% of the incident power), and the heat load represented in Figure 5b is the net heat flux entering the sample. A 10–15% increase in the power, however, cannot explain the difference in the two set of measurements. Although nominally identical, the two samples could suffer from a different random distribution of the RR, which could partly explain the difference between the 2015/2016 datasets. The 2016 data look, however, odd in another respect, as the temperature values measured by the pyrometer in 2016 at 70 L/min are higher than those at 50 L/min, and this is very hard to justify. The overall picture confirmed then some issues in the pyrometer measurements in the 2016 test campaign, so that the calibration of was never repeated on the 2016 measured data.
For the simulations of the cavities equipped with longitudinal MCs, the model calibration could benefit from the tests of a planar mock-up, identical to that equipped with RRs but equipped with semi-circular MCs on the back of the target, also tested in 2016 at Areva [38]. In more detail, with reference to the manufacturing process adopted there, which simply put the heated target in contact with a block where the MCs were machined, the analysis of the test results allowed the calibration of the contact thermal resistance between the target and the MC block, as extensively documented in [39]. Note, however, that if a different manufacturing procedure is adopted for the actual cylindrical cavities equipped with MCs, the calibration performed on the planar mock-up is not useful.
As far as the azimuthal micro channels are concerned, no dedicated calibration of the TH model has been performed so far, also in view of the lack of available experimental data on that specific cooling strategy.
2.3. Calibration of the TM Model
As far as the TM model is concerned, the simulations are restricted to the pure solid region of the TH domain, made by Glidcop, for which the appropriate set of material properties (thermal expansion, Young modulus) are adopted. A 3D, steady state, finite-element solid-stress model is adopted, with linear, isotropic and elastic material properties. The constraints applied to the structure vary from case to case. The thermal stress is computed considering the inlet temperature of the fluid as a zero-stress temperature for the assembly.
No specific calibration has been done so far on the TM model. In fact, since the computational domain is typically restricted to the resonator wall and does not include, for instance, the RR matrix, all the parameters of the computational model are nominally known.
2.4. Calibration of the Whole Simulator
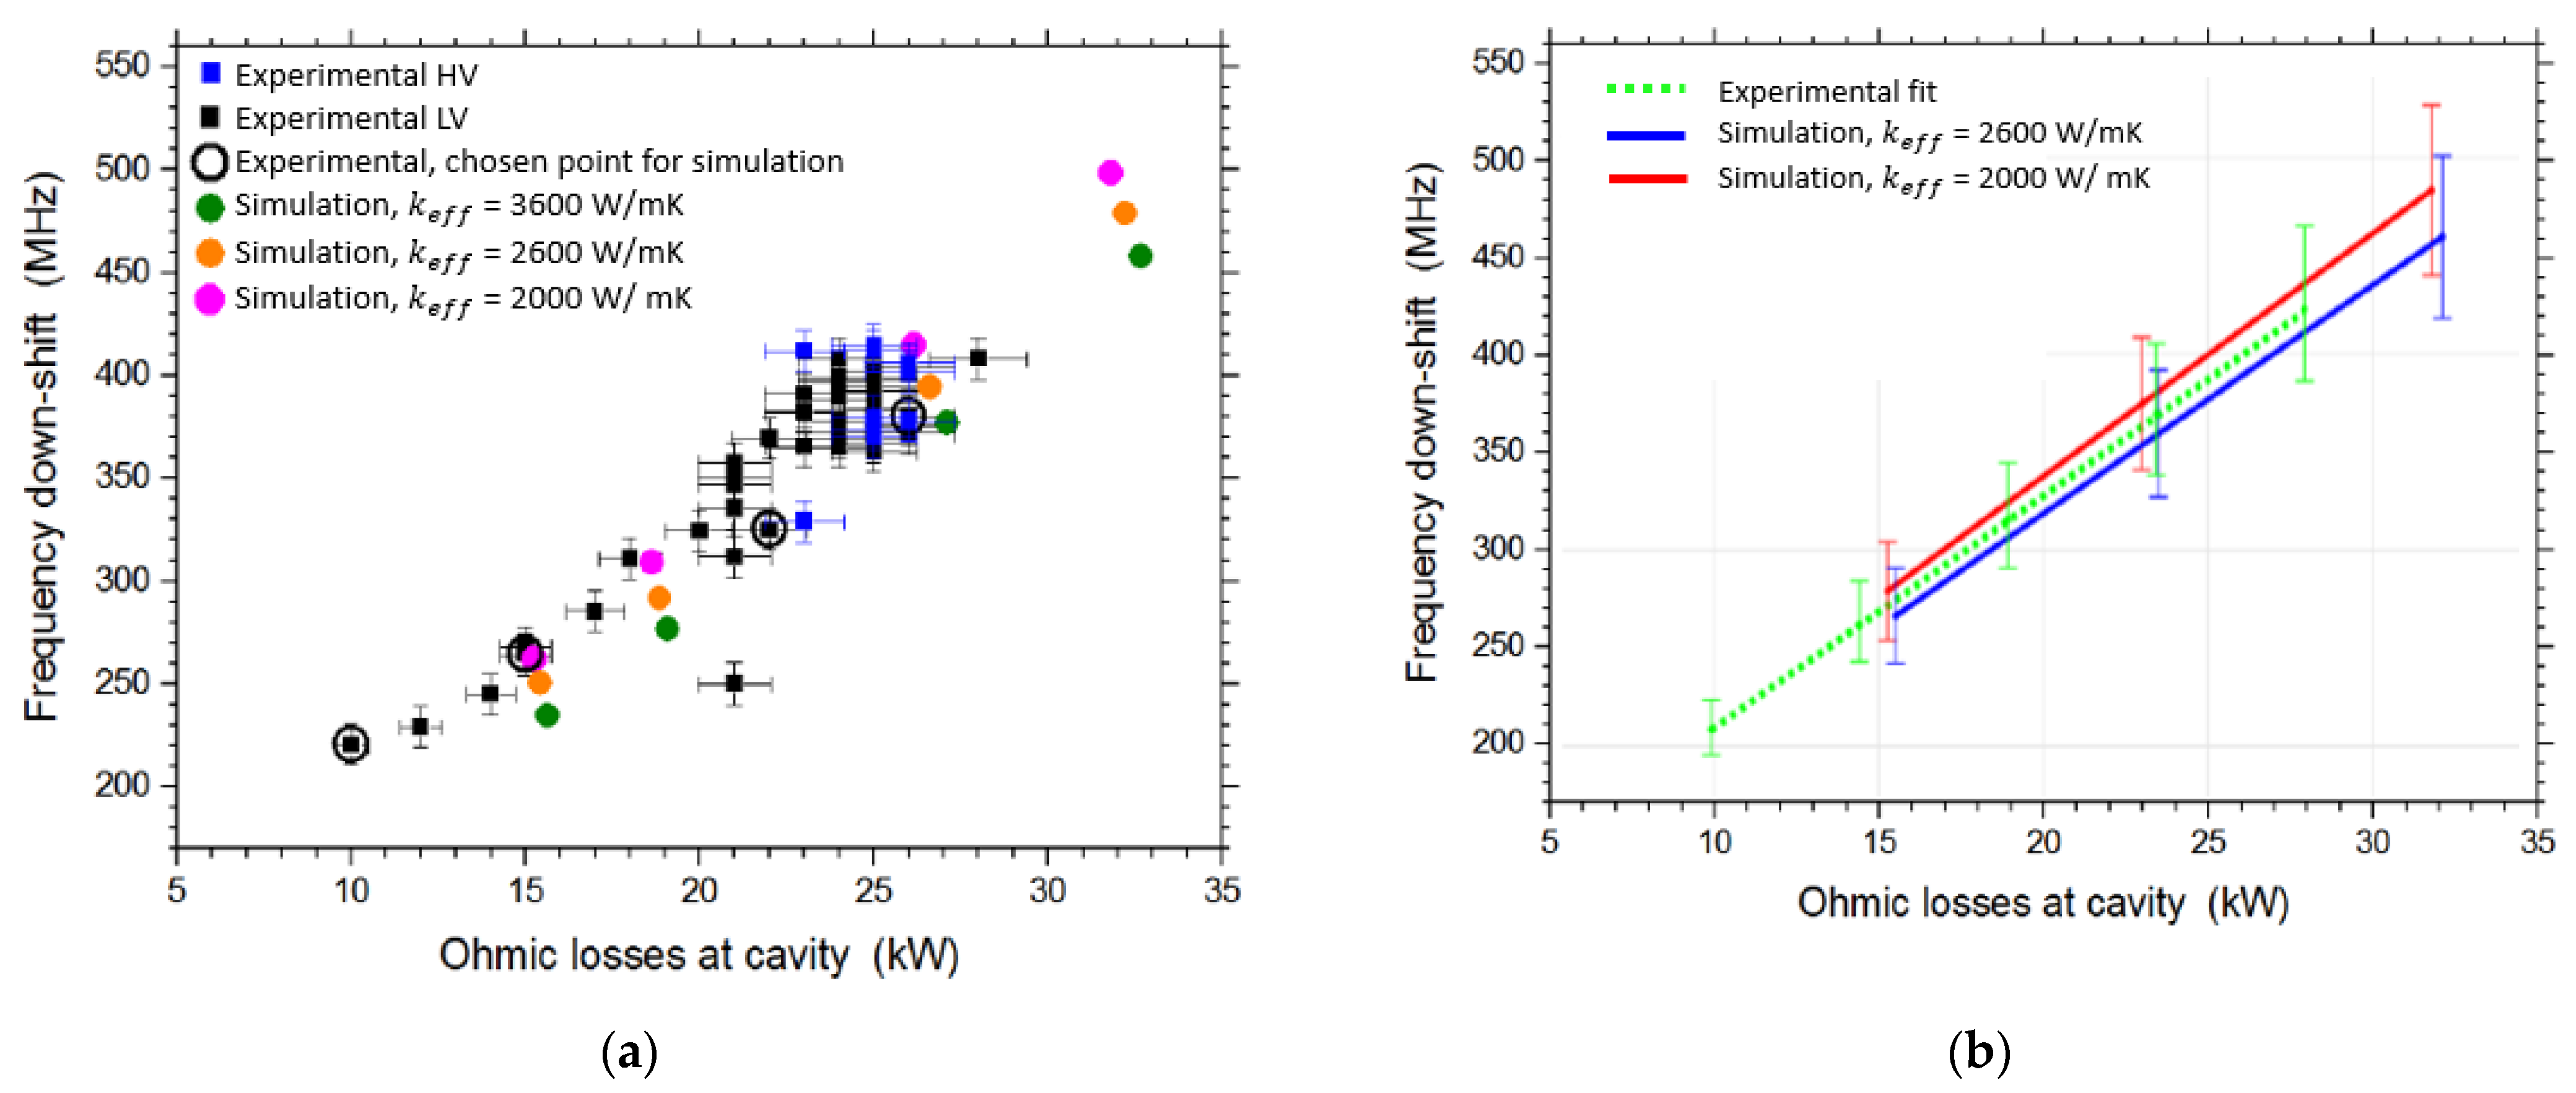
Since doubts still remained after 2015 on a proper value of in the simulations of cavities equipped with RRs, its calibration was attempted indirectly by comparing the results computed using the whole multi-physics simulator of the resonator to experimental data coming from different test campaigns on the EU 1 MW 170 GHz ITER gyrotron prototype, the resonator of which was cooled using an RR matrix. A first test campaign was performed at the Karlsruhe Institute of Technology Premises [14,40,41]. The tests were carried out for pulse durations up to 180 s. The results computed by the MUCCA tool for different values of , namely, 2000 W/m·K, 2600 W/m·K and 3600 W/m·K, were compared in terms of the frequency shift, due to thermal expansion of the cavity, to the experimental results, in different operating conditions, resulting in the picture reported in Figure 6a. The values in the range 2000–2600 W/m·K returned a frequency shift slope comparable to the experimental one, when the interpolation error is considered (Figure 6b). The estimation of a more precise value would require more simulation points to reduce the interpolation error. Note that this second calibration of is in line with the first one, in the sense that the lower bound for found in the first calibration is retained. Also in this case, the values remain unphysical though.
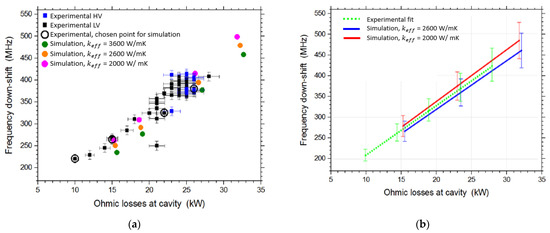
Figure 6.
Comparison between the measured and computed frequency shift for several low-voltage (LV) and high-voltage (HV) operating points, as a function of the Ohmic power dissipated at the cavity. (a) Detailed map of tested and computed points; (b) linear interpolation.
Experimental data from the same gyrotron tested for longer pulse durations in a range up to 215 s in the European Gyrotron Test Stand at EPFL, Switzerland [41], could have helped in reducing the range of calibration for [42]. However, the data turned out not to be very useful for additional calibration of the model since strong deviations in the ED model were encountered with respect to the experimental results, most probably due to uncertainties in the actual magnetic field profile and electron beam parameters. (See also next section on the validation of the ED model.) Moreover, there was some uncertainty in the flow rate to the cavity, which increased the inaccuracy of the TH simulations.
3. Status of the Simulator Validation
Following the discussion on the calibration, the status of validation of the different models of the resonator simulator against experimental results is detailed below.
3.1. Validation of the ED Model
The ED model has already been successfully validated against experimental results for a number of operating points, involving various high-power gyrotrons in short-pulse operation (<10 ms), e.g., the European 170 GHz 1 MW gyrotron for ITER [43], the 170 GHz 2 MW coaxial gyrotron at KIT [44] or the 140 GHz 1.5 MW gyrotron for W7-X [45]. Note that, in short-pulse operation, the cavity thermal expansion is negligible; hence, the ED model can be validated against experimental results without the need of TH and TM simulations. In addition, at the ms time scale, the neutralization of the space charge of the electron beam due to ionization of the residual gas in the gyrotron is still not taking place [46], and consequently, the electron kinetic energy can be calculated without resorting to estimations about the neutralization level.
The critical point with respect to the ED simulations is not the validation of the model itself but the careful assessment and consideration of the inherent experimental uncertainty with respect to the physical quantities used in the model. Apart from the known uncertainty about the operating parameters (e.g., acceleration voltage, electron current, currents of the magnet coils, etc.), there can be factors influencing the electron beam properties that cannot be accurately quantified. These include internal geometrical imperfections, misalignments/tilts with respect to the external magnetic field axis, deviations of the applied magnetic field profile from the nominal one, varying quality of electron emission (as related to the condition of the emitter and the vacuum), etc. It should be also noted here that the electron beam properties (i.e., the velocity and position of electrons), which are used as input to the ED model, cannot be directly measured in the sealed gyrotron and they can only be calculated via beam optics codes. In addition to the above, there can be other effects occurring outside the modelling range of the ED model, which is confined only to the beam-wave interaction in the cavity, that affect the electron beam properties. For instance, there can be parasitic RF oscillations in the gyrotron beam tunnel preceding the cavity (see [47] and references therein). Finally, in longer-pulse operation (>100 ms), the space charge neutralization level in the gyrotron (and hence the electron kinetic energy) can only be estimated. Because of all these aspects, discrepancies between the ED simulation and the experiment are not uncommon, especially in longer-pulse operation of the gyrotron.
3.2. Validation of the TH Model
The validation of the different TH models developed for the resonator equipped with RRs or MCs had different steps. First, the validation exercises of the pure hydraulic model (no heating) are described, before considering the validation in the case of heating.
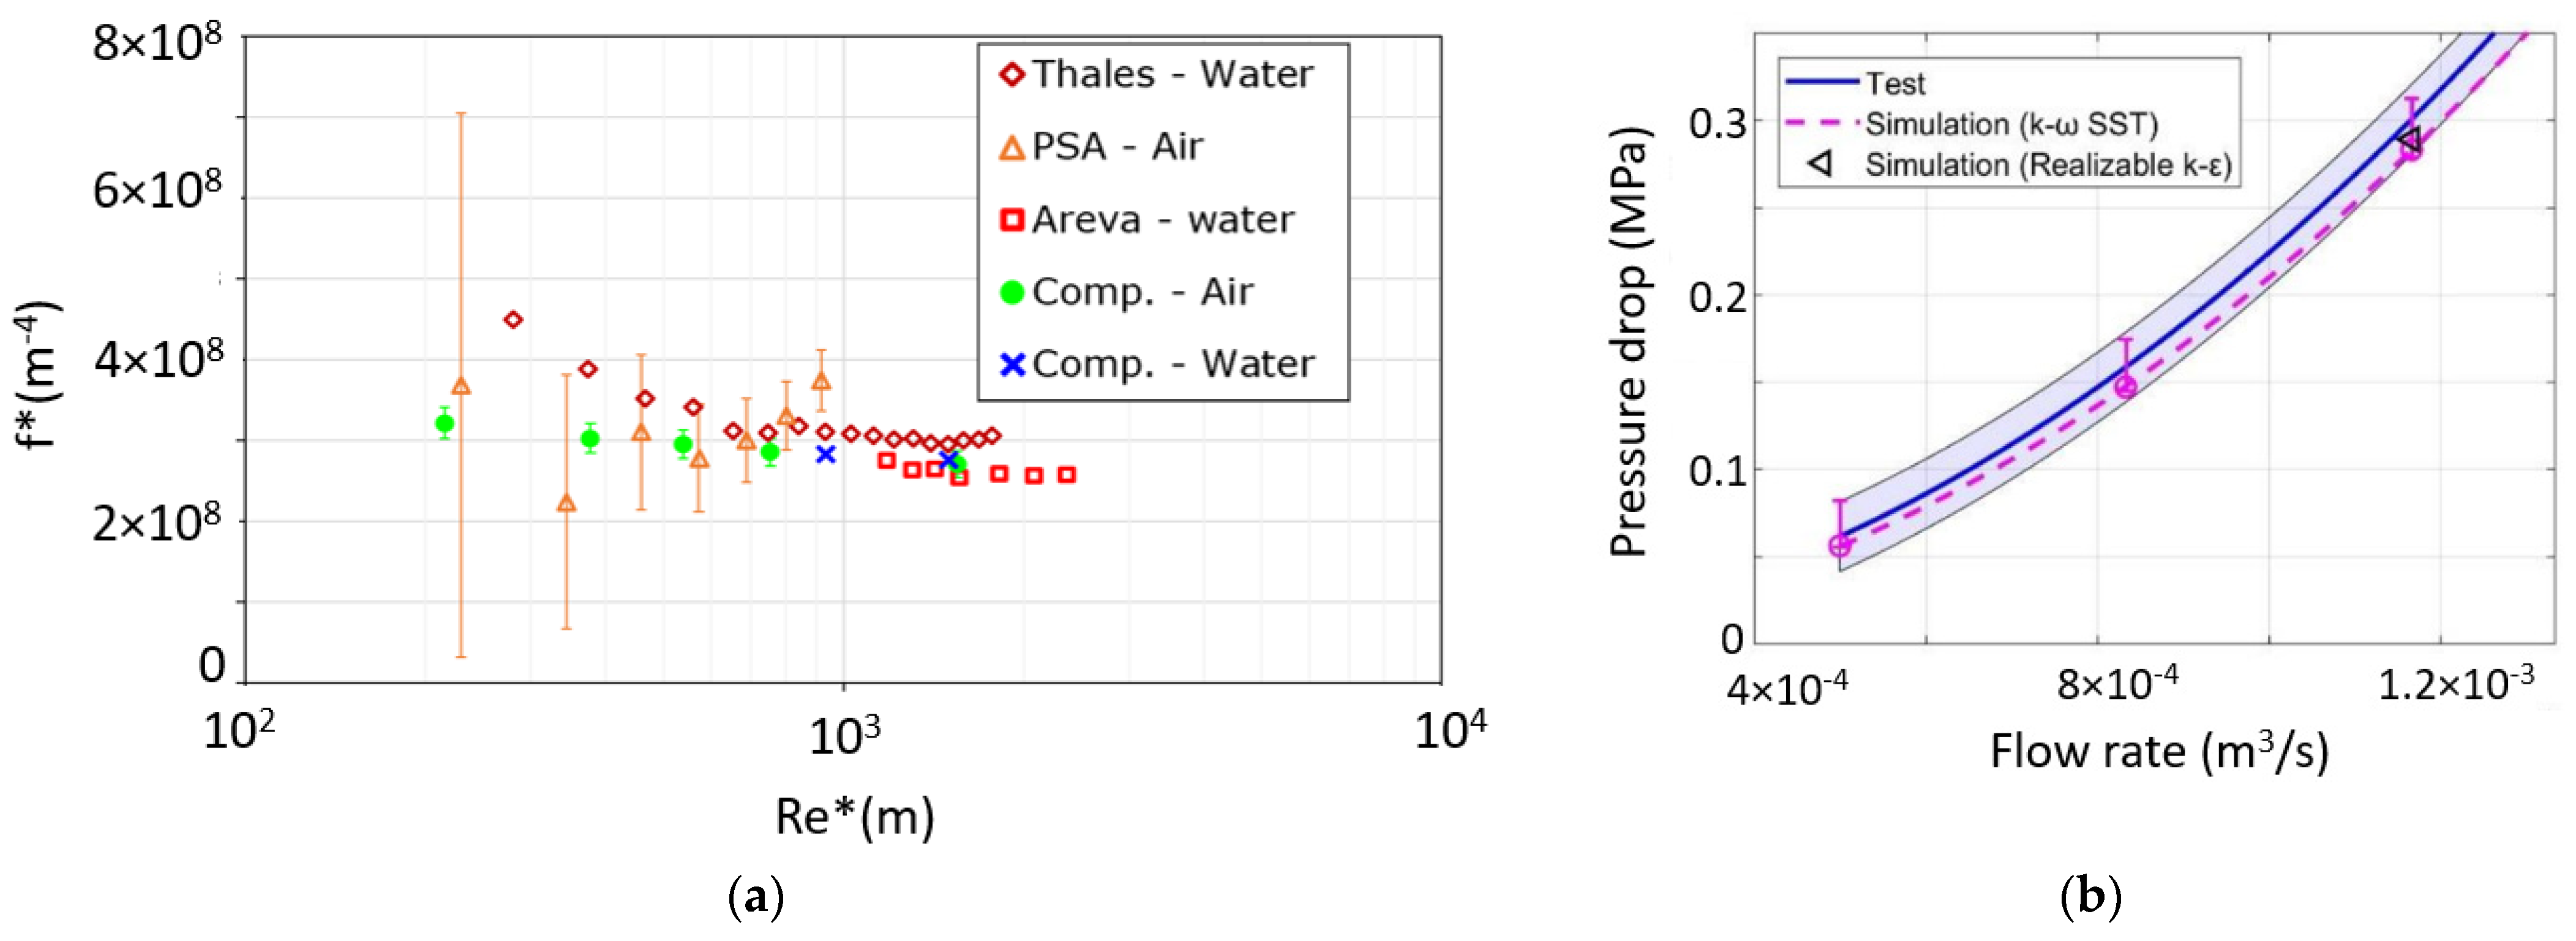
The validation of the hydraulic model of the cavity equipped with RRs relied on the tests of the planar mock-up with two different fluids (subcooled water tests at Areva [38], air tests in a solar furnace at the Plataforma Solar de Almeria PSA, Spain [32]) and on the test of a dedicated cylindrical mock-up [31]. The interpretation of the entire set of hydraulic tests performed on the planar mock-up is described in [32], in terms of pseudo-dimensionless variables in order to be able to show on the same plot data points coming from tests performed using different fluids. Figure 7a collects the measured and computed results, showing a good capability of the numerical model to reproduce the experimental data, notwithstanding the large error bar affecting them. Moving to the hydraulic characteristic measured at THALES on a cylindrical mock-up, the results of the numerical model with κ–ω STT turbulence closure showed again a very good agreement with the measurements; see Figure 7b.

Figure 7.
(a) Pseudo-dimensionless hydraulic characteristic (Re* as a function of f*) of the planar mock-up equipped with RR: experimental (open symbols) and computed (solid symbols) (modified from [32]). (b) Comparison between measured and simulated hydraulic characteristic for the cylindrical mock-up equipped with RRs (modified from [31]). The shaded area represents the error band on the experimental results.
A second cylindrical mock-up was tested at the THALES premises in 2019, equipped with circular MCs. A detailed validation of simulations performed with different RANS turbulence closures on the hydraulic characteristic, see Figure 8, with a rigorous assessment of the errors associated to the measured and simulated data through a multivariate metric procedure [48] allowed the identification of the lag EB κ–ε model as the most suitable for the numerical modelling of the case at hand.
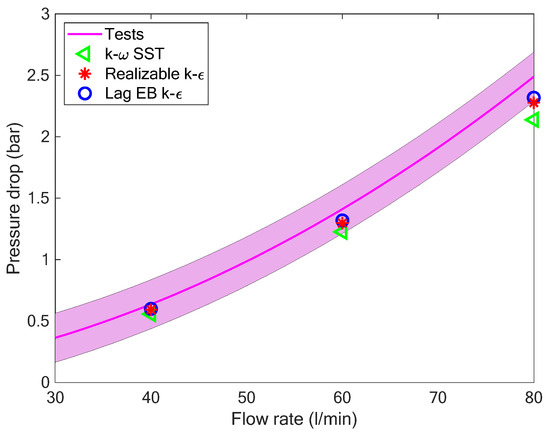
Figure 8.
Comparison between the measured hydraulic characteristic of the cylindrical mock-up equipped with MCs (solid line with shaded area) and that computed using different turbulence models (symbols).
Validation of the conjugate heat transfer model for cavities equipped with RRs has been performed so far relying on the TC measurements in the tests of the planar mock-up at the PSA, using air as the coolant. The calibrated value of keff = 2000 W/m·K was kept frozen. A very good consistency was found between the computed and measured values, in the entire flow rate and heat flux ranges, with the computed values always lying in the error bar of the measured data [32].
For cavities equipped with MCs, some experimental indications of the reliability of the adopted model came recently from the tests of a cavity mock-up at KIT [49]. However, a very limited temperature range was tested in the 2020 test campaign, which cannot be representative of the actual working conditions in the gyrotron cavity.
3.3. Validation of the TM Model
While no dedicated and independent validation of the TM model has been performed so far, some indirect evidence of the quality of the TM model arrived from post-mortem examination of the resonator of the EU 170 GHz 1 MW CW gyrotron prototype for ITER, which was dismantled and refurbished after the end of the first test campaigns at KIT and EPFL. The simulation performed with MUCCA on the operating points of the gyrotron showed, for a high power level, a peak stress beyond the plasticity level. The post-mortem analysis revealed the presence of some permanent deformation in the cavity, which supports the high stress level computed by the TM model. In more detail, the permanent deformation was found to be anisotropic, and that was attributed to inhomogeneous cooling in the azimuthal direction, leading to inhomogeneous deformation, which was in fact also computed in the simulations.
3.4. Validation of the Whole Simulator
The validation of the multi-physics simulator, with particular reference to the iterative coupling procedure among the different modules of the simulator and its capability to capture the main features of the cavity behavior, has been performed against pulses of about 2 s of the dual frequency gyrotron at TCV, EPFL [3], for operation at a high frequency (i.e., 126 GHz). The gyrotron cavity in that case relies on a slightly different geometry with respect to that of the EU 170 GHz 1 MW CW gyrotron prototype for ITER used for the calibration. In more detail, the cooling section equipped with RR was slightly longer and thinner, with a different uptaper shape. The validation exercise has been performed keeping the calibration parameters, obtained previously with different devices, unchanged. A water mass flow rate of 45 L/min and a reference pressure of 5 bar was adopted in the simulations. The ED settings for the computation of the heat load on the cavity considered an electron beam kinetic energy of 78 keV, a beam current of 40 A, an electron velocity ratio of α = v⊥/v|| = 1.3 and an electron beam radius of Rb = 10.6 mm. The magnetic field was set to 5 T. At the computed operating point, the peak temperature reached values of ~260 °C for a peak load of ~17 MW/m2; see Figure 9a. It is evident there that only the first layer of RR actually contributes to the heat removal, calling for a more detailed modelling of the thermal coupling within the porous matrix. The validation exercise returned good agreement between the computed and the experimental results at the highest frequency (see Table 1), with the computed cavity wall power within 10% of that estimated from the experimental calorimetry (Note, however, that the plausible presence of a bypass flow connecting the cavity cooling path to that of the launcher was neglected in the experimental colorimetry.).
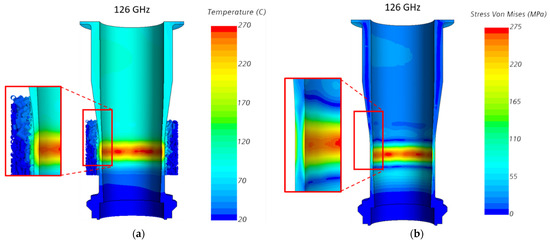
Figure 9.
(a) Computed temperature map and (b) computed Von Mises stress map on the solid domain of the resonator of the TCV gyrotron, for the operating point at 126 GHz considered for the simulator validation.

Table 1.
Summary of the main results of the validation of the cavity simulator against the experimental data of the high frequency operating point of the dual frequency gyrotron at TCV, EPFL.
In addition, the computed frequency shift agreed with the measured one within 8%. The computed RF power at the cavity exit lies almost in the experimental error bar; see again Table 1. The analysis of the computed stresses at the operating point, see Figure 9b, shows a peak value which is ~20% higher than the predicted value for the yield strength, according to the ITER database, but below the ultimate strength. The experimental results were quite reproducible at the beginning of the experimental campaign, implying no plastic deformation of the cavity. The comparison above gives then a flavor of the accuracy of the thermo-mechanical simulations performed within this study, which remains on the conservative side. As a caveat, however, please consider that it is still not clear how values of the peak stress, which are very localized axially and radially inside the cavity wall, should be compared to the limiting values.
4. Opportunities for Further Validation
4.1. Available Experimental Data
A first dataset of hydraulic measurement on azimuthal micro-channels is now available from the tests of prototype cavities realized via additive manufacturing at IPP, Greiswald [50]. At the same time, the hydraulic characteristic of a cylindrical mock-up of a 140 GHz cavity equipped with MCs [35], under consideration for the next version of the upgraded 1.5 MW gyrotron for W7-X, has been measured at Thales.
The tests performed at Areva on the planar mock-ups equipped with RRs have only been partially used, and the thermocouple traces could return useful information for a further model validation, complementing the validation performed using air at the PSA, since water was used in the 2015–2016 tests as coolant in a wide range of temperatures, hitting boiling conditions.
An experimental campaign on the planar mock-ups equipped with MCs is currently ongoing in a solar furnace at the PSA, using air as coolant, in a temperature range much wider than what has been tested so far. The planar mock-up with MCs, already tested in water as reported in [39], is, however, not representative of future cavities equipped with longitudinal MCs, in view of the different manufacturing technique.
Data from the EU 1 MW 170 GHz refurbished gyrotron prototype for ITER, which has a different geometry for cavity cooling with respect to the gyrotron cavity used for the model calibration, are available from the recent tests at KIT, however with little information on the frequency shift. Measurements including the frequency shift, as well as the power deposited in the cavity estimated via calorimetry, are available from the operation of the second dual frequency gyrotron at EPFL, for both high-frequency (126 GHz) and low-frequency (84 GHz) operation.
4.2. Planned Experimental Campaigns
An experimental campaign for the measurement of the effective thermal conductivity of the RR matrix, to be performed at Thales, is currently under design at Politecnico di Torino, based on the setup discussed in [51].
More relevant measured data will be available from the tests of the cylindrical mock-up of a 140 GHz cavity equipped with MCs [35]. The tests will be performed at the KIT test bench [49] by the end of 2021, using inductive heating and both water and air as coolant.
As far as data from the gyrotron operation are concerned, additional data from long-pulse operation of CW gyrotrons will also be available. In particular, the EU 1 MW 170 GHz refurbished gyrotron prototype for ITER is currently being tested at SPC, EPFL. The aim is to extend the pulse duration up to 1000 s at nominal power and the tests are expected to be completed by the end of 2021. The first version of the upgraded 1.5 MW 140 GHz gyrotron for W7-X is expected to be delivered at KIT by the end of 2021 and tested during the first quarter of 2022 with pulses up to 180 s.
There are three relevant quantities that can be measured during long-pulse operation of the gyrotron: (i) the temperature difference between the inlet and outlet of the cavity cooling circuit, for a given flow rate; (ii) the drop of the operating frequency (frequency shift) during the first seconds of the pulse, which is caused by the cavity thermal expansion and the neutralization of the beam space charge and (iii) the gyrotron output power measured calorimetrically on a load. The multi-physics simulator is claimed to be validated when its results agree with the three measured quantities. In particular, using the measured temperature difference in the cavity cooling circuit, the Ohmic losses in the cavity can be calculated calorimetrically. From the electron beam parameters, calculated using beam optic codes, and from the cavity inner contour, provided by the TH and TM simulation, the ED simulation calculates the electromagnetic field in the cavity, which should be consistent with the measured Ohmic losses as well as with the measured output power, under the condition that the neutralization level and the additional losses between the cavity and the load are correctly estimated. In addition, the ED simulation provides the operating frequency, which should be consistent with the measured frequency shift.
The final goal for the validation of the multi-physics simulator is the comparison against experimental results coming from various tested gyrotrons, which differ (in terms of design and operating conditions) from those used for the calibration of the simulator. A successful validation against the forthcoming experiments will grant the multi-physics simulator the status of a reliable predictive tool, as far as the behavior of the gyrotron cavity is concerned.
Author Contributions
Conceptualization, L.S. and K.A.A.; methodology, L.S. and K.A.A.; validation, L.S., K.A.A. and S.A.; formal analysis, L.S. and K.A.A.; investigation, L.S. and K.A.A.; resources, L.S., K.A.A., S.A. and A.L.; data curation, L.S. and K.A.A.; writing—original draft preparation, L.S. and K.A.A.; writing—review and editing, F.A., S.A., A.L. and F.S.; visualization, L.S.; supervision, F.A. and F.S.; project administration, F.S.; funding acquisition, F.A., A.L. and F.S. All authors have read and agreed to the published version of the manuscript.
Funding
The work of LS was partially funded by Fusion for Energy, contract number F4E-2021-EXP-376. The views expressed in this publication are the sole responsibility of authors and do not necessarily reflect the views of F4E, the European Commission or ITER.
Institutional Review Board Statement
Not applicable.
Informed Consent Statement
Not applicable.
Data Availability Statement
Not applicable.
Acknowledgments
The authors are grateful to Andrea Allio and Rosa Difonzo for the support in the production of some of the figures.
Conflicts of Interest
The authors declare no conflict of interest.
References
- Thumm, M. MW gyrotron development for fusion plasma applications. Plasma Phys. Control. Fusion 2003, 45, A143–A161. [Google Scholar] [CrossRef] [Green Version]
- Wolf, R.C.; Bozhenkov, S.; Dinklage, A.; Fuchert, G.; Kazakov, Y.O.; Laqua, H.P.; Marsen, S.; Marushchenko, N.B.; Stange, T.; Zanini, M.; et al. Electron-cyclotron-resonance heating in Wendelstein 7-X: A versatile heating and current-drive method and a tool for in-depth physics studies. Plasma Phys. Control. Fusion 2018, 61, 014037. [Google Scholar] [CrossRef]
- Zohm, H.; Stober, J.; Reisner, M.; Angioni, C.; Navarro, A.B.; Bobkov, V.; Bock, A.; Denisov, G.; Fable, E.; Fischer, R.; et al. Exploring fusion-reactor physics with high-power electron cyclotron resonance heating on ASDEX Upgrade. Plasma Phys. Control. Fusion 2020, 62, 024012. [Google Scholar] [CrossRef]
- Moro, A.; Bruschi, A.; Darcourt, O.; Fanale, F.; Farina, D.; Figini, L.; Gandini, F.; Henderson, M.; Hunt, R.; Lechte, C.; et al. Design of Electron Cyclotron Resonance Heating protection components for first plasma operations in ITER. Fusion Eng. Des. 2020, 154, 111547. [Google Scholar] [CrossRef]
- Ruess, S.; Avramidis, K.A.; Fuchs, M.; Gantenbein, G.; Ioannidis, Z.; Illy, S.; Jin, J.; Kalaria, P.C.; Kobarg, T.; Pagonakis, I.G.; et al. KIT coaxial gyrotron development: From ITER toward DEMO. Int. J. Microw. Wirel. Technol. 2018, 10, 547–555. [Google Scholar] [CrossRef] [Green Version]
- Thumm, M.K.A.; Denisov, G.G.; Sakamoto, K.; Tran, M.Q. High-power gyrotrons for electron cyclotron heating and current drive. Nucl. Fusion 2019, 59, 073001. [Google Scholar] [CrossRef]
- Kuftin, A.N.; Lygin, V.K.; Manuilov, V.N.; Raisky, B.V.; Solujanova, E.A.; Tsimring, S.E. Theory of helical electron beams in gyrotrons. Int. J. Infrared Millim. Waves 1993, 14, 783–816. [Google Scholar] [CrossRef]
- Avramidis, K.A.; Gantenbein, G.; Ioannidis, Z.C.; Pagonakis, I.G.; Rzesnicki, T.; Thumm, M.; Jelonnek, J.; Albajar, F.; Cau, F.; Cismondi, F.; et al. Numerical STUDIES on the influence of Cavity Thermal Expansion on the Performance of a High-Power Gyrotron. In Proceedings of the IVEC 2017–18th International Vacuum Electronics Conference, London, UK, 24–26 April 2017. [Google Scholar]
- Zani, L.; Lacroix, B.; Torre, A.; Vallet, J.-C.; Berthinier, C.; Bourcier, C.; Misiara, N.; Nunio, F.; Vallcorba, R.; Van Wambeke, C.; et al. OLYMPE, a multi-physic platform for fusion magnet design: Development status and first applications. Cryogenics 2020, 108, 103086. [Google Scholar] [CrossRef]
- Bottura, L.; Rosso, C.; Breschi, M. A general model for thermal, hydraulic and electric analysis of superconducting cables. Cryogenics 2000, 40, 617–626. [Google Scholar] [CrossRef] [Green Version]
- Marchesin, R.; Albert, S.; Avramidis, K.A.; Bertinetti, A.; Dubrav, J.; Fascl, D.; Gantenbein, G.; Genoud, J.; Hogge, J.P.; Jelonnek, J.; et al. Manufacturing and Test of the 1 MW Long-Pulse 84/126 GHz Dual-Frequency Gyrotron for TCV. In Proceedings of the 2019 International Vacuum Electronics Conference (IVEC), Busan, Korea, 28 April–1 May 2019. [Google Scholar] [CrossRef]
- Thumm, M.; Alberti, S.; Arnold, A.; Brand, P.; Braune, H.; Dammertz, G.; Erckmann, V.; Gantenbein, G.; Giguet, E.; Heidinger, R.; et al. EU megawatt-class 140-GHz CW gyrotron. IEEE Trans. Plasma Sci. 2007, 35, 143–153. [Google Scholar] [CrossRef]
- Alberti, S.; Genoud, J.; Goodman, T.; Hogge, J.P.; Silva, M.; Tran, T.M.; Tran, M.Q.; Avramidis, K.; Pagonakis, I.G.; Jin, J.; et al. Progress on the upgrade of the TCV EC-system with two 1MW dual-frequency gyrotrons. In Proceedings of the 2016 41st International Conference on Infrared, Millimeter, and Terahertz waves (IRMMW-THz), Copenhagen, Denmark, 25–30 September 2016. [Google Scholar] [CrossRef]
- Ioannidis, Z.C.; Rzesnicki, T.; Avramidis, K.; Gantenbein, G.; Illy, S.; Jin, J.; Kobarg, T.; Pagonakis, I.G.; Schmid, M.; Thumm, M.; et al. First CW experiments with the EU ITER 1 MW, 170 GHz industrial prototype gyrotron. In Proceedings of the 2017 Eighteenth International Vacuum Electronics Conference (IVEC), London, UK, 24–26 April 2017. [Google Scholar] [CrossRef]
- Jelonnek, J.; Aiello, G.; Albaiar, F.; Alberti, S.; Avramidis, K.A.; Bertinetti, A.; Brucker, P.T.; Bruschi, A.; Chclis, I.; Dubray, J.; et al. From W7-X Towards ITER and Beyond: 2019 Status on EU Fusion Gyrotron Developments. In Proceedings of the 2019 International Vacuum Electronics Conference, IVEC 2019, Busan, Korea, 28 April–1 May 2019. [Google Scholar]
- Darbos, C.; Albajar, F.; Bonicelli, T.; Carannante, G.; Cavinato, M.; Cismondi, F.; Denisov, G.; Farina, D.; Gagliardi, M.; Gandini, F.; et al. Status of the ITER electron cyclotron heating and current drive system. J. Infrared Millim. Terahertz Waves 2016, 37, 4–20. [Google Scholar] [CrossRef]
- Avramidis, K.A.; Ioannidis, Z.C.; Aiello, G.; Bénin, P.; Chelis, I.; Dinklage, A.; Gantenbein, G.; Illy, S.; Jelonnek, J.; Jin, J.; et al. Towards a 1.5 MW, 140 GHz gyrotron for the upgraded ECRH system at W7-X. Fusion Eng. Des. 2021, 164, 112173. [Google Scholar] [CrossRef]
- Sakamoto, K.; Ikeda, R.; Oda, Y.; Kobayashi, T.; Kajiwara, K.; Shidara, H.; Takahashi, K.; Moriyama, S. Status of high power gyrotron development in JAEA. In Proceedings of the 2015 IEEE International Vacuum Electronics Conference (IVEC), Beijing, China, 27–29 April 2015. [Google Scholar] [CrossRef]
- Sakamoto, K.; Kajiwara, K.; Takahashi, K.; Oda, Y.; Kasugai, A.; Kobayashi, T.; Kobayashi, N.; Henderson, M.; Darbos, C. Development of high power gyrotron for ITER application. In Proceedings of the 35th International Conference on Infrared, Millimeter, and Terahertz Waves, Rome, Italy, 5–10 September 2010. [Google Scholar] [CrossRef]
- Savoldi, L.; Albajar, F.; Alberti, S.; Avramidis, K.A.; Bertinetti, A.; Cau, F.; Cismondi, F.; Gantenbein, G.; Hogge, J.P.; Ioannidis, Z.C.; et al. Assessment and Optimization of the Cavity Thermal Performance for the European Continuous Wave Gyrotrons. In Proceedings of the 27th IAEA Fusion Energy Conference (FEC 2018), Gāndhināgar, Indien, 22–27 October 2018. [Google Scholar]
- Bertinetti, A.; Avramidis, K.A.; Albajar, F.; Cau, F.; Cismondi, F.; Rozier, Y.; Savoldi, L.; Zanino, R. Multi-physics analysis of a 1 MW gyrotron cavity cooled by mini-channels. Fusion Eng. Des. 2017, 123, 313–316. [Google Scholar] [CrossRef]
- Cordova, M. Thermo-Mechanical Study of the Cavity of the 1 MW–140 GHz Gyrotron for W7-X. Master’s Thesis, Karlsruhe Institute Technology, Karlsruhe, Germany, 2013. [Google Scholar]
- Avramidis, K.A.; Bertinetti, A.; Albajar, F.; Cau, F.; Cismondi, F.; Gantenbein, G.; Illy, S.; Ioannidis, Z.C.; Jelonnek, J.; Legrand, F.; et al. Numerical Studies on the Influence of Cavity Thermal Expansion on the Performance of a High-Power Gyrotron. IEEE Trans. Electron Devices 2018, 65, 2308–2315. [Google Scholar] [CrossRef]
- Leggieri, A.; Albajar, F.; Alberti, S.; Allio, A.; Avramidis, K.A.; Bariou, D.; Bin, W.; Bruschi, A.; Chelis, I.; Difonzo, R.; et al. Upgrade of The European ITER 170 GHz 1 MW CW Industrial Gyrotron (TH1509). In Proceedings of the 7th IVEW 2020 and 13th IVeSC 2020, Monterey, CA, USA, 26–29 May 2020. [Google Scholar]
- Leggieri, A.; Albajar, F.; Albert, S.; Allio, A.; Avramidis, K.A.; Bariou, D.; Bin, W.; Bruschi, A.; Chelis, J.; Difonzo, R.; et al. TH1509U European 170 GHz 1 MW CW Industrial Gyrotron Upgrade. In Proceedings of the IEEE IVEC 2021, Virtual Event, 27–30 April 2021. [Google Scholar]
- Avramides, K.A.; Pagonakis, I.G.; Iatrou, C.T.; Vomvoridis, J.L. EURIDICE: A code-package for gyrotron interaction simulations and cavity design. EPJ Web Conf. 2012, 32, 04016. [Google Scholar] [CrossRef] [Green Version]
- Ginzburg, N.S.; Nusinovich, G.S.; Zavolsky, N.A. Theory of non-stationary processes in gyrotrons with low Q resonators. Int. J. Electron. 1986, 61, 881–894. [Google Scholar] [CrossRef]
- Jackson, J.D. Wave guides and resonant cavities. In Classical Electrodynamics; Wiley: Hoboken, NJ, USA, 1975. [Google Scholar]
- ITER. Material Properties Handbook for Glidcop, available upon request.
- Tsang, L.; Braunisch, H.; Ding, R.; Gu, X. Random rough surface effects on wave propagation in interconnects. IEEE Trans. Adv. Packag. 2010, 33, 839–856. [Google Scholar] [CrossRef]
- Allio, A.; Difonzo, R.; Leggieri, A.; Legrand, F.; Marchesin, R.; Savoldi, L. Test and Modeling of the Hydraulic Performance of High-Efficiency Cooling Configurations for Gyrotron Resonance Cavities. Energies 2020, 13, 1163. [Google Scholar] [CrossRef] [Green Version]
- Savoldi, L.; Allio, A.; Bonvento, A.; Cantone, M.; Fernandez Reche, J. Experimental and numerical investigation of a porous receiver equipped with Raschig Rings for CSP applications. Sol. Energy 2020, 212, 309–325. [Google Scholar] [CrossRef]
- Savoldi, L.; Bertinetti, A.; Nallo, G.F.; Zappatore, A.; Zanino, R.; Cau, F.; Cismondi, F.; Rozier, Y. CFD Analysis of Different Cooling Options for a Gyrotron Cavity. IEEE Trans. Plasma Sci. 2016, 44, 3432–3438. [Google Scholar] [CrossRef]
- Cantone, M.; Cagnoli, M.; Fernandez Reche, J.; Savoldi, L. One-side heating test and modeling of tubular receivers equipped with turbulence promoters for solar tower applications. Appl. Energy 2020, 277, 115519. [Google Scholar] [CrossRef]
- Savoldi, L. Support in the Design and Analysis of the Gyrotron Full-Size Cavity and Mock-Ups, F4E_D_24Q2PG. 2015; available upon request.
- Rohsenow, W.M. Boiling. Annu. Rev. Fluid Mech. 2003, 3, 211–236. [Google Scholar] [CrossRef]
- Hirt, C.W.; Nichols, B.D. Volume of fluid (VOF) method for the dynamics of free boundaries. J. Comput. Phys. 1981, 39, 201–225. [Google Scholar] [CrossRef]
- Savoldi, L. Experimental and Simulation Results on the Mock-Ups Equipped with Raschig Rings and Mini-Channels, F4E_D_28KSJG. 2017; available upon request.
- Bertinetti, A.; Albajar, F.; Cau, F.; Leggieri, A.; Legrand, F.; Perial, E.; Ritz, G.; Savoldi, L.; Zanino, R.; Zappatore, A. Design, Test and Analysis of a Gyrotron Cavity Mock-Up Cooled Using Mini Channels. IEEE Trans. Plasma Sci. 2018, 46, 2207–2215. [Google Scholar] [CrossRef]
- Ioannidis, Z.C.; Rzesnicki, T.; Albajar, F.; Alberti, S.; Avramidis, K.A.; Bin, W.; Bonicelli, T.; Bruschi, A.; Chelis, I.; Frigot, P.E.; et al. CW Experiments with the EU 1-MW, 170-GHz Industrial Prototype Gyrotron for ITER at KIT. IEEE Trans. Electron Devices 2017, 64, 3885–3892. [Google Scholar] [CrossRef]
- Ioannidis, Z.C.; Albajar, F.; Alberti, S.; Avramidis, K.A.; Bin, W.; Bonicelli, T.; Bruschi, A.; Chelis, J.; Fanale, F.; Gantenbein, G.; et al. Recent experiments with the European 1MW, 170GHz industrial CW and short-pulse gyrotrons for ITER. Fusion Eng. Des. 2019, 146, 349–352. [Google Scholar] [CrossRef] [Green Version]
- Menachilis, P. Simplified Approach for the Calibration of the RR Conductivity, F4E_D_2HBAC8. 2019; available upon request.
- Avramidis, K.A.; Pagonakis, I.G.; Chelis, I.G.; Gantenbein, G.; Ioannidis, Z.C.; Peponis, D.V.; Rzesnicki, T.; Jelonnek, J. Simulations of the experimental operation of the EU 170 GHz, 1 MW short-pulse prototype gyrotron for ITER. In Proceedings of the 2016 41st International Conference on Infrared, Millimeter, and Terahertz Waves (IRMMW-THz), Copenhagen, Denmark, 25–30 September 2016. [Google Scholar] [CrossRef]
- Avramidis, K.A.; Aiello, G.; Alberti, S.; Brücker, P.T.; Bruschi, A.; Chelis, I.; Franke, T.; Gantenbein, G.; Garavaglia, S.; Genoud, J.; et al. Overview of recent gyrotron R&D towards DEMO within EUROfusion Work Package Heating and Current Drive. Nucl. Fusion 2019, 59, 066014. [Google Scholar] [CrossRef] [Green Version]
- Avramidis, K.A.; Ioannidis, Z.C.; Illy, S.; Jin, J.; Ruess, T.; Aiello, G.; Thumm, M.; Jelonnek, J. Multifaceted Simulations Reproducing Experimental Results from the 1.5-MW 140-GHz Preprototype Gyrotron for W7-X. IEEE Trans. Electron Devices 2021, 68, 3063–3069. [Google Scholar] [CrossRef]
- Schlaich, A.; Wu, C.; Pagonakis, I.; Avramidis, K.; Illy, S.; Gantenbein, G.; Jelonnek, J.; Thumm, M.; Schlaich, A.; Wu, C.; et al. Frequency-Based Investigation of Charge Neutralization Processes and Thermal Cavity Expansion in Gyrotrons. JIMTW 2015, 36, 797–818. [Google Scholar] [CrossRef]
- Chelis, I.G.; Avramidis, K.A.; Ioannidis, Z.C.; Tigelis, I.G. Improved Suppression of Parasitic Oscillations in Gyrotron Beam Tunnels by Proper Selection of the Lossy Ceramic Material. IEEE Trans. Electron Devices 2018, 65, 2301–2307. [Google Scholar] [CrossRef]
- Difonzo, R.; Allio, A.; Savoldi, L. Multivariate metric assessment of the suitability of different RANS turbulence models for the simulation of mini-channels cooling systems for the fusion gyrotron resonator. In Proceedings of the AMSE V&V Symposium 2021, Virtual Event, 10–13 May 2021. [Google Scholar]
- Stanculovic, S.; Difonzo, R.; Allio, A.; Avramidis, K.A.; Brücker, P.; Gantenbein, G.; Illy, S.; Jelonnek, J.; Kalaria, P.C.; Misko, M.; et al. Calibration of the KIT test setup for the cooling tests of a gyrotron cavity full-size mock-up equipped with mini-channels. Fusion Eng. Des. 2021, 172, 112744. [Google Scholar] [CrossRef]
- Laqua, H.P.; Max Planck Institute for Plasma Physics, Garching bei München, Germany. Personal communication, 2021.
- Abuserwal, A.F.; Elizondo Luna, E.M.; Goodall, R.; Woolley, R. The effective thermal conductivity of open cell replicated aluminium metal sponges. Int. J. Heat Mass Transf. 2017, 108, 1439–1448. [Google Scholar] [CrossRef]


Publisher’s Note: MDPI stays neutral with regard to jurisdictional claims in published maps and institutional affiliations. |
© 2021 by the authors. Licensee MDPI, Basel, Switzerland. This article is an open access article distributed under the terms and conditions of the Creative Commons Attribution (CC BY) license (https://creativecommons.org/licenses/by/4.0/).