Abstract
Cattle biomass (CB or manure from cattle) is proposed as reburn fuel under slightly fuel-rich conditions. The CB includes wastes from cattle feedlots (cattle grown in feedlots to slaughter weights of 450–640 kg) termed as Feedlot Biomass (FB) and cattle wastes from dairy farms termed as Dairy Biomass (DB). NOx emissions from coal-fired power plants can be reduced by using pure CB and Coal:CB mixtures as reburn fuels (10~30% by heat) injected after the primary combustion region. Experiments with Coal:CB mixtures as reburn fuels were performed using the 30 kW burner facility. Part I deals with results from experiments using pure FB and Coal:FB blends as reburn fuels while Part II presents results on extent of NOx reduction using pure DB and Coal:DB blends as reburn fuels (RF). In the current work, results on NOx emission are presented with FB and Coal:FB blends as RF. The parametric studies include: equivalence ratio in reburn zone (ERRBZ), vitiated air, angle of reburn nozzles, presence and absence of heat exchangers (HEXs), and baseline NOx concentration. The optimum operating conditions for FB reburning were found to be conditions with vitiation at ERRBZ = 1.1 with 45° upward counter-current injection in the presence of HEXs. NOx emissions were reduced by as much as 96%.
Keywords:
cattle biomass; animal wastes; renewable energy; reburn; co-firing; combustion; NOx reduction 1. Introduction and Literature Review
The current method of disposal of cattle manure (termed as cattle biomass, CB) is to apply it as fertilizer on the land near cattle feedlots (acronyms at end of text). There are two types of CB: Feedlot Biomass (FB) which is the animal waste from cattle feedlots and Dairy Biomass (DB) which is the animal waste from dairy cattle. The CB was further classified based on deposition of CB on different surfaces and collection techniques. The CB scraped from the soil surface of feedlots containing high ash is termed High Ash Feedlot Biomass (HAFB) and High Ash Dairy Biomass (HADB), and that collected from fly ash paved surfaces containing less ash is termed as Low Ash Feedlot Biomass (LAFB) and Low Ash Dairy Biomass (LADB). Biomass samples prior to composting are termed raw manure, and samples taken after about 45 days of composting involving successive wetting and turning cycles are termed partially composted (PC) []. Samples taken after about 120 days of composting (which involves wetting and turning cycles) are termed finished compost.
If CB is not disposed of according to state or federally approved nutrient management plans, it leads to eutrophication whereby water bodies receive excess nutrients, stimulating excessive plant growth (algal bloom), which reduces dissolved O2 in water when the plants start decomposing and affects the survival of aquatic life. In recent years, this practice has gained the attention of many who are concerned about an overloading of soil nutrients (particularly phosphorus) and potentially polluting the soil and nearby streams and watersheds. Environmental agencies are currently imposing stricter limits to manure nutrient application on parcels of land near large animal farms. In addition, new disposal methods, such as organized composting of cattle manure, are being implemented to improve environmental stewardship.
In co-firing, the low-quality biomass is mixed with high-quality coal and fired in existing pulverized coal-fired boilers. Thus, co-firing of CB with coal provides a means of disposing of CB [,,,,,,,]. Since N content in CB is almost twice that of coal, the emission of NOx in co-firing is of concern. Typically, the uncontrolled NOx emissions in industrial boilers are 43~129 g/GJ (0.1~0.3 lb/MMBtu) for NG while coal produces 86~258 g/GJ (0.2~0.6 lb/MMBtu) for stoker-fired units and 215~387 g/GJ (0.5~0.9 lb/MMBtu) for tangentially and wall-fired units. With approximately 40% of the world’s electric power generation coming from coal-fired utilities, improved methods for controlling this emission are necessary []. The agricultural biomass (AgB) and animal waste-based biomass (AnB) fuels have been addressed experimentally as a co-fired fuel [,,,,] because it is CO2 neutral and it reduces coal consumption. In the case of AgB fuels (e.g., saw dust, wheat straw etc.), the N content in the blended fuel is reduced due to reduced N content of AgB, thereby reducing NOx. On the other hand, the CB fuels have high N content and hence N content of Coal:CB blend is increased relative to coal.
Co-firing experiments were performed using a small-scale (30 kW or 100,000 BTU/h) Boiler Burner Research Facility at Texas A&M University (TAMU) with FB as co-fired fuel. Important findings are as follows [,,,]: (i) The NOx emission is decreased by about 10% when co-firing of 10% FB and 90% coal even though the blend has higher N content compared to pure coal. (ii) The CO emissions increased due to limited residence time in the reactor. (iii) The reduction of NOx was attributed to (a) higher volatile matter (VM) in the FB which depletes the oxygen, rapidly inhibiting the NOx formation and (b) the urea-based N in FB where N is released as ammonia (NH3 which reacts with NOx to create N2 lowering NOx emissions).
In addition to CB fuels, high ash litter biomass (LB) was gasified in a 10 kW (thermal) fixed−bed, counter−current atmospheric pressure gasifier to generate a mixture of low BTU gases []. Studies have been performed with poultry litter biomass (LB, moisture 21%) as co-fired fuel with natural gas [] at equivalence ratio ranging from 0.56–0.96 (lean mixture). A lab-scale swirling fluidized bed combustion system was used. In addition, a brief overview on co-combustion of LB with coal in fluidized beds (110,000 BUT/h) is also presented. Thermogravimetric analyses were performed on LB: Coal mixture at various LB% (0–75%) in blend. Thien et al. [] performed co-firing experiments using the TAMU 100,000 BTU/h facility with 10% of LB and 90% of coal blends. NOx emission remained unaffected but increased with increased excess air %. Better ignition was observed with increasing LB% mostly due to increased VM in PB [,].
The co-firing results suggest that it is of immense interest to study the effect of using FB as reburn fuel (RF). In the previous reburn processes cited in the literature, NG and AgB have been used as a reburn fuel (RF) for NOx reductions [,]. There were very few previous studies using the FB as a RF for NOx reductions, and most of them were investigated by the authors of the current study. Preliminary reburn experiments were performed using a 30 kW facility with LAFB as reburn fuel []. Important findings are as follows. (i) The reburning results revealed about an 80% reduction in NOx emissions at the optimum conditions when pure air was used for transporting LAFB to the burner. (ii) The use of LAFB as a co-fired or reburn fuel generated more ash than coals in the boiler, resulting in ash fouling and hence it may affect boiler performance. Under the DOE CRADA assistance to the TAMU research program, pilot tests were performed at a 500,000 BTU/h DOE facility but with opposed jet injection configurations and the simulated exhaust gas recirculation (i.e., reduced O2 concentration) for the RF supply system. NOx reductions of 80~90% were observed under selected conditions []. The LAFB reburning process has resulted in US provisional patents [] and US patent #6,973,883 []. This technology has the potential to reduce NOx emissions in coal-fired boilers located near cattle feedlots and also relieves the cattle industry of the waste material. Three volume reports to DOE [] contain (i) details of combustion and gasification, (ii) extensive data generated with co-firing and reburn, (iii) zero dimensional reburn model incorporating gradual mixing of reburn solid fuel with main burner gases, heating of FB particles, liberation of volatiles accompanied by heterogeneous and homogeneous reactions of C, CO and volatiles, fuel N compounds oxidation and reduction, and (iv) validation with the experimental data for almost all parametric cases.
There is extensive earlier literature on the reburn process with CH4 as reburn fuel. In order to compare and interpret the above results, a brief literature review was undertaken on the parameters affecting NOx reduction in the reburn process. The chemistry of NOx reduction in oxy-fuel combustion of CH4 in N2 and CO2 was studied using a flow reactor []. The operating conditions are as follows: Atmospheric pressure and diluted conditions in N2 and CO2, temperatures from 1173 to 1773 K and fuel-rich to fuel-lean. The results showed similar reduction efficiencies under rich conditions irrespective of dilution with N2 or CO2; however, NO reduction efficiency with CO2 was higher than that with N2 under stoichiometric to fuel-lean conditions. The results reveal an inverse relation between CO and NO concentration. The temperature of maximum CO concentration matched with an increase in NO reduction efficiency []. This temperature of maximum reduction was higher with CO2 dilution than with N2. The results were interpreted in terms of an updated detailed chemical kinetic model. The dilution with CO2 appears to increase the OH/H ratio, decrease the OH radical pool and increase CO. Under stoichiometric conditions, the NO reduction is enhanced in CO2 because of the suppression of the O/H radical pool, in particular of atomic oxygen.
A fuel-lean reburn system was developed [] to replace the conventional reburning technique which operates under slightly rich condition for increasing NO reduction efficiency [] and to minimize the CO formation. In the above system, the injected reburn fuel is low enough to maintain fuel-lean condition within the furnace. Such a system does not require overfire air which is used in a conventional reburn system. Reduction characteristics of NOx were obtained using a laboratory-scale combustor (15 kW) with liquefied petroleum gas as main fuel (MF) and an RF for various oxygen-enhanced combustion conditions. In the fuel-lean reburn system, RF generated only 13% of total heat input to achieve a maximum of 48% in NOx reduction.
In order to enhance NOx reduction, meet the NOx emission requirements for coal-fired utilities and help the cattle industry dispose of feedlot animal waste or FB, the current study focusses on developing an energy conversion technology using FB as RF in a 30 kW (100,000 BTU/h) Boiler Burner Research Facility in order to establish optimum conditions for maximum NOx reduction.
Various experiments were performed: (1) The physical and chemical properties of all reburn fuels were determined on a mass basis and (2) the effects of reburn fuel type, equivalence ratio (ERRBZ or ϕ) in reburn zone, HEX presence, vitiated vs. pure air for transport of reburn fuels, and reburn injection angle on NOx reduction were investigated. The primary fuel or MF used during the experiments was a mixture of NG and smaller amounts of NH3 to simulate combustion gases with NOx from the primary combustion zone of a coal plant. The reburn fuels considered for the experiments were Texas Lignite Coal (TXLC), Wyoming Sub-bituminous Coal (WYC), Low Ash Partially-Composted Feedlot Biomass (LAPCFB), High Ash Partially-Composted Feedlot Biomass (HAPCFB), and blends of coal and FB. The typical heat input from MF was 70% and 30% from RF, and the ϕ varied from 0.95 to 1.15. For the use of HEXs, air was used as the cold working fluid in HEXs. The base case used the non-vitiated reburn air (20.9% O2), and the vitiated reburn air (12.5% O2) was tested by adding N2 to simulate the flue gas recirculation. Two injection angles of reburn fuels were used: 0° jet injection and 45° upward counter-current injection. (3) The emissions of other gas components such as CO, CO2, SO2, and CxHy were evaluated. As a result, the operating conditions that give the best NOx reduction were identified.
The results from the current study should provide guidelines for coal-fired utilities to fire FB in their boilers to reduce NOx. By developing this technology, coal-fired utilities can meet NOx emission requirements and also help the cattle industry dispose of excess manure or animal waste.
2. Materials and Methods
The fuel characteristics of natural gas, coal and various reburn fuels are presented first followed by brief description of experimental set up and operational conditions and NOx emission relations in terms of kg/GJ.
2.1. Fuel Characteristics
For small-scale reburn experiments, typically natural gas (NG) is used to simulate coal combustion gases and combustion of NH3 is used to generate NO gas. Both burn rapidly within a short distance. The NG used in experiments consisted of 94.5% methane, 1.7% carbon dioxide, 2.3% ethane, and trace amounts of several other gases (Molecular weight, M ≈ 16.9 g/mol, density: 0.7 kg/m3). Based on the NG composition, unit carbon formula (UCF) was deduced to be CH3.84N0.0086O0.032 with a heating value of 37,055 kJ/m3 (53,370 kJ/kg). It was important to maintain slightly fuel-lean combustion in the primary combustion zone to burn the NG completely. All of the FB fuels were collected and prepared at the Texas Agri-Life Research Station in Bushland, TX. The HAPCFB was collected from feedlots with a soil surface and then composted in windrows for 55 days. The LAPCFB was collected from feedlots paved with fly ash and then composted in windrows for 55 days. Less soil was collected with the heterogeneous raw FB gathered from paved feedlots and therefore less ash was in the fuel. After composting the biomass which also helps in improving the homogeneity of fuel, it was dried in a greenhouse and finely ground. All fuels were analyzed for the proximate and ultimate analyses on an as-received and dry basis. The proximate analysis includes volatile matter (VM), fixed carbon (FC), moisture, ash and gross or higher heating value (HHV). The ultimate analysis comprises the elemental composition of fuel: carbon, hydrogen, oxygen, nitrogen, and sulfur. Three samples of each fuel were analyzed and the average values are listed in Table 1A [,].

Table 1.
(A) Proximate and ultimate analyses for reburn fuels (RF). (B) Derived properties from proximate and ultimate analyses. CO2 = 0.1 × RQ (Tons/GJ) or 232 × RQ (lb/MMBtu); Carbon Intensity (CI) = 27 × RQ (kg of C/GJ) or 0.097 RQ (kg of C/kWh) or 63.3 lb of C per MMBtu.
Table 1A lists the properties on as-received basis, dry basis and dry ash free basis (DAF) while Table 1B lists derived properties [,]. The HHV of LAPCFB was 2.5 times larger than HAPCFB on an as-received basis (As Rec.) whereas it was only 1.2 times larger than HAPCFB for the DAF case. The data showed that a large percentage of the difference between heat contents can be attributed to ash and moisture. The HHV of FB on a DAF basis (about 20,000 kJ/kg) was roughly 2/3 of the HHV of DAF coals (30,000 kJ/kg). Differences in chemical composition of FB fuels on a dry, ash free basis were largely determined by differences in cattle feed ration [,].
The tested reburn fuels were pure TXLC, pure LAPCFB, pure HAPCFB, pure WYC, blends of 90:10, 70:30 and 50:50 TXLC:LAPCFB, and blends of 90:10, 70:30 and 50:50 TXLC:HAPCFB on a mass basis. The WYC was used as the baseline reburn fuel. Using the proximate and ultimate analyses (Table 1A), several properties can be derived including the higher heating value based on stoichiometric oxygen (HHVO2, kJ/kg of O2). It is apparent that HHVO2 is almost constant even though the HHV differs by a factor of 4 for different fuels. Derived properties are shown in Table 1B.
The ash analysis for pure reburn fuels is presented in Table 2. The ash analysis of fuels is very important since it affects the deposition rate, fusion temperature, corrosion rate, and erosion rate. Coals contain a high percentage of silicon, aluminum, calcium, and sulfur while LAPCFB contains much more potassium, phosphorus, and chlorine than other fuels. Higher alkaline oxide contents result in a higher probability of fouling due to the oxide layers on a HEX surface growing faster. The LAPCFB has high alkaline contents probably due to the collection of FB from fly ash paved feedlots.
Table 2.
Analysis of Ash [,].
The Rosin Rammler distribution, which is widely used to describe the particle size of pulverized solid fuels, is shown in Figure 1 for pure HAPCFB, LAPCFB, TXLC, and WYC. Particles smaller than 75 μm (200-mesh screen) are 78% for the pure HAPCFB, 43% for the pure LAPCFB, 38% for the pure WYC, and 24% for the pure TXLC by mass. More than 90% of particles for all fuels are smaller than 300 μm. It was found that the ash tended to make up most of the smaller particles and the combustibles were contained in larger particles of HAPCFB fuel samples. Since TXLC, LAPCFB, and WYC contain low ash contents, most of the small particles may be presumed to be combustibles. Theoretically, the smaller particle sizes would heat faster and release volatiles faster and thus reduce NOx more readily. Mean size by mass and Sauter mean diameter (SMD or d32) of fuel particles are presented in Table 3. The SMD is typically used to determine the average diameter of solid fuel particles by representing particles having the same volume to surface area ratio. Mean size of reburn fuels was 65.2 μm for HAPCFB, 147.2 μm for LAPCFB, 156.1 μm for TXLC, and 111.9 μm for WYC. HAPCFB had the smallest mean size of particles due the fact that it contained a larger portion of small particles made up of mostly ash compared with the other fuels. The SMD of reburn fuels was 32.7 μm for HAPCFB, 56.3 μm for LAPCFB, 81 μm for TXLC, and 64.4 μm for WYC.
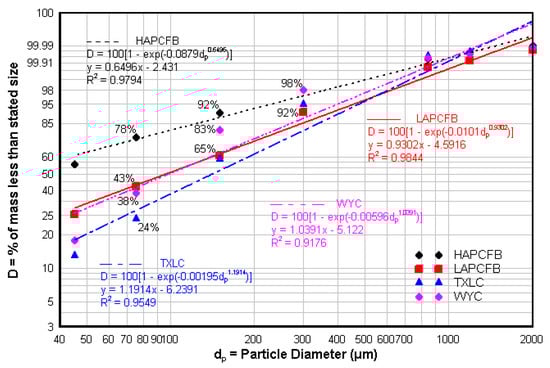
Figure 1.
Particle size (Rosin Rammler) distributions of reburn fuels. Cumulative Mass %, D = 100 {1 − exp(−bdpn)}, See Chapter 4 of Ref. [], y = ln {−ln{1 − (D/100)}, x = ln(dp), y = nx+A, A = ln(b), Data fit for TXLC yields A= −6.2391, n = 1.1.1914. Similar procedure for HAPCFB, LAPCFB and WYC See Refs. [,] for size distribution for dairy biomass.
Table 3.
Fuel particle size distributions.
2.2. Experimental Facility
A schematic of the small-scale (30 kW) boiler burner at TAMU used in the experiments is shown in Figure 2. The boiler burner consisted of a 6 in (15.24 cm) diameter, 72 in (182.88 cm) long vertically down-fired combustor. The combustor was made with a steel frame containing a 2 in (5.08 cm) layer of insulation and a 2 in (5.08 cm) section of refractory. Along the walls of the furnace there were several gas sampling ports and temperature measurement ports. The gas stream was cooled down by the jet water in the quenching area, and then the exhaust gases vented out through an exhaust system.
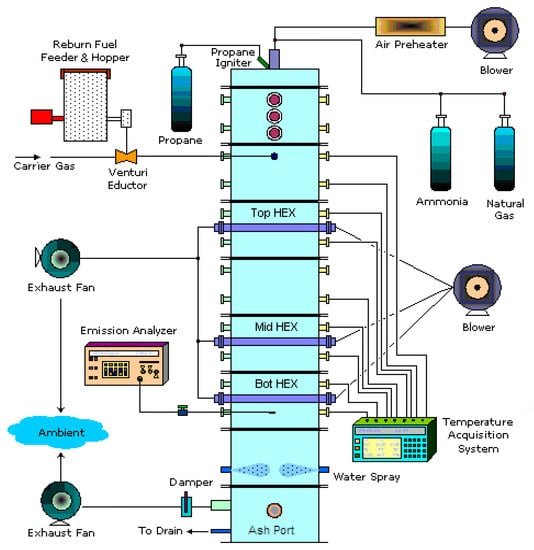
Figure 2.
A schematic of a 30 kW (100,000 BTU/h) down-fired boiler burner facility.
The MF (which is NG) and air were injected from the top into the primary combustion zone. The primary air was heated in an air pre-heater to 100 °C before entering the furnace. The pre-heat temperature was varied to better control the maximum furnace temperature. The NH3 was injected with NG from the top burner and converted to NOx during combustion to simulate the combustion gases emanating from the primary zone of an actual coal-fired furnace. The NH3 flow also allowed for the control of NOx levels before the reburn zone. A feeder and venturi system entrained the solid reburn fuel in air. The reburn fuel and air (about 20% of total air) were injected into the reburn combustion zone. The reburn fuel was injected into the burner either laterally (0°) or at a 45° upward counter-current. Figure 3 shows a schematic of the reburn injections apparatus. After the temperature in the reburn zone reached steady state conditions, the emission gas analyzer (GreenLine 8000) was used to determine concentrations of NOx, O2, CO, CO2, SO2, and combustibles (CxHy) at the measurement ports. Electrochemical sensors were used to measure 0~25% O2, 0~8000 ppm CO, 0~4000 ppm NOx, 0~100 ppm NO2, and 0~4000 ppm SO2. Nondispersive infrared sensors (NDIR) were used to measure 0~15% CO, 0~20,000 ppm CxHy and 0~15% CO2.
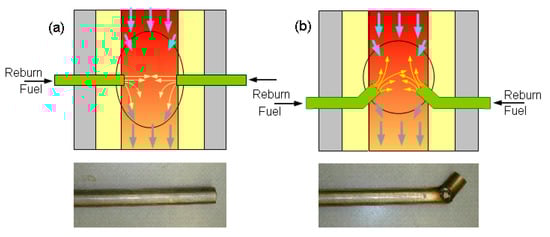
Figure 3.
Schematic of the reburn fuel injection: (a) lateral (0°) injection and (b) 45° injection.
The furnace was operated at a slightly negative pressure. The negative pressure ensured that no exhaust gases were emitted into the laboratory. It also ensured that all flames were maintained within the furnace. The vacuum was maintained with an exhaust fan and a damper on the exhaust line.
Three single-pass HEXs were fabricated and mounted in the boiler. The dimensions of HEX were 2.7 cm (1.06 in) O.D., 2.1 cm (0.83 in) I.D. and 15.24 cm (6 in) long. Three HEXs whose surfaces were cleaned and dried were laid perpendicular to the downward flow of hot flue gases. The HEXs were located below the reburn zone between 31 and 46 cm, between 92 and 107 cm, and between 122 and 137 cm. Air was used as the cold fluid in HEXs, and the air flow was 20 SCFH (standard cubic feet per hour) (157 cm3/s) based on standard ambient temperature and pressure (SATP). Ash samples were collected from the ash port at the bottom of the furnace for several cases to analyze the boiler performance. More details of the facility are explained in ref [].
2.3. Operational Conditions
The total heat input for each experiment was set to 30 kW. The primary combustion zone supplied 70% of the total heat (21 kW), and the reburn zone supplied 30% of the total heat (9 kW). The primary zone combustion conditions were maintained the same for each experiment. Recall that the natural gas (NG) is represented by UCF as CH3.84N0.0086O0.032. Ignoring conversion from fuel N to NO, the following overall oxidation reactions of NG without and NG and with NH3 are written as follows:
NG without NH3
where ϕPZ is equivalence ratio in primary zone.
Overall reaction of NG with NH3
where b is moles of NH3 injected per dry ash free mol of NG. If mass flow rate of fuel and NH3 are then b is given as
Since NO is in ppm, one may ignore (5b/4) in Equation (2). With known ϕ = 0.95, h = 3.84, o = 0.032, the stoichiometric O2 moles is 1.94 moles and mole ratio b is estimated to be 0.0043 mols of NH3 per mol of empirical fuel (or 4.4 g per kg of natural gas) at NO = 400 ppm and ϕPZ = 0.95 which can be estimated if XO2 in PZ is measured.
It should be noted that the main burner was always operated under lean conditions for the conversion of all NH3 to NO. The NH3 flow allowed the control of NO emissions in the reburn zone. Using the HHV of fuels (Table 1A), the fuel flow rates required for the primary and reburn combustion were calculated. With b = 0.0043 mols of NH3 per mol of NG and known flow rate of NG, required volume flow rate of NH3 was estimated.
The mass flow of the RF was adjusted for each RF due to the variation of HHV of RF, so that same thermal output by RF was kept constant. With the mass flow and the ultimate analysis of the fuel, the air requirements were calculated. The equivalence ratio in reburn zone (ERRBZ or (ϕ)) was varied by changing the amount of air injected with the reburn fuel. For the reburn zone, ϕ is generally kept at a level greater than one (fuel-rich). For the current studies, ϕPZ was maintained at 0.95 (fuel-lean) and ϕ was varied from 0.95 to 1.15. The vitiated air in the reburn fuel injector was simulated by diluting the O2 concentration with N2. Since the required O2 flow must be the same for desired ϕ in the reburn zone, the vitiation will increase the injection velocity because there is more mass flow through the reburn injectors. The base case was considered the case of WYC as a reburn fuel in the conditions of the non-vitiation and lateral (0°) reburn injection without HEXs. The operational conditions for TXLC as a reburn fuel are summarized in Table 4.
Table 4.
Operating conditions for TXLC as a reburn fuel. Natural gas (NG): CH4: 94.3%, CO2: 1.7%, C2H6: 2.4%, N2: 0.7%, C3H8: 0.5%. Unit carbon formula (UCF): CH3.84N0.0086O0.032, HHV: 37,055 kJ/m3 (53370 kJ/kg) [].
For the determination of the overall system uncertainty, possible error ranges of instruments and measurements were considered. Based on the flow fluctuations for the primary air, reburn motive air, reburn aspirated air, NH3, NG, and HEX air, the error ranges of each flow meter were determined to be less than ±1.0%. The dominant uncertainty was the large fluctuation of the data readings. Finally, the overall system uncertainty was determined to be in the range of ±3.0 to ±5.3% [,]. The repeatability was also estimated using LAPCFB and TXLC cases. The mean repeatability was found about 7.5% offset.
2.4. NOx Emission and Burnt Fraction Relations
The dilution effect of the reburn air is significant on the measurement of NOx emission in ppm, thus it should be accounted in further discussion. For the measurement of NOx emissions, the O2 concentration should be analyzed at the same point as NOx is analyzed and on the same basis (wet or dry). The representation of NOx emissions based on a 3% O2 concentration (i.e., reference O2) at the exhaust is suggested by EPA standards. The initial gas decomposition missions due to NG combustion and NH3 oxidation before the injection of the reburn air was: 405 ppm of NOx, 1.1% of O2 and 12.06% of CO2. The gas emissions measured after the reburn air injection were 252 to 262 ppm of NOx, 7.9 to 9.2% of O2 and 7.06 to 7.95% of CO2 for 0.95 < ERRBZ < 1.1. The addition of reburn gases with the primary gases will reduce the NOx by one third. Thus the (ppm) unit may not be suitable for the reburn application since a dilution effect by the reburn fuel and air can cause a lower reading of NOx emission in ppm. The dilution effect in NOx emission is eliminated once the NOx emission was measured on a heat basis (g/GJ). The NOx emission was 169 g/GJ (or 405 ppm) due to NG combustion, and if reburn air was added without reburn fuels, then the emission was measured in the range of 166 and 180 g/GJ (or 252 to 262 ppm) after the dilution. The 3% O2 correction by EPA also neutralized the dilution effect but it is more appropriate to fuel-lean condition when the reburn zone is fuel-rich. Therefore, the heat basis conversion eliminates the dilution effect and hence the results on a heat basis are used for the further discussion. The emissions of NOx and SO2 on a thermal heat rate basis are recommended and described as below [,]:
where NO is in ppm and x is mole fraction on dry basis, and the C-fr is carbon mass fraction in fuel. When NO is measured at exit of furnace, x is mole fraction in the exhaust and the ratio C-fr/HHV now corresponds to a blend of MF and RF fired into the reactor supplying 70% of energy from MF and 30% from RF.
When HHV is not available, the following method is adopted. Assuming HHVO2 is constant at 0.448 GJ/kmol O2 (0.193 MMBtu/lb mole of O2), refs. [,] present a relation between CO2 in tons per GJ and respiratory quotient (RQ) as CO2 in tons/GJ = 0.1 RQ where RQ = CO2 moles/stoichiometric O2 moles. The RQ values are known from fuel formula [,] and they are also tabulated in Table 1B. The RQ values of biomass fuels being higher than RQ of coal, the biomass releases more CO2 per GJ indicating more CO2 emission per GJ of energy released. Appendix A derives the relation between NOx in g/GJ, xCO2, NO in ppm and RQ (see Equation (A2)).
Note that Equation (7) presumes constant heating value per unit stoichiometric oxygen for all fuels and does not require a knowledge of heating values of MF or RF fuels but requires a knowledge of RQ values of fuels which can be readily estimated from ultimate analyses or chemical formula of fuels. For the main burner, RQ = 1/1.944 = 0.514. With 400 ppm (dry), xCO2 = 0.114 (dry) at ϕ = 0.95, Equation (7) yields NO at exit of main burner zone as 186 g/GJ. However, at exit of furnace the conditions change since 30% of energy release is from reburn fuel and 70% from main burner and hence RQ now corresponds to a blend of gases and estimated as RQBl = RQMF × 0.7+ RQRF × 0.3 (see []). Both Equations (5) and (7) presume that all CO produced due to rich mixture in reburn zone gets oxidized downstream which typically occurs under boiler conditions because of overfire air used in boilers. In case CO is present, xCO2 is replaced by xCO2 + xCO. The 30 kW facility is a small-scale facility without overfire air.
When NO is about 100 ppm, Equation (5) yields 40 g/GJ while RQ method yields 37 g/GJ. The later method is simple when UCF for MF and RF are known and RQ for blend is tabulated. Unless otherwise stated most calculations were performed using Equation (5) or using HHV method.
It is noted that C mass fraction and HHV for the NO analysis at exit of furnace are the combination values of those in the primary and reburn fuels. In addition, note that a molecular weight of 46.01 is used for NOx since all NO is eventually converted into NO2 in the atmosphere.
Burnt fraction (BF) is defined as the ratio of combustibles burnt to combustibles in. Using ash tracer method,
where A0 denotes the initial ash fraction on a dry basis and A represents the ash fraction in a dry sample after combustion.
3. Results and Discussion
Temperature profiles are presented first followed by reburn results. Several reburn fuels were evaluated for the NOx control at various equivalence ratios (ϕ) in the conditions of the non-vitiation and lateral (0°) reburn injection without HEXs.
3.1. Temperature Profile of the Reactor
The temperature profile shown in Figure 4 is important because the reaction rates for the NOx reduction reactions are overly sensitive to temperature. The temperature of the reburn zone was monitored and kept below 1600 K to prevent the high production of thermal NOx. The axial temperatures for the 45° injection angle linearly decreased along the reactor as shown in Figure 4a, which also shows that temperatures with FB combustion as RF were higher than those of coals as RF due to higher volatile matter which burns readily. Figure 4b shows the temperatures for the experiments with HEXs were lower than the temperatures for the cases without HEXs. The temperatures for the vitiated cases also were slightly lower than the temperatures for the non-vitiated cases (not shown). This lower temperature was expected for the vitiated case since additional heat was required to increase the temperature of the added nitrogen. There is a steeper drop in temperature at the reburn zone for the lateral (0°) injection as compared to the 45° upward injection. This may suggest that for the 45° upward injection, combustion occurs more rapidly and gives rise to hotter temperatures just after the reburn zone.
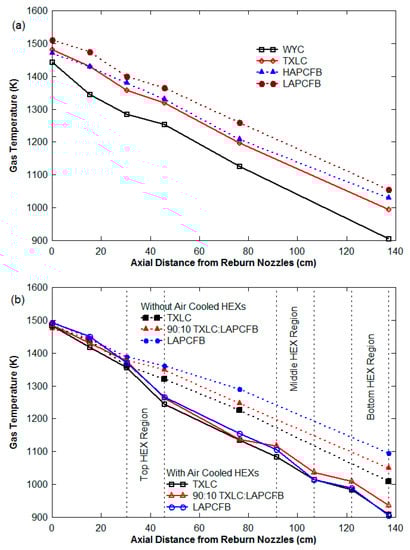
Figure 4.
Temperature distributions of the flue gas along the axial distance from the reburn nozzle: (a) 45° upward counter-current reburn injection and (b) lateral (0°) reburn injection with and without HEXs.
3.2. Effects of Reburn Fuels and Equivalence Ratios (ER)
Figure 5 shows the results for NOx using pure fuels as reburn fuels while Figure 6 shows NOx results using blended fuels as reburn fuels. Figure 5a and Figure 6a show that the NOx emissions (g/GJ from Equation (5), and lb/MMBtu from Equation (8)) decreased with an increase of the ER of reburn zone. With increased ER, the oxygen in the combustion zone is depleted quickly. Low concentration of oxygen slows down the NOx formation and allows the NOx reduction to be dominant in the reburn zone.
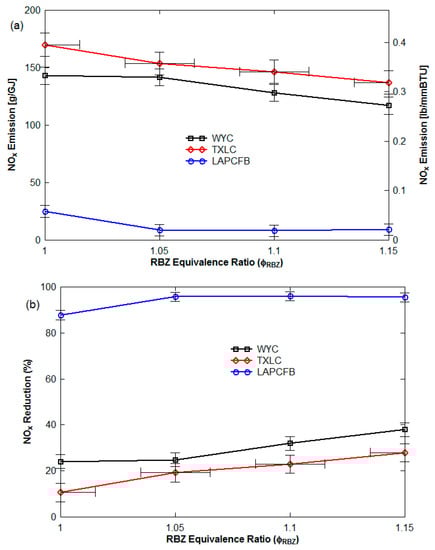
Figure 5.
NOx control with pure reburn fuels (non-vitiation and lateral (0°) reburn injection without HEXs) with the baseline NOx emissions of 400~420 ppm (186~204 g/GJ): (a) NOx emission in g/GJ and lb/MMBtu from Equation (8) and (b) NOx reduction on heat basis.
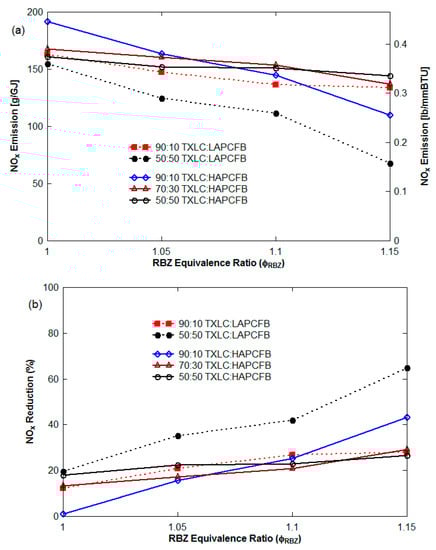
Figure 6.
NOx control with blended reburn fuels (non-vitiation and lateral (0°) reburn injection without HEXs) with the baseline NOx emissions of 400~420 ppm (186~204 g/GJ): (a) NOx emission in g/GJ, from Equation (5) and lb/MMBtu from Equation (8) and (b) NOx reduction on heat basis.
Figure 5b and Figure 6b show the NOx reduction (%) (=100 × {[NO] − [NO]initial}/[NO]initial). The range of the NOx reductions was found to be 88 to 96% for LAPCFB, 24 to 38% for WYC and 11 to 28% for TXLC. For the blended fuels, it was found to be 12 to 30% (90:10 TXLC:LAPCFB), 19 to 65% (50:50 TXLC:LAPCFB), 1 to 43% (90:10 TXLC:HAPCFB), 13 to 29% (70:30 TXLC:HAPCFB), and 18 to 26% (50:50 TXLC:HAPCFB). The pure HAPCFB was not attempted since the ash content was too high which leads to clogging of the burner. The results showed that LAPCFB is very effective in the reduction of NOx emission. NOx reduction increased with an increase of the LAPCFB proportion in the blends since more NH3 might have been available from LAPCFB. The volatile matter (VM) contributed almost 70% of heat for FB while VM in coals contribute only 40%.
Since HHV per unit stoichiometric oxygen is roughly constant for most fuels, the higher heat contribution by VM in FB indicates higher consumption of oxygen, depleting the local O2 concentration. The reduced O2 aids in the reduction of NOx as validated by data from Tillman et. al. [] on co-firing of coal with low nitrogen agricultural biomass. Lawrence et al. indicated that the reduction in NOx reduction (measured trend line) was greater than expected values based on reduced fuel N of agricultural biomass [].
The LAPCFB contains very fine particles for combustibles. The smaller particles would heat faster and release volatiles faster. Particles smaller than 75 μm (200-mesh screen) were 43% for LAPCFB as shown in Figure 1. From the fuel nitrogen, NH3 was produced and reacted with NOx to reduce the NOx level. Better NOx reduction was achieved with TXLC:LAPCFB blends as compared to TXLC:HAPCFB blends. However, the results of TXLC:HAPCFB blends do not show as much improvement as those of TXLC:LAPCFB blends. On a DAF basis, the ultimate analysis of the two fuels was essentially the same. It leads one to consider what catalytic effect the ash may have on NOx reduction. See Ref. [] for catalytic effects of TiO2 and Fe and ash analyses in Table 2. The large portions of very small particles in HAPCFB were primarily ash and combustibles made up larger particles. This may have retarded the release of the volatiles due to longer heating times and thus slowed down the oxidation of the volatiles. The combustion temperature of HAPCFB was also lower than that of LAPCFB as shown in Figure 4a. These lower temperatures could have affected the rate of NOx reduction and caused less NOx to be reduced. Since LAPCFB, TXLC and WYC contained low ash contents, most of the small particles may be combustibles, especially in LAPCFB. In this case, LAPCFB contained the largest portion of small combustible particles and fuel nitrogen, and thus the NOx reduction for the pure LAPCFB was found to be the highest among the reburn fuels.
The LAPCFB contains very fine particles for combustibles. The smaller particles would heat faster and release volatiles faster. Particles smaller than 75 μm (200-mesh screen) were 43% for LAPCFB as shown in Figure 1. From the fuel nitrogen, NH3 was produced and reacted with NOx to reduce the NOx level. Better NOx reduction was achieved with TXLC:LAPCFB blends as compared to TXLC:HAPCFB blends. However, the results of TXLC:HAPCFB blends do not show as much improvement as those of TXLC:LAPCFB blends. On a DAF basis, the ultimate analysis of the two fuels was essentially the same. It leads one to consider what catalytic effect the ash may have on NOx reduction. The large portions of very small particles in HAPCFB were primarily ash and combustibles made up larger particles. This may have retarded the release of the volatiles due to longer heating times and thus slowed down the oxidation of the volatiles. The combustion temperature of HAPCFB was also lower than that of LAPCFB as shown in Figure 4a. These lower temperatures could have affected the rate of NOx reduction and caused less NOx to be reduced. Since LAPCFB, TXLC and WYC contained low ash contents, most of the small particles may be combustibles, especially in LAPCFB. In this case, LAPCFB contained the largest portion of small combustible particles and fuel nitrogen, and thus the NOx reduction for the pure LAPCFB was found to be the highest among the reburn fuels.
Figure 7 presents NOx emission (g/GJ) as a function of the blending portion of FB in the blend with ϕ as parameter for the non-vitiation and 45° upward reburn injection without HEXs. See Figure 8 for NOx emission with blended reburn fuels without HEXs for lateral and 45° reburn injection.The NOx emission decreased with an increase of the blending portion of LAPCFB in reburn fuels. Increased FB% results in more volatile release and hence reduction in O2% in RBZ. Furthermore, NH3 is released from urea in FB which reacts with NO, reducing NOx to N2. The results also showed that the blends of TXLC:LAPCFB reduced more NOx emission than the blends of TXLC:HAPCFB since a high amount of ash slows down the release of volatile matter and N compounds.
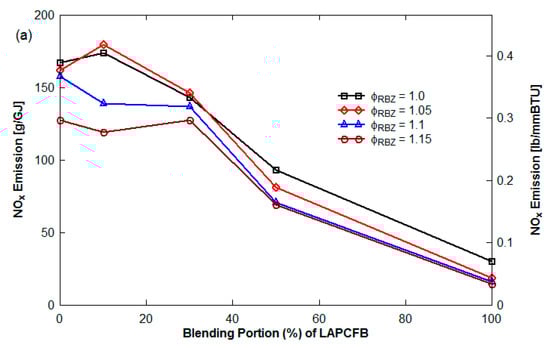
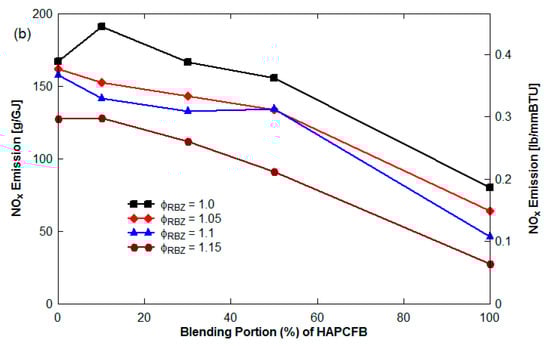
Figure 7.
NOx emission as a function of the blending portion of FB (non-vitiation and 45° reburn injection without HEXs): (a) LAPCFB and (b) HAPCFB.
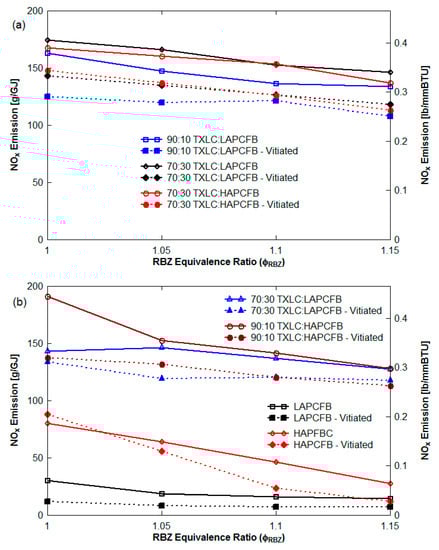
Figure 8.
NOx emission with blended reburn fuels without HEXs: (a) lateral (0°) reburn injection and (b) 45° reburn injection.
3.3. Effects of Vitiated Reburn Air
The experiments herein attempted to simulate exhaust gas recirculation by injecting N2 with motive air. The use of vitiation gas lowers the O2 concentration from 20.9% to 12.5%. Sometimes the extent of the decrease was larger in non-vitiation cases than in vitiation cases (Figure 9a) since the vitiation increased the injection velocity of the gas stream and reduced the residence time. When the reduction of all vitiated cases shown in Figure 8a are considered, up to 21% greater NOx reductions were caused by the vitiated air for the lateral (0°) injection. Thus, competing effects of (a) NOx reduction with reduction of O2 concentration but (b) reduced residence time in RBZ which results in lesser time for NH3 to react with NO, were present.
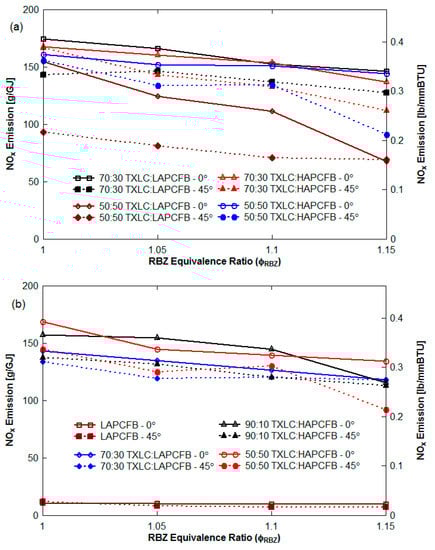
Figure 9.
NOx emission of the cases without HEXs: (a) non-vitiation cases and (b) vitiation cases.
3.4. Effects of Reburn Injection Angle
Lateral (0°) and 45° reburn injections were tested for the NOx reduction for the cases without HEXs. Reburn fuel with or without vitiated air was horizontally injected into the reactor by the 0° injection nozzles and they were injected 45° upward by the 45° injection nozzles. Results are shown in Figure 7 and Figure 8b. For the 45° upward injection, 8 to 29% higher NOx reductions were found for vitiated case for both 70:30 and 90:10 blends, and up to 12% more NOx reduction was found for both LAPCFB and HAPCFB. From these results, the vitiated air shows a significant effect on the NOx reduction, and the 45° injection shows better NOx reductions.
The 45° upward counter-current injection of the down-fired boiler provides more mixing time, residence time and reaction time. Better mixing causes the fuel to combust faster and thus reduces the oxygen levels. The reduced oxygen levels for the vitiated case inhibit the NOx formation mechanisms. The mixing time of the hot flue gas in the reactor was estimated using N2 from the reburn port and air from the primary port. When a linear mixing model was used with a mixing length of 30.48 cm (12 in), the mixing time for the 0° injection was 0.32 s. The residence time for the 0° injection was also estimated between 0.55 to 0.75 s depending on the reburn fuel and reactor temperature. The results of several non-vitiation and vitiation cases for several reburn fuels are presented in Figure 8a,b and also in Figure 9a,b with injection angle as parameter. By switching the reburn injector angle from 0° to 45° for non-vitiation cases as shown in Figure 9a, the NOx emissions decreased by as much as 62 g/GJ (or 21% greater reduction). For the use of the vitiated gas in Figure 9b, the NOx emissions decreased by as much as 42 g/GJ (or 32% more reduction) by using the 45° upward reburn nozzles. Therefore, the 45° reburn injection is more effective in achieving NOx reduction.
3.5. Effects of Heat Exchanger (HEX)
To investigate the fouling potential of ash in FB, air cooled HEXs were installed along the furnace axis. The regimes near heat exchangers (HEXs) create low temperature zones and as such can affect NOx emissions. Hence, the effect of HEXs on NOx emissions was examined with and without three single-passed air HEXs in the coal-fired boiler in the conditions of the non-vitiation and lateral (0°) reburn injection, and the operating conditions were almost identical. The results on the ash fouling were reported elsewhere [] and are briefly summarized here: (1) The growth of the layer of ash depositions over longer periods typically lowers overall heat transfer coefficient (OHTC), (2) lesser combustible % with higher FB% in the fuels indicate better performance since small particles in FB burned faster and the FB has higher volatile matter promoting more burn out, and (3) ash fouling is ranked as LAPCFB (severe) > 70:30 TXLC:LAPCFB > 90:10TXLC:LAPCFB > TXLC (low). However, the presence of the air cooled HEXs altered temperature distribution in the furnace along with deposition of ash and unburnt solids on the tubes and hence may affect NOx emissions. The effect of HEXs on NOx emission are typically described by the following relations [,]:
4NH3 + 4NO + O2 → 4N2 + 6H2O (fast), NO destruction, 1145 K (1600 F) -1480 K (2200 F)
4NH3 + 5O2 → 4NO + 6H2O (slow), oxidation of NH3, T > 1480 K (2200 F)
The distributions of the gas temperature for the cases with and without HEXs are shown in Figure 4b. Due to the heat transfer to HEXs, the local gas temperature near the HEXs drops faster than the others. The temperature drop was between 30 and 55 K for the cases without HEXs while it was between 70 and 110 K for the HEX cases. The use of HEXs resulted in significant reduction in the NOx as shown in Figure 10. It is found that NOx emissions for the cases with HEXs are lower than those for the cases without HEXs. For example, at the ER of 1.1 in Figure 10a, about 128 to 147 g/GJ of NOx emission was found for the cases without HEXs depending on reburn fuels while about 39 to 91 g/GJ of NOx emission was found for the HEX cases. For the NOx reduction at the ER of 1.1 shown in Figure 10b, about 23 to 32% was achieved for the cases without HEXs while about 47 to 78% reduction was obtained for the HEX cases.
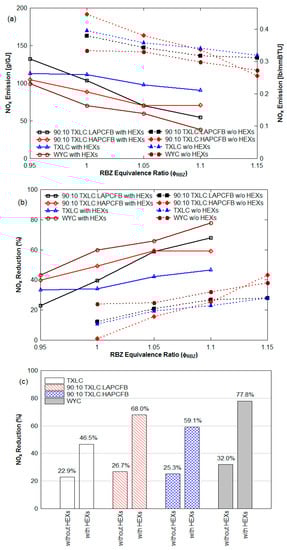
Figure 10.
Comparison results of the cases with HEXs and without HEXs (non-vitiation and lateral (0°) reburn injection): (a) NOx emission in g/GJ, from Equation (5) and lb/MMBtu from Equation (8), (b) NOx reduction (%), and (c) result comparison at ERRBZ of 1.1.
The effect of the gas temperatures and deposited solids on tubes can be the reasons for these results. Further soot may be deposited on HEXs and NOx is known to react with C (or soot), producing CO and H2. Another cause may be the catalytic effect of the deposition of fly ash on HEXs. The fly ash in power plants can be used as a catalyst in selective catalytic reduction (SCR) systems for NOx and SOx reductions since it contains high silica and alumina contents []. During reburning, the injection of metal-containing compounds (Fe-, Na-, K-, and Ca-) with the primary fuel was effective on NOx reduction, and the use of fly ash including metallic oxides (Fe2O3, Na2O, K2O, and CaO) were also somewhat effective on NOx reduction []. In the current study, the catalytic effect of the fly ash produced from FB combustion was stronger than that of the fly ash produced from TXLC combustion. Figure 10c shows a comparison of results with and without HEXs at ER of 1.1. A 24% NOx reduction was increased for TXLC in the presence of HEXs, while increase in NOx reduction were about 41% for 90:10 TXLC:LAPCFB, 34% for 90:10 TXLC:HAPCFB, and 46% for WYC. The burnt fractions of the blended fuels computed from Equation (12) were higher than the burnt fraction of TXLC (see Section 3.6), and hence the amounts of ash produced from the blended fuels were higher, indicating more metallic oxides were available during the combustion period. In addition, a layer of ash depositions was formed on the surface of the HEX. The fuel particles on the surface kept burning during the combustion and finally became pure ash, thus even more metallic oxides in the ash were available for the cases in the presence of HEXs.
3.6. Effects of Blend Ratio on Burnt Fraction
The burnt fraction is defined as the ratio of combustibles burnt to the initial combustible mass. Ash samples were collected from the surfaces of HEXs and from the ash port at the furnace bottom in the conditions of the non-vitiation and lateral (0°) reburn injection with HEXs. The results indicated that 100% burnt fraction were detected for the samples from all HEX surfaces since the fuel particles on the surface kept burning during the combustion. The burnt fraction obtained from the bottom ash (Equation (12)), shown in Figure 11, is somewhat low due to that the bottom ash is mostly the heavy ash. The lighter fly ash in the gas stream flowed into the exhaust duct, and only heavy solid particles dropped into the water in the ash port. It was found that the burnt fraction increased with the increase of the proportion of FB in reburn fuels, and the LAPCFB showed the highest burnt fraction. This is because FB has a large amount of the volatile matter (almost 80% on a DAF basis) and also its particle sizes are smaller compared to TXLC. For the accurate burnt fraction estimation, both lighter fly ash and heavier bottom ash should be analyzed together.
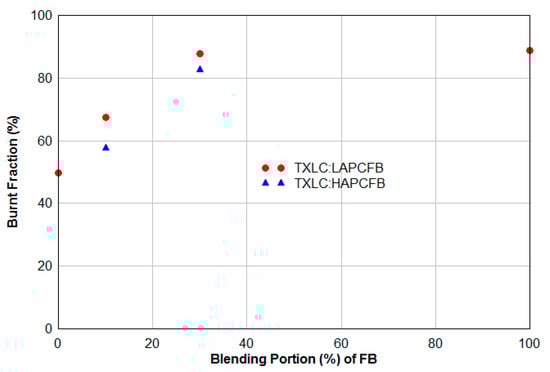
Figure 11.
Burnt fraction obtained from the bottom ash (non-vitiation and lateral (0°) reburn injection with HEXs).
3.7. Emissions of Other Gas Components
Emissions of several other gases are summarized for the conditions of non-vitiation and lateral (0°) reburn injection with HEXs. During the reburn combustion with FB, the fuel-rich environmental conditions are present in the reactor and hence higher CO emissions are expected. In Figure 12a, CO emissions are increased as function of the ER since it becomes more fuel-rich combustion. The LAPCFB emitted the highest CO concentrations which decreased with an increase of the TXLC proportion in reburn fuels. As expected, the level of CO was lowest for the TXLC. In Figure 12b, CO2 emission tendency showed the opposite trend to that of CO emission. Thus, boiler-firing the LAPCFB emitted the lowest CO2%. It is also noted that the N2 addition for the vitiation cases diluted the level of CO2, thus the CO2 concentrations for non-vitiation cases were higher.
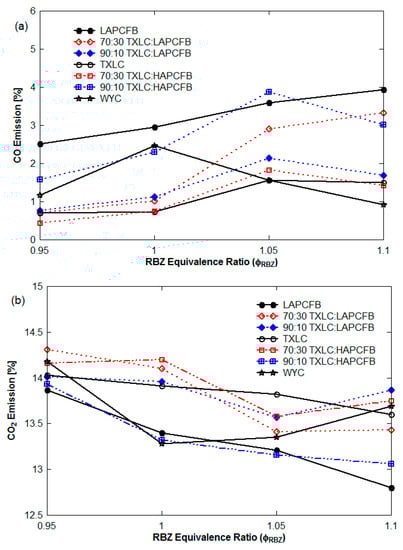
Figure 12.
CO and CO2 emissions (non-vitiation and lateral (0°) reburn injection with HEXs): (a) CO emission and (b) CO2 emission.
In Figure 13, the concentrations of unburned hydrocarbons (CxHy) and SO2 seemed to increase with the increase of ER. CxHy is typically burned to CO2 or water with enough oxygen. When the ER increases, the depletion of O2 causes less combustion of CxHy and produces less CO2 and water. In Figure 13a, the combustion of the LAPCFB produces much more CxHy than the other reburn fuels. In Figure 13b, the measurement of SO2 was interfered by the water condensation in the probe of the gas analyzer, thus SO2 concentration was unstable. The SO2 is more soluble in cold water. Thus, with the increasing ER, less water was produced from CxHy, hence a higher level of SO2 was presented.
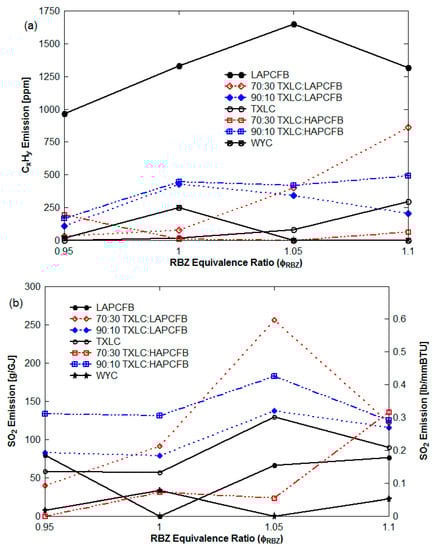
Figure 13.
CxHy and SO2 emissions (non-vitiation and lateral (0°) reburn injection with HEXs): (a) CxHy emission and (b) SO2 emission.
4. Summary and Conclusions
Cattle Feedlot Biomass (FB) was tested as reburn fuel for the emission control of NOx using a bench-scale (30 kW) Boiler Burner Research Facility at TAMU. The effects of reburn fuel type, equivalence ratio, heat exchanger, degree of vitiation in reburn air, and reburn injection angle were studied on NOx reduction. The optimum conditions for maximum NOx reduction were obtained.
- With increased ERRBZ, the NOx reduction % was increased.
- NOx reduction increased with an increase of the heat input % by LAPCFB with almost 96% reduction for the case of 30% of heat input by LAPCFB.
- The use of the vitiated reburn air (12.5% O2) resulted in up to 21% greater NOx reduction.
- The NOx emissions decreased to 62 g/GJ (or 21% greater reduction) by using the 45° upward counter-current reburn injection mode.
- The use of HEXs increased NOx reduction by about 23 to 46%.
- Burnt fraction from the combustion solid fuels increased with the increase of the proportion of FB in the reburn fuels.
- The optimum operating conditions for FB reburning were found to be conditions with vitiation, ERRBZ = 1.1, 45° upward counter-current injection and the presence of HEXs.
While CB appears to be a potential reburn fuel for NOx reduction in coal-fired systems, the effects of P on the corrosion of heat exchangers and effects of increased Cl content on possible Hg capture by Cl compounds must be investigated.
5. Patents
As a result of initial results from co-firing and reburn experiments with cattle biomass (CB) as co-fired and reburned for reduction of NOx produced from combustion of N containing main burner fuels such as coal, Annamalai, K. and Sweeten, B. obtained US patent on, “Reburn System with Feedlot Biomass” US Patent #6,973,883, 2005, May 2007, 2005. Available online: http://www.patentstorm.us/patents/6973883-fulltext.html, accessed on 14 November 2021.
Author Contributions
K.A.: Funding Acquisition, Combustion Project Administration, Conceptualization, Methodology, Combustion of Fuels, Design of Experiments, Software for NOx, Formal Analysis, Discussion; J.M.S.: Fuel Project Administration, Fuels Supply, Preparation and Characteristics, English Editing; H.O.: Methodology, Experiments and Generation of Results, Formal Analysis, Acquisition and Analysis, or Interpretation of Data, Writing—Original Draft Preparation; P.G.G.: Experiments and Generation of a Part of Results, Acquisition of Data. B.T.: Formal analysis and Investigation. All authors have read and agreed to the published version of the manuscript.
Funding
This work was supported in part by the U.S. Department of Energy (Pittsburgh Energy Technology Center, DOE-FG26-00NT40810 and Golden Field Office, DOE-FG26-05GO85003, DOE-FG26-05GO85003), and the Texas Commission on Environmental Quality (TCEQ Grant #582-5-65591 0015).
Data Availability Statement
Partly based on PhD Thesis of Hyukjin Oh.
Acknowledgments
This work was supported in part by the U.S. Department of Energy (Pittsburgh Energy Technology Center DOE-FG26-00NT40810 and Golden Field Office; DOE-FG26-05GO85003 USDA 93-36200-8701) and the Texas Commission on Environmental Quality, TCEQ Grant #582-5-65591 0015. The authors wish to thank Jerald Caton, Mechanical Engineering, Texas A&M for many fruitful discussions on NO formation and destruction.
Conflicts of Interest
The authors declare no conflict of interest.
Abbreviations
| AgB: | Agricultural biomass |
| AnB: | Animal waste based biomass |
| As Rec.: | As received |
| CB: | Cattle biomass (or cattle manure) |
| CFR-Bl: | Carbon mass fraction in blend |
| CFR, DAF: | Carbon mass fraction in dry ash free fuel |
| DAF: | Dry ash free |
| DB: | Dairy Biomass |
| EF: | Energy fraction |
| ER: | Equivalence ratio or ϕ |
| FB: | Feedlot Biomass |
| HADB: | High Ash Dairy Biomass |
| HAFB: | High Ash Feedlot Biomass |
| HAPCFB: | High Ash Partially Composted Feedlot Biomass |
| HEX: | Heat exchanger |
| HHV: | Higher heating value |
| LADB: | Low Ash Dairy Biomass |
| LAFB: | Low Ash Feedlot Biomass |
| LAPCFB: | Low Ash Partially Composted Feedlot Biomass |
| LB: | Litter (chicken) biomass |
| MF: | Main fuel |
| NG: | Natural gas |
| PZ: | Primary zone |
| RBZ: | Reburn zone |
| RF: | Reburn fuel |
| RQ: | Respiratory quotient, mole ratio of CO2/O2 stoich |
| SATP: | Standard ambient temperature and pressure |
| SCFH: | Standard cubic feet per hour |
| SCR: | Selective catalytic reduction |
| SMD: | Sauter mean diameter |
| TAMU: | Texas A&M University |
| TXLC: | Texas Lignite Coal |
| UCF: | Unit carbon formula, normalized with C atoms in fuel |
| WYC: | Wyoming Sub-bituminous Coal |
Appendix A. NO Emission in g/GJ in Terms of NO in ppm
Appendix A.1. Relation in Terms of RQ
The NO in moles is given as [NO in ppm] × 10−6 × Nprod and NOx in g is given as 46.01 × [NO in ppm] × 10−6 × Nprod During this process NO2 moles are consumed which releases HHVO2 (GJ/mole) × NO2. Thus, NOx in g/GJ is given as
where RQ is called respiratory quotient, RQ = CO2 moles/O2 moles consumed [,]. RQ is known from chemical formulae of fuel or from ultimate analyses. Assuming HHVO2 as 0.448 GJ/kmol O2 (0.193 MMBtu/lb mole of O2)
With HHVO2 as 0.193 MMBtu/lb mole of O2
Appendix A.2. Relation When Fuel Is Blends (Main Fuel, MF + Reburn Fuel, RF)
The term in Equation (5) needs to be replaced as for the blends of RF and MF. When energy fraction provided by RF is EFRF (=Energy from RF/Total energy), then mass ratio of RF to MF is given as
The HHV of blend is given as
and carbon fraction of blend (C-fr Bl) is given as
and the ratio is given as
(See results in Table 1B for 70:30 (MF:RF) blends.)
Appendix A.3. Relation in Terms of RQ for Blends (Main Fuel, MF + Reburn Fuel, RF)
The RQ for blends is given as RQBl = RQMF × EFMF+ RQRF × EFRF (see Ref. []). The NO in moles is given as [NO in ppm] ×10−6 × NDry prod and NOx in g is given as 46.01 × [NO in ppm] × 10−6 × Nprod. During this process NO2 moles are consumed which releases HHVO2 (GJ/mole) × NO2. Thus, NOx in g/GJ is given as
References
- Sweeten, J.M.; Composting Manure and Sludge. Texas Agricultural Extension Servicex, E-479. 8 July 2008. Available online: https://hdl.handle.net/1969.1/87650 (accessed on 14 November 2021).
- Adams, B.R.; Harding, N.S. Reburning using Biomass for NOx Control. Fuel Process. Technol. 1998, 54, 249–263. [Google Scholar] [CrossRef]
- Patumsawad, S.; Cliffe, K.R. Experimental Study on Fluidized Bed Combustion of High Moisture Municipal Solid Waste. Energy Convers. Manag. 2020, 43, 2329–2340. [Google Scholar] [CrossRef]
- Savolainen, K. Co-Firing of Biomass in Coal-Fired Utility Boilers. Appl. Energy 2003, 74, 369–381. [Google Scholar] [CrossRef]
- Spliethoff, H.; Hein, K.R.G. Effect of Co-Combustion of Biomass on Emissions in Pulverized Fuel Furnaces. Fuel Process. Technol. 1998, 54, 189–205. [Google Scholar] [CrossRef]
- Thien, B.; Annamalai, K. Reduction of NO through Reburning with Coal and Feedlot Biomassx. In Proceedings of the National Combustion Conference, Oakland, CA, USA, 25–27 March 2001. [Google Scholar]
- Annamalai, K.; Thien, B.; Sweeten, B. Co-Firing of Coal and Cattle Feedlot Biomass (FB) Part II. Performance Results from 30 kW (100,000) BTU/h Laboratory Scale Boiler Burner. Fuel 2003, 82, 1183–1193. [Google Scholar] [CrossRef]
- Sweeten, J.M.; Annamalai, K.; Thien, B.; McDonald, L.A. Co-Firing of Coal and Cattle Feedlot Biomass (FB) Part I. Feedlot Biomass (Cattle Manure) Fuel Quality and Characteristics. Fuel 2003, 82, 1167–1182. [Google Scholar] [CrossRef]
- Johnson, D.K.; Engelhardt, D.A.; Harvilla, J. Clean Coal Technology—Reburning Technologies for the Control of Nitrogen Oxides Emissions from Coal-Fired Boilers; U.S. Department of Energy: Washington, DC, USA, 1999; Topical Report Number 14. Available online: www.fossil.energy.gov/programs/powersystems/publications/Clean_Coal_Topical_Reports/ (accessed on 14 November 2021).
- Energy Information Administration. International Energy Outlook. 2006. Available online: http://www.eia.doe.gov/oiaf/ieo/electricity.html (accessed on 14 November 2021).
- Thien, B.; Annamalai, K.; Sweeten, J.M. Co-Firing Feedlot and Litter Biomass: Coal Blends in a Laboratory Scale Boiler Burner. In Proceedings of the ASME 2002 International Mechanical Engineering Congress and Exposition, New Orleans, LA, USA, 17–22 November 2002; pp. 301–304. [Google Scholar] [CrossRef]
- Priyadarsan, S.; Annamalai, K.; Sweeten, J.M.; Mukhtar, S.; Holtzapple, M.T. Fixed Bed Gasification of Feedlot and Poultry Litter Biomass. Trans. ASAE 2005, 47, 1689–1696. [Google Scholar] [CrossRef]
- Qian, X.; Lee, S.; Chandrasekaran, R.; Yang, Y.; Caballes, M.; Alamu, O.; Chen, G. Electricity Evaluation and Emission Characteristics of Poultry Litter CoCombustion Process. Appl. Sci. 2019, 9, 4116. [Google Scholar] [CrossRef] [Green Version]
- Thien, B.T.; Lawrence, B.D.; Annamalai, K.; Sweeten, J.M. Co-firing Coal: Poultry Litter Biomass Blends in a Laboratory Scale Boiler-Burner. Trans. ASABE 2012, 55, 681–688. [Google Scholar] [CrossRef]
- Junga, R.; Knauer, W.; Niemiec, P.; Tańczuk, M. Experimental tests of co-combustion of laying hens manure with coal by using thermogravimetric analysis. Renew. Energy 2017, 111, 245–255. [Google Scholar] [CrossRef]
- Freeman, M.; Annamalai, K.; Sweeten, J. NOx Reduction with Feedlot Biomass as a Reburn Fuel in a 150 kW Pilot Scale Boiler Burner Facility. In Proceedings of the ASME Alternative Power—Agricultural Biomass Fuels and Renewables, Electric Power Conference, Houston, TX, USA, 4–6 March 2003. [Google Scholar]
- Annamalai, K.; Sweeten, J.M.; Freeman, M. Reburn Injection Systems and Methods Utilizing Biomass Fuels. U.S. Patent NETL-DOE, 1 May 2009. [Google Scholar]
- Annamalai, K.; Sweeten, B. Reburn System with Feedlot Biomass. U.S. Patent #6973883, 2005. Available online: http://www.patentstorm.us/patents/6973883-fulltext.html (accessed on 14 November 2021).
- Annamalai, K.; Sweeten, J.M.; Auvermann, B.W.; Mukhtar, S.; Caperada, S.; Engler, C.R.; Harman, W.; JN, R.; Deotte, R. Renewable Energy and Environmental Sustainability Using Biomass from Dairy and Beef Animal Production, Volumes I, II and III; Final Report, DE-FG36-05GO85003; U.S. Department of Energy-Go lden Field Office: Golden, CO, USA, 2012; Office of Scientific and Technical Information, Identifying Number: 1039414. Available online: www.osti.gov/servlets/purl/1039414/ (accessed on 14 November 2021).
- Mendiara, T.; Glarborg, P. Reburn Chemistry in Oxy-fuel Combustion of Methane. Energy Fuels 2009, 23, 3565–3572. [Google Scholar] [CrossRef]
- Kim, H.Y.; Baek, S.W. Experimental Study of Fuel-Lean Reburn System for NOx Reduction and CO Emission in Oxygen Enhanced Combustion. Int. J. Energy Res. 2011, 35, 710–720. [Google Scholar] [CrossRef]
- Sweeten, J.M.; Heflin, K.; Annamalai, K.; Auvermann, B.W.; Mc Collum, F.T.; Parke, D.B. Fuel Properties of Manure or Compost from Paved or Un-Paved Cattle Feedlots; Beef Cattle Research in Texas; Herring, A.D., Ed.; Department of Animal Science, Texas A&M Univeristy: College Station, TX, USA, 2006. [Google Scholar]
- Sweeten, J.M.; Heflin, K.; Annamalai, K.; Auvermann, B.W.; McCollum, F.T.; Parker, D.B. Combustion Fuel Properties of Manure of Compost from Paved vs. Un-paved Cattle Feedlots. In Proceedings of the 2006 ASABE (American Society of Agricultural & Biological Engineers) Annual Meeting, Portland, OR, USA, 9–12 July 2006; p. 064143. [Google Scholar]
- Annamalai, K.; Thanapal, S.; Ranjan, D. Ranking renewable and fossil fuels on global warming potential using respiratory quotient (RQ) Concept. J. Combust. 2018, 2018, 1270708. [Google Scholar] [CrossRef] [Green Version]
- Annamalai, K.; Puri, I.K. Combustion Science and Engineering; CRC Press/Taylor & Francis: Boca Raton, FL, USA, 2007. [Google Scholar]
- Oh, H. Reburning Renewable Biomass for Emissions Control and Ash Deposition Effects in Power Generation. Ph.D. Theis, Mechanical Engineering, Texas A&M University, College Station, TX, USA, 2008. [Google Scholar]
- Oh, H.; Annamalai, K.; Sweeten, J.M.R.; Heflin, K. Reburning Of Animal Waste Based Biomass With Coals For Nox Reduction, Part II: Dairy Biomass (DB) And Coa:DB Blends. Energies 2021. accepted. [Google Scholar]
- Kline, S.J.; McClintock, F.A. Describing Uncertainties in Single-Sample Experiments. Mech. Eng. 1953, 75, 3–8. [Google Scholar]
- Annamalai, K. Respiratory quotient (Rq), exhaust gas analyses, CO2 Emission and applications in automobile engineering. Adv. Automob. Eng. 2013, 2, 2–4. [Google Scholar] [CrossRef] [Green Version]
- Tillman, D.A. Cofiring Biomass with Coal: Issues for Technology Commercialization. In Proceedings of the 16th Annual Coal Conference, Pittsburgh, PA, USA, 11–15 October 1999; pp. 21–24. [Google Scholar]
- Lawrence, B.; Annamalai, K.; Sweeten, J.M.; Heflin, K. Cofiring Coal and Dairy Biomass in a 29 kWt Furnace. J. Appl. Energy 2009, 86, 2359–2372. [Google Scholar] [CrossRef]
- Xuan, X.; Yue, C.; Li, S.; Yao, Q. Selective Catalytic Reduction of NO by Ammonia with Fly Ash Catalyst. Fuel 2003, 82, 575–579. [Google Scholar] [CrossRef]
- Oh, H.; Annamalai, K.; Sweeten, J. Investigations of Ash Fouling with Cattle Wastes as Reburn Fuel in a Small Scale Boiler Burner under Transient Conditions. J. Air Waste Manag. Assoc. 2008, 58, 517–529. [Google Scholar] [CrossRef]
- Duo, W.; Dam-Johansen, K.; Østergaard, K. Kinetics of the gas-phase reaction between nitric oxide, ammonia, and oxygen. Can. J. Chem. Eng. 1992, 70, 1014–1020. [Google Scholar] [CrossRef]
- Wang, W.; Zhao, Z.; Liu, F.; Wang, S. Study of NO/NOx Removal from Flue Gas Contained Fly Ash and Water Vapor by Pulsed Corona Discharge. J. Electrost. 2005, 63, 155–164. [Google Scholar] [CrossRef]
- Lissianski, V.V.; Zamansky, V.M.; Maly, P.M. Effect of Metal-Containing Additives on NOx Reduction in Combustion and Reburning. Combust. Flame 2001, 125, 1118–1127. [Google Scholar] [CrossRef]
Publisher’s Note: MDPI stays neutral with regard to jurisdictional claims in published maps and institutional affiliations. |
© 2021 by the authors. Licensee MDPI, Basel, Switzerland. This article is an open access article distributed under the terms and conditions of the Creative Commons Attribution (CC BY) license (https://creativecommons.org/licenses/by/4.0/).