
Towards Big Data Electricity Theft Detection Based on Improved RUSBoost Classifiers in Smart Grid

 ,
,  ,
,  ,
,  ,
,  and
and
Abstract
:1. Introduction
- Outright theft, which is consummated by:
- Tapping an overhead line to make a new, unauthorized interconnection;
- Induction is a term that refers to the electromagnetic induction, which is used to collect energy from a power line without establishing physical contact to the line.
- Fraud, which is consummated by:
- By passing a meter, you can block it from calculating the amount of energy used;
- Changing the settings on a meter to give the consumer a more favorable reading. Mechanical and digital/smart metering methods are separated into this category.
- Billing Issues of Systematic non-payment of bills:
- Intentional and unintended billing irregularities (poor record keeping practices).
- Outright TheftWhen someone steals power when they are not already a recognized client of a utility, it is called outright theft. An electrical thief attempts to establish a new, unauthorized T & D system connectivity without the permission of the T & D system’s owner.
- (1)
- TappingTapping, which is making an unlawful association to lines buried or above ground on the distribution transformer’s line [7]. In current working, tapping can be used to connect a building or piece of instrument to the electric grid where there was previously no connection. Taping has been used in the United States as an E-theft strategy since at least the 1890s [8]. Tapping exposes both the culprit and innocent bystanders to the risk of electrocution and death as a result of this type of power theft [9,10,11].
- (2)
- Induction CouplingTo steal the electricity by placing a big coil under a high-voltage power line is one way that has gained media attention [12]. Inherently, such a technique is a sort of tapping via induction coupling. However, there are concerns with such schemes, aside from a few anecdotal accounts of electricity theft by induction coupling, e.g., [13,14,15]. Primarily, due to the massive amount of copper necessary to build a suitably big coil, a return on investment is often improbable [16]. Although induction coupling electricity theft is rare, induction power light bulbs have been found in creative installations where fluorescent tube lights are powered using induction [17].
- FraudElectricity theft is accomplished by taking measures to keep record of less consumption by electricity bill or tampering with the power utility’s metering equipment to make it record less (or none) utilization than was used.
- (1)
- Bypassing Existing MetersBypassing a meter is similar to tapping, however, it is performed by linking the house wiring directly to the wires entering around the meter into the meter wiring [8,18,19,20,21]. This type of the electricity theft can either totally disengage the meter from the system or pull off the meter linked to the system additionally to the bypass, allowing the meter to record some consumption, though less than the earlier. Another method of bypassing is to use another (spare) meter for part of the billing time duration to prevent recording complete use. It would be unproductive for a thief to tell a utility to turn off electricity to a premises during whatever technique he or she used to bypass a meter, as a result, all connections should be moulded to live wires. As a result, this kind of theft carries a high level of personal risk.
- (2)
- Meter TamperingElectric meter tampering has been a problem for almost a century, and it is known that by the late 1890s, designing meters to avoid tampering was a top priority, and it is still a problem today. Mechanical meters and digital/smart meters are the two types of meter tampering having great interest (which are not immune to tampering).
- A detailed review of different methods is provided in related work section;
- The solution of most relevant challenges are described in detail in proposed methodology;
- The proposed algorithm is validated by comparing with other models;
- The proposed model outperforms by achieving highest accuracy and minimizing electricity theft.
2. Related Work
3. Design
3.1. Model Overview
3.2. Classifiers and Techniques
4. Data Gathering
5. Results and Discussions
5.1. Simulation Environment
5.2. Simulation Results
6. Conclusions
Author Contributions
Funding
Acknowledgments
Conflicts of Interest
Abbreviations
| TLs | Technical Losses |
| NTLs | Non-Technical Losses |
| SM | Smart Grid |
| AMI | Advanced Metering Infrastructure |
| CNN | Convolutional Neural Network |
| MRFO | Manta Ray Foraging Optimization |
| BSA | Bird Swarm Algorithm |
References
- Depuru, S.S.S.R.; Wang, L.; Devabhaktuni, V. Electricity theft: Overview, issues, prevention and a smart meter based approach to control theft. Energy Policy 2011, 39, 1007–1015. [Google Scholar] [CrossRef]
- Ghulam, H.; Khan, I.; Jan, S.; Shah, I.A.; Khan, F.A.; Derhab, A. A novel hybrid load forecasting framework with intelligent feature engineering and optimization algorithm in smart grid. Applied Energy 2021, 299, 117178. [Google Scholar]
- Hafeez, G. Electrical Energy Consumption Forecasting for Efficient Energy Management in Smart Grid. Ph.D. Thesis, COMSATS University of Islamabad, Islamabad, Pakistan, 2021. [Google Scholar]
- Batra, S.G. A Comparative Study of Various Combinatorial Approaches for Minimization of Transmission and Distribution Losses. Ph.D. Thesis, Thapar University, Punjab, India, 2015. [Google Scholar]
- Guerrero, J.I.; León, C.; Monedero, I.; Biscarri, F.; Biscarri, J. Improving knowledge-based systems with statistical techniques, text mining, and neural networks for non-technical loss detection. Knowl.-Based Syst. 2014, 71, 376–388. [Google Scholar] [CrossRef]
- Smith, T.B. Electricity theft: A comparative analysis. Energy Policy 2004, 32, 2067–2076. [Google Scholar] [CrossRef]
- Bihl, T.J.; Hajjar, S. Electricity theft concerns within advanced energy technologies. In Proceedings of the 2017 IEEE National Aerospace and Electronics Conference (NAECON), Dayton, OH, USA, 27–30 June 2017; pp. 271–278. [Google Scholar]
- Hallberg, J.H. Theft of current: How to detect, prosecute and prevent II. Electr. World Eng. 1905, 45, 884–886. [Google Scholar]
- Suriyamongkol, D. Non-Technical Losses in Electrical Power Systems. Doctoral Dissertation, Ohio University, Athens, OH, USA, 2002. [Google Scholar]
- Taylor, A.J.; McGwin, G., Jr.; Brissie, R.M.; Rue, L.W., III; Davis, G.G. Death during theft from electric utilities. Am. J. Forensic Med. Pathol. 2003, 24, 173–176. [Google Scholar] [CrossRef]
- Kim, V. Father and Daughter Burned in Alleged Electrical Theft; Los Angeles Times: Los Angeles, CA, USA, 2011. [Google Scholar]
- Lopez, C.; Sargolzaei, A.; Santana, H.; Huerta, C. Smart Grid cyber security: An overview of threats and countermeasures. J. Energy Power Eng. 2015, 9, 632–647. [Google Scholar]
- Chrasekhar, A.; Vivekananthan, V.; Khelwal, G.; Kim, W.J.; Kim, S.J. Green energy from working surfaces: A contact electrification–enabled data theft protection and monitoring smart table. Mater. Today Energy 2020, 18, 100544. [Google Scholar] [CrossRef]
- Kumar, M.E.; Reddy, G.T.; Sudheer, K.; Reddy, M.P.K.; Kaluri, R.; Rajput, D.S.; Lakshmanna, K. Vehicle theft identification and intimation using gsm & iot. IOP Conf. Ser. Mater. Sci. Eng. 2017, 263, 042062. [Google Scholar]
- Bihl, T.J.; Hajjar, S. Electromagnetic Harvesters: Free Lunch or Theft; Industry Tap: Sheffield, UK, 2013; pp. 271–278. [Google Scholar]
- Deardorff, D.L. A Solution to the RWP for Exam 1-Stealing Power. Retrieved August 2006, 28, 2015. [Google Scholar]
- BBC. Floods in Drought-Hit Kenya Spark Aid. 2011. Available online: http://news.bbc.co.uk/2/hi/8441708.stm (accessed on 2 February 2021).
- Weslowski, J. Utilities launch assault to halt theft of power. Electr. Light Power 1976, 10, 54. [Google Scholar]
- Bihl, T.J.; Zobaa, A.F. Data-mining methods for electricity theft detection. In Big Data Analytics in Future Power Systems; CRC Press: Boca Raton, FL, USA, 2018; pp. 107–124. [Google Scholar]
- Somefun, T.E.; Awosope, C.O.A.; Chiagoro, A. Smart prepaid energy metering system to detect energy theft with facility for real time monitoring. Int. J. Electr. Comput. Eng. 2019, 9, 4184. [Google Scholar]
- Venkatesh, T.; Jain, T. Synchronized measurements-based wide-area static security assessment and classification of power systems using case based reasoning classifiers. Comput. Electr. Eng. 2018, 68, 513–525. [Google Scholar]
- Hodge, V.; Austin, J. A survey of outlier detection methodologies. Artif. Intell. Rev. 2004, 22, 85–126. [Google Scholar] [CrossRef]
- Christopher, A.V.; Swaminathan, G.; Subramanian, M.; Thangaraj, P. Distribution line monitoring system for the detection of power theft using power line communication. In Proceedings of the 2014 IEEE Conference on Energy Conversion (CENCON), Johor Bahru, Malaysia, 13–14 October 2014; pp. 55–60. [Google Scholar]
- Dangar, D.; Joshi, S.K. Electricity Theft Detection Techniques for Distribution System in GUVNL. Int. J. Res. Anal. Rev. 2014, 7, 513–524. [Google Scholar]
- Angelos, E.W.S.; Saavedra, O.R.; Cortés, O.A.C.; de Souza, A.N. Detection and identification of abnormalities in customer consumptions in power distribution systems. IEEE Trans. Power Deliv. 2011, 26, 2436–2442. [Google Scholar] [CrossRef]
- Jumale, P.; Khaire, A.; Jadhawar, H.; Awathare, S.; Mali, M. Survey: Electricity Theft Detection Technique. Int. J. Comput. Eng. Inf. Technol. 2016, 8, 30. [Google Scholar]
- Saxena, H.L.; Richariya, D.V. Intrusion Detection System using K-means, PSO with SVM Classifier: A Survey. Int. J. Emerg. Technol. Adv. Eng. 2014, 4, 653–657. [Google Scholar]
- Creedy, J. Interpreting inequality measures and changes in inequality. N. Z. Econ. Pap. 2016, 50, 177–192. [Google Scholar] [CrossRef]
- Nagi, J.; Yap, K.S.; Nagi, F.; Tiong, S.K.; Koh, S.P.; Ahmed, S.K. NTL detection of electricity theft and abnormalities for large power consumers in TNB Malaysia. In Proceedings of the 2010 IEEE Student Conference on Research and Development (SCOReD), Kuala Lumpur, Malaysia, 13–14 December 2010; pp. 202–206. [Google Scholar]
- El-Bhissy, K.; El-Faleet, F.; Ashour, W.M. Clustering Using Optimized Gaussian Kernel Function. Int. J. Artif. Intell. Appl. Smart Devices 2014, 2. [Google Scholar] [CrossRef]
- Socci, N.D.; Lee, D.D.; Seung, H.S. The Rectified Gaussian Distribution. In Proceedings of the 11th Annual Conference on Neural Information Processing Systems, Denver, CO, USA, 1–3 December 1998; pp. 350–356. [Google Scholar]
- Sahu, S.K.; Jena, S.K. A study of K-Means and C-Means clustering algorithms for intrusion detection product development. Int. J. Innov. Manag. Technol. 2014, 5, 206–213. [Google Scholar] [CrossRef]
- Singh, S.P.; Johri, P. A Review of Estimating Development Time and Efforts of Software Projects by Using Neural Network and Fuzzy. Int. J. Adv. Res. Comput. Sci. Softw. Eng. 2012, 2, 306–310. [Google Scholar]
- Rengarajan, S.; Loganathan, S. Power theft prevention and power quality improvement using fuzzy logic. Int. J. Electr. Electron. Eng. 2012, 1, 2231–5284. [Google Scholar] [CrossRef]
- Sahoo, S.; Nikovski, D.; Muso, T.; Tsuru, K. Electricity theft detection using smart meter data. In Proceedings of the 2015 IEEE Power & Energy Society Innovative Smart Grid Technologies Conference (ISGT), Washington, DC, USA, 18–20 February 2015; pp. 1–5. [Google Scholar]
- Memisevic, R.; Zach, C.; Pollefeys, M.; Hinton, G.E. Gated softmax classification. Adv. Neural Inf. Process. Syst. 2010, 23, 1603–1611. [Google Scholar]
- Nagi, J.; Yap, K.S.; Tiong, S.K.; Ahmed, S.K.; Mohammad, A.M. Detection of abnormalities and electricity theft using genetic support vector machines. In Proceedings of the TENCON 2008—2008 IEEE Region 10 Conference, Hyderabad, India, 19–21 November 2008; pp. 1–6. [Google Scholar]
- Jiang, R.; Lu, R.; Wang, Y.; Luo, J.; Shen, C.; Shen, X. Energy-theft detection issues for advanced metering infrastructure in smart grid. Tsinghua Sci. Technol. 2014, 19, 105–120. [Google Scholar] [CrossRef]
- McLaughlin, S.; Holbert, B.; Fawaz, A.; Berthier, R.; Zonouz, S. A multi-sensor energy theft detection framework for advanced metering infrastructures. IEEE J. Sel. Areas Commun. 2013, 31, 1319–1330. [Google Scholar] [CrossRef]
- Veillette, M. Process for Detecting Energy Theft. U.S. Patent No. 9,013,173, 20 April 2015. [Google Scholar]
- Lo, C.H.; Ansari, N. CONSUMER: A novel hybrid intrusion detection system for distribution networks in smart grid. IEEE Trans. Emerg. Top. Comput. 2013, 1, 33–44. [Google Scholar] [CrossRef]
- Cárdenas, A.A.; Amin, S.; Schwartz, G.; Dong, R.; Sastry, S. A game theory model for electricity theft detection and privacy-aware control in AMI systems. In Proceedings of the 2012 50th Annual Allerton Conference on Communication, Control, and Computing (Allerton), Monticello, IL, USA, 1–5 October 2012; pp. 1830–1837. [Google Scholar]
- Das, R. A comparison of multiple classification methods for diagnosis of Parkinson disease. Expert Syst. Appl. 2010, 37, 1568–1572. [Google Scholar] [CrossRef]
- Weiss, G.M. Mining with rarity: A unifying framework. ACM Sigkdd Explor. Newsl. 2004, 6, 7–19. [Google Scholar] [CrossRef]
- Seiffert, C.; Khoshgoftaar, T.M.; Van Hulse, J.; Napolitano, A. RUSBoost: Improving classification performance when training data is skewed. In Proceedings of the 2008 19th International Conference on Pattern Recognition, Tampa, FL, USA, 8–11 December 2008; pp. 1–4. [Google Scholar]
- Zhao, W.; Zhang, Z.; Wang, L. Manta ray foraging optimization: An effective bio-inspired optimizer for engineering applications. Eng. Appl. Artif. Intell. 2020, 87, 103300. [Google Scholar] [CrossRef]
- Meng, X.B.; Gao, X.Z.; Lu, L.; Liu, Y.; Zhang, H. A new bio-inspired optimisation algorithm: Bird Swarm Algorithm. J. Exp. Theor. Artif. Intell. 2016, 28, 673–687. [Google Scholar] [CrossRef]
- Uhl, X.M.; White, K. Sylvia Earle: Oceanographer and Conservationist; The Rosen Publishing Group, Inc.: New York, NY, USA, 2019. [Google Scholar]
- Helfman, G.; Burgess, G.H. Sharks: The Animal Answer Guide; JHU Press: Baltimore, MD, USA, 2014. [Google Scholar]


| Type of Attacks | Description |
|---|---|
| Cyber Attacks | Compare meters through remote network exploitModify the firmware/ Storage on metersSteal credentials to login to metersIntercept/alter communicationsFlood the NAN bandwidth |
| Physical Attacks | Break into meterReverse/disconnect the meterPhysically extract the passwordAbuse optical port to gain access to metersBypass meters to remove loads from measurements |
| Data Attacks | Stop reporting entire consumptionRemove large appliances from measurementsReport zero consumptionAlter load profiles to hide large loadsReport negative consumption (acts as a generator) |
| Description | Value |
|---|---|
| Time duration of data | 1 January 2014 to 31 September 2016 |
| No. of total consumers | 25,000 |
| No. of normal users | 22,532 |
| No. of electricity thieves | 2468 |
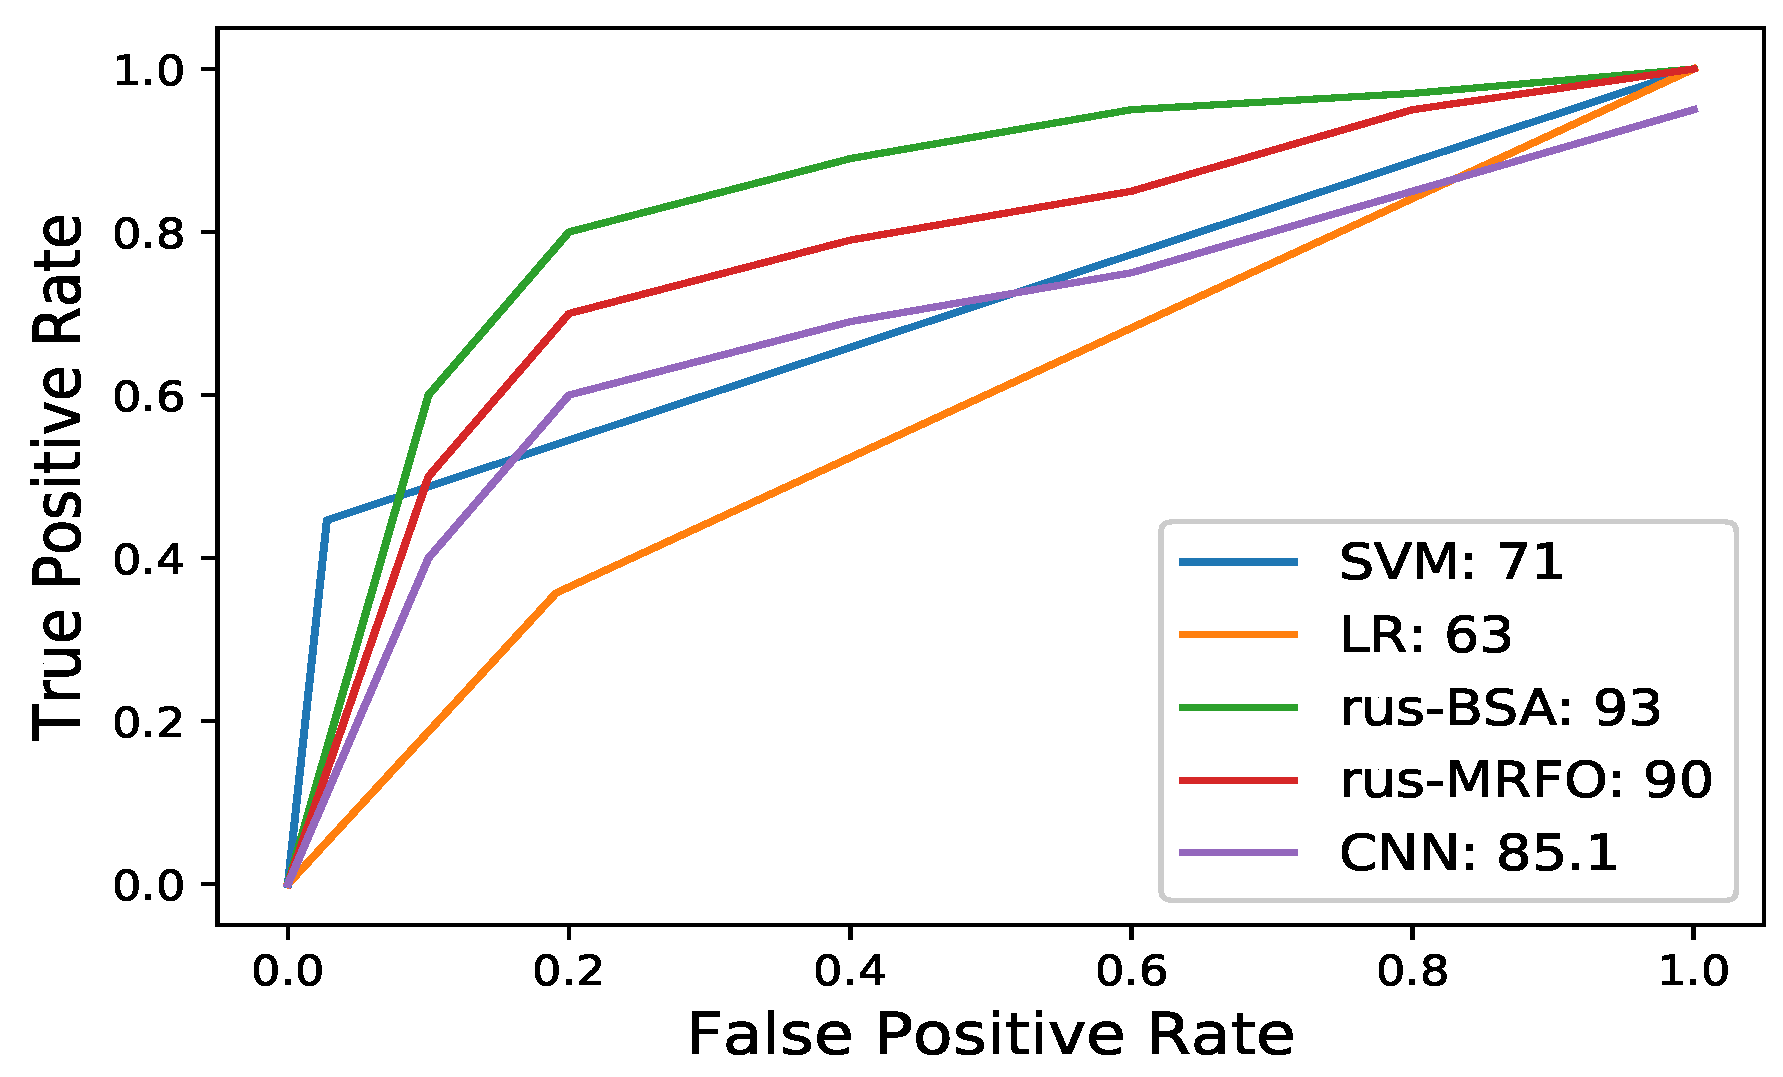
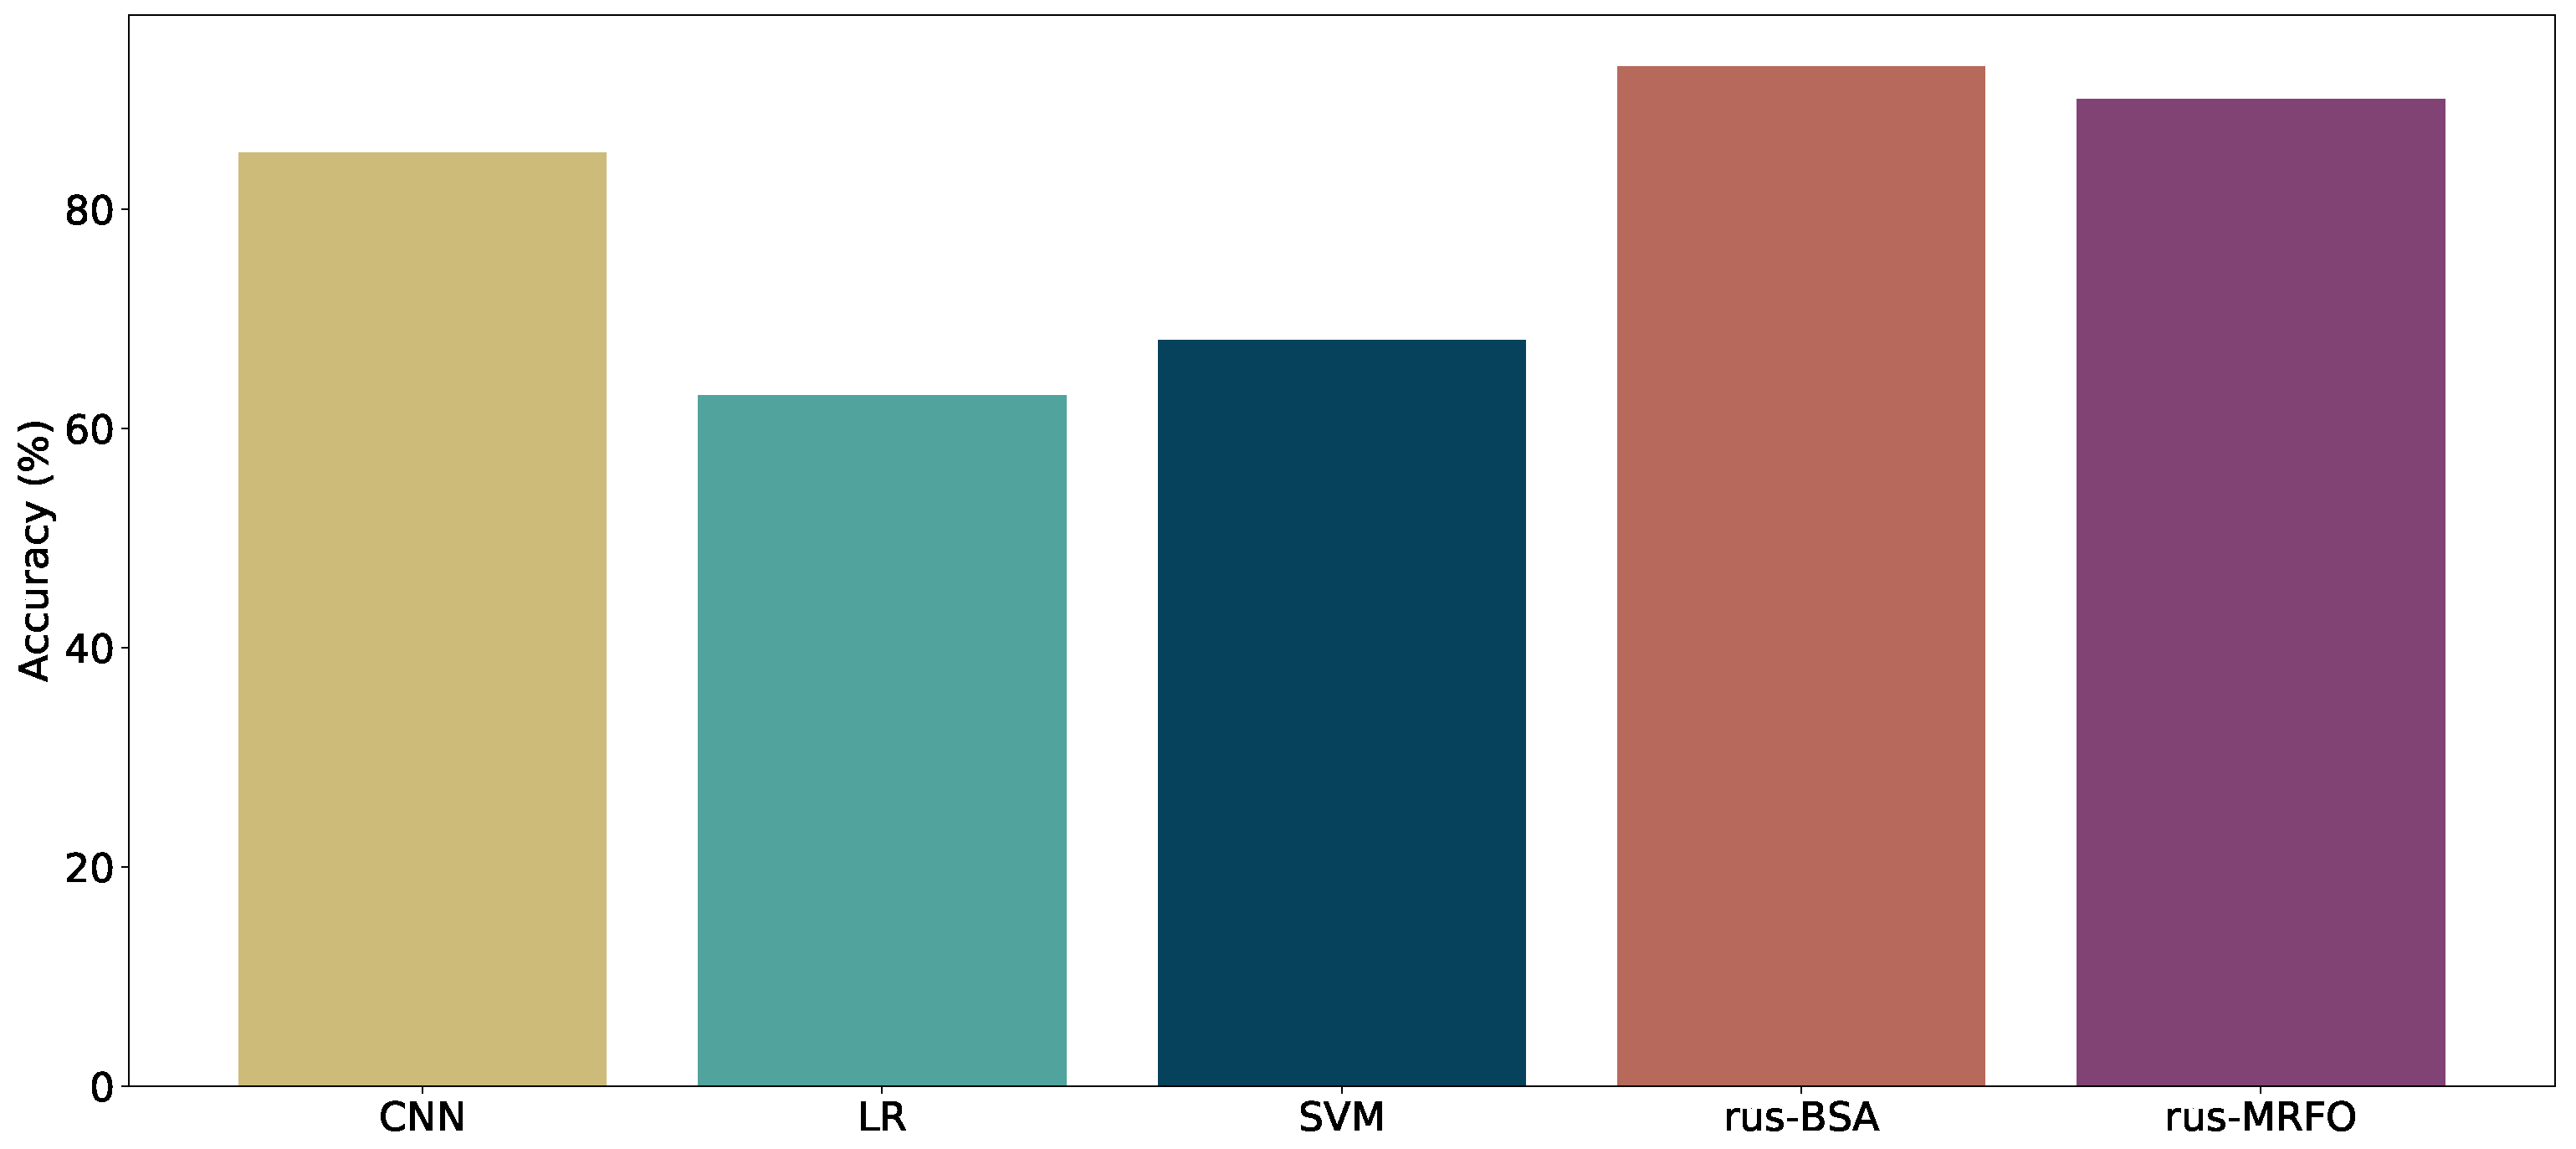
| Techniques | F1-Score | Accuracy | Precision | Recall | AUC |
|---|---|---|---|---|---|
| CNN | 86.2% | 85.1% | 87.43% | 88% | 85.1% |
| LR | 61% | 63% | 67% | 65% | 63% |
| SVM | 71% | 68% | 65% | 72% | 71% |
| rus-BSA | 92% | 93.5% | 92.32% | 94.02% | 93% |
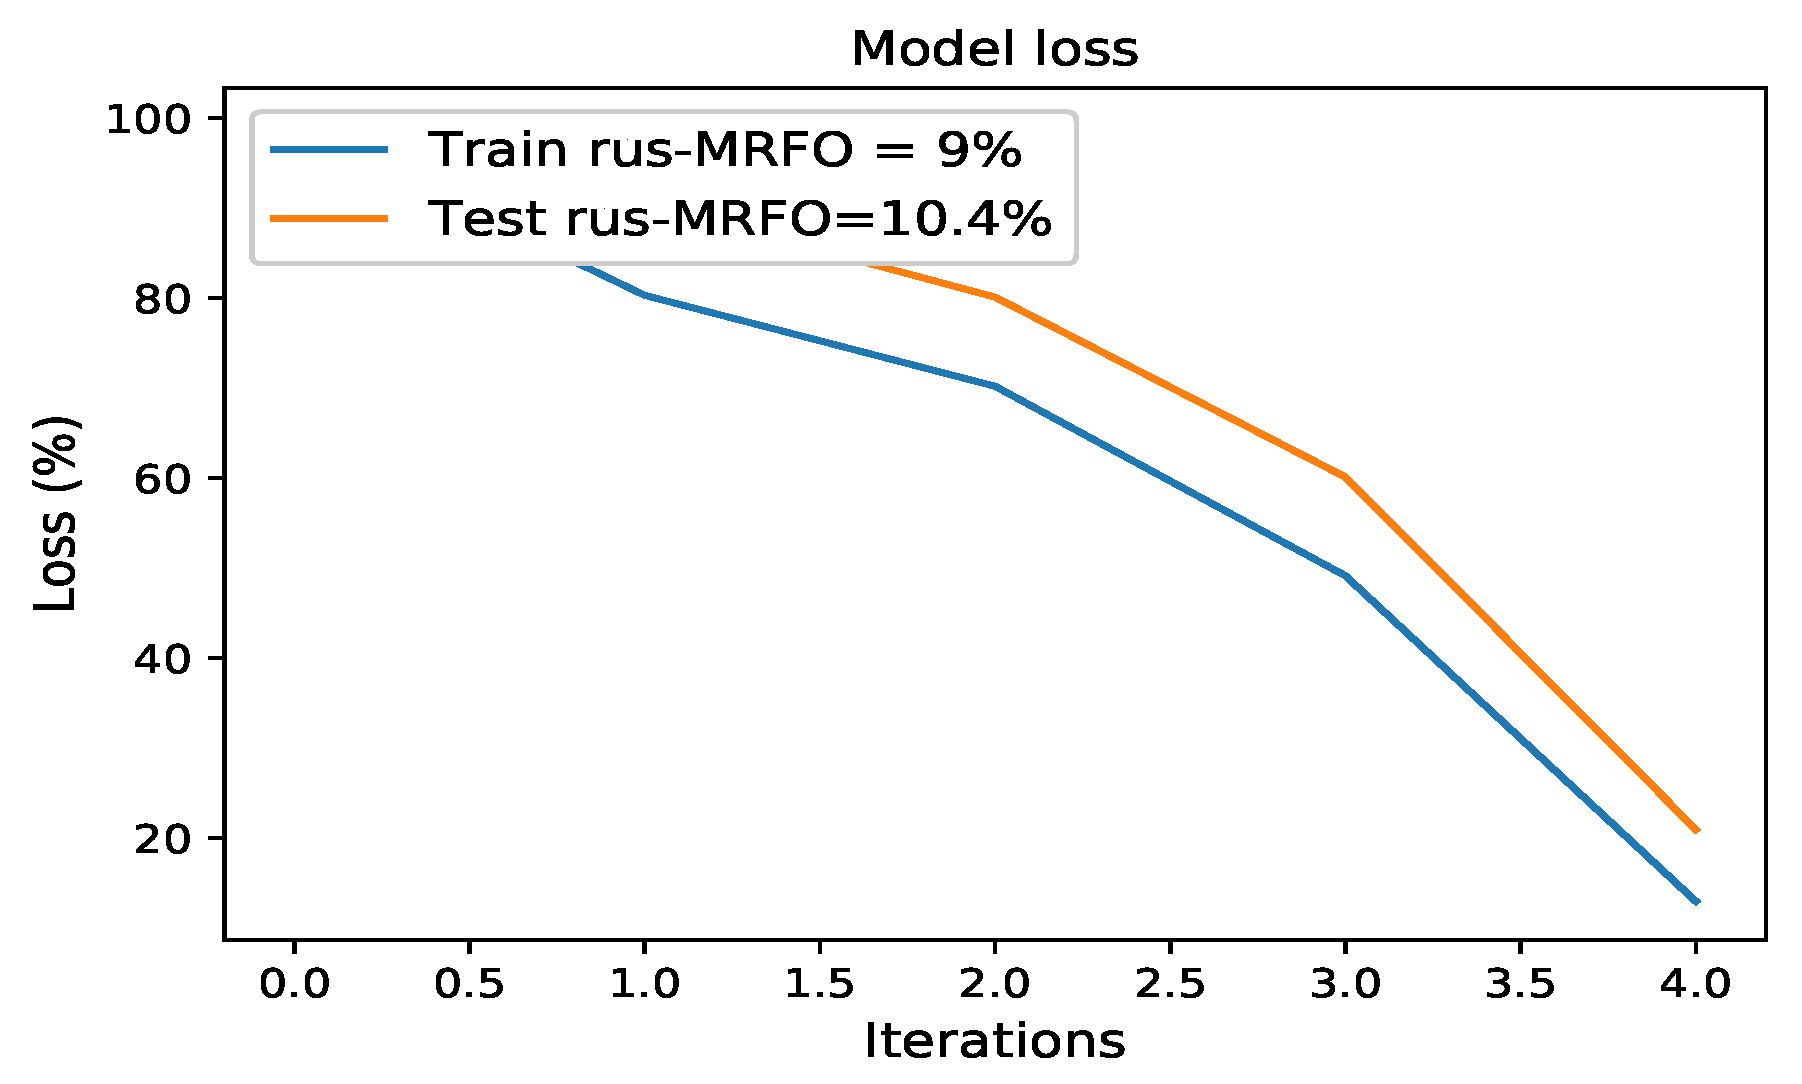
| rus-MRFO | 87% | 91.5% | 89% | 92.87% | 90% |
Publisher’s Note: MDPI stays neutral with regard to jurisdictional claims in published maps and institutional affiliations. |
© 2021 by the authors. Licensee MDPI, Basel, Switzerland. This article is an open access article distributed under the terms and conditions of the Creative Commons Attribution (CC BY) license (https://creativecommons.org/licenses/by/4.0/).
Share and Cite
Akram, R.; Ayub, N.; Khan, I.; Albogamy, F.R.; Rukh, G.; Khan, S.; Shiraz, M.; Rizwan, K. Towards Big Data Electricity Theft Detection Based on Improved RUSBoost Classifiers in Smart Grid. Energies 2021, 14, 8029. https://doi.org/10.3390/en14238029
Akram R, Ayub N, Khan I, Albogamy FR, Rukh G, Khan S, Shiraz M, Rizwan K. Towards Big Data Electricity Theft Detection Based on Improved RUSBoost Classifiers in Smart Grid. Energies. 2021; 14(23):8029. https://doi.org/10.3390/en14238029
Chicago/Turabian StyleAkram, Rehan, Nasir Ayub, Imran Khan, Fahad R. Albogamy, Gul Rukh, Sheraz Khan, Muhammad Shiraz, and Kashif Rizwan. 2021. "Towards Big Data Electricity Theft Detection Based on Improved RUSBoost Classifiers in Smart Grid" Energies 14, no. 23: 8029. https://doi.org/10.3390/en14238029
APA StyleAkram, R., Ayub, N., Khan, I., Albogamy, F. R., Rukh, G., Khan, S., Shiraz, M., & Rizwan, K. (2021). Towards Big Data Electricity Theft Detection Based on Improved RUSBoost Classifiers in Smart Grid. Energies, 14(23), 8029. https://doi.org/10.3390/en14238029