Article

An Integrated System for Simultaneous Monitoring of Traffic and Pollution Concentration—Lessons Learned for Bielsko-Biała, Poland

by
Krzysztof Brzozowski
*,
Artur Ryguła
and
Andrzej Maczyński
Department of Transport, Faculty of Management and Transport, University of Bielsko-Biala, Willowa 2, 43-300 Bielsko-Biała, Poland
*
Author to whom correspondence should be addressed.
Energies 2021, 14(23), 8028; https://doi.org/10.3390/en14238028
Submission received: 3 November 2021 / Revised: 24 November 2021 / Accepted: 26 November 2021 / Published: 1 December 2021
(This article belongs to the Special Issue Energy Intensity of Transport and Environmentally Friendly Mobility)

Abstract

:
The challenge of maintaining the required level of mobility and air quality in cities can be met by deploying an appropriate management system in which the immediate vicinity of roads is monitored to identify potential pollution hotspots. This paper presents an integrated low-cost system which can be used to study the impact of traffic related emission on air quality at intersections. The system was used for three months in 2017 at five locations covering intersections in the centre of a mid-sized city. Depending on the location, pollution hotspots with high PM2.5 and PM10 concentrations occurred 5–10% of the time. It was shown that despite the close mutual proximity of the locations, traffic and the immediate surroundings lead to significant variation in air quality. At locations with adverse ventilation conditions a tendency towards more frequent occurrences of moderate and sufficient air quality was observed than at other locations (even those with more traffic). Based on the results, a practical extension of the system was also proposed by formulating a model for the prediction of PM2.5 concentration using a neural network. Information on transit times, meteorological data and the background level of PM10 concentration were used as model input parameters.

1. Introduction

Air pollution remains a significant problem worldwide, affecting people’s health and quality of life [1]. One of the relevant sources of emissions of gaseous pollutants such as nitrogen oxides (NOx), carbon monoxide (CO)—but also fine particulate matter (PM2.5)—is transport. For example, in Poland the largest share (54%) of PM2.5 total emissions in 2017 was associated with the burning of coal and wood in households; manufacturing, industry and construction (29%) and transport (11%) were also significant sources of PM2.5 [2].
What is more, intensive road transport has become an inseparable element of the contemporary urban landscape, determining the state of the local environment to a large degree. For many years, the significant impact of transport-derived pollution on air quality has been noted in urban conurbations. Despite the existence of multiple initiatives aimed at improving the situation, in many European urban centres air pollution continues to represent the main health risk factor [3]. Heavy traffic flow, a significant proportion of individual (private) vehicles, a significant share of vehicles not meeting emissions standards and the not always optimal quality of infrastructure are relevant factors increasing emissions of harmful compounds deriving from road traffic.
It is considered that in the long term, improvements in the situation in urban areas will be achievable by making appropriate changes in the mobility sector, including changes to both private and public transport. In this context, it is necessary to implement new tools and methods of reducing air pollution in urban areas via the introduction of effective mechanisms making use of intelligent transport systems for management of transport infrastructure and road traffic. A basic condition for the realization of effective management strategies is the launch of systems permitting simultaneous access to real-time measurements of both road traffic and air pollution.
In many European cities air quality monitoring is carried out (and measurement results made available), but due to installation costs, the number of stations operating in regulatory air quality monitoring networks is limited. Moreover, when deciding locations for monitoring sites, few or no formal attempts have been made to provide spatial coverage [4]. As a consequence, the existing air quality network does not provide sufficient spatial resolution. In general, to be able to identify pollution hotspots, a network of higher density is needed.
Therefore, there are increasing attempts to install and use multi-element wireless networks of low-cost pollution sensors [5]. Connecting information collected by a network of air quality monitoring sensors (referred to hereafter as LCS) with models predicting pollutant concentrations can be an effective solution permitting the introduction of short-term air quality management strategies in urban areas. A number of published results confirm that this approach is promising. Nitrogen dioxide (NO2) concentration was mapped by the LCS network and urban-scale model for the Oslo in [6]. In [7,8] the LCS network with land use regression models was used to map air pollution. In another study [9] the use of LCS for monitoring ozone concentration as a part of a network with reference stations was demonstrated. In a study [4] was proposed a method of creating an air quality monitoring network that takes into account social (population) and environmental (air pollution) factors; it can collect data with high spatiotemporal resolution in several layers, using reference, low-cost and Internet-of-Things (IoT) sensors. In a study on this subject [10] the authors used combined data from different sources in order to improve the spatiotemporal estimation of PM2.5 pollution. In another study [11] the authors reported on an LCS network deployed in Dezhou city which was used to identify pollution hotspots. LCS networks are also being developed for more local applications [12].
As an alternative to the stationary LCS monitoring network, mobile monitoring is sometimes used to determine air pollution concentrations in urban areas. A mobile monitoring for predicting NO2 concentrations was presented in [13]. Mobile sampling for mapping air pollution at streets in Seoul was presented in [14]. Results of mobile sampling deployed on fleets of waste disposal trucks were combined with methods developed to interpret PM2.5 measurements in Cambridge, Massachusetts [15]. As part of the GreenIoT project in Uppsala, it is planned to supplement a stationary sensor network with LCS mounted on the roofs of buses used for public transport [16]. In Sunway City, mobile sampling with LCS for monitoring concentrations of carbon dioxide (CO2) and NO2 was performed [17]. In Nantes, the PM10 concentrations recorded by the stationary LCS network and sensors deployed on vehicles were used for air quality mapping [18]. For data collection in the case of mobile monitoring, cyclists can be used, which due to their ubiquity present a potential global approach to data collection [19]. Mobile monitoring with portable LCS can also be used in exposure studies, for instance to analyse the individual exposure levels in the vicinity of roads (see, for example, [20]). Monitoring with personal portable LCS can be used to determine air pollution exposure during commuting at a high spatiotemporal resolution in near real-time [21]. In a study on this subject [22] the authors used portable devices to quantify personal exposure levels to the in-car concentrations of PM, NO2 and CO during morning and evening peak hours in Cairo.
Despite the fact that LCS are increasingly being used, some of their performance characteristics still have to be investigated in greater depth. Therefore, intensive research is being conducted on topics such as the variability between individual sensors, the accuracy which with data are recorded, the effect of environmental conditions and long-term stability [23,24,25,26,27].
The literature review indicates a number of low-cost sensor applications for spatial mapping of air quality at varying temporal resolution. However, measures aiming to simultaneously manage both traffic and air quality (in the area of road infrastructure) require additional information characterising traffic conditions in real time. For signal-controlled intersections, knowledge of the variability of traffic conditions is essential for assessing the impact of transport on air quality. In this paper, an attempt has been made to formulate a unique solution for characterising traffic conditions based on the determination of transit times. Transit time is the result of the traffic signaling program and the traffic volume at a given intersection. In this study we used an integrated low-cost system for simultaneous recording of current transit times and current levels of pollution at intersections. The system allows assessment of the influence of traffic-related emissions on air quality and is a data source for implementing effective traffic management strategies to prevent the emergence of local pollution hotspots.

2. Materials and Methods

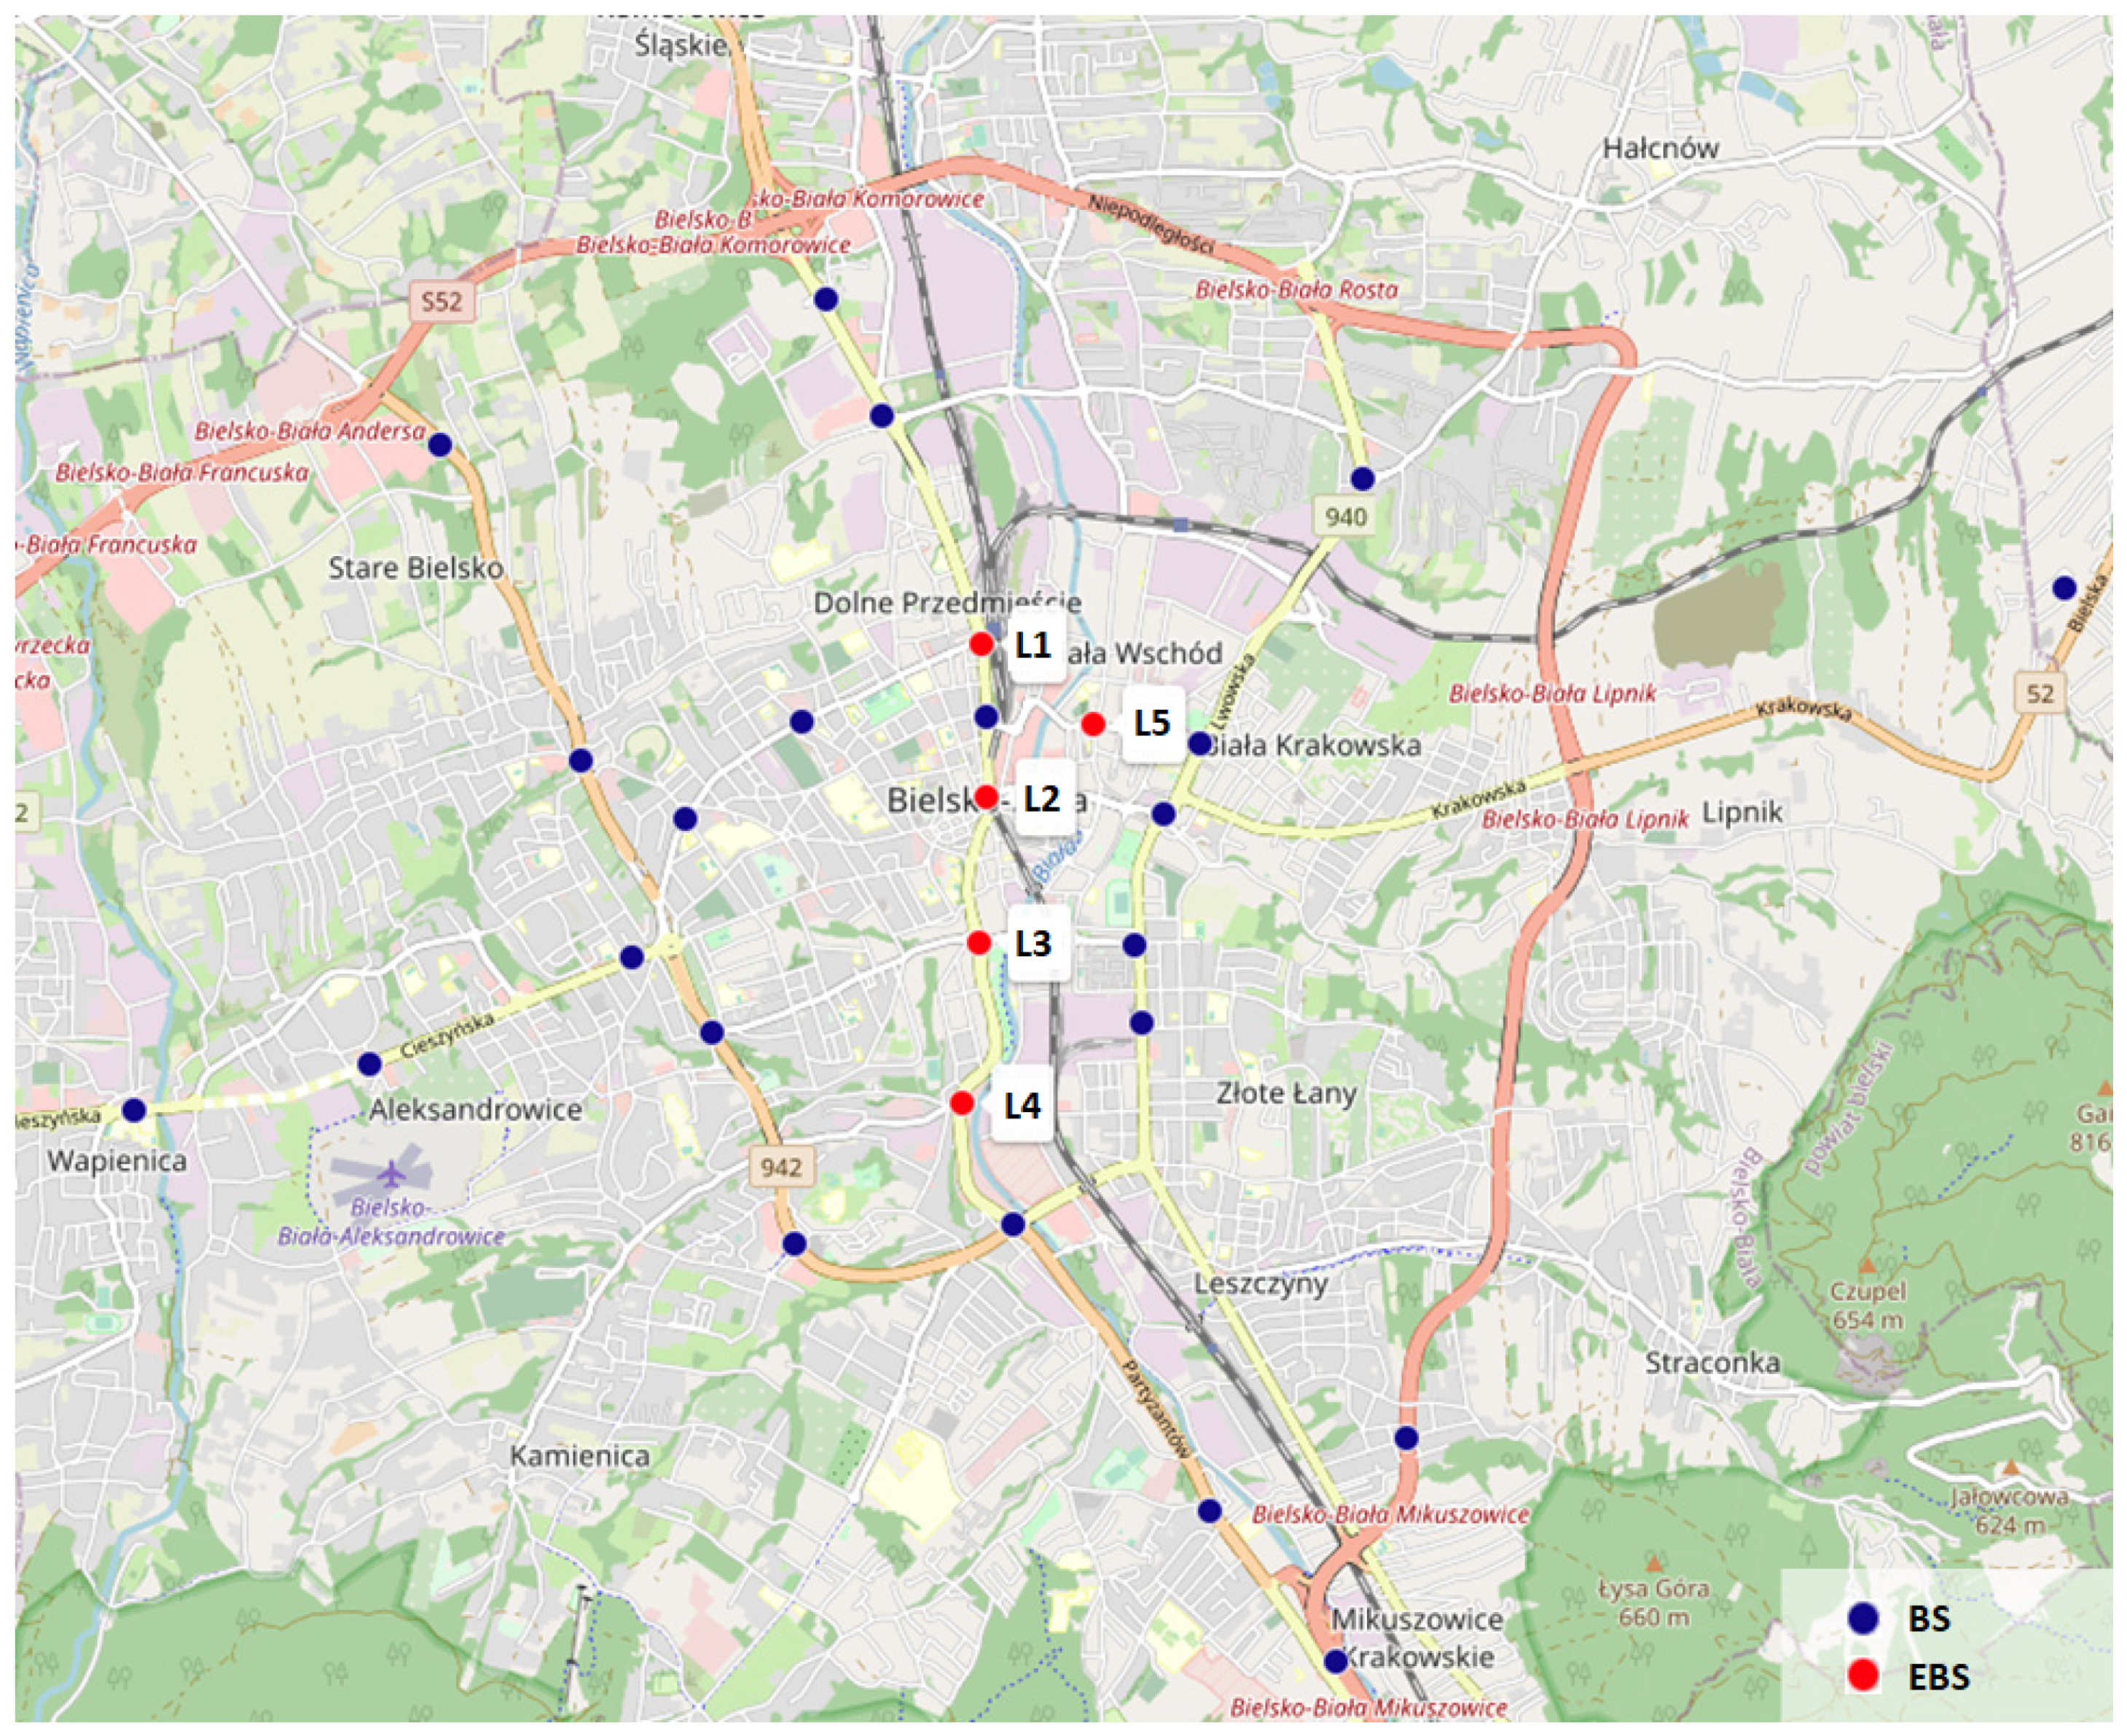
2.1. Site Description

The research was conducted in a period of three months from 1 August to 3 November 2017 in Bielsko-Biała. Bielsko-Biała is a Polish city lying in the southern portion of the country. It has approximately 175,000 inhabitants, covers an area of 125 km2 and has 410 km of paved roads per 100 km2. Within the city, a large number of cars are registered—651 passenger cars per 1000 inhabitants [28]. Moreover, the city is located at the foot of the mountains, several transport corridors intersect within it and public transport is not particularly popular. As a result, the city suffers from air quality problems. In 2017, the annual average exposure to PM2.5 was 29 μg/m3 [29]. Nowadays, according to the European Environmental Agency [30], Bielsko-Biała ranks 310 in Europe on the list from the cleanest city to the most polluted (out of 323 included), as a result of the annual mean PM2.5 concentration being equal to 21.64 μg/m3. As indicated by the results of the studies presented in [31], the average daily share of road traffic in PM2.5 pollution in Bielsko-Biała, with a low urban background concentration, reached about 22%.

2.2. Measurement System

Simultaneous monitoring of traffic and pollution concentration was performed using five extended base stations of the OnDynamic system (APM PRO, Bielsko-Biała, Poland). This system is a low-cost intelligent architecture consisting of sensors and specialized software, which allows gathering data and presenting information acquired from multimodal sensors in real time, including: travel time, mean speed on the given section, traffic intensity and current traffic obstructions/incidents. These traffic metrics are calculated based on the identification of active Bluetooth devices mounted in passing vehicles. In 2015, the OnDynamic system installed in Bielsko-Biała consisted of more than 20 measuring stations located at major intersections within the city’s basic transport structure (Figure 1). On the basis of the concept presented in [32], in summer 2017 extended base stations were put into operation at several intersections (L1–L5) in the city centre (marked as EBS on Figure 1). At these extended base stations, the commercially available optical particle counter sensor PMS5003 (Plantower, Beijing, China) and electrochemical sensor CO-B4 (Alphasense, Great Notley, Braintree, UK) were used to measure concentrations of particulate matter and carbon monoxide, respectively.
The set of monitoring equipment used for the study is characterized in Table 1. All base stations of the system were mounted on an extension arm mounted to traffic lights. An example view of one such station is shown in Figure 2.
The system is structured to cover three main levels of functionality: data acquisition, information processing and data visualization. Data are acquired via the microcontroller at the base station; it detects the Bluetooth devices and performs initial data filtration. Data from the base station regarding the devices detected in a given location are sent via a virtual private network to the central database system. Information is processed by the central servers, where the data is first analyzed, taking into account the station location, and then the parameters characterising the traffic in the road network are estimated. Data visualization is carried out using an Internet platform available from both stationary and mobile devices. Data are presented on a map background, thus allowing simultaneous visualization of current traffic parameters on particular sections of the network (Figure 3).
Thanks to its advanced, inbuilt algorithms, the OnDynamic system is an advanced, automated measuring environment. The system has proved a useful tool for monitoring traffic conditions and analysing traffic long-term variability [33].

2.3. Data Processing

In traffic-related emission modeling and assessment of the emission impact on air quality basic parameters characterising road traffic are used, such as traffic volume, vehicle categories and traffic speed [34]. Using the OnDynamic system, two of these parameters can be estimated: traffic volume and traffic speed. These are obtained as follows: each base station in the measuring system registers unique MAC addresses of the Bluetooth devices within a range of up to several hundred metres from the station, depending on the signal strength and antenna direction. The address of a given device is registered by the station in successive moments of time, as long as it is within the antenna’s range. In the next data processing stage, the traffic volume is estimated. To determine the total number of Bluetooth devices in a given quarter of an hour, the database of registered addresses is searched using filters, eliminating the addresses of devices not related to moving vehicles from the dataset. Next, the mean travel time travel between the stations is determined for a set of addresses registered in a given quarter of an hour based on the time difference between registrations of a given address by neighbouring stations. Then, based on this, the traffic speed is estimated. Additionally, the mean time that devices stay within the station range is used to determine the average transit time through an intersection at a given location.
Simultaneously to the aforementioned recording of Bluetooth devices’ MAC addresses, a separate microcomputer supports the recording of instantaneous pollutant concentrations at extended base stations. As each particular address is registered by successive extended base stations, during a further stage in the data processing, it is possible to determine the actual travel time and, consequently, to determine the traffic participants’ exposure rate on particular sections of the road network [35]. The authors of this paper used the information from the system on transit times and concentrations of pollutants: CO, PM2.5 and PM10. These constituted the traffic and air quality characteristics of the intersection area. The hourly mean pollutant concentrations were used to determine air quality index (AQIx) classes in the surroundings of a given station—summarized in Table 2.
Based on the recorded pollutant concentrations for each location and the air quality index classes, AQIx, an overall air quality index class, AQIOV, is assigned as:
AQI OV = min AQI CO , AQI PM 2.5 , AQI PM 10

3. Results and Discussion

Air quality in cities may be considered to be the result of the effects of wind, environment and the shape of urban space [37]. The air pollution level in the vicinity of the road depends on a number of factors, such as: traffic conditions which influence on total exhaust emission (e.g., traffic intensity, vehicle categories, level of service, number of stops etc.), the urban background pollution, the layout and density of buildings near the road, wind speed and direction, the intensity of mechanical turbulence generated by vehicles, as well as other factors. During the study period, the concentrations recorded at particular locations showed that local pollution hotspots were formed. The frequency of occurrence of the overall air quality index classes at particular locations are presented in Table 3.
Based on the frequency of occurrence of AQIOV classes, it can be concluded that generally very good (AQIOV 6) and good (AQIOV 5) air quality were recorded for at least 68.3% of the time (at L1) and not more than 85.6% of the time (at L4). However, in all locations also poor (AQIOV 2) and very poor (AQIOV 1) air quality occurred sometimes. Below, the authors discuss the details of the results obtained.

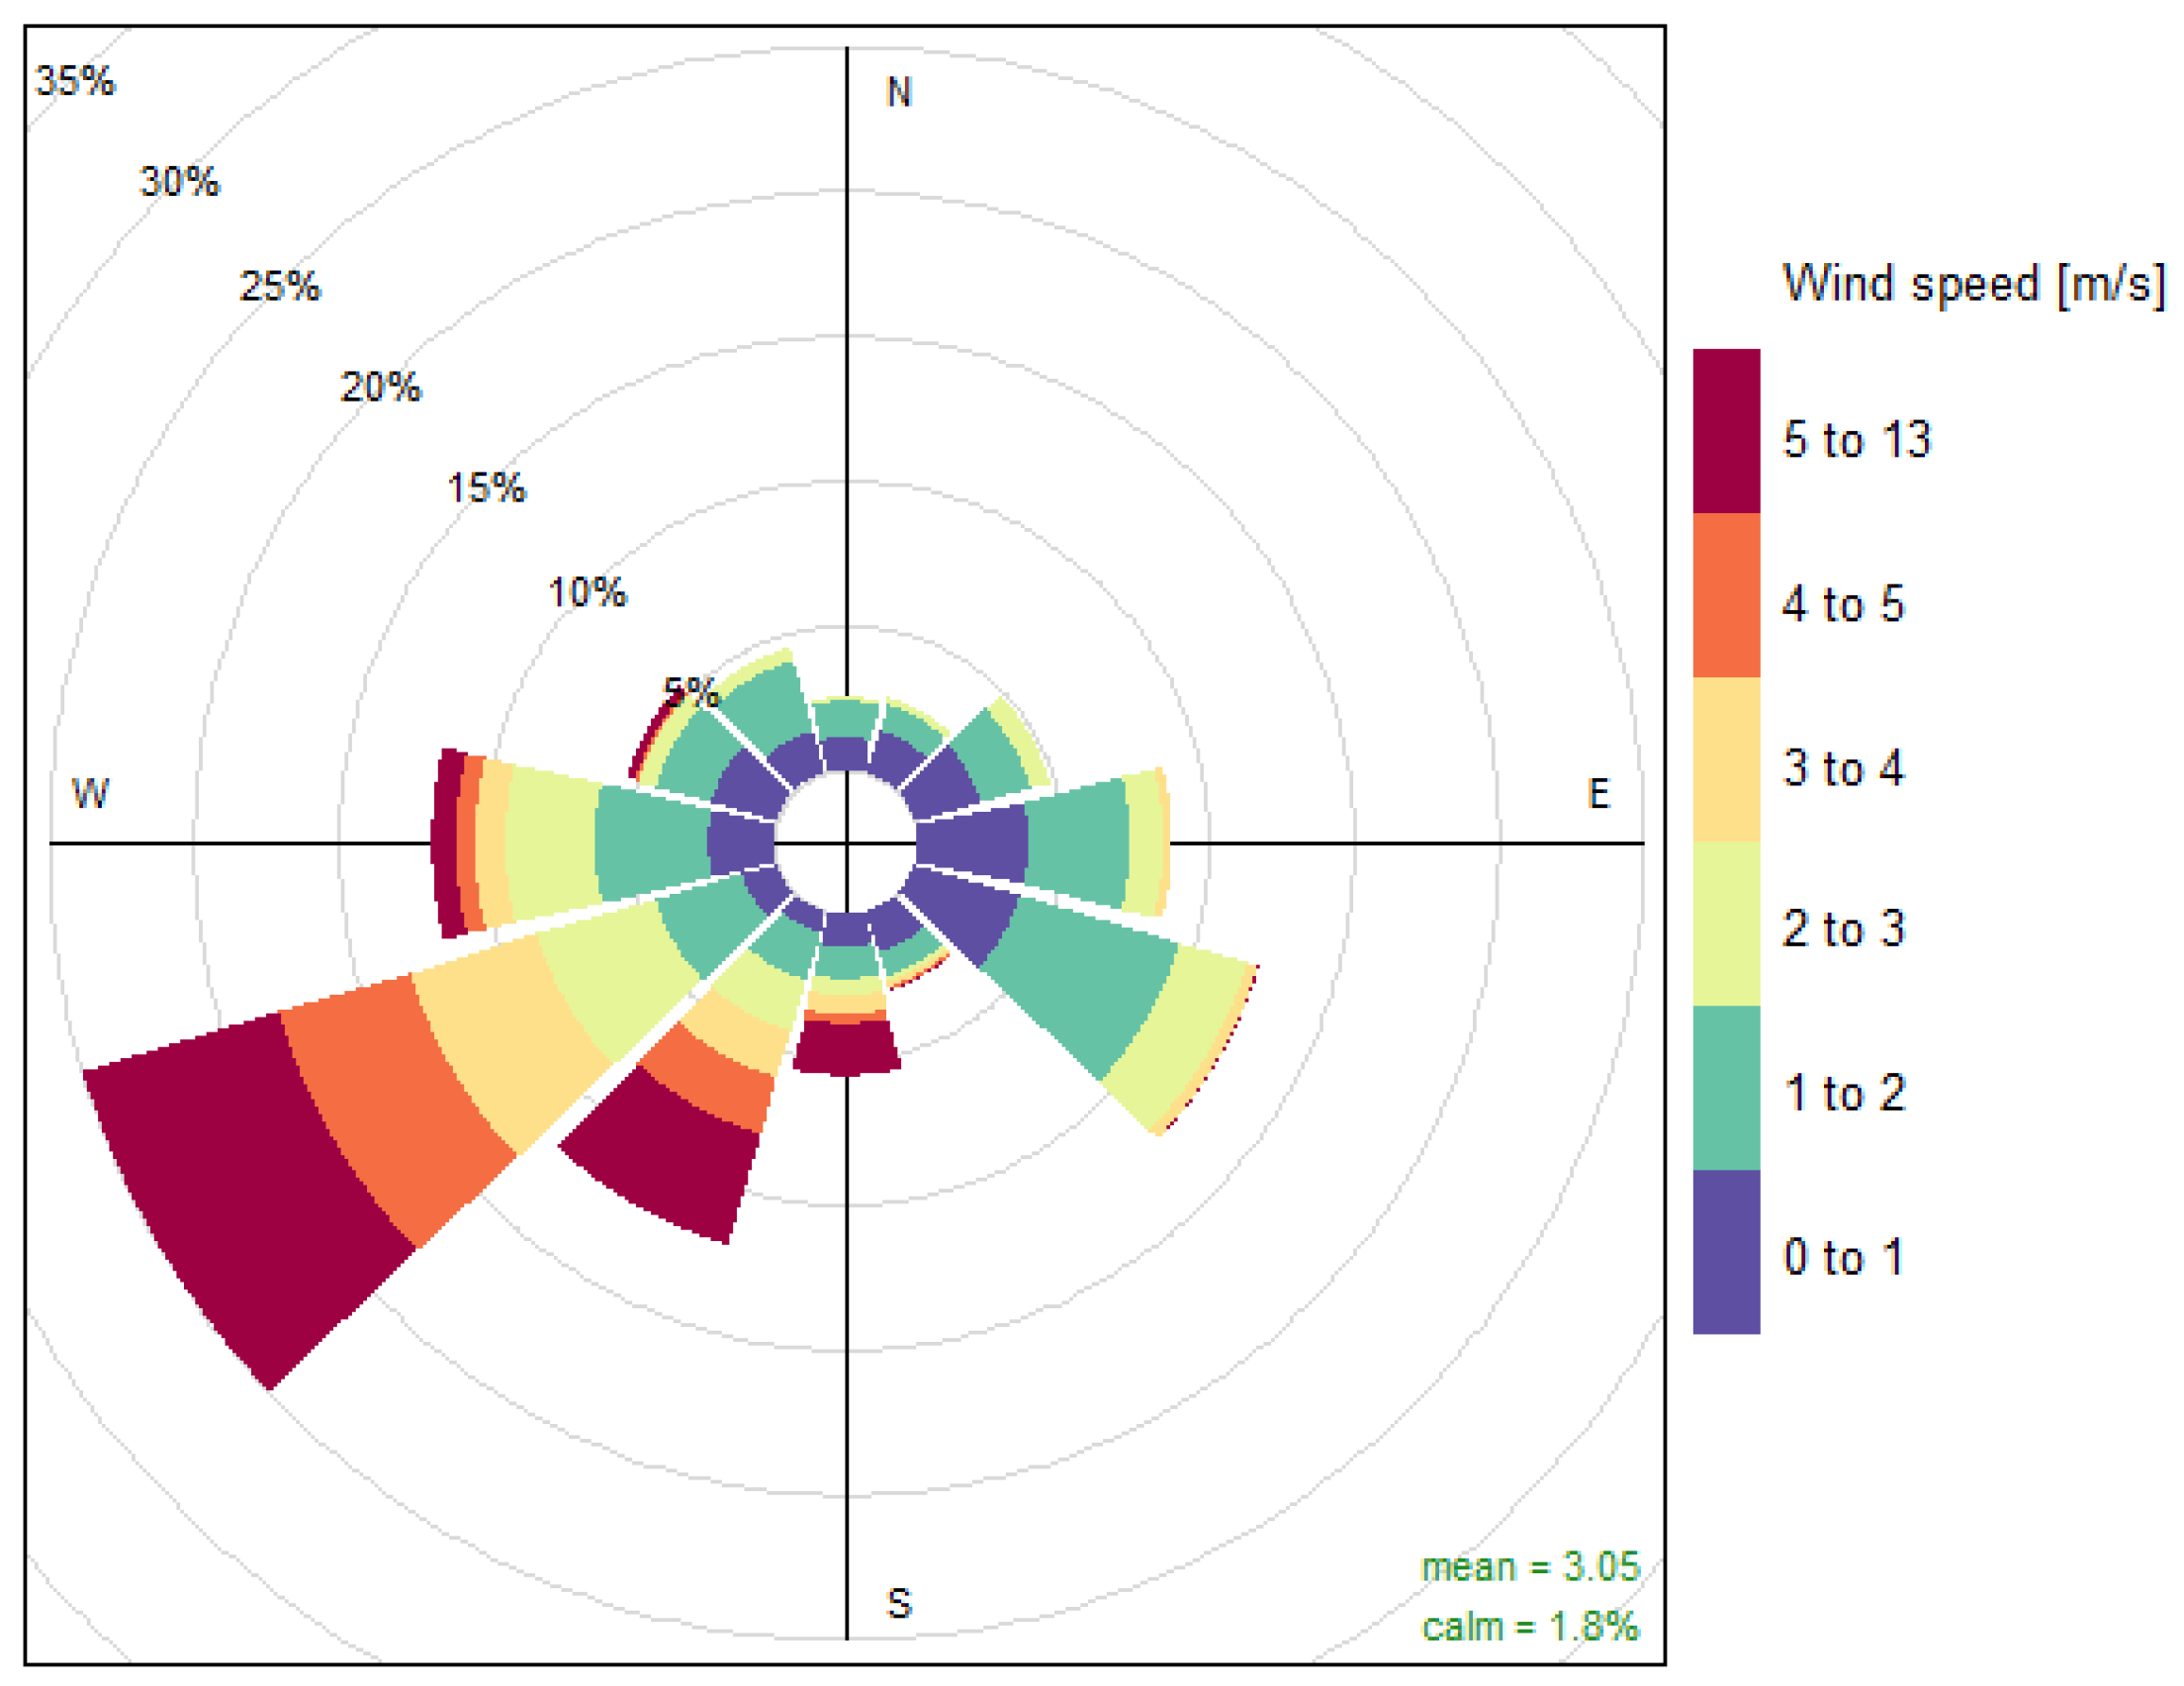
3.1. Meteorological Conditions and Urban Background Pollution

During the period analyzed, moderate wind from the southwest prevailed. Figure 4 shows the wind rose on the basis of measurements recorded by a meteorological station located not more than 5 km from each of the locations analyzed (L1–L5). No wind was recorded during 41 h of observation, while weak winds of 1 m/s were almost thirteen times more frequent than no wind at all.
The urban background CO and PM10 concentrations were recorded by the station belonging to the regulatory air quality network and were subject to changes on individual days during the period analyzed. Unfortunately, this station does not register the PM2.5 concentration. The urban background CO level throughout the observation period corresponded to AQICO(b) 6, i.e., very good air quality. In turn, the PM10 urban background concentration values indicated variation in AQI classes, excluding AQIPM10(b) 1, i.e., never very poor (Table 4).
The data presented in Table 4 show that for most of the observation hours, the AQI class determined based on PM10 concentration for urban background showed very good air quality. The indications for moderate (AQIPM10(b) 4) and sufficient (AQIPM10(b) 3) air quality were 73 h and 26 h, respectively, and poor air quality (AQIPM10(b) 2) was recorded for 7 h. When the background pollution level was high (AQIPM10(b) 2) the wind speed was between 1 and 3 m/s (mean value 1.9 m/s) and no wind gusts were recorded.

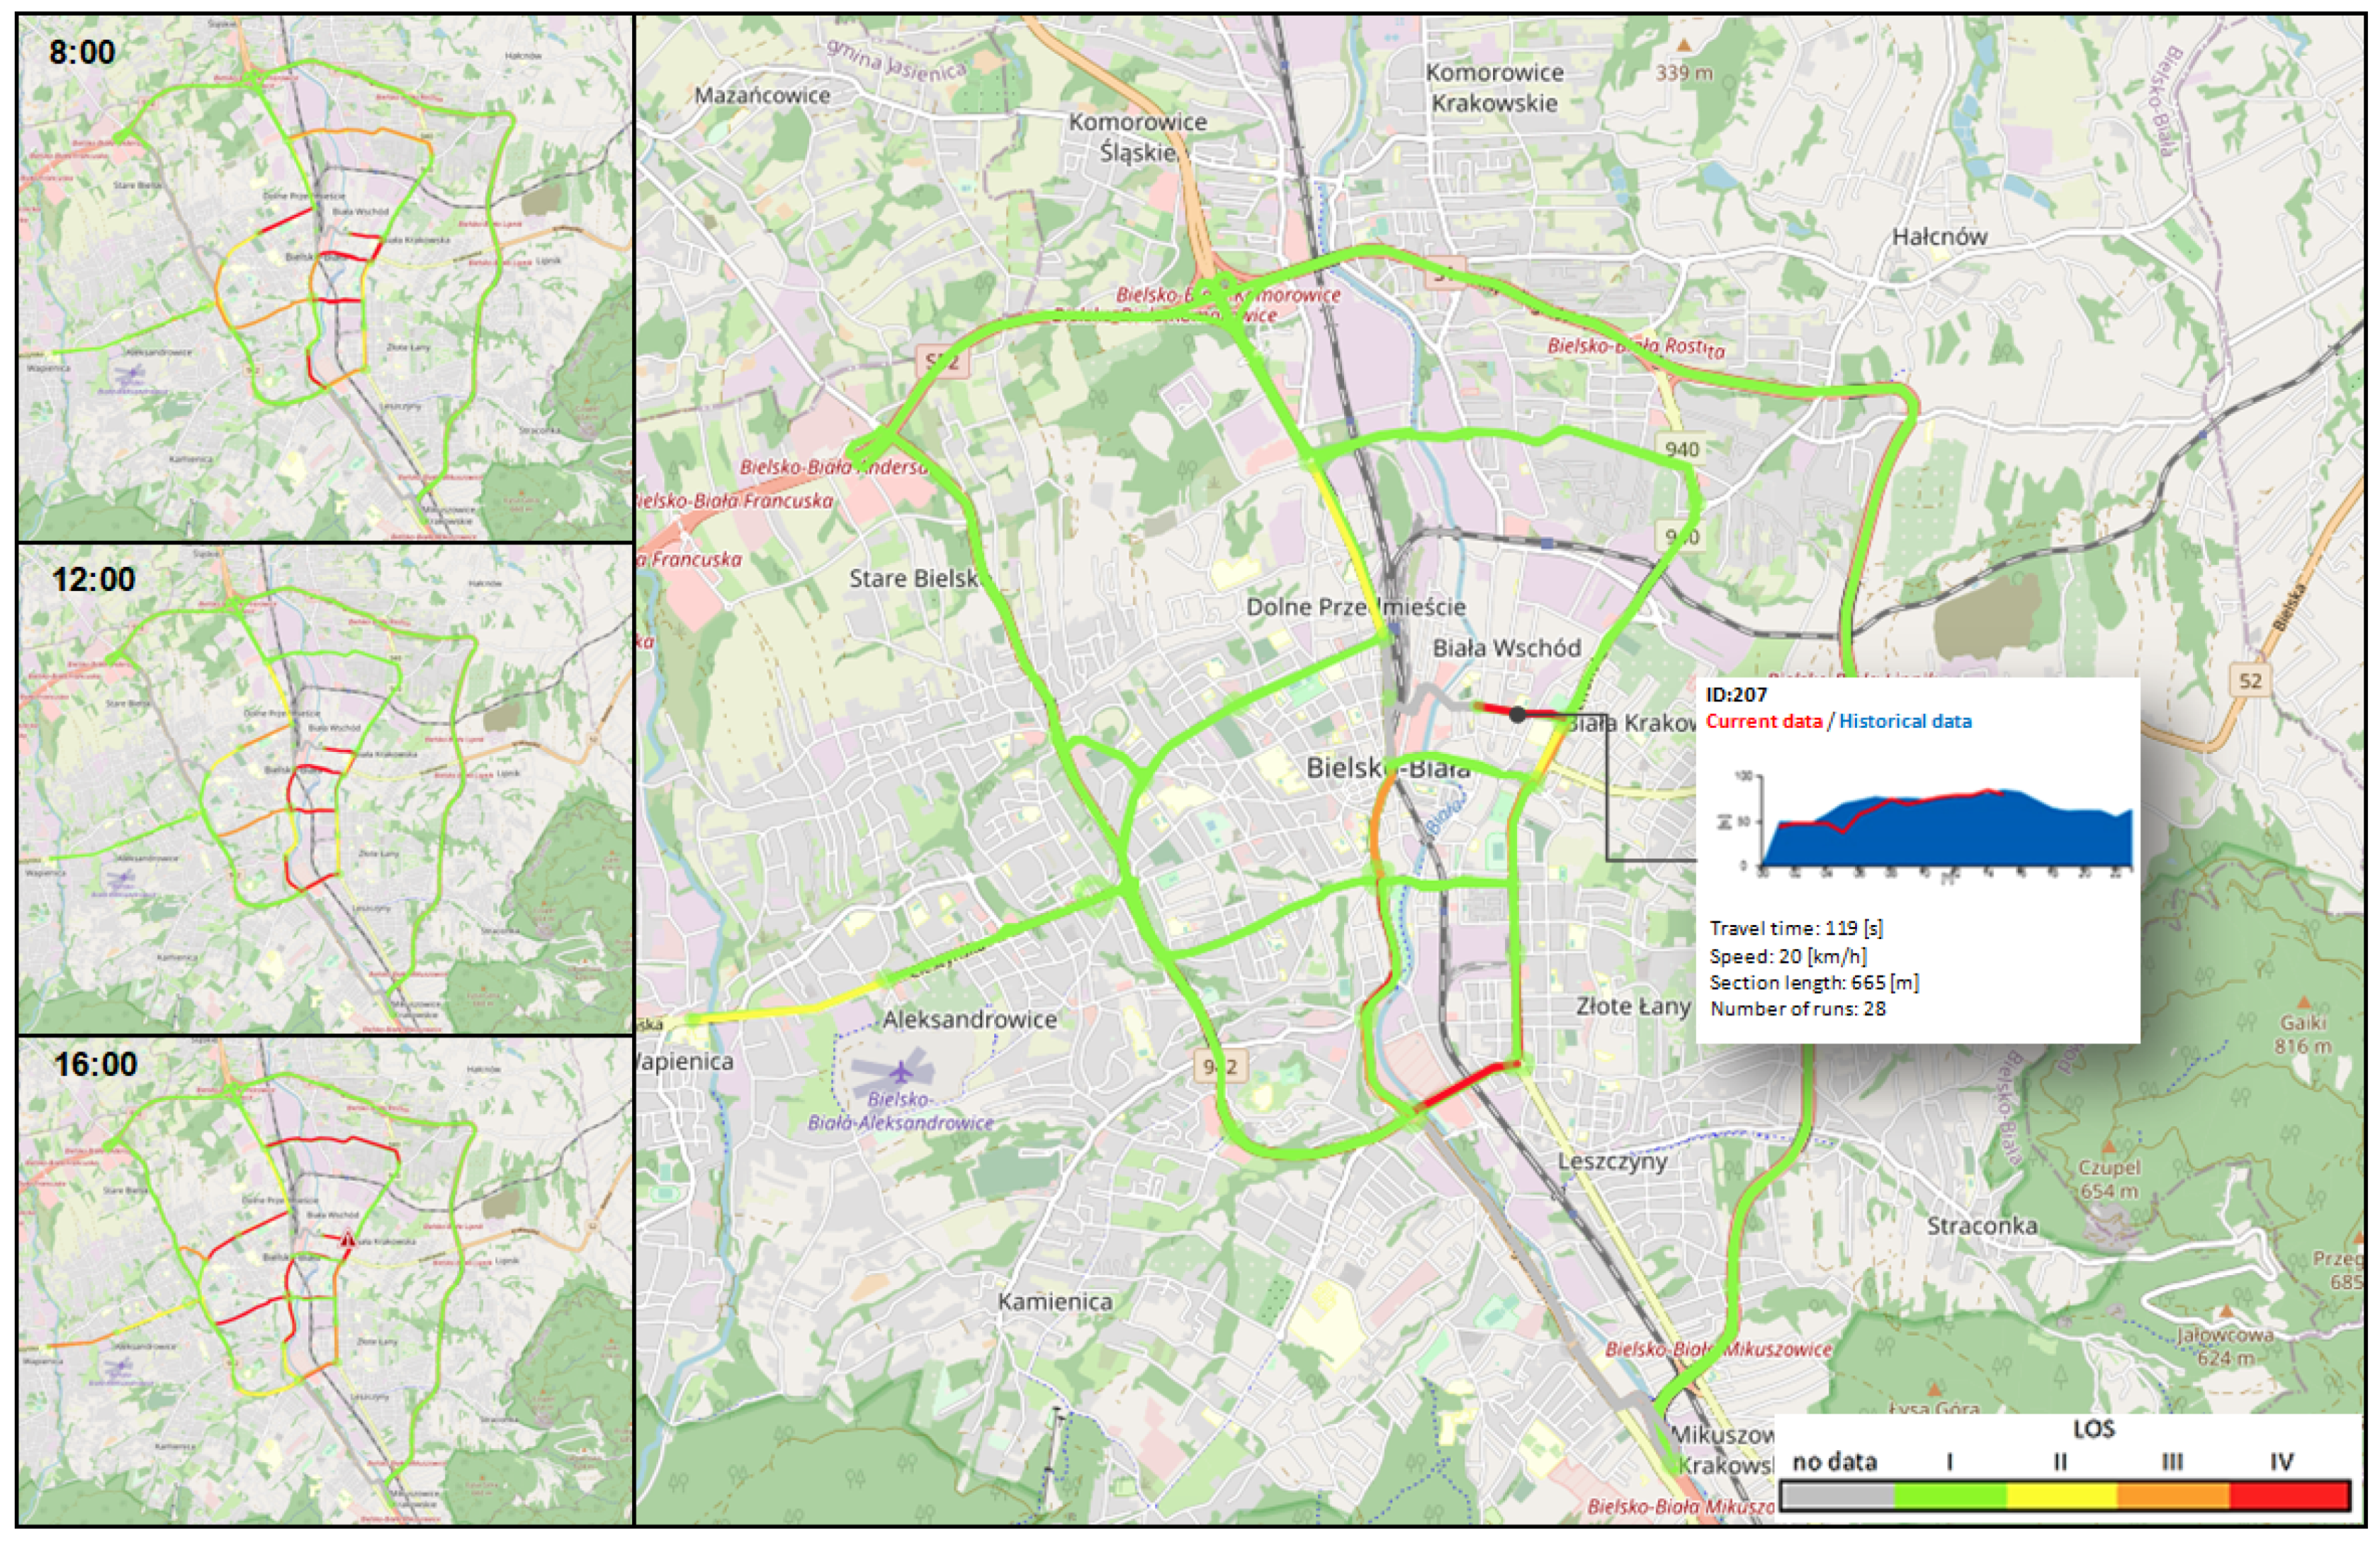
3.2. Characterization of Traffic and the Vicinity of Intersections in Locations Analyzed

The stations of the system in Bielsko-Biała were located in the vicinity of intersections with varying traffic intensity and in the immediate vicinity of inhomogeneous buildings. In this study, the diversity of local conditions resulting from the layout and density of buildings in the immediate surroundings was characterized by the Sky View Factor (SVF) value [39,40]. To determine the SVF values at the locations analyzed, site photographs taken with a fisheye lens (Figure 5) were used. The SVF values were determined using the SVF Calculator [41]. The results for the individual locations are summarized in Table 5.
A comparison of the SVF values indicates that the most restrictive surrounding built environment—and therefore the least favorable ventilation conditions—was at L5. If identical emissions were to occur at all locations, the worst air quality could be expected at L5.
In fact, the traffic volumes on individual intersections at the locations under consideration varies. The highest volume of traffic is recorded at L3. The traffic volume at L1 and L2 is a few percent lower. The lowest traffic volumes were recorded at L4 and L5 (over 30% lower than at L3)—see Table 6. At all locations, the afternoon peak is higher than the morning peak; the greatest differences were measured for locations L2 and L5. The percentage shares of heavy vehicles (i.e., urban buses and heavy duty vehicles of mass >3.5 mg) are highest at locations L1 and L5. For locations on the same road situated in the city centre (from L2 to L4) the percentage share of heavy vehicles is almost at the same level.
Knowing only the total traffic volume does not allow unambiguous identification of the level of service, which significantly determines the level of emissions. The level of service at an intersection is related to the transit time, which may vary for intersections with the same total volume of traffic. The variability in transit time on weekdays and at weekends determined by the OnDynamic system in the period analyzed is presented in Figure 6.
The longest transit times in the period analyzed were recorded at L3. The median transit times at L1 and L2 are noticeably different, despite the almost identical traffic volumes. In contrast, the median transit times calculated for L5 and L2 are comparable, despite significantly different traffic volumes. The traffic at individual intersections is also subject to clear daily variability. Figure 7 shows the mean values for individual hours of the day at L3 and L5. It is easy to see that transit times may differ according to the type and time of day at different locations. On working days, the most unfavorable traffic conditions are generally recorded at L3 from 8 am to 6 pm and at L5 from 8 am to 3 pm. Therefore, during these hours pollution hotspots are more probable because the level of service is lower due to longer transit times and consequently increased traffic-related emissions. Daily differentiation in traffic conditions is one of the factors determining the variability of air pollution in the vicinity of roads. In our earlier work we performed analyses of hourly mean PM2.5 concentrations and traffic data for a period of almost one month. It was shown that on most days the estimated hourly average share of traffic-related emissions in PM2.5 pollution was clearly correlated with the traffic volume [31].

3.3. Air Quality in the Vicinity of Roads

Concentrations of pollutants recorded by sensors at base stations confirmed poorer air quality in the vicinity of roads, for all locations (in comparison to urban background). Nevertheless, the CO concentrations recorded at individual locations during the analyzed period, although higher than in the urban background, are still very good, at AQICO 6. However, levels of PM concentrations recorded by the stations indicate the formation of local pollution hotspots. The general characteristics of the variability in air pollution level at the considered locations in relation to the concentration of CO and of both PM fractions are presented in boxplots (Figure 8).
The highest median CO concentration at the locations analyzed was recorded at L2. At L5, despite the lower traffic level, but due to unfavorable ventilation conditions (the lowest SVF), the median CO concentration is comparable to L1 and even higher than the median concentration at a location with much higher traffic volumes, i.e., L3. The lowest CO concentrations were observed at L4. The maximum recorded hourly average concentration of CO confirms that traffic did not change the AQICO class determined by the urban background level at any of the locations. Therefore, it can be concluded that the recorded CO concentrations at the locations analyzed, although higher than that of the urban background, do not contribute to the formation of local pollution hotspots. Analysis of statistics for hourly average concentration of PM2.5 and PM10 indicates that the highest hourly average concentrations were recorded at L1 and L2. As for CO, a higher median PM concentration was observed at L5 than at L3, which had the highest traffic volume but the most favorable ventilation conditions. However, the PM concentrations recorded at individual locations indicate the formation of local pollution hotspots.
In order to identify which conditions were conducive to the formation of pollution hotspots, the meteorological conditions under which high values of hourly average concentration of PM10 were recorded at individual locations were determined. For all locations, the maximum recorded PM10 concentrations show a significant dependence on wind direction. Figure 9 shows the polar plots for the maximum recorded hourly average concentration of PM10 depending on the wind direction and speed in the urban background and at individual locations.
The analysis of the data provided shows that in general, for all locations, the east and northeast wind was favorable to forming pollution hotspots. At L1, L2 and L5, the north wind was also conducive to the formation of high PM10 levels. Clearly, at L2, unfavorable conditions were also recorded for the northwest wind direction. Direct comparison of the data indicates certain differences for wind from other directions. Urban background levels were higher also when the wind was coming from the southeast which led to higher concentrations, especially at L1 and L2. At these two locations, the southeast wind, including at speeds exceeding 2 m/s, led to moderate air quality.
The variability of air quality at individual locations, resulting from the different traffic conditions and restrictions on the free dispersion of pollutants in the immediate vicinity, can also be characterized in relation to the frequency of occurrence of individual classes of AQIPM10 and AQIPM2.5 as shown in Table 7.
A comparison of the occurrence rates of AQIPM10 classes and PM10 urban background AQIPM10(b) classes indicates that as a result of traffic-related emissions, air quality in the vicinity of road infrastructure was, for many hours, significantly worse than in other areas of the city. At each location, air quality was more frequently both moderate (AQIPM10 4) and sufficient (AQIPM10 3) compared to the conditions for the urban background. At the same time, poor (AQIPM10 2) and very poor (AQIPM10 1) air quality in the vicinity of roads was recorded at certain times. The frequency of occurrence of the lowest AQI classes varied, most frequently recorded at L1 and L2. At L2, in the very centre of the city, poor air quality occurred 10 times more often than in other areas of the city influenced only by the urban background. Of the locations studied, the least deterioration of air quality in relation to the background was observed for L4. It is worth noting that despite the lower traffic volume at L5, due to the limitations on free dispersion of pollution in the immediate vicinity, the frequency of occurrence of moderate (AQIPM10 4) and sufficient air quality (AQIPM10 3) was even higher than the frequency observed for locations with more traffic.
The analysis of frequency of particular classes of AQIPM2.5 confirms earlier conclusions concerning the assessment of air quality at the given locations. Direct comparison of the occurrence rates of individual classes of AQIPM2.5 and AQIPM10 confirms the expected greater impact of traffic-related emission of PM2.5 on air quality in the vicinity of roads. The calculated AQIPM2.5 for all considered locations indicates significantly more frequent situations in which local pollution hotspots occur. Therefore, monitoring PM2.5 concentrations in the vicinity of roads should be a priority for the city of Bielsko-Biała.
In the next Section, a model for predicting PM2.5 concentrations is formulated based on transit times in the intersection area, meteorological data and PM10 background concentration.

3.4. Prediction of the PM2.5 Concentration in the Area of Intersections

Data collected during our study by using the system enables the formulation of a prediction model of PM2.5 concentrations. In practical applications, the prediction of traffic-related pollutant concentrations is performed on the basis of historical data using models based on multiple linear regression [44,45], neural network models [46] and also models based on advanced data mining methods such as random forest [47]. Due to the generalizability of the data and in view of the non-linear relationship between PM2.5 concentration levels and traffic conditions in the intersection area [31], in this work, a multi-layer feed-forward neural network is proposed for predicting the hourly average concentration of PM2.5. The following hourly mean meteorological parameters were used as independent predictor variables: wind direction, wind speed, relative humidity and temperature of the air. The next predictor variable used is hourly PM10 background concentration registered by the city’s regulatory air quality monitoring network, in lieu of the PM2.5 background concentration (unavailable). Traffic characteristics are given by values of transit times i.e., median of transit times and 85-percentile of transit times for a given hour. Local ventilation conditions are characterized by the SVF.
After preliminary testing of the learning ability, the network architecture 8-X-X-1 with two hidden layers was applied. This nomenclature means that the network has eight input signals (all values are normalized values of predictor variables), two hidden layers and one neuron on the output layer (representing PM2.5 concentration at an intersection). The number of neurons per hidden layers was chosen as a result of calculations of the values of minimum prediction errors obtained for the learning set. As a result of that process, on the first hidden layer there are 24 neurons and 8 on the second hidden layer. As the neuron activation function, a bipolar sigmoid function was used, taking the form:
f w T z = 1 + 2 1 + e 0.05 w T z 1
where w and z are vectors of weights and input signals, respectively. Initial weighting values were selected randomly and then the learning process was carried out. Vectors of input parameters were also selected randomly. One third of all hourly concentration data gathered by the low-cost system in the period of analysis was used as the learning set. For the network learning, the gradient descent algorithm with a momentum term was used, i.e., (n + 1) new weights are calculated iteratively [48]:
w n + 1 = w n η n Ω n + δ w n w n 1
where η is the learning coefficient, is the mean square error of the network’s response and δ is a momentum factor.
The learning of the network was performed until the network reached a level of error of prediction below 10 µg/m3 (which is the lowest value of any uncertainty level for the PMS sensors used in the study) for 85% of the cases in the entire learning set. (The level of 85% of total cases was set arbitrarily).
Finally, as the validation step of the proposed model, the prediction error was calculated using the neural network for each record in the remaining two thirds of the measurement data set. This means that records used for learning were not used in the validation. A scatterplot for hourly concentration of PM2.5 recorded by the system and predicted using a model for traffic and meteorological data considered in the validation set is presented in Figure 10. In turn, the comparison of AQI classes set on the base of hourly concentration of PM2.5 recorded by the system and predicted using a model for traffic and meteorological data considered in the validation set is presented in Figure 11.
Metrics used for the evaluation of model accuracy for predicting the hourly mean PM2.5 concentration are summarized in Table 8. We used these metrics in evaluating the model in order to address the following main questions:
  • How good are correlated values of calculated concentrations from model and real concentrations?;
  • How large a mean error for the calculated concentration of PM2.5 can be expected?;
  • Does the model have a tendency to overestimate or underestimate the calculated concentration of PM2.5?;
  • In how many cases is the model’s prediction of AQIPM2.5 false?
The obtained values of validation metrics for the model predicting PM2.5 concentration in the area of intersections lead to the following conclusions:
  • The fact that R2 > 0.85 indicates that the adopted set of input parameters allows mapping of local conditions and prediction of PM2.5 concentration in the areas of intersections not covered by direct measurements;
  • MAE is below 10 µg/m3 and thus the mean absolute error for the model is lower than the level of uncertainty of measurement;
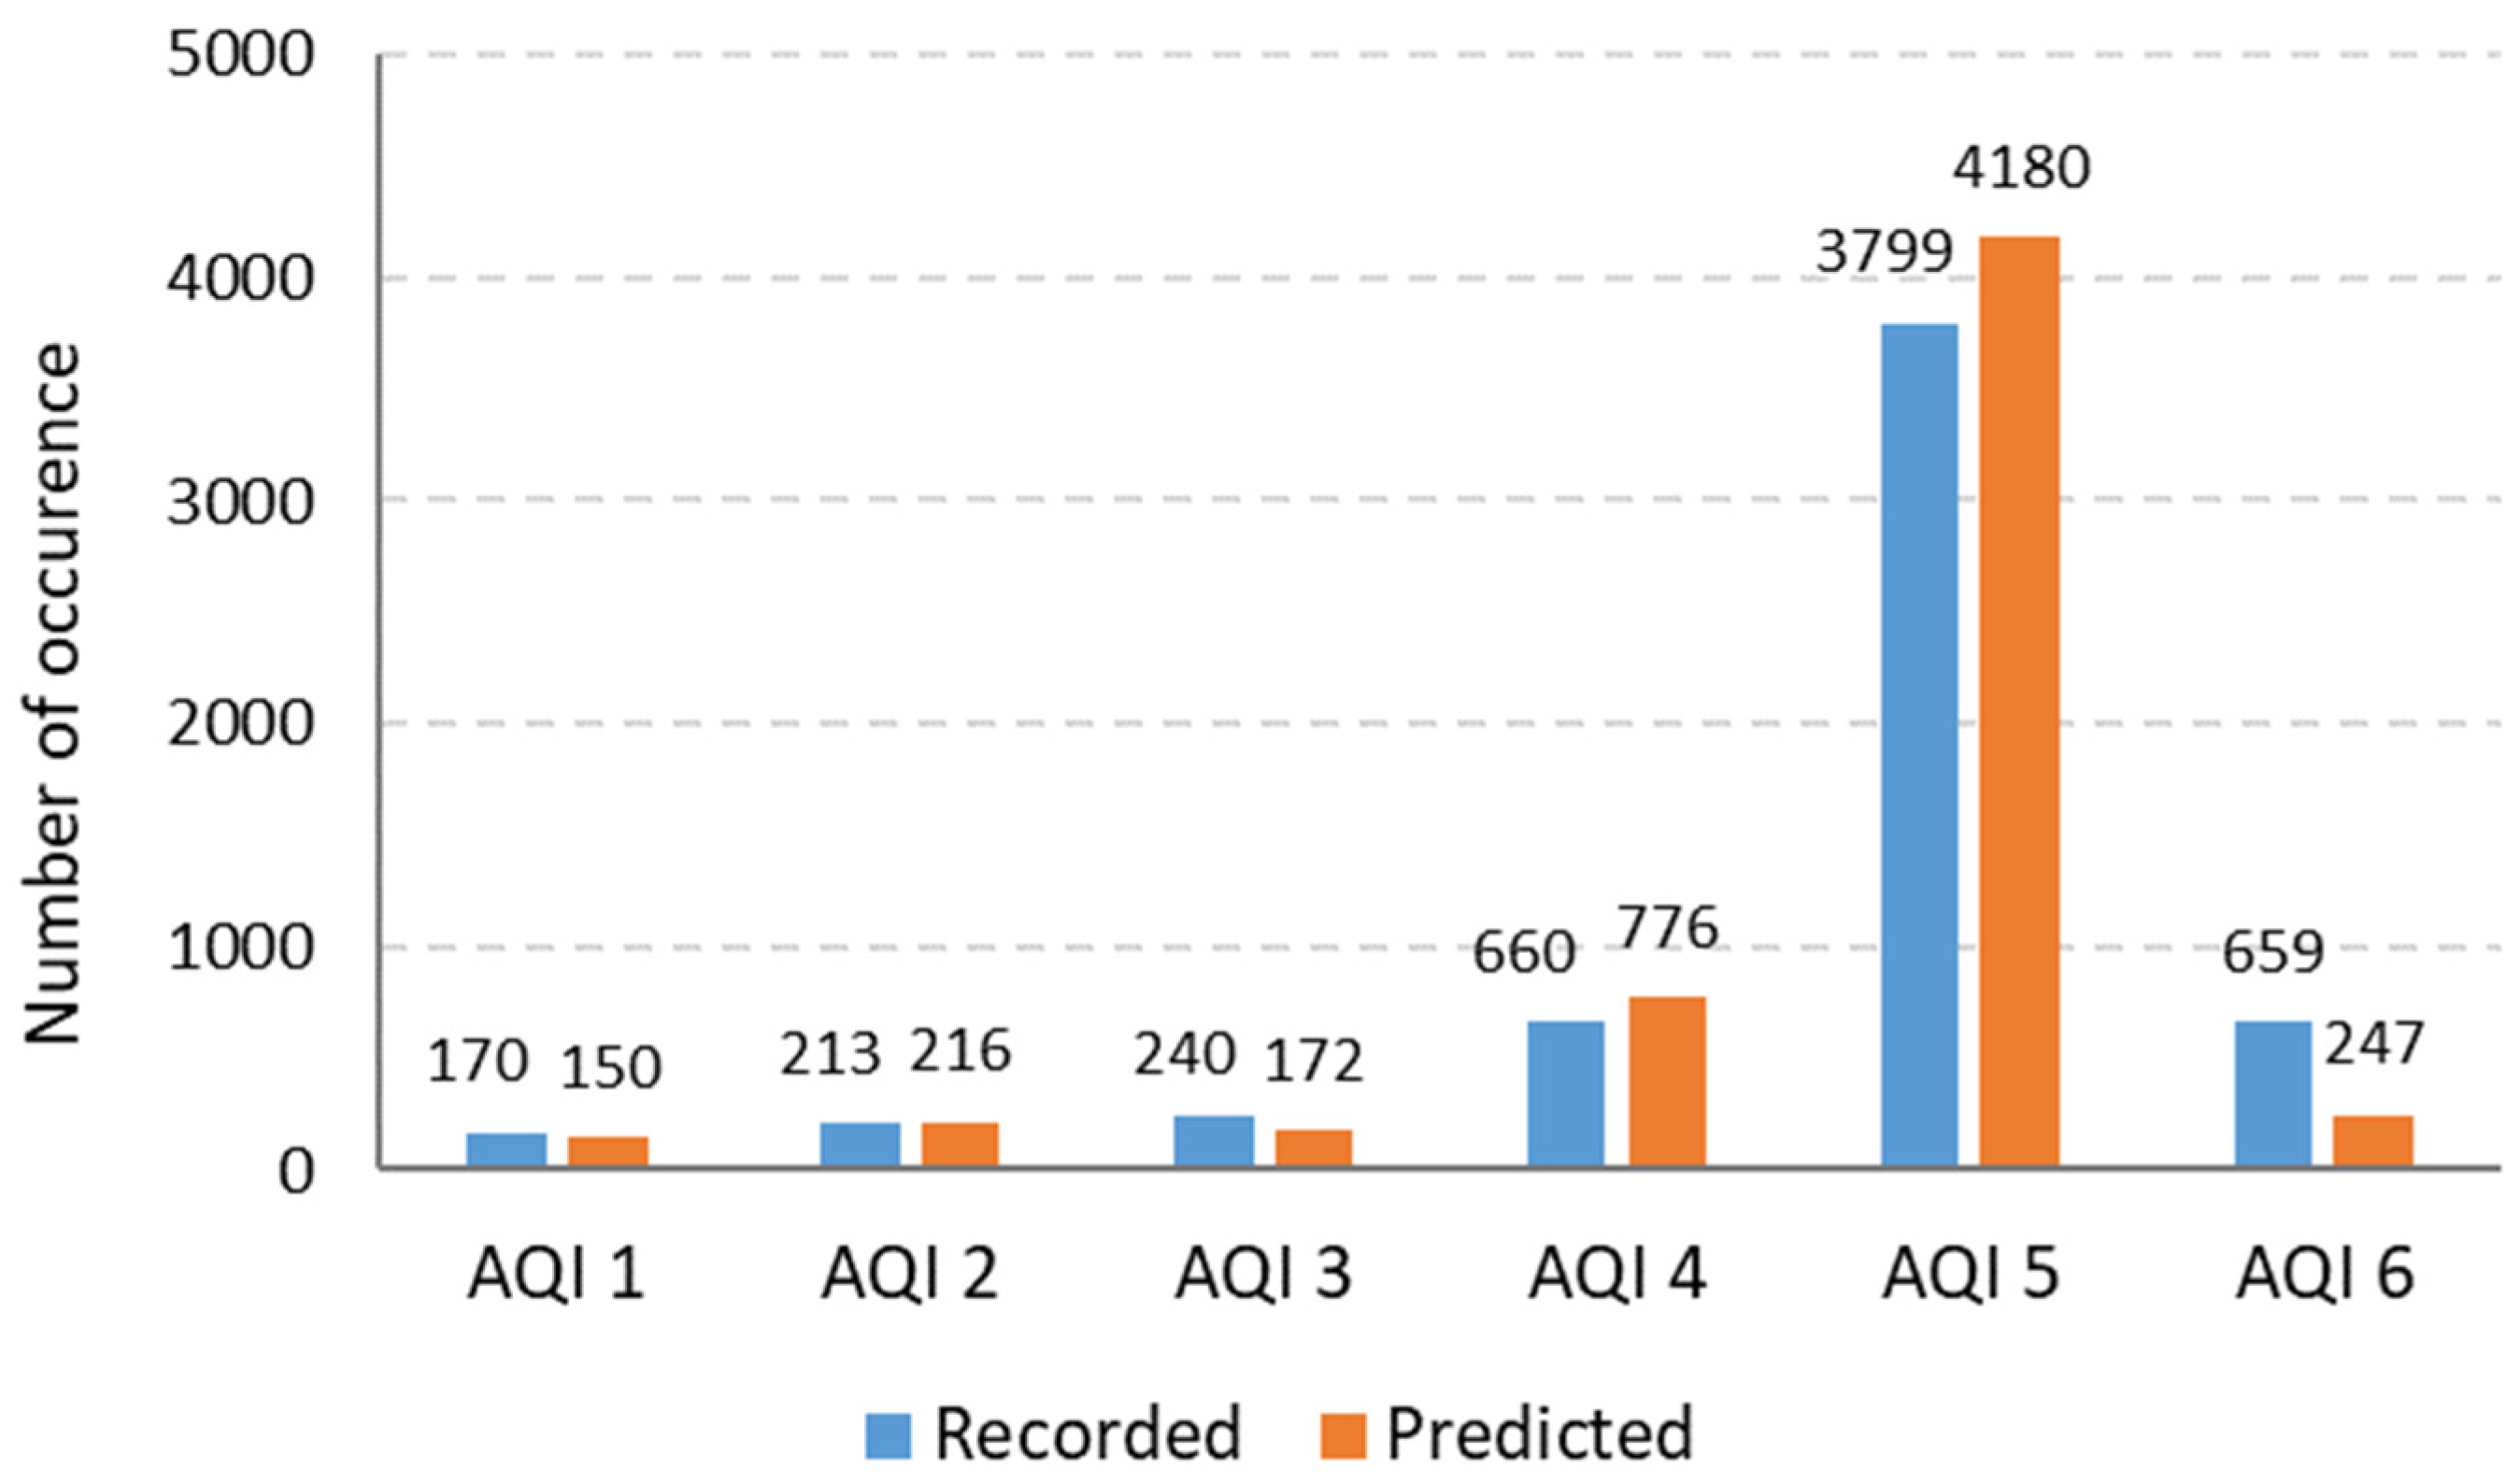
  • MAPE for the entire data set is 24%, with higher percentage errors to be expected in the case of low concentration levels (AQIPM2.5 6)—indeed for this subset of data the average percentage error is 47%;
  • The FB value, which for an ideal model is equal to zero, indicates a slight tendency of the model to overestimate concentrations;
  • The NMSE value, which is a measure that emphasizes the scatter in the entire data set has a small value;
  • The Hit rate indicates in how many cases the conformity of the predicted and recorded air quality index was obtained. These metrics show that the model correctly indicated AQIPM2.5 in 72% of cases. The slight tendency to overestimate PM2.5 concentrations (FB < 0) translates into an indication of a lower than true air quality index in 19% of cases. This means that the model indicates more favorable conditions than are recorded in only 9% of cases.
The assessment presented in this paper indicates that the neural network with the proposed set of input predictor variables is an effective method for predicting air quality i.e., it can be used for extending the low-cost system functionality at locations where OnDynamic system stations only record transit times.

4. Conclusions

The challenge of maintaining the required level of mobility and air quality in cities can be met by deploying a traffic management system covering a sufficiently extensive area. In such a system, the urban area should be monitored to identify potential pollution hotspots using a network of sensors. An integrated low-cost system for simultaneous monitoring of traffic and pollutant concentration at intersections was presented in this paper. The practical usefulness of the system is ensured by the small external dimensions of the stations, their low energy demand and the capability for almost continuous data transmission. In addition, a PM2.5 concentration prediction model was formulated, increasing the functionality of the system. To summarise the findings, the main conclusions are as follows:
  • During the three months analyzed, for 5–10% of the total time the recorded PM concentrations at individual locations in Bielsko-Biała indicated unacceptable air quality;
  • Traffic emission of PM2.5 more frequently lead to hotspot formation;
  • Traffic-derived carbon monoxide emissions only slightly deteriorated the air quality in the vicinity of roads;
  • Despite the close mutual proximity of the locations, the volume of traffic, traffic conditions and the immediate surroundings lead to significant variations in air quality;
  • Transit time is a useful parameter characterizing traffic at intersections;
  • A neural network-based model can be used to predict air quality due to PM2.5 concentrations at intersections, with acceptable accuracy;
  • At locations with adverse ventilation conditions, a tendency to higher frequency of occurrence of moderate (AQIPM10 4) and sufficient air quality (AQIPM10 3) than in other locations even with more traffic was recognized. This confirms the important role of local conditions determining traffic-related pollution emission and dispersion, although, naturally, the general likelihood of local hotspots increases with increased urban background levels.
The system used in this study simultaneously performs monitoring of transit times at intersections and pollutant concentrations in the vicinity of roads. Data gathered by the system can be used to assess the level of exposure to air pollution in the vicinity of roads.

Author Contributions

Conceptualization, K.B. and A.M.; Methodology, K.B. and A.R.; Formal analysis, K.B.; Investigation, K.B. and A.R.; Resources, A.R.; Software, A.R. and A.M.; Visualization, A.R.; Writing—original draft, K.B.; Writing—review & editing, A.R. and A.M. All authors have read and agreed to the published version of the manuscript.

Funding

This research received no external funding.

Conflicts of Interest

The authors declare no conflict of interest.

References

  1. World Health Organization (WHO). Ambient (Outdoor) Air Pollution. Available online: http://www.who.int/news-room/fact-sheets/detail/ambient-(outdoor)-air-quality-and-health (accessed on 20 November 2021).
  2. The National Centre for Emissions Management (KOBIZE). Poland’s Informative Inventory Report. 2019. Available online: https://www.kobize.pl/uploads/materialy/materialy_do_pobrania/krajowa_inwentaryzacja_emisji/IIR_2019_Poland.pdf (accessed on 20 November 2021).
  3. European Environment Agency (EEA). Europe’s Urban Air Quality—Re-Assessing Implementation Challenges in Cities; EEA Report No 24/2018; Publications Office of the European Union: Luxembourg, 2019. [Google Scholar] [CrossRef]
  4. Munir, S.; Mayfield, M.; Coca, D.; Jubb, S.A. Structuring an integrated air quality monitoring network in large urban areas—Discussing the purpose, criteria and deployment strategy. Atmos. Environ. X 2019, 2, 100027. [Google Scholar] [CrossRef]
  5. Morawska, L.; Thai, P.K.; Liu, X.; Asumadu-Sakyi, A.; Ayoko, G.; Bartonova, A.; Bedini, A.; Chai, F.; Christensen, B.; Dunbabin, M.; et al. Applications of low-cost sensing technologies for air quality monitoring and exposure assessment: How far have they gone? Environ. Int. 2018, 116, 286–299. [Google Scholar] [CrossRef]
  6. Schneider, P.; Castell, N.; Vogt, M.; Dauge, F.R.; Lahoz, W.A.; Bartonova, A. Mapping urban air quality in near real-time using observations from low-cost sensors and model information. Environ. Int. 2017, 106, 234–247. [Google Scholar] [CrossRef]
  7. Weissert, L.F.; Alberti, K.; Miskell, G.; Pattinson, W.; Salmond, J.A.; Henshaw, G.; Williams, D.E. Low-cost sensors and microscale land use regression: Data fusion to resolve air quality variations with high spatial and temporal resolution. Atmos. Environ. 2019, 213, 285–295. [Google Scholar] [CrossRef]
  8. Weissert, L.; Alberti, K.; Miles, E.; Miskell, G.; Feenstra, B.; Henshaw, G.S.; Papapostolou, V.; Patel, H.; Polidori, A.; Salmond, J.A.; et al. Low-cost sensor networks and land-use regression: Interpolating nitrogen dioxide concentration at high temporal and spatial resolution in Southern California. Atmos. Environ. 2020, 223, 117287. [Google Scholar] [CrossRef] [Green Version]
  9. Miskell, G.; Alberti, K.; Feenstra, B.; Henshaw, G.S.; Papapostolou, V.; Patel, H.; Polidori, A.; Salmond, J.A.; Weissert, L.; Williams, D.E. Reliable data from low cost ozone sensors in a hierarchical network. Atmos. Environ. 2019, 214, 116870. [Google Scholar] [CrossRef] [Green Version]
  10. Lin, Y.-C.; Chi, W.-J.; Lin, Y.-Q. The improvement of spatial-temporal resolution of PM2.5 estimation based on micro-air quality sensors by using data fusion technique. Environ. Int. 2020, 134, 105305. [Google Scholar] [CrossRef]
  11. Cao, R.; Li, B.; Wang, Z.; Peng, Z.-R.; Tao, S.; Lou, S. Using a distributed air sensor network to investigate the spatiotemporal patterns of PM2.5 concentrations. Environ. Pollut. 2020, 264, 114549. [Google Scholar] [CrossRef]
  12. Badura, M.; Sówka, I.; Szymański, P.; Batog, P. Assessing the usefulness of dense sensor network for PM2.5 monitoring on an academic campus area. Sci. Total Environ. 2020, 722, 137867. [Google Scholar] [CrossRef] [PubMed]
  13. Mihăiţă, A.S.; Dupont, L.; Chery, O.; Camargo, M.; Cai, C. Evaluating air quality by combining stationary, smart mobile pollution monitoring and data-driven modelling. J. Clean. Prod. 2019, 221, 398–418. [Google Scholar] [CrossRef]
  14. Lim, C.C.; Kim, H.; Vilcassim MJ, R.; Thurston, G.D.; Gordon, T.; Chen, L.-C.; Lee, K.; Heimbinder, M.; Kim, S.-Y. Mapping urban air quality using mobile sampling with low-cost sensors and machine learning in Seoul, South Korea. Environ. Int. 2019, 131, 105022. [Google Scholar] [CrossRef] [PubMed]
  15. de Souza, P.; Anjomshoaa, A.; Duarte, F.; Kahn, R.; Kumar, P.; Ratti, C. Air quality monitoring using mobile low-cost sensors mounted on trash-trucks: Methods development and lessons learned. Sustain. Cities Soc. 2020, 60, 102239. [Google Scholar] [CrossRef]
  16. Kaivonen, S.; Ngai, E.C.-H. Real-time air pollution monitoring with sensors on city bus. Digit. Commun. Netw. 2020, 6, 23–30. [Google Scholar] [CrossRef]
  17. Lee, C.C.; Tran, M.; Choo, C.W.; Tan, C.P.; Chiew, Y.S. Evaluation of air quality in Sunway City, Selangor, Malaysia from a mobile monitoring campaign using air pollution micro-sensors. Environ. Pollut. 2020, 265, 115058. [Google Scholar] [CrossRef]
  18. Gressent, A.; Malherbe, L.; Colette, A.; Rollin, H.; Scimia, R. Data fusion for air quality mapping using low-cost sensor observations: Feasibility and added-value. Environ. Int. 2020, 143, 105965. [Google Scholar] [CrossRef]
  19. Adams, M.D.; Massey, F.; Chastko, K.; Cupini, C. Spatial modelling of particulate matter air pollution sensor measurements collected by community scientists while cycling, land use regression with spatial cross-validation, and applications of machine learning for data correction. Atmos. Environ. 2020, 230, 117479. [Google Scholar] [CrossRef]
  20. SM, S.N.; Reddy Yasa, P.; MV, N.; Khadirnaikar, S.; Rani, P. Mobile monitoring of air pollution using low cost sensors to visualize spatio-temporal variation of pollutants at urban hotspots. Sustain. Cities Soc. 2019, 44, 520–535. [Google Scholar] [CrossRef]
  21. Ma, X.; Longley, I.; Gao, J.; Salmond, J. Assessing schoolchildren’s exposure to air pollution during the daily commute—A systematic review. Sci. Total Environ. 2020, 737, 140389. [Google Scholar] [CrossRef] [PubMed]
  22. Abbass, R.A.; Kumar, P.; El-Gendy, A. Car users exposure to particulate matter and gaseous air pollutants in megacity Cairo. Sustain. Cities Soc. 2020, 56, 102090. [Google Scholar] [CrossRef]
  23. Feenstra, B.; Papapostolou, V.; Hasheminassab, S.; Zhang, H.; Boghossian, B.D.; Cocker, D.; Polidori, A. Performance evaluation of twelve low-cost PM2.5 sensors at an ambient air monitoring site. Atmos. Environ. 2019, 216, 116946. [Google Scholar] [CrossRef]
  24. Kosmopoulos, G.; Salamalikis, V.; Pandis, S.N.; Yannopoulos, P.; Bloutsos, A.A.; Kazantzidis, A. Low-cost sensors for measuring airborne particulate matter: Field evaluation and calibration at a South-Eastern European site. Sci. Total Environ. 2020, 748, 141396. [Google Scholar] [CrossRef] [PubMed]
  25. Liu, X.; Jayaratne, R.; Thai, P.; Kuhn, T.; Zing, I.; Christensen, B.; Lamont, R.; Dunbabin, M.; Zhu, S.; Gao, J.; et al. Low-cost sensors as an alternative for long-term air quality monitoring. Environ. Res. 2020, 185, 109438. [Google Scholar] [CrossRef]
  26. Mahajan, S.; Kumar, P. Evaluation of low-cost sensors for quantitative personal exposure monitoring. Sustain. Cities Soc. 2020, 57, 102076. [Google Scholar] [CrossRef]
  27. Qin, X.; Hou, L.; Gao, J.; Si, S. The evaluation and optimization of calibration methods for low-cost particulate matter sensors: Inter-comparison between fixed and mobile methods. Sci. Total Environ. 2020, 715, 136791. [Google Scholar] [CrossRef]
  28. Statistics Poland, Statistical Office in Katowice. Statistical Vademecum of Regional Servant. 2019. Available online: http://katowice/stat.gov.pl (accessed on 20 November 2021).
  29. Environmental Protection Inspectorate. Wskaźniki Średniego Narażenia na Pył PM2,5 dla Miast Powyżej 100 tyś. Mieszkańców i Aglomeracji Oraz Krajowy Wskaźnik Średniego Narażenia w 2017 Roku. Available online: https://powietrze.gios.gov.pl/pjp/content/exposure_dust_pm (accessed on 20 November 2021).
  30. European Environment Agency (EEA). European City Air Quality Viewer. Available online: https://www.eea.europa.eu/themes/air/urban-air-quality/european-city-air-quality-viewer (accessed on 20 November 2021).
  31. Brzozowski, K.; Ryguła, A.; Maczyński, A. The use of low-cost sensors for air quality analysis in road intersections. Transp. Res. Part D Transp. Environ. 2019, 77, 198–211. [Google Scholar] [CrossRef]
  32. Brzozowski, K.; Konior, A.; Maczyński, A.; Ryguła, A. An extension of real-time traffic monitoring system with air quality module. In Proceedings of the International Scientific Conference on Transport Means, Juodkrantė, Lithuania, 5–7 October 2016; Part I. pp. 75–79. [Google Scholar]
  33. Loga-Księska, W.; Sordyl, J.; Ryguła, A. Long-term urban traffic monitoring based on wireless multi-sensor network. Open Eng. 2020, 10, 197–208. [Google Scholar] [CrossRef]
  34. Pinto, J.A.; Kumar, P.; Alonso, M.F.; Andreão, W.L.; Pedruzzi, R.; Soares dos Santos, F.; Moreira, D.M.; Toledo de Almeida Albuquerque, T. Traffic data in air quality modeling: A review of key variables, improvements in results, open problems and challenges in current research. Atmos. Pollut. Res. 2020, 11, 454–468. [Google Scholar] [CrossRef]
  35. Brzozowski, K.; Maczyński, A.; Ryguła, A. Monitoring road traffic participants’ exposure to PM10 using a low-cost system. Sci. Total Environ. 2020, 728, 138718. [Google Scholar] [CrossRef] [PubMed]
  36. Environmental Protection Inspectorate. Polish Air Quality Index. Available online: https://powietrze.gios.gov.pl/pjp/current (accessed on 20 November 2021).
  37. Yang, J.; Shi, B.; Shi, Y.; Marvin, S.; Zheng, Y.; Xia, G. Air pollution dispersal in high density urban areas: Research on the triadic relation of wind, air pollution, and urban form. Sustain. Cities Soc. 2020, 54, 101941. [Google Scholar] [CrossRef]
  38. Carslaw, D.C.; Ropkins, K. Openair—An R package for air quality data analysis. Environ. Model. Softw. 2012, 27–28, 52–61. [Google Scholar] [CrossRef]
  39. Chapman, L.; Thornes, J.; Bradley, A. Rapid determination of canyon geometry parameters for use in surface radiation budgets. Theor. Appl. Climatol. 2001, 69, 81–89. [Google Scholar] [CrossRef]
  40. Eeftens, M.; Beekhuizen, J.; Beelen, R.; Wang, M.; Vermeulen, R.; Brunekreef, B.; Huss, A.; Hoek, G. Quantifying urban street configuration for improvements in air pollution models. Atmos. Environ. 2013, 72, 1–9. [Google Scholar] [CrossRef]
  41. University of Gothenburg. Department of Earth Sciences. Technical Report: Sky View Factor Calculator. User Manual Version 1.1. Available online: https://cms.it.gu.se/infoglueDeliverWorking/digitalAssets/1377/1377754_skyviewfactorcalculator-user-manual.pdf (accessed on 20 November 2021).
  42. R Core Team. R: A Language and Environment for Statistical Computing; R Foundation for Statistical Computing: Vienna, Austria, 2020; Available online: https://www.R-project.org/ (accessed on 12 April 2021).
  43. Wickham, H. Ggplot2: Elegant Graphics for Data Analysis; Springer: New York, NY, USA, 2016. [Google Scholar]
  44. Pan, L.; Yao, E.; Yang, Y. Impact analysis of traffic-related air pollution based on real-time traffic and basic meteorological information. J. Environ. Manag. 2016, 183, 510–520. [Google Scholar] [CrossRef]
  45. Pérez-Martínez, P.J.; de Fátima Andrade, M.; de Miranda, R.M. Heavy truck restrictions and air quality implications in São Paulo, Brazil. J. Environ. Manag. 2017, 202, 55–68. [Google Scholar] [CrossRef] [PubMed]
  46. Adams, M.D.; Kanaroglou, P.S. Mapping real-time air pollution health risk for environmental management: Combining mobile and stationary air pollution monitoring with neural network models. J. Environ. Manag. 2016, 168, 133–141. [Google Scholar] [CrossRef] [PubMed]
  47. Kamińska, J.A. The use of random forests in modelling short-term air pollution effects based on traffic and meteorological conditions: A case study in Wrocław. J. Environ. Manag. 2018, 217, 164–174. [Google Scholar] [CrossRef]
  48. Kayacan, E.; Khanesar, M.A. Fuzzy Neural Networks for Real Time Control Applications: Concepts, Modeling and Algorithms for Fast Learning; Butterworth-Heinemann: Oxford, UK, 2016. [Google Scholar] [CrossRef]
Figure 1. Locations of the OnDynamic system sensors on the road network in Bielsko-Biała (BS—base station, EBS—extended base station allowing simultaneous recording of concentrations of CO and PM). Map source: OpenStreetMap.
Energies 14 08028 g001
Figure 2. The view of the OnDynamic’s extended base station (T/RH—temperature and relative humidity; BT—Bluetooth).
Energies 14 08028 g002
Figure 3. A sample graphic interface of the OnDynamic system. Map source: OpenStreetMap.
Energies 14 08028 g003
Figure 4. Wind conditions during the period under consideration. Figure generated using openair package [38].
Energies 14 08028 g004
Figure 5. Photographs of the surroundings at locations (L1–L5), taken using a fisheye lens.
Energies 14 08028 g005
Figure 6. Boxplot for the transit time observed at each location in the analyzed period (a) Weekday, (b) Weekend (box: 75th and 25th percentiles; whiskers: 10th and 90th percentiles; bold line: median). Figure generated using R [42].
Energies 14 08028 g006
Figure 7. The mean transit time values for individual hours of the day at locations: (a) L3, and (b) L5. Figure generated using the ggplot2 package [43].
Energies 14 08028 g007
Figure 8. Boxplot for the hourly mean concentrations of: (a) CO, and (b) PM fractions (PM2.5 on the left, PM10 on the right side of the label) observed at each location in the analyzed period (box: 75th and 25th percentiles; whiskers: 10th and 90th percentiles; bold line: median). Figure generated using R [42].
Energies 14 08028 g008
Figure 9. Polar plots for the maximum recorded hourly average concentration of PM10 (in µg/m3) for the urban background (a), and for individual locations (b) L1, (c) L2, (d) L3, (e) L4, (f) L5. Figure generated using openair package [38].
Energies 14 08028 g009aEnergies 14 08028 g009b
Figure 10. Scatterplot for hourly concentration of PM2.5 recorded by the system and calculated from a model for traffic and meteorological data considered in the validation set.
Energies 14 08028 g010
Figure 11. Comparison of AQI classes set on the base of hourly concentration of PM2.5 recorded by the system and predicted using a model for traffic and meteorological data considered in the validation set.
Energies 14 08028 g011
Table 1. The monitoring equipment set used for the study.
ComponentMeasuringUncertaintiesOperation Range
OnDynamicDetection of Bluetooth devicesN/A2.4–2.5 GHz
−20–50 °C
PMS5003 sensorParticulate matter concentration±10 µg/m3 for conc. ≤100 µg/m3
±10% for conc. ≥100 µg/m3
0–500 µg/m3
−10–60 °C
CO-B4 sensorCarbon monoxide concentration±4 ppb0–1000 ppm
−30–50 °C
Table 2. The air quality index classes, concerning maximum hourly average concentration of CO, PM2.5 and PM10 [36].
AQI ClassAQIx 6AQIx 5AQIx 4AQIx 3AQIx 2AQIx 1
Pollutant
CO (mg/m3)37111521>21
PM2.5 (µg/m3)13355575110>110
PM10 (µg/m3)205080110150>150
Table 3. Occurrence rates of overall air quality index classes at locations L1–L5.
Rate of Occurence (%)
AQI Class LocationAQIOV 6 AQIOV 5AQIOV 4AQIOV 3AQIOV 2AQIOV 1
L128.439.915.56.24.45.6
L221.551.313.44.74.74.4
L338.842.47.53.24.14
L441.144.55.83.52.92.2
L528.844.8136.243.2
Table 4. Occurrence rates of air quality index classes for urban PM10 background.
Rate of Occurrence (%)
AQI ClassAQIPM10(b) 6 AQIPM10(b) 5 AQIPM10(b) 4 AQIPM10(b) 3 AQIPM10(b) 2 AQIPM10(b) 1
Urban background55.639.73.21.20.30
Table 5. The SVF values determined for the locations analyzed.
LocationL1L2L3L4L5
SVF Value (−)0.920.860.960.940.58
Table 6. Traffic characteristics at individual locations (data from the city road administration).
Location L1L2L3L4L5
Traffic volume
(6 a.m.–6 p.m.)
(veh./12-h)
33,54733,39834,74823,95022,618
Morning peak (veh./h)30113158352623141943
Afternoon peak (veh./h)31093276359223472249
Average flow (veh./h)28372839291720161889
Share of heavy vehicles6%3%4%3%5%
Table 7. Occurrence rates of AQIPM10 and AQIPM2.5 at locations L1–L5.
Rate of Occurrence(%)
AQI Class LocationAQIPM10 6AQIPM10 5AQIPM10 4AQIPM10 3AQIPM10 2AQIPM10 1
L139.438.910.94.12.74
L233.4478.93.833.9
L344.940.663.42.42.7
L446.642.24.93.31.41.6
L536.545.1104.222.2
AQI Class LocationAQIPM2.5 6AQIPM2.5 5AQIPM2.5 4AQIPM2.5 3AQIPM2.5 2AQIPM2.5 1
L131.736.915.464.45.6
L224.94813.44.64.74.4
L349.731.77.33.24.14
L455.3315.43.22.92.2
L5334112.86.143.1
Table 8. Validation metrics and their values calculated for the model outputs ( o i and p i are concentrations observed and predicted by the model for the i-th h, respectively; o ¯ and p ¯ are the mean values).
MetricDefinitionCalculated Value
Coefficient of determination R 2 = 1 i = 1 N p i o ¯ 2 i = 1 N o i o ¯ 2 0.86
Mean Absolute Error M A E = 1 N i = 1 N p i o i 6.85 µg/m3
Mean Absolute Percentage Error M A P E = 1 N i = 1 N p i o i o i · 100 % 24%
Fractional Bias F B = o ¯ p ¯ 0.5 o ¯ + p ¯ −0.02
Normalized Mean Square Error N M S E = 1 N i = 1 N o i p i 2 o ¯ · p ¯ 0.14
Hit rate H i t   r a t e = 1 N i = 1 N 1   if   AQI o i = AQI p i 0 otherwise 0.72
Publisher’s Note: MDPI stays neutral with regard to jurisdictional claims in published maps and institutional affiliations.

