Review

Dielectric Strength of Polymeric Solid–Solid Interfaces under Dry-Mate and Wet-Mate Conditions

1
Electric Power Technology, SINTEF Energy Research, Sem Sælands vei 11, 7034 Trondheim, Norway
2
Electric Power Engineering, Norwegian University of Science and Technology, Høgskoleringen 1, 7491 Trondheim, Norway
Energies 2021, 14(23), 8067; https://doi.org/10.3390/en14238067
Submission received: 15 October 2021 / Revised: 18 November 2021 / Accepted: 26 November 2021 / Published: 2 December 2021
(This article belongs to the Special Issue Testing, Monitoring and Diagnostic of High Voltage Equipment)

Abstract

:
One of the most important causes of insulation system failure is the breakdown of the interface between two solid dielectrics; understanding the mechanisms governing this breakdown phenomenon is therefore critical. To that end, investigating and reviewing the practical limitations of the electrical breakdown strength of solid–solid interfaces present in insulating components is the primary objective of this work. The published literature from experimental and theoretical studies carried out in order to scrutinize the effects of the presence of solid–solid interfaces is investigated and discussed, considering macro, micro, and nano-scale characteristics. The reviewed literature suggests that solid–solid interfaces in accessories have non-uniform distributions of electrical fields within them in comparison to cables, where the distribution is mostly radial and symmetrical. Many agree that the elastic modulus (elasticity), radial/tangential pressure, surface smoothness/roughness, and dielectric strength of the ambient environment are the main parameters determining the tangential AC breakdown strength of solid–solid interfaces.

1. Introduction

Various insulating and conductive materials are used in electrical insulation systems. The alternating current (AC) breakdown strength (BDS) of an insulation system can be as high as the dielectric strength of the weakest link in the system. One of the most critical failure mechanisms within the insulation system is the electrical breakdown of the interface between two solid dielectrics. Therefore, it is essential to discover the breakdown mechanisms occurring at solid–solid interfaces. An electrical breakdown at the interface between two solid dielectrics has been reported to be the leading cause of insulation system failure [1]. Hence, studying the mechanisms governing this breakdown phenomenon is essential for improving insulation systems.
Surface irregularities cause discrete contact points that form when two rough, nominally flat surfaces are brought into contact. Numerous cavities arise between the contact spots. The factors influencing the interfacial dielectric strength are then related to the insulation properties of cavities (dimension, shape, and dielectric medium inside) and the contact area (treeing/tracking resistance, etc.). Therefore, this review concentrates on the dielectric properties of both cavities and contact spots in the macro, micro, and nano-scale to offer a holistic overview of the problem.
In this paper, a brief introduction to state-of-the-art connectors and cable apparatuses containing interfaces is provided. Particular attention is paid to the solid–solid interfaces, considering the causes of interfacial failure and important factors that influence the dielectric strength of an interface. Second, publications relevant to the scope of this review paper are summarized into two main categories: empirical studies on solid–solid interfaces and theoretical studies modeling the rough contact surfaces at solid–solid interfaces. The scope of the literature survey is illustrated in Figure 1.

2. Interfaces in State-of-the-Art Cable Connectors

In this section, an overview of modern connectors and the limiting factors involved in the design phase and in practice are given. In addition, a more general overview of solid–solid interfaces in polymer-insulated power cables is provided.

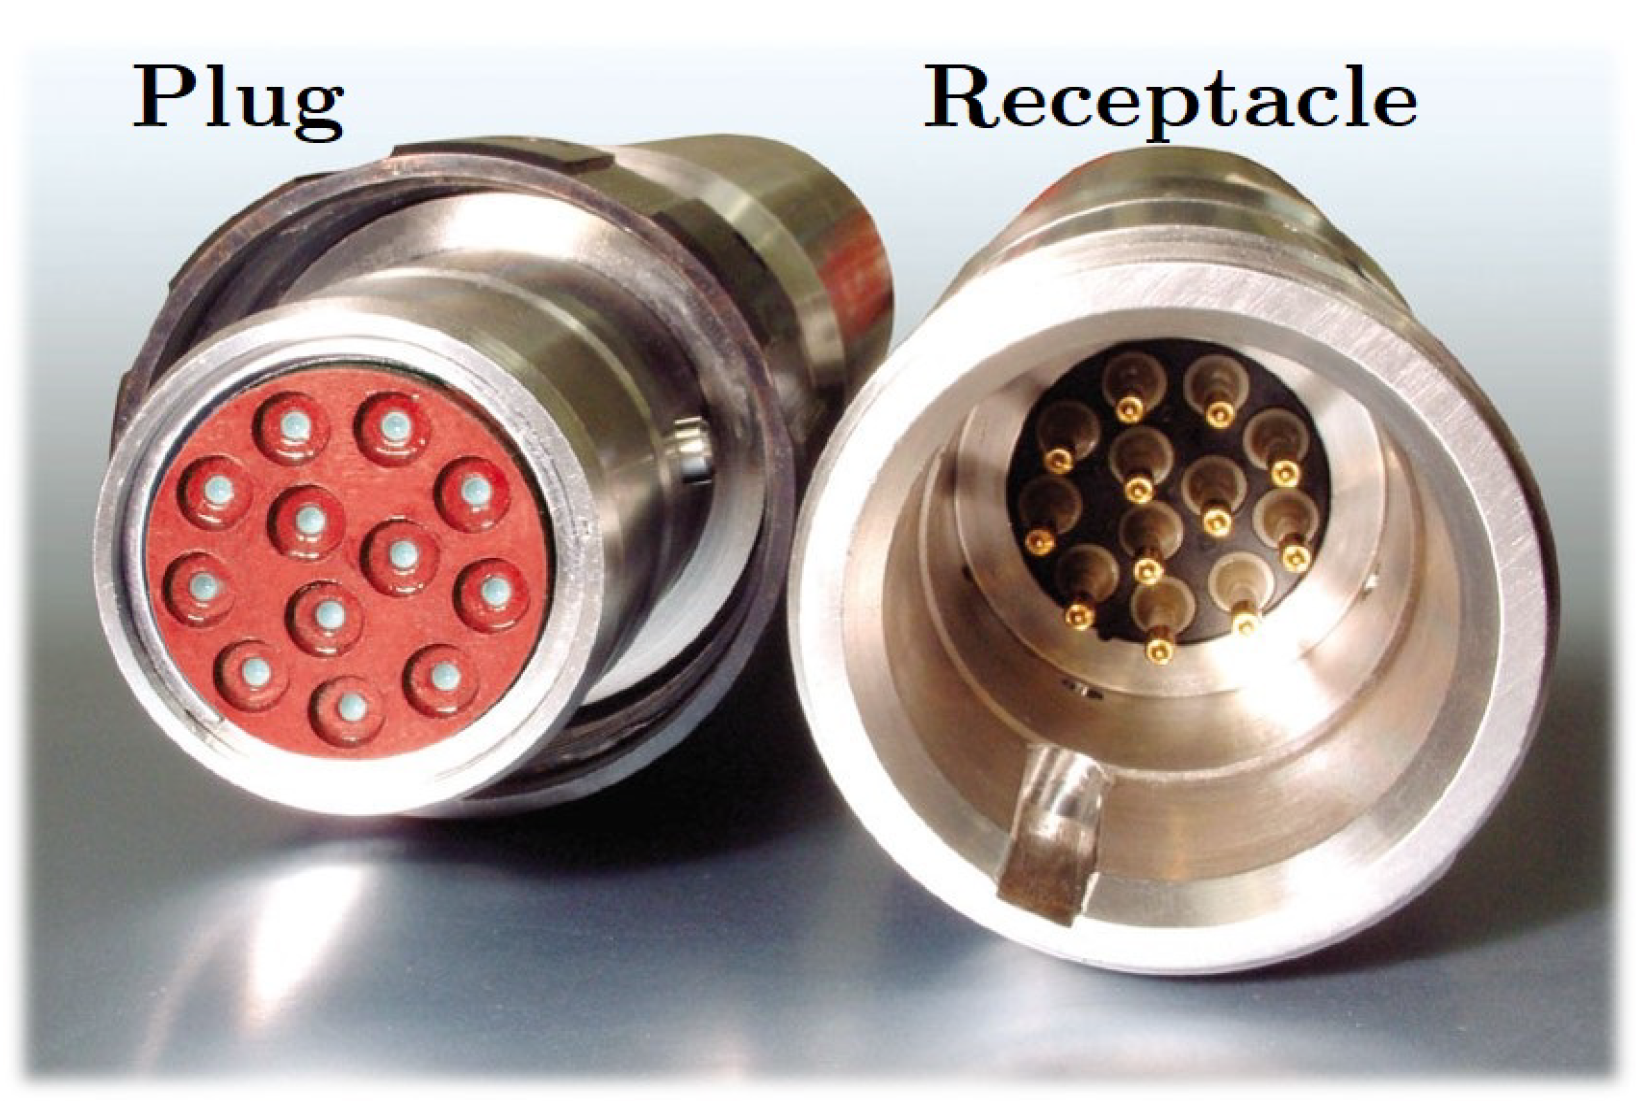
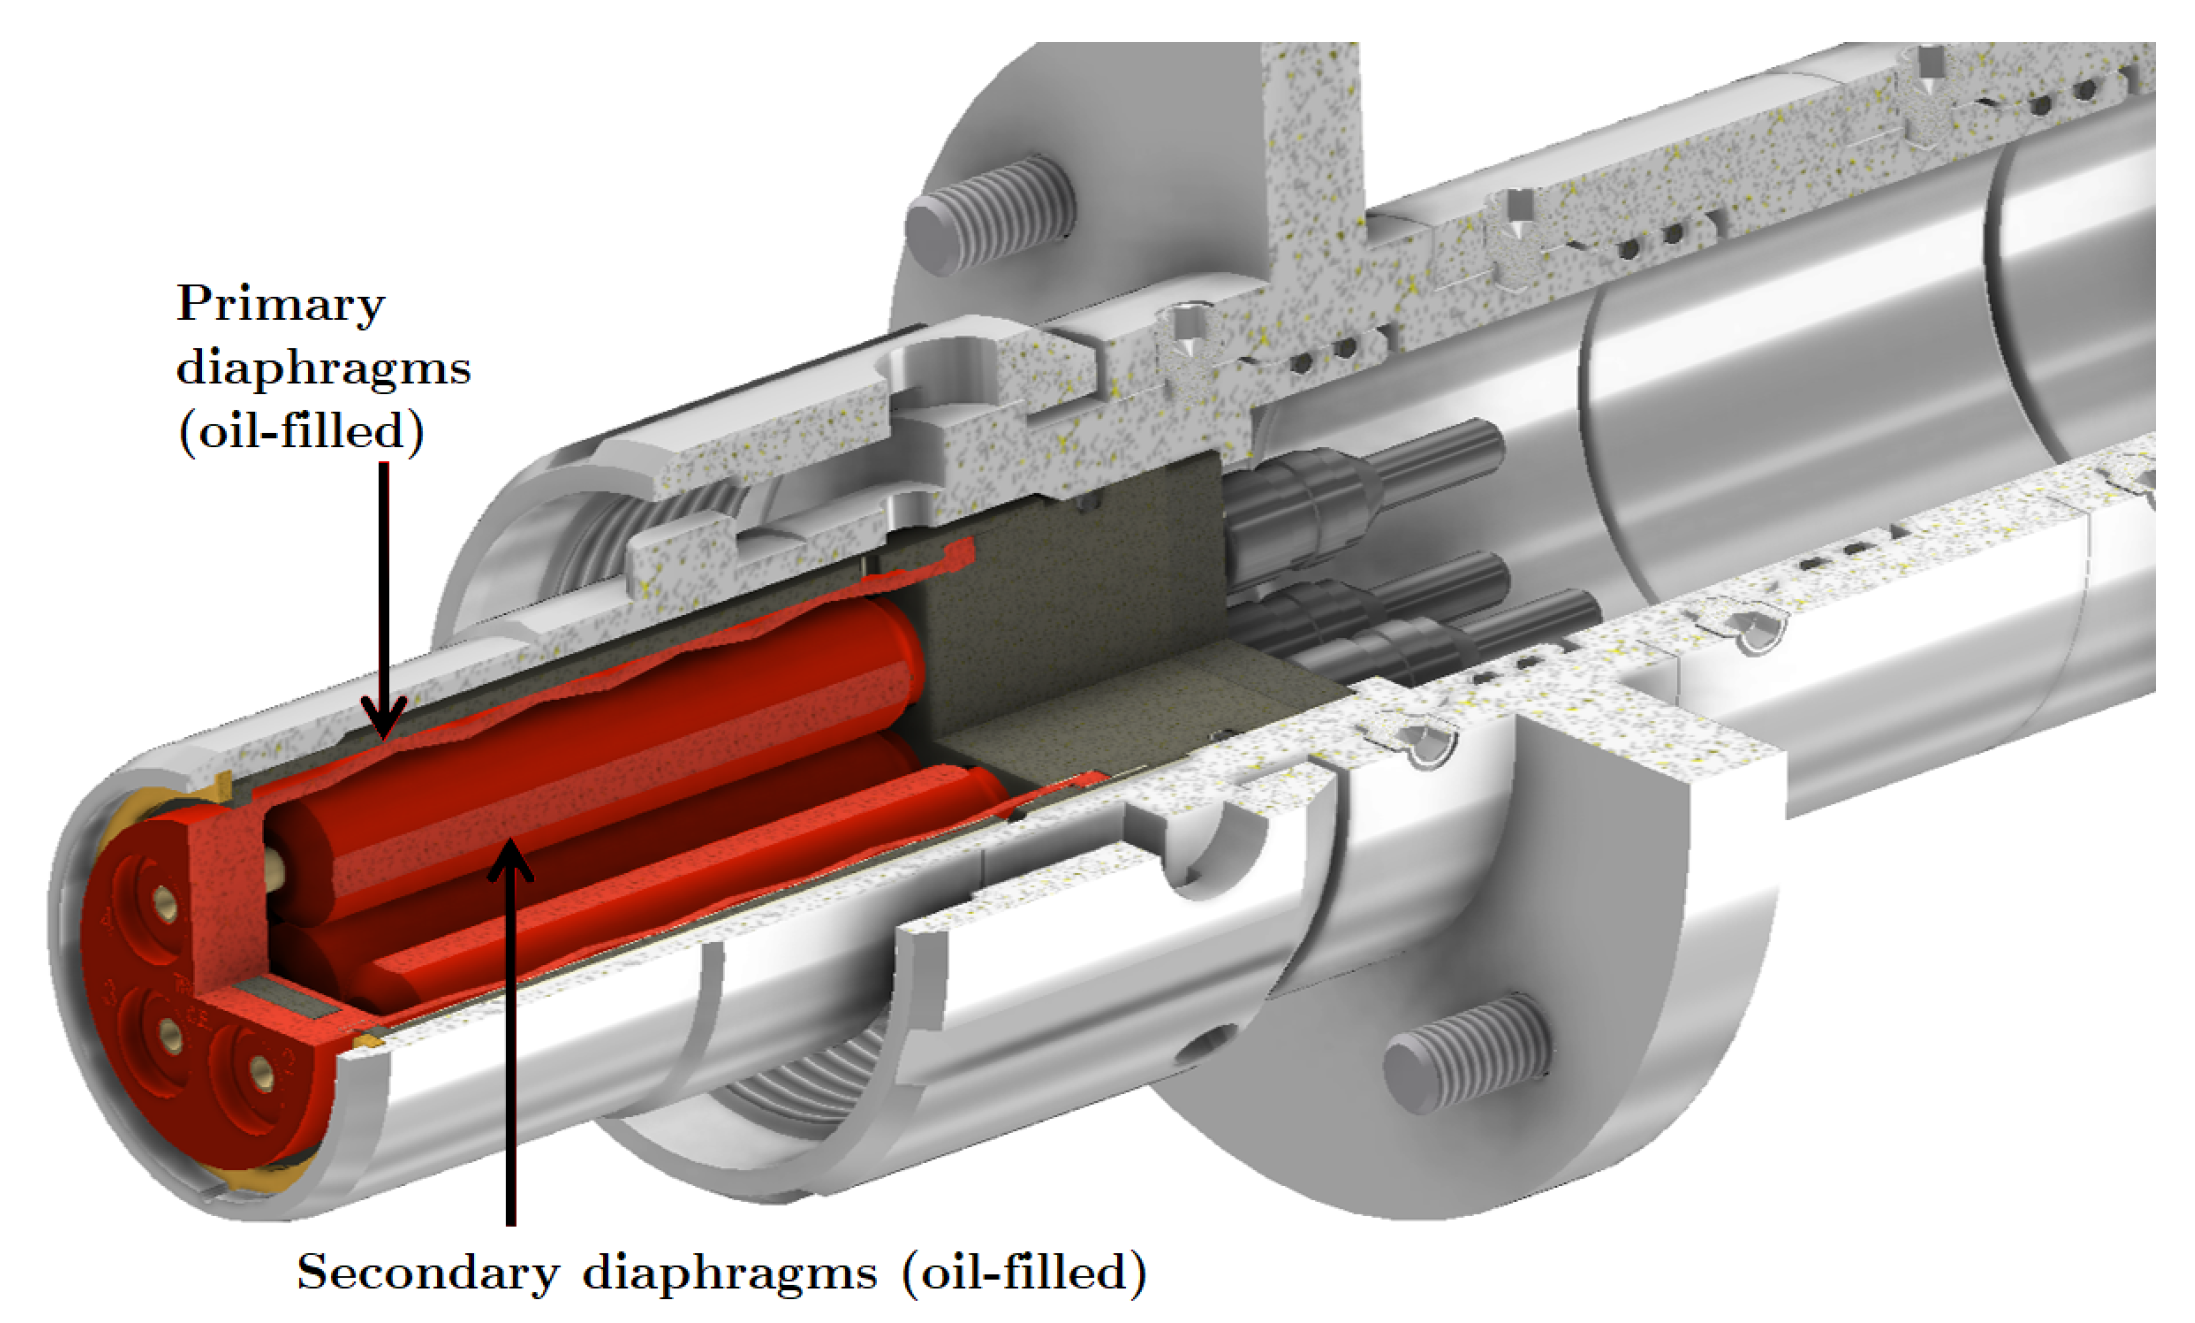
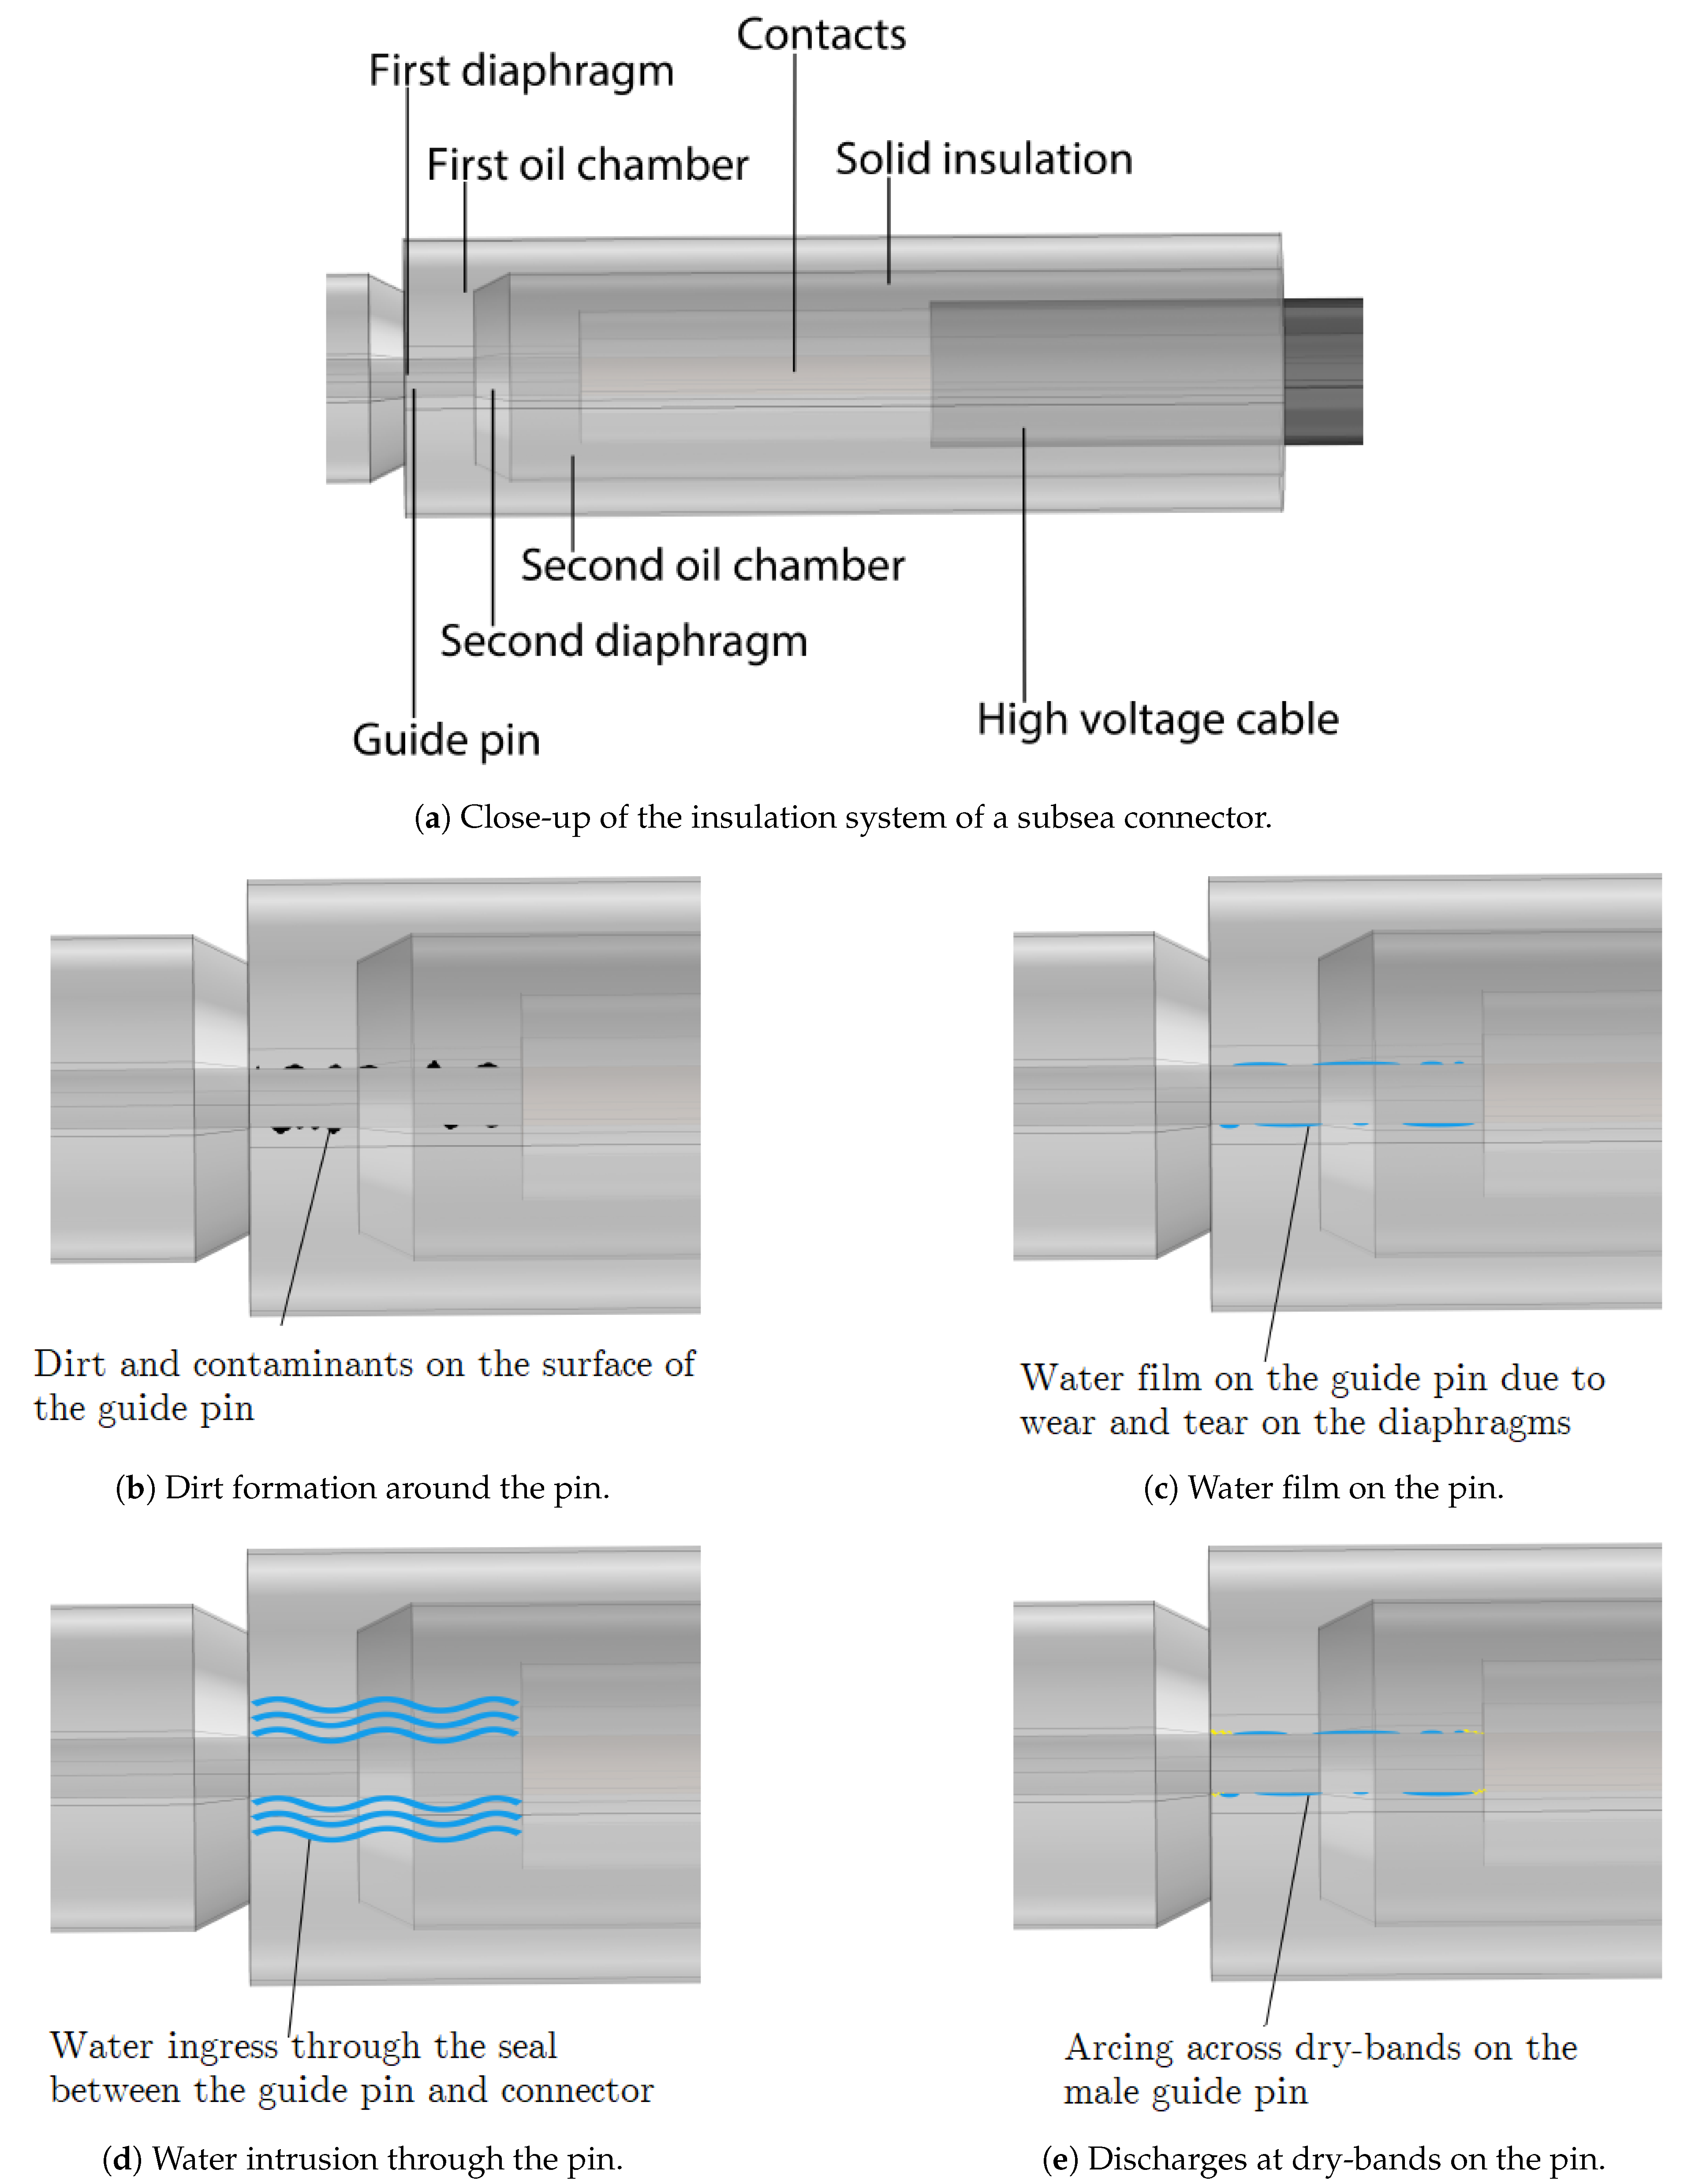
2.1. Interfaces in Subsea Cable Connections

Subsea cable connectors are a pertinent example of modern, sophisticated connector solutions available for cable connectors. They are categorized as “wet-mate” connectors, “dry-mate” connectors, and penetrators. A modern wet-mate connector is composed of a plug and a receptacle, as presented in Figure 2 [2]. In subsea applications, the retrieval of pumps or transformers for repairs on the surface is of paramount importance, and wet-mate connectors significantly facilitate performing this task [3,4,5]. Wet-mate connectors can be connected/disconnected underwater, allowing the equipment to be disconnected before retrieval to the surface and to be connected after being installed in the subsea grid [3,4,5,6,7]. On the other hand, dry-mate connectors require equipment to be assembled on a vessel along with the cable before being lowered to the seabed. Penetrators are essentially cable terminations, allowing high-voltage cables to be run through equipment enclosures [3]. High differential pressures are often tolerated by penetrators, and hence they allow equipment requiring a 1-atm environment to be connected [3].
Wet-mate subsea connectors have been in operation in the oil and gas industry for a long time because the plugging can take place in water/underwater effortlessly [3,4,5,7,8]. As the transition to “green energy” is gaining pace recently thanks to the increased awareness of climate change, wet-mate connectors are becoming increasingly popular in renewable energy applications such as offshore wind farms (both floating and fixed-bottom), tidal energy systems, and floating-type photovoltaic power stations (solar farms). However, recent and future subsea extensions require that the wet-mate connector technology be improved in a cost-effective manner so that it can provide higher power ratings with reduced losses and operate at higher voltages and higher temperatures, in deeper waters, and with longer tiebacks [3,4,5].
Currently, wet-mate cable connectors up to 45 kV (dry-mate connectors/penetrators up to 145 kV) are commercially available and applicable for deepwater and dynamic applications, including power umbilicals. Wet-mate connectors are crucial to future subsea substations or mid-point compensation for long high-voltage AC cables. The inter-array voltage level of 33 kV has been upgraded to 66 kV in modern offshore wind parks. The average capacity of an individual wind turbine is likely to increase to above 14 MW, which means the average total capacity of modern wind parks will also rise along with it. Within a few years, inter-array connections in offshore systems will likely require even higher voltage levels above 100 kV. This calls for higher voltage ratings, especially for wet-mate connectors used as vital components in future subsea inter-array grids (e.g., in junction boxes or subsea substations). Thus, further steps must be taken to achieve higher voltage levels (>220 kV for dry-mate, >100 kV for wet-mate) needed for AC longer step-out offshore electrification as a cost-efficient alternative to high-voltage DC.
A connector includes two different insulation systems within a controlled environment: one oil chamber is placed in the other, separated by a diaphragm, as illustrated in Figure 3. The main potentially weak parts in subsea connectors are the interfaces between the solid–solid and solid–liquid dielectric materials. Leading causes of failure are the presence of imperfections, defects, impurities at the interfaces, and water intrusion [1]. They are likely to result in locally high field stresses that, in turn, initiate surface discharges through the guide pin, possibly leading to a premature electrical breakdown.
Figure 4a illustrates an engaged subsea connector in operation. The main causes of failure are illustrated in Figure 4b–e at the plug component. Water ingress adversely influences the dielectric performance of insulating oil [6]. Several options exist, allowing water to penetrate the connector’s insulation; diffusion through the primary diaphragm is the most common mechanism. In fact, diffusion through the diaphragms inevitably occurs to some extent. Although diffusion is a gradual process, it leads to moderately elevated relative humidity (RH) inside the connector. Increased RH can easily be measured using pertinent readily available humidity sensors [6]. Additionally, dirt or water residue on the guide pin or diaphragms as well as mechanical damage may lead to water ingress (Figure 4b,c) [6]. Last but not least, while wet-mating, water may enter the oil. A thin conductive layer may also form on the guide pin as a result of inadequate contact pressure between the seal and the guide pin (Figure 4d) as well as the deformation/damage/aging/fatigue of the sealing material. The presence of conductive material will lead to locally high field stresses. Surface discharges through the guide pin may ensue, possibly leading to a complete flashover [6].
Analyzing a simplified geometry of a subsea connector using finite element methods (FEM) can help reveal problematic areas, as presented in Figure 5a. FEM analysis indicates that the edges where the guide pin engages with the first diaphragm have the greatest local electric field strength. The locally high electric stress holds a high potential for failure based on the voltage rating and material properties of the connector. Electric field grading techniques seem necessary to distribute the electric field more uniformly inside the connector. The tangential component of the electric field (along the pin), depicted in Figure 5b, suggests that the primary diaphragm and contact areas are likely to experience surface discharges. The reason for this is that, in the case that several of the mechanisms become present simultaneously, surface tracking or arcing along the dry bands between impurities, e.g., water droplets, may ensue, as illustrated in Figure 4e. The causes of failure presented here are not inherent only to subsea connectors. In the next section, we focus on solid–solid interfaces.

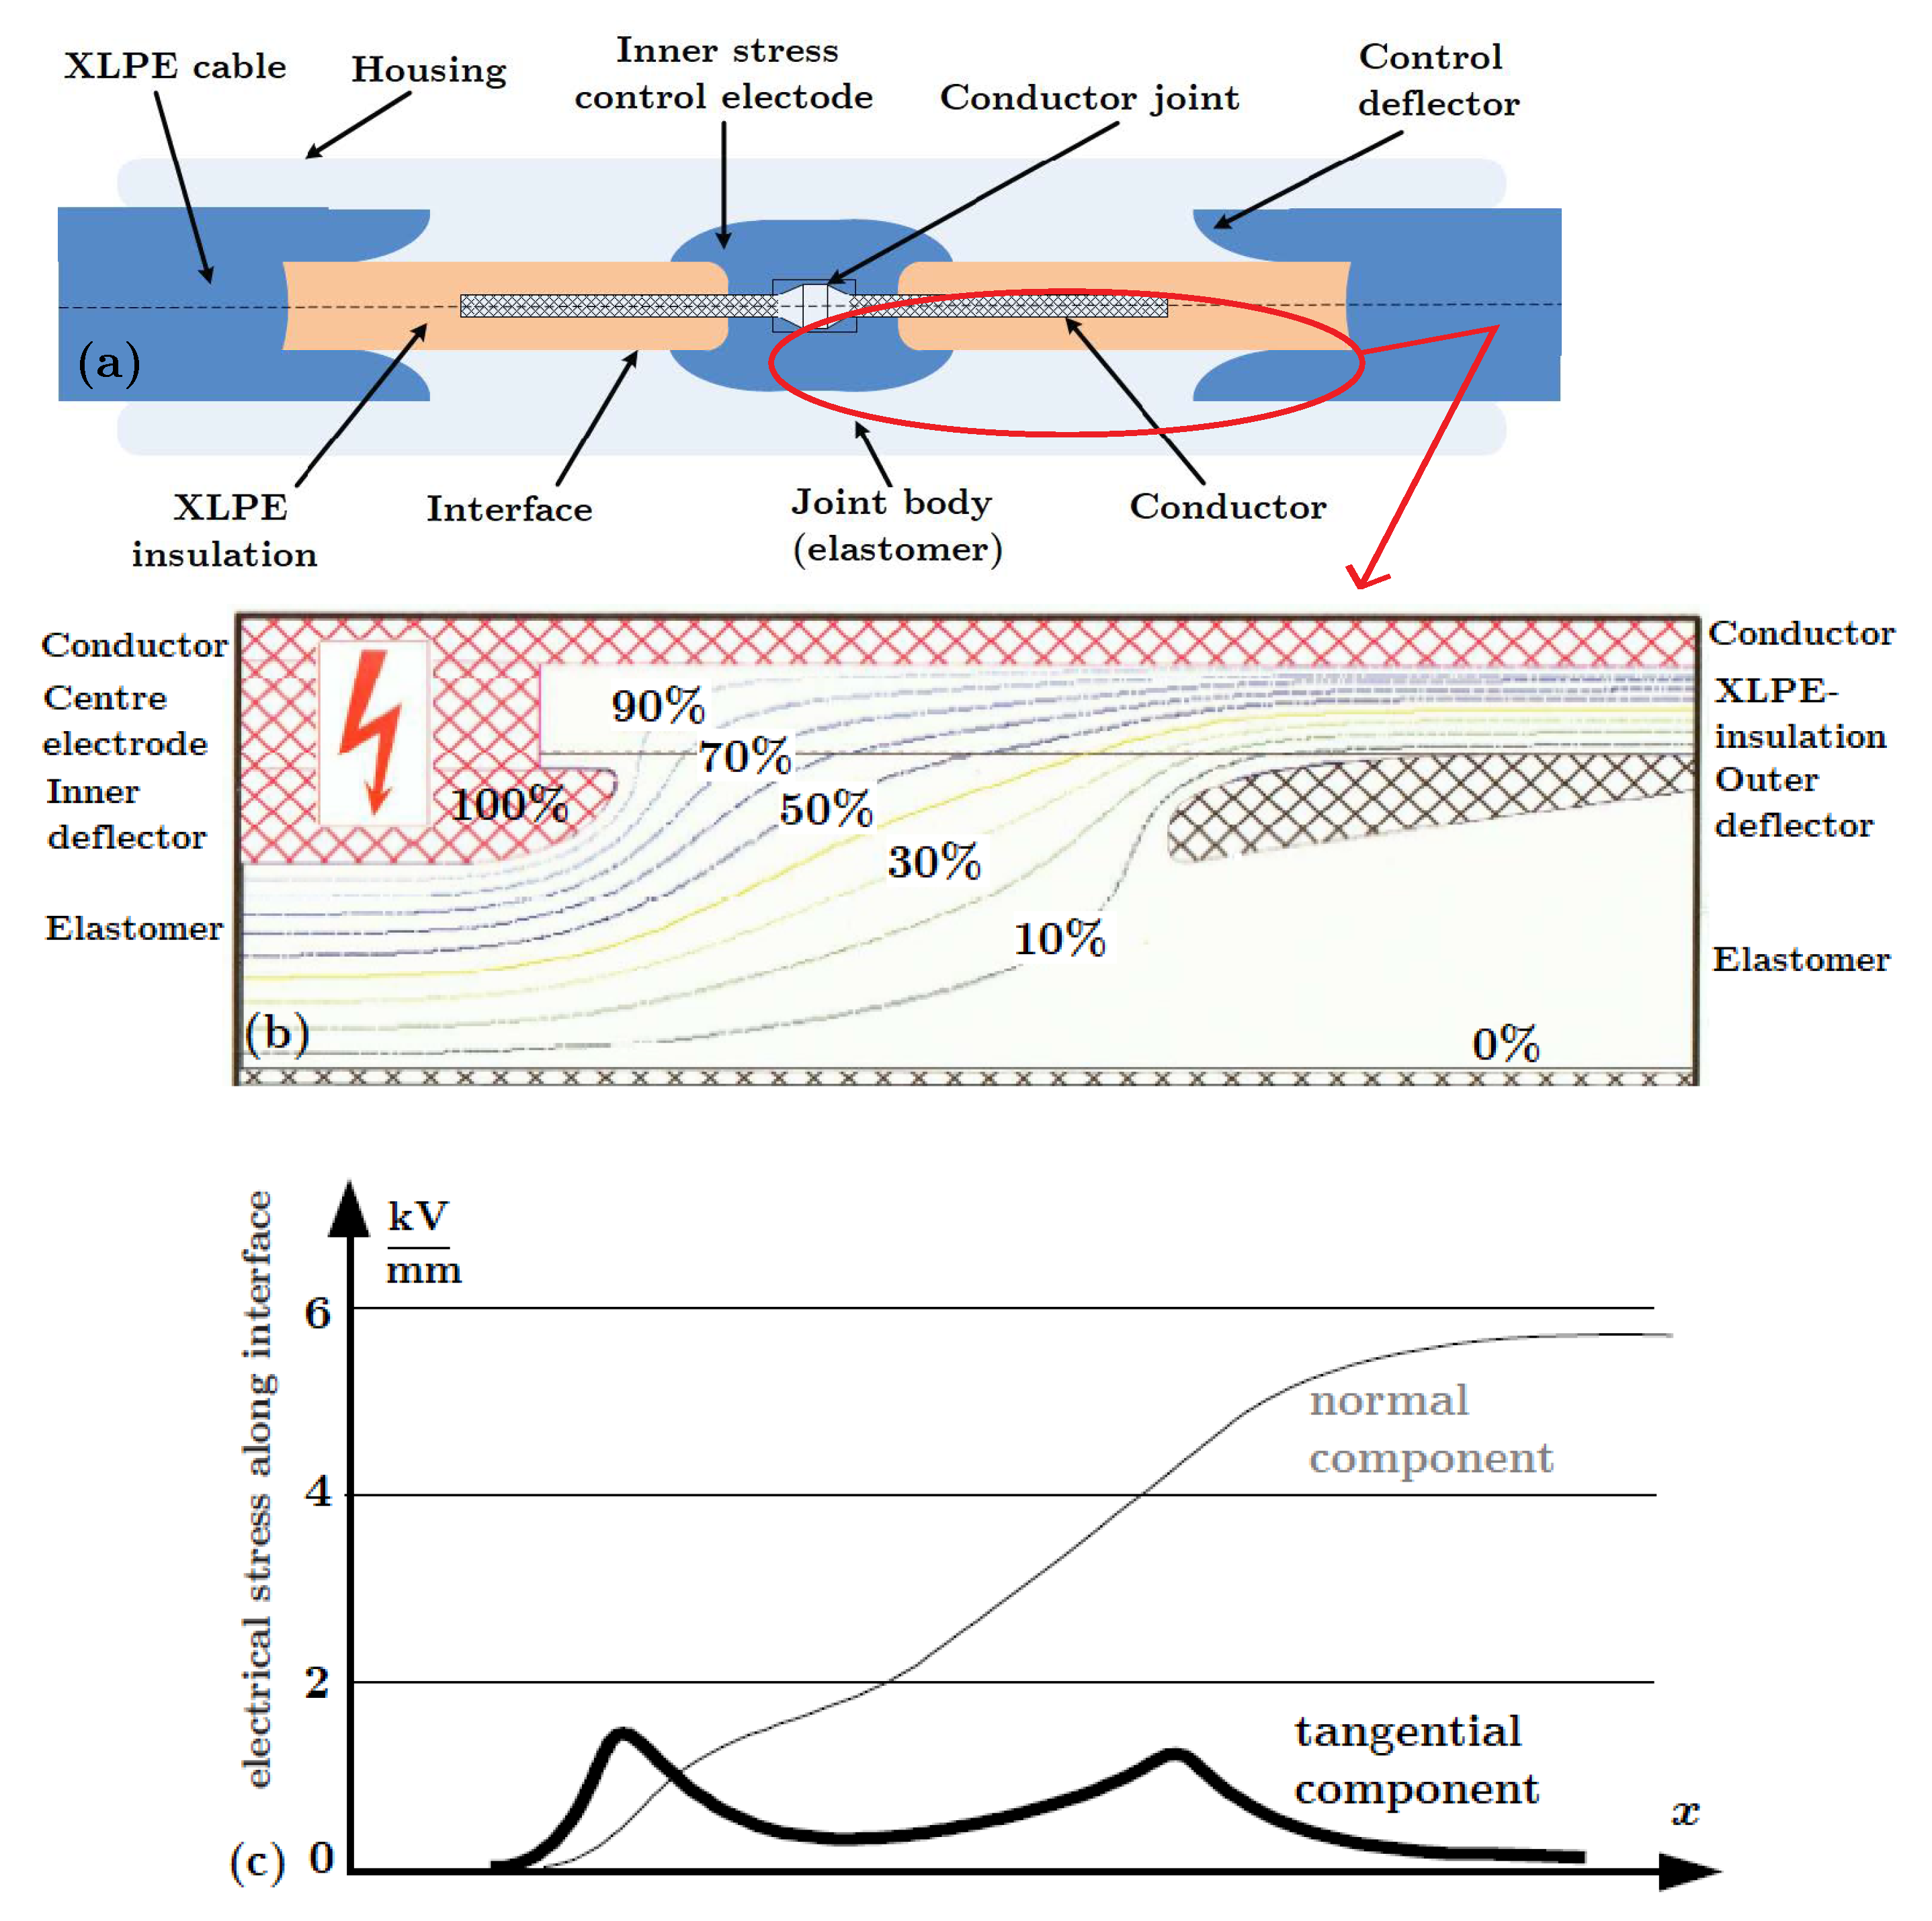
2.2. Interfaces in Polymer-Insulated Cable Connections

The simple structure of the insulation in cross-linked polyethylene (XLPE) cables led to the early development of easy-fit prefabricated joints and terminations, whose field control elements are prefabricated and tested in the factory [8]. In the past, such accessories were initially developed for medium-voltage (MV) applications, which were then upgraded for the high-voltage (HV) and extra-high-voltage fields (EHV). However, a large number of alternative solutions are currently competing with these prefabricated elements.
Recent developments have progressed to prefabricated and routine-tested slip-on units, even for straight joints and polymer-insulated cables [8]. Field control components are already incorporated in these joints [9]. Accessories with slip-on stress cones for HV and EHV cables usually utilize field control deflectors, as shown in Figure 6a [8,10]. Properly contoured deflectors made from an elastic conductive material are positioned into a similar elastic insulator permanently, then pressed in one piece onto the suitably prepared polymer-insulated cable precisely, such as EPR (ethylene propylene rubber), PE (polyethylene), LDPE (low-density polyethylene), or XLPE.
Figure 6a shows the cross-section of a slip-on joint, consisting of two opposing control deflectors and a field smoothing sheet for the conductor connection [8]. A conductive coating for the surface of the joint is needed to provide the outer screening. Lastly, a metal housing (durable against corrosion) is used to avoid ingress of moisture and mechanical damage [8].

2.3. Factors Affecting the Interfacial Breakdown Strength

Solid–solid interfaces in cable joints usually arise between a soft material (elastomer/ polymer) and a hard (polymer) material such as XLPE–EPDM (EPDM: ethylene propylene diene monomer), XLPE–SiR (SiR: silicone rubber), XLPE–EPR, and XLPE–PEEK (PEEK: polyether ether ketone), or between the same materials. With soft materials, improved contact and sealing is possible even at low and moderate contact pressures.
Despite the presence of deflectors with identical structures, different field conditions arise in joints to those in sealing ends. In particular, the tangential component of the electrical field that is locally enhanced at the interface between the cable dielectric and joint insulation becomes more significant relative to the maximum field strength within the body of the joint [8]. Accurate field calculations, as illustrated in Figure 6, are essential to avoid intolerably high stresses and to optimize the shape of the joint. Figure 6b,c depicts the results of field calculations in the form of the potential distribution and the field distribution of the normal and tangential components in a 400 kV slip-on joint, respectively [8].
The electrical performance of solid–solid interfaces are dependent on the following:
  • Surface roughness;
  • Contact force;
  • Mechanical and electrical characteristics of the insulation materials, such as elasticity and tracking resistance;
  • Surrounding/insulating dielectric medium; and
  • Care exercised and conditions during assembly.
In the next section, the individual effect of each above-listed parameter is present.

2.4. Contact Surfaces at Solid–Solid Interfaces

Prefabricated and pretested/qualified cable accessories do not necessarily guarantee ideal assembly conditions because the site conditions in which they are usually assembled may be suboptimal and hard-to-control [8]. As long as the fitting is not performed in a laboratory or cleanroom environment, the interfaces will be vulnerable during installation. Consequently, cavities, protrusions, and impurities are likely to develop at solid–solid interfaces [1]. Figure 6c illustrates the locally enhanced electric field stresses originating from imperfections at an interface (complementary to Figure 5). To be more specific, rough surfaces lead to various cavities at the interfaces, whereas contact force affects the size and deformation of the cavities and contact areas, as shown in Figure 7. Mechanical and electrical characteristics of the insulation materials, such as elasticity and interfacial tracking resistance, strongly affect the interfacial BDS. The type and quantity of lubricant/grease used during assembly, water penetration to the interface, or assembly at dry and optimal conditions change the insulating dielectric medium filling the cavities. Lastly, poor workmanship, wear and tear of materials, contaminants, and impurities cause a substantial reduction in the BDS [8].
As previously stated, the presence of the solid–solid interfaces (i.e., imperfect contact) increases the risk of locally high electric field stresses, leading to partial discharges (PD) and eventually a premature flashover [1,8,13,14,15,16,17,18,19].
A major failure process for power cable connectors is the breakdown of the interfacial layer between two solid insulating materials, as reported in [1,8,13,15,17,18]. When dimensioning the thickness of the insulation walls of the cable and joint body, Peschke and Olshausen [8] recommend restricting the operational stress on the outer conductive layer to around 6–7 kV/mm even if the installation is performed with due care, and the mechanical and electrical design of the apparatus is optimal [8].
Cavities on a dielectric surface differ in size and distribution based on the surface roughness, contact force, and mechanical properties of the material, as well as the care taken during manufacturing and installation [1,8]. Surface irregularities cause discrete contact points that form when two rough, nominally flat surfaces are brought into contact. Figure 8a,b illustrates the formation of numerous cavities between contact spots. Figure 8b elucidates the significantly low ratio of “actual contact area” to “nominal contact area”. An interfacial cavity along the tangential axis (x- or y-axis) is generally considerably larger, as illustrated in Figure 8c [20].
In light of the overview of the important parameters discussed in this section, the primary parameters influencing the distribution and size of microcavities and hence the electrical breakdown strength of solid–solid interfaces are summarized in Figure 9a with their individual effects on the interfacial dielectric strength illustrated in Figure 9b.

3. Empirical Studies on Dielectric Strength of Polymers and Solid–Solid Interfaces

Experimental work regarding the electrical properties of solid–solid interfaces in insulating materials, HV apparatuses, and cable accessories has been extensively studied in the literature. The papers referred to in this section have predominately focused on the BDS and PD inception field strength (PDIV) of solid–solid interfaces by focusing on interfacial discharge and breakdown mechanisms induced by enclosed cavities (either spherical or elongated in the field direction) and interfacial tracking resistance (PD resistance) of the polymers. Besides this, a few papers have correlated the intensity of discharge images with the interfacial BDS values. In the experiments, cable joints as a whole, interfaces assembled between pieces of polymers cut from commercial cables, or polymers cast in laboratories have reportedly been used. Casting custom-made polymers in laboratories using molds in desired shapes and sizes has been popular among researchers because it allows metal electrodes or air-filled cavities to be embedded in diverse shapes and sizes in the specimens. Below, a summary of findings from the selected publications is provided.

3.1. Studies on the Insulation Properties of Polymers

Albayrak et al. [23], Roy et al. [24], and Ding and Varlow [25] observed improved electrical insulation properties when the elastic modulus was increased by putting in micro and nano-scaled zinc oxide, nano-scaled zirconia particles, and silica nanoparticles. In these studies, the dielectric strengths of different dielectric materials were tested by changing the chemical and material properties of the bulk insulation material.
In addition, Du et al. [26,27] studied the interface charge behavior of multi-layer insulations extensively. These studies were performed under direct current (DC) voltage, in which the influence of fillers in bulk materials of LDPE and EPDM on the overall breakdown strength of interfaces was investigated. It was concluded that suppressed/reduced charge accumulation by 50% at the interface increases the BDS and PDIE. Besides, in [28], the correlation between space charge behavior and the mechanical stress was studied using polypropylene (PP) blended with polyolefin elastomer (POE), i.e., PP/POE blend, under DC excitation. After mechanical stretching, the microstructure of the PP/POE blend altered, causing a greater accumulation of space charges in stretched specimens. All in all, these results provide a useful insight into the electrical performance of polymer interfaces.
Tracking failure in HV cable insulations has been the subject of various studies since a solid insulation under high electrical stress is likely to undergo breakdown due to tracking [29]. Several experimental configurations of needle-plane electrodes have extensively been used in the literature to test insulation materials for tracking resistance by inducing a high non-homogeneous field to stimulate the initiation of surface or interface tracking [29,30,31,32]. Using empirical data, Fothergill [31] developed an analytical expression to estimate the interfacial tracking resistance of polymers. There, the interfacial tracking resistance is linearly correlated to the fourth root of the elastic modulus. Chen et al. [30] used Fothergill’s model to investigate the interfacial tracking behavior in XLPE cable insulation samples. Both Fothergill [31] and Chen et al. [30] used needle-plane electrode configurations to generate a strong electric field owing to the non-homogeneous field generated. Mason [33] investigated the PD resistance of XLPE samples using nine different combinations of needle, plane, and rod electrodes.
Eichhorn [32] published a review paper on interfacial tracking in solid dielectrics in 1977. In his conclusion, the most commonly investigated interfacial tracking phenomena were those that result from the degradation of organic materials and most dielectrics by internal electrical discharges. Even though the presence of voids and contaminants in electrode–insulation interfaces that contain defects is undesirable, the damage which is caused by moderate AC voltages is of greater commercial importance [32]. There may be very high, localized stress gradients in this case, which would facilitate tree initiation and growth and eventually would lead to tree breakdown. To estimate these localized stress gradients, Eichhorn [32] provided a thorough review of the mathematical formulas for enhanced field stress at the tip of sharp metallic electrodes.
Finally, Gubanski et al. [29,34,35,36,37,38,39,40,41,42,43] contributed to the literature with numerous extensive and thorough studies on the interfacial tracking resistances of polymeric materials, such as SiR, PE, XLPE, and LDPE under AC excitation. The essence of the findings from [29,34,35,36,37,38,39,40,41,42,43] is that charges injected from the needle substantially reduce the electric stress at the needle tip. The results indicate that the maximum electric field emerges in the bulk material very close to the needle tip, and an electrical tree might form as a result of induced changes in the material.

3.2. Studies on the Dielectric Strength of Solid–Solid Interfaces

3.2.1. Studies with a Focus on Electrical Breakdown

In the 1990s, Fournier et al. [14,15,16,44,45,46] studied solid–solid interfaces thoroughly using needle-plate electrodes under AC or DC excitation across the interfaces formed between XLPE–XLPE, EPDM–EPDM, and EPDM–XLPE samples. In [14,15,45], dry interfaces and greased/lubricated interfaces were examined. In both cases, the interfacial breakdown strength was reported to increase by a factor of 2.7 and 1.5, respectively, when the applied pressure was increased from 0 kPa to 80 kPa. It was also shown that lubricated interfaces had a six times higher breakdown strength than that of an interface without grease. Moreover, Fournier [16] studied the influence of surface roughness at dry and greased (similar to oil-mate) EPDM–XLPE and EPDM–EPDM interfaces. After sanding and greasing the XLPE surface, EPDM–XLPE interfaces had dielectric strengths that were three to four times greater than those of unsanded and ungreased interfaces. The dielectric strength of unsanded EPDM–XLPE interfaces improved slightly after greasing the interface. Moreover, EPDM–EPDM interfaces demonstrated higher breakdown strengths in comparison to EPDM–XLPE interfaces, whose strengths depended on the chosen grease type. As EPDM is softer than XLPE, the interfaces between softer materials achieve higher BDS than those between hard materials. Lastly, Dang and Fournier [14,44] found that the interfacial breakdown voltage increased at elevated interface pressures; however, aged cable accessories could cause a reduction in the interface pressure, leading to a reduced interface dielectric strength. These findings fully agree with the trends Kantar et al. observed in [47,48]. They tested the breakdown strength of dry-mate and oil-mate XLPE–XLPE and SiR–SiR interfaces. The breakdown strength of oil-mate interfaces were significantly higher than those for dry-mate samples: 2.8-fold and 1.6-fold improvements were detected in XLPE–XLPE and SiR–SiR interfaces, respectively.
Kunze et al. [1,49] studied the design of interfaces in HV cable accessories by varying the surface roughness and contact pressure. XLPE–SiR interfaces under AC and impulse voltages were tested, and the experimental results indicated that surface roughness and radial pressure significantly influence the longitudinal electrical strength of interfaces. To be more specific, the increase in the surface roughness (mean height of surface asperities varied from 5 µm to 50 µm) of the XLPE samples reduced the interfacial BDS by 50%.
Takahashi et al. [13] studied the interfacial breakdown strength and PD patterns of interfaces between the SiR and epoxy utilizing two different samples with orthogonal orientations that allow for the electric field to be applied tangentially or perpendicularly to the interface. The effect of delaminations between interfaces filled with air on the interfacial breakdown voltage was also investigated. They concluded that the tangential component of the electrical field governs the interfacial breakdown, where AC surface breakdown voltage values rose by a factor of 1.5 as the thickness of the air delamination was decreased from 1 mm to 0.01 mm.
Du et al. [17,50] studied the impact of contact pressure using XLPE and SiR samples under AC voltage using needle-plane electrodes. A 1.7-fold rise in the initial discharge voltage was observed as the contact pressure was raised from 20 kPa to 300 kPa. They concluded that in order to increase the lifetime of power cables, it is necessary to avoid the loss of interfacial pressure between solid materials; in this case, XLPE–SiR. In [18], the effect of surface roughness on the tracking mechanisms at XLPE–SiR interfaces under AC voltage was studied. The results concluded that as the surface roughness was decreased (surfaces sanded with #100 to #1000 in a sequence), rising trends in the PDIV, breakdown voltage, and time to breakdown were observed by factors of 1.8, 1.4, and 2.3, respectively, whereas the intensity of the emitted discharge light decreased. In a similar research paper, Chen et al. [51] investigated the tracking failure of XLPE–SiR interfaces under AC and impulse voltages and concluded that at AC excitation, there is a longer period of overvoltage in each cycle, resulting in an immediate interface tracking failure.
Hasheminezhad [11,52,53,54,55,56] studied the interfacial breakdown strength of solid–solid interfaces between 2007 and 2011 within the scope of his Ph.D. work. During this time, he investigated the BDS and PD inception field strength of XLPE–XLPE interfaces under a homogeneous AC field by varying the contact pressure ( p a ) and surface roughness. The core results from his thesis are summarized in Figure 10, and they agree with the reported results in the literature above and with the results to be shown in the following work performed by Kantar and his peers.
Kantar et al. [47,48,57,58,59,60,61,62,63] continued Hasheminezhad’s work. They studied the effect of mechanical pressure, elasticity, and surface roughness on the longitudinal electrical AC breakdown strength using different insulation materials (i.e., solid–solid interfaces between rectangular-shaped lab-made samples) and various surface roughnesses under dry-mate and wet-mate conditions. The surface of the materials was prepared using sandpapers with different grit sizes attached to a rotating sanding machine at a predetermined pressure to examine the relation between the surface roughness and the longitudinal AC BDS at solid–solid interfaces. Interfaces were named after the sandpaper grit that they were sanded with: #180 (roughest), #500, #1000, and #2400 (smoothest). Different mechanical loads to apply various contact pressures were used to test the interfaces between the same materials: XLPE, epoxy, PEEK, and SiR (XLPE–XLPE, SiR–SiR, etc.). Details of the test setup and experimental design can be found in [48,60,61].
Dry-assembled vs. wet-assembled interfaces under various contact pressure [47,48]
The results of the dry-mate and wet-mate interfaces formed using the XLPE #500 and SiR #500 samples are summarized in Figure 11. The 63.2% BDS values (Weibull distribution used) in the case of dry-mate XLPE–XLPE #500 were higher than those in the case of wet-mate XLPE–XLPE #500 by a factor ranging from 2.6 to 2.9 as the contact pressure was increased from 0.5 to 1.16 MPa. Increasing the contact pressure from 0.5 to 1.16 MPa resulted in an increase by a factor of 1.2 in the 63.2% BDS for the dry-mate XLPE–XLPE #500. On the other hand, in the case of wet-mate XLPE–XLPE #500, from 0.5 to 1.16 MPa, the 63.2% BDS increased by a factor of 1.7. These findings indicate that the increase in contact pressure is likely to squeeze some water droplets out of the interface. Thus, air-filled and water-filled cavities are likely to coexist at higher contact pressures, which in turn increases the interfacial BDS significantly.
In Figure 11, the BDS of air is also shown for reference. It was measured using the same test setup in the air with a 4 mm distance between the electrodes. In accordance with the field simulations shown in [47], Figure 11 indicates that having water at the interface adversely impacts the BDS in the AC breakdown experiments. Particularly at low interfacial pressures, the dielectric strength of an interface is comparable with that of air.
Similarly, the 63.2% BDS values in the case of dry-mate SiR–SiR #500 were higher than those for the wet-mate SiR–SiR #500 interfaces by a factor ranging from 3.3 to 3.9, following the contact pressure change from 0.16 to 0.27 MPa. In the case of dry-mate SiR–SiR #500, the 63.2% BDS increased by a factor of 1.4 as the pressure increased from 0.16 to 0.27 MPa. Similar to wet-mate XLPE–XLPE, the BDS of the wet-mate SiR–SiR is comparable to that of air at 0.16 MPa. Hence, it can be deduced that water intrusion is a serious concern in the design of any HV equipment incorporating solid–solid interfaces.
The increased pressure from 0.16 to 0.27 MPa led to higher BDS for the wet-mate SiR–SiR #500 by a factor of 1.2. It can be argued that the SiR samples are more hydrophilic than the XLPE samples [64], which might have resulted in the removal of fewer water droplets from the interface.
Effect of surface roughness under various contact pressures [60,62]
In order to study the correlation between surface roughness and electrical interface breakdown, XLPE samples of four different surface roughnesses were used in the experiments to form the dry-mate polymer interfaces in [60,62]. At 0.5, 0.86, and 1.16 MPa contact pressures, the effect of surface roughness on the interfacial BDS was explored, and the main results are shown in Table 1. The surface roughness of each interface was determined using a 3D optical profilometer that returned the mean asperity height R a as the first-hand quantitative parameter to compare the surface roughnesses resulting from the roughest to the smoothest sandpaper.
The results suggest that increased surface roughness gives rise to a lower BDS, whereas a higher contact pressure yields augmented BDS. In fact, the 63.2% BDS was nearly twice as high in the case of #2400 as it was for #180 at each contact pressure. A 30-fold reduction in the mean asperity height R a from #180 to #2400 yielded a 1.85-fold rise in the BDS at p a = 0.5 MPa and a 2.15-fold increase at p a = 1.16 MPa. At all pressure levels, the BDS increased as the interfaces became smoother—i.e., from #1000 to #2400—where the highest increase (1.6-fold) was detected at 1.16 MPa. To sum up, the surface roughness of the interfaces has a significant impact on the overall BDS in dry-mate conditions.
From 0.5 to 1.16 MPa, the 63.2% BDS increased by factors of 1.4 and 1.7 in the cases of #180 ( R a = 8.9 μ m ) and #2400 ( R a = 0.30 μ m ), respectively. Thus, the smoothest interface shows the strongest dependency on the contact pressure.
Effect of elasticity under various contact pressures [61,63]
In [61], the tangential AC breakdown strength at solid–solid interfaces as a function of the elastic modulus was studied. Interfaces between identical materials of SiR, XLPE, EPOXY, and PEEK were analyzed at several interfacial contact pressures, and all sample surfaces were prepared using the same sandpaper with grit #500. Preliminary tests were conducted to determine the applied pressure levels, in which samples and interfaces were examined for deformation. The SiR–SiR interface, for example, could not be tested at contact pressures above 0.27 MPa due to the deformation of the samples.
Table 2 presents the 63.2% values for each interface. The results suggest that a higher elastic modulus gives rise to a reduction in the BDS. It is also evident that contact pressure has a significant effect such that an increase of around three times the contact pressure resulted in a 1.4-fold increase in interfacial BDS at SiR–SiR (softest interface–lowest elastic modulus). On the other hand, the BDS for the highest modulus (PEEK–PEEK) was higher by a factor of 2.4. These results signify a strong influence of elasticity on the BDS of solid–solid interfaces. BDS values for SiR and XLPE, both with relatively low moduli, were thus found to be higher even at relatively low contact pressures.

3.2.2. Studies with a Focus on Partial Discharges

Illias et al. [65,66,67] performed thorough studies on the measurement and modeling of partial discharges in solid dielectric materials and at polymer interfaces. They extensively used phase-resolved partial discharge analysis (PRPDA) and pulse sequential analysis (PSA) methods to display both experimental and simulation results. They proposed a 2D finite element analysis (FEA) model to simulate PDs in spherical cavities for different voltage frequencies and amplitudes, material temperatures, and cavity sizes. They concluded in [65,66] that the charge/temperature decay time constant, surface conductivity of the cavity, initial electron generation rate, and discharge inception/extinction field in the cavity are the most critical parameters governing the PD activity in cavities. In addition, their findings suggest that as the cavity diameter gets larger, the number of PDs per period diminishes, whereas the total apparent charge per period and the maximum discharge magnitude rise.
Stewart et al. [68,69,70,71,72,73] examined factors affecting the PD activity in internal cavities and surface properties of the cavities and reported on the characteristics of PD in artificially created cavities. The studied cavity types were enclosed cavities, vented channels, and unvented channels in [68,69], and they reported that changes in gas content and by-products from the PD activity in cavities affect the build-up of space charges on the cavity walls, the generation rate of initiating electrons, and the energy of collisions, thus altering the PD characteristics. These studies are found to be very relevant in determining the effect of gas pressure inside the cavities and the surface roughness on the overall BDS of insulation materials. They also reported in [68] that vented channels were likely to be subjected to decreased degradation due to by-products dispersing and gas refresh through the vent. These findings strongly correlate with the results of the experimental and the theoretical work performed in [74] that suggest that, despite the significant difference in elasticity, at high contact pressures, the presence of enclosed cavities was suspected due to the high BDS achieved in the cases of XLPE–XLPE #500, EPOXY–EPOXY #500, and PEEK–PEEK #500 in the AC breakdown experiments. In that case, cavities possibly experience an increase in gas pressure based on the compression extent in the cavity, and hence the dielectric strength of the cavity is augmented based on the ideal gas law [74].

3.2.3. Studies with a Focus on Interfacial Discharge Monitoring

Gu and He [75] examined the effect of microcavities on the interfacial breakdown between XLPE and SiR using a lab-made cable joint using image processing methods by examining the channel widths of discharge light and carbonization extent. They found that microcavities significantly reduce the interfacial dielectric strength and lead to discharge and tracking failure, while an elongated cavity parallel to the tangential component of the electric field leads to interfacial discharge more easily.
Du et al. [17,50] examined the effects of the interface pressure and the interfacial tracking failure between XLPE and SiR by processing the discharge images. They determined the interfacial tracking failure mechanisms at different contact pressures using the distribution characteristics of discharge light and carbonization patterns. Their results suggest that a higher contact pressure notably inhibits the propagation of discharges, delaying the build-up of carbonized species and the interfacial breakdown. They also claimed that a higher contact pressure resulted in decreased discharge activity and less carbonization formation. In [18], the effect of surface roughness on the discharge processes at XLPE–SiR interfaces at AC voltage was studied. The results indicated that as the surface roughness was decreased (surfaces sanded with #100 to #1000 in a sequence), rising trends in the PDIV, breakdown voltage, and time to breakdown were observed by factors of 1.8, 1.4, and 2.3, respectively, whereas the intensity of the emitted discharge light decreased.
Kantar and Ildstad [76] proposed a novel test method to visualize PD activity in microcavities at solid–solid interfaces. Their primary objective was to examine the initiation, development, and propagation of discharge streamers at a solid–solid interface using a CCD camera. They observed that the discharge streamers were wide and long (continuous, connecting vented air gaps) in rougher interfacial surfaces. The rougher the interface was, the thicker the widths of the discharge channel were, as presented in Figure 12a,b. On the other hand, the discharge streamers were notably thin and short for smoother interfaces. In some cases where a smooth interface and high contact pressure are present, they managed to monitor the discharge activity happening solely in the microcavities, as shown in Figure 12c. This signifies that the cavities were isolated under the given specific test circumstances and the electrical tracking resistance of the insulating material (contact spots) had an important function in inhibiting the streamers from spreading further.
These results fully support the findings from several pertinent studies in the literature. Firstly, Kato et al. [77] stated that increased contact pressure at interfaces between high-density polyethylene (HDPE) materials resulted in a higher AC breakdown voltage because the contact area impeded streamer propagation at the regions where the contact pressure was relatively high. In their study, interfacial pressure distribution was measured using pressure-sensitive papers and was inspected using image-processing software to map the real contact area. They ascribed this phenomenon to Young’s modulus of HDPE being low because the contact area of the high-pressure region became larger with increasing contact pressure. To test the opposite effect, they also examined the interfaces between stiffer materials (HDPE–epoxy and epoxy–epoxy), where Young’s modulus of epoxy was larger by a factor of 3.1, and recorded the lowest AC breakdown voltage in the case of an epoxy–epoxy interface. These findings not only support the likely presence of enclosed gaps that were postulated in Kantar’s previous studies [76,78] but also strongly agree with the results reported in [48,57,60,61], where increased contact pressure and elasticity were shown to lead to greater AC breakdown voltages.
The studies reviewed in this section present strongly concordant results. Discharge activities were reportedly affected by the surface condition, pressure, and material properties. Possible physical and chemical phenomena that can be responsible for the local destruction of contact area/spots are further elucidated in the following by referring to studies that focused on the physicochemical state of the material before breakdown takes place.
Physical and Chemical States before and after Electrical Breakdown
Du et al. [79] investigated the PD-initiated light emission phenomenon to understand the mechanisms governing the local breakdown of the contact area. They used the simplified interface contact model, which was formerly proposed in [52,53,58,60]. Using the model, they studied the interface breakdown mechanisms at the interfaces formed between polypropylene and SiR under AC excitation. They examined the breakdown of contact spots in two separate stages, namely the initiation stage and propagation stage, and addressed possible processes responsible for the local deterioration of the contact area at the initiation stage. They suggested that upon breaking down the contact surface between two discharged cavities, the cavities connect and form a larger discharge channel. It was stated that the local contact area must experience degradation and then breakdown to enable the discharge channel to propagate at the interface. The details of their hypothesis are as follows: The duration between the PD inception in the cavities and the complete flashover at the interface is divided into two substages: the initiation stage and the propagation stage. The initiation stage is assumed to be considerably longer than the propagation stage since the propagation of the interfacial tracking is assumed to take place momentarily; i.e., in ≲ 10 7 s, as empirically modeled in [31].
The initiation stage is illustrated in Figure 13a. When microcavities are discharged, “energetic particle bombardment” and light emission from “recombination of particles with opposite polarities” will ensue [79]. The thermal effect of the discharge is not taken into consideration at this stage since the discharge is likely to have low energy; the heat generated at this stage could thus be disregarded [79]. As a result of the energetic particle bombardment, the polymeric covalent bonds may be disrupted. Besides, the light emission contributes to the acceleration of chain dissociation [79]. As illustrated in Figure 13a, during the particle bombardment, part of the energy might be lost, and at the interface, trapped carriers (electrons and holes) may emerge from the contact areas [79]. Such carriers are subjected to a de-trapping process and become recombined with one another, resulting in more light emission and local field distortion [79]. Accordingly, at the interface, low-density regions are formed that relatively simply permit electrical breakdown under AC voltage [80]. Upon the breakdown of the contact surface between two adjacent short-circuited cavities, the cavities connect and form a larger discharge channel. Hence, the local contact area must experience degradation and then breakdown to enable the discharge channel to propagate at the interface. At the propagation stage, as illustrated Figure 13b, the discharge activity is considerably stronger than the discharge in the initiation stage [79]. In this case, the thermal effect of the discharge channel cannot be neglected since gas expansion is likely to take place within the discharged cavities due to the heat generated from the strong discharge channel [79]. Moreover, the gaseous by-products are generated from the degradation of the polymer sample by the discharge activity, leading to a gas expansion in the deformation of the cavity, as depicted in Figure 13b. Due to the strong discharge activity, the degradation and resulting breakdown triggered by the particle bombardment and the light emission originating from the streamers seem to strongly govern the propagation of the discharge channel. On the other hand, the charge injection, trapping, and de-trapping mechanisms have a subordinate role in the degradation of the contact area [79].
In summary, different microtracking resistances of the polymers tend to affect the primary discharge propagation mechanisms of particle bombardment and the light emission from the discharge channel. In contrast, the charge injection, trapping, and de-trapping mechanisms have indirect effects as they result in more intense light emission and local field distortion in the initiation stage.
The initiation and propagation stages discussed above seem to agree with the observed discharge propagation mechanisms in [76]. For instance, the discharged cavities displayed in Figure 12 can stand for the initiation and propagation stages of the contact spot breakdown, respectively, such that only microcavities are discharged in the initiation stage, whereas the contact areas isolating the discharged cavities are bridged in the propagation stage, as illustrated in Figure 13b.

4. Theoretical Studies on Contact Surface Modeling Using Tribology

In the history of tribology, various methods have been used to describe rough surfaces, such as the statistical analysis of contacts, fractal analysis of contacts [20], and approaches based upon the surface power spectrum [81]. Recently, the use of numerical/deterministic roughness models has become widespread as fast processors become available [20,82]. Furthermore, to obtain a more accurate measurement of surface contact area, fractal approaches have been introduced to provide a scale-invariant characterization of surface roughness [81,83,84]. By analyzing the surface roughness at all length scales, fractal characterization can provide information about fractal behavior [84].

4.1. Constituents of Contact Spots in Fractal Dimensions

In this section, firstly, constituents of contact spots are elaborated by considering imperfections that cause deviations from an “ideal contact surface”. The multiscale nature of surface roughness is likely to have a role in the interface breakdown such that a surface’s roughness can be viewed in greater detail—i.e., down to nano-scale—as it is magnified repeatedly. This phenomenon occurs due to the unique property of rough surfaces [20,85,86,87]. Consequently, the surface texture at all magnifications seems somewhat similar in structure, causing the interfacial surface texture to repeat itself in smaller scales, as illustrated in Figure 14. This phenomenon has been studied under fractal analysis in the literature [85,86,87]. Without delving too much into the details of the fractal analysis, the parameter of “interfacial tracking resistance” is elaborated in the following by discussing what it actually represents.
Considering the fractal geometry of a rough surface, contact spots at the microscale incorporate contact spots and cavities at the nano-scale, as illustrated in Figure 14. Thus, the breakdown of contact spots is assumed to be equivalent to the discharge of nano-scale cavities and the breakdown of nano-scale contact spots. In that case, the air-filled, enclosed nanocavities will have as high a dielectric strength as nano-scale contact spots of the bulk material according to the left side of the Paschen minimum for air (see Figure 15). As a consequence, significantly less enhanced local fields are required to break down a nano-scale contact spot than to break down a microscale contact spot.
Results from experimental and theoretical studies in the literature suggest that different mechanisms are involved during interfacial breakdown. When an interfacial failure occurs, both cavities and contact spots are broken down along the discharge path. Only in a hypothetical case, in which vented channels (air gaps) dominate the interface, will the discharge streamers likely propagate by chasing after only interconnected cavities without being obstructed by any contact spots. In practice—i.e., in the case of an interface consisting of not only vented air gaps—air-filled cavities are discharged first while contact spots are subjected to breakdown last. However, discharged cavities will not immediately lead to an interface breakdown because the insulation properties of the solid insulation are likely to affect the endurance of the contact areas against interface breakdown (caused by the enhanced fields generated by the discharged cavities). The endurance of contact spots against discharges at an interface is roughly modeled and is estimated employing the tracking resistances of the solid materials forming the interface.
For clarity, a hypothetical case is exemplified as follows. Assume that cavities at two different homogeneous interfaces (interfaces formed between identical pairs of solid dielectrics) are identical (identical size, number, and shape) and are discharged at the same voltage; the interface formed between the materials with a higher “interfacial tracking resistance” is likely to yield a higher breakdown strength, as observed in the AC breakdown experiments [60,61].
In the following sections, further details on the statistical and deterministic roughness models are provided.

4.2. Statistical Interface Contact Models

Zhuravlev’s (1940) statistical model of contact between rough elastic solids is an early, novel precedent [88]. A contact model of nominally flat surfaces was later proposed by Greenwood and Williamson (G&W) [89], in which the real area of contact was shown to be proportional to the load applied, as demonstrated by the Gaussian and exponential distributions of the asperity peaks.
Contacts that are either elastic or plastic were analyzed between a rough surface and a smooth surface by G&W [89]. Bhushan [20] retrofitted his approach on top of the G&W model [89] to make it more comprehensive. These two models (actually Bhushan’s upgraded model) were utilized to propose a customized contact model in [62].
Kantar et al. [62] proposed a stochastic model for the contact surfaces between solid dielectrics using the above-mentioned tribological principles introduced in [20,21,89,90,91,92,93,94]. Their proposed model was based on multiple-asperity dry contacts formed at a solid–solid interface, which was employed to calculate the average cavity size at a given interface in a two-dimensional space. The proposed contact model suggest that higher contact pressure, stiffer interfaces, and/or surface smoothness generate smaller average-sized cavities and higher ratios of “real contact area to the nominal contact area”, A r e / A a . The model then predicted the AC PD inception field strength of an average-sized cavity using Paschen’s law. The model was verified via an experimental study that used XLPE–XLPE interfaces with different surface roughness degrees under various contact pressures. Based on the AC breakdown test results of the XLPE–XLPE interfaces in [62], the cavity discharge inception and the interfacial breakdown phenomenon were found to be closely intertwined, leading to the deduction that the cavity discharge influences the interfacial breakdown phenomenon significantly. This study was extended in [74,95] by using different insulation materials and additional experiments where its performance was compared to a deterministic approach. Details of the extended model are provided in the next section.
Lastly, Zhu et al. [96] utilized the simplified interface contact model proposed in [52,53,58,60]. They studied the correlation between the DC breakdown voltage of XLPE–SiR interfaces and the interfacial morphology using the interface contact model. They combined the analytical model with an image processing algorithm that yielded similar surface simulations as those we obtained by using the deterministic contact model in [74,95], as introduced in the next section. They concluded that although the density of real contact irregularities is high, the real contact area is significantly lower than the nominal contact area. Consequently, there are many interconnected cavities at the interface that are the primary discharge path for an interfacial breakdown, while the contact spots serve as hurdles for the propagating discharge channel. These deductions are found to strongly agree with the main findings reported in [62,74].

4.3. Deterministic Interface Contact Models

With the advent of supercomputers that can perform heavy computations of big data in a matter of hours—if not minutes—deterministic models have increasingly been favored. The outcome is becoming increasingly realistic as computational speed increases. However, simplified models of material topographies are needed, making it necessary to minimize the computing time. In this respect, Almqvist’s Ph.D. thesis [82] is found to be of immense benefit, which was built on the numerical model proposed by Tian and Bhushan [21].
Almqvist [82] proposed a contact model based on the theory of minimum potential complementary energy. The model was fed with the surface profile data of the interface of contact between two surfaces. By minimizing an integral energy equation, he determined the displacement of peaks and valleys in the profile as a function of the material properties and the applied contact pressure.
The model simulates the deformation occurring in the surface profile at the interface between the measured surface profile and an ideal plane [82]. The sizes of all cavities at the interface and total area of contact are definite. Hasheminezhad [11] employed Almqvist’s deterministic model [82] to estimate the length of the largest cavity (in the direction of the electric field) at the XLPE–XLPE interfaces. His study covered scanned 2D surface profiles of XLPE specimens. Kantar’s sequel to Hasheminezhad’s work [61,62] unveiled the necessity of a thorough 3D contact model. To that end, in [74], the proposed model in [11] was further extended using the analytical expressions derived in [82] to incorporate 3D surface profiles in addition to the 2D surface profiles. The deterministic interface contact model provides an insight into how the real area of contact at solid–solid interfaces varies as a function of the contact pressure, surface roughness, elasticity, and hardness of the solid material in 3D. The major upgrade to the 2D contact models is that the 3D contact surface simulations can reveal the interconnection between the cavities and visualize how long an air gap can be in all directions, not only in one horizontal direction as in the case of 2D models.
Kantar et al. [74,95] utilized contour and surface plots to present the results of the deterministic model. Contour lines depict the amplitudes of the asperities and the enclosed area of air gaps, as illustrated in Figure 16. Hence, the area between the air gaps represents the contact area at an interface. Color bars were used to represent peaks and the ground level (contact area) with amplitudes in μ m. The 3D simulations suggest that the increased contact pressure diminishes the number and length of long air gaps and thus creates more enclosed cavities. The exemplary cases of no-load (Figure 16a) and nominal contact pressure (Figure 16b) for the XLPE–XLPE #180 interface clearly depict this behavior. A selected portion of the original surface profile (yellow) and displacement of surface asperities (red) along with the deformed surface profile (blue) are presented in Figure 17. The surface profiles portray the equivalent rough surfaces while the horizontal axis delineates an ideal smooth plane (no cavities hypothetically). Therefore, the non-flat portions between the neighboring flat areas (contact spots) are the cavities. Differences between the no-load and deformed surface profiles reveal that the increased loading presses the floating edges toward the ideal plane, resulting in new contact points and thus smaller air gaps. Moreover, the discrete distribution of contact pressure along the interface is illustrated in Figure 17 (right-hand side y-axis). As seen, the contact spots enclosing the cavities undergo much higher pressure, in some cases leading to the plastic deformation (equal to the material hardness in the model) of those spots. Otherwise, elastic contact points occur at the contact areas that vary between zero and the material hardness. In [74,95], it was also shown that smoother interfaces lead to more enclosed, smaller cavities. Furthermore, the elasticity of the material proved to affect cavity sizes significantly—-interfaces between relatively hard materials are likely to contain longer and larger cavities (channels).

5. Concluding Remarks

In this paper, a thorough review of the modern and up-to-date literature addressing the electrical performance of cables, connectors, terminations, and other accessories that contain interfaces have been performed. Particular focus has been on the polymeric dielectric solid–solid interfaces, considering the causes of electrical interfacial failure and important factors that influence the dielectric strength of an interface. The following remarks can be made in the light of the thorough literature review:
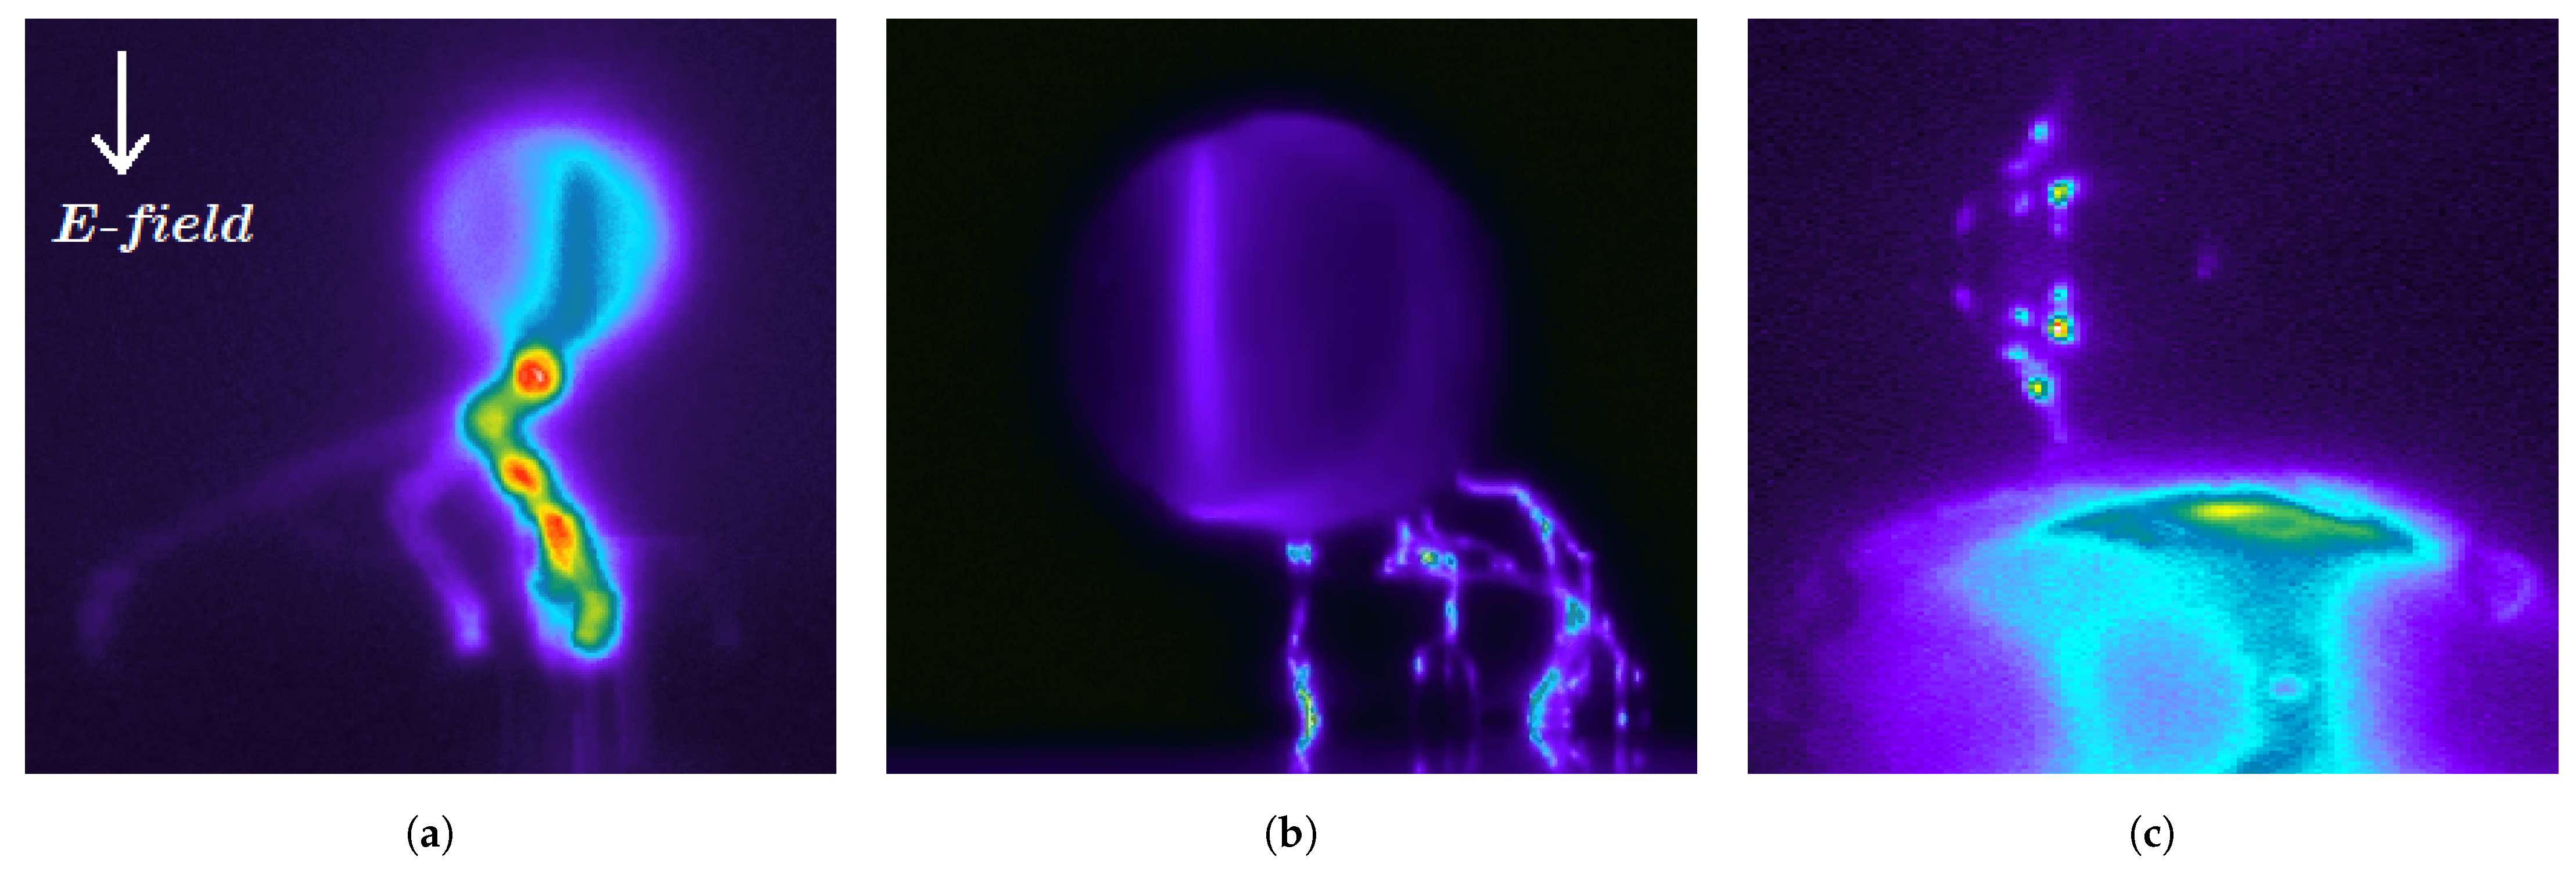
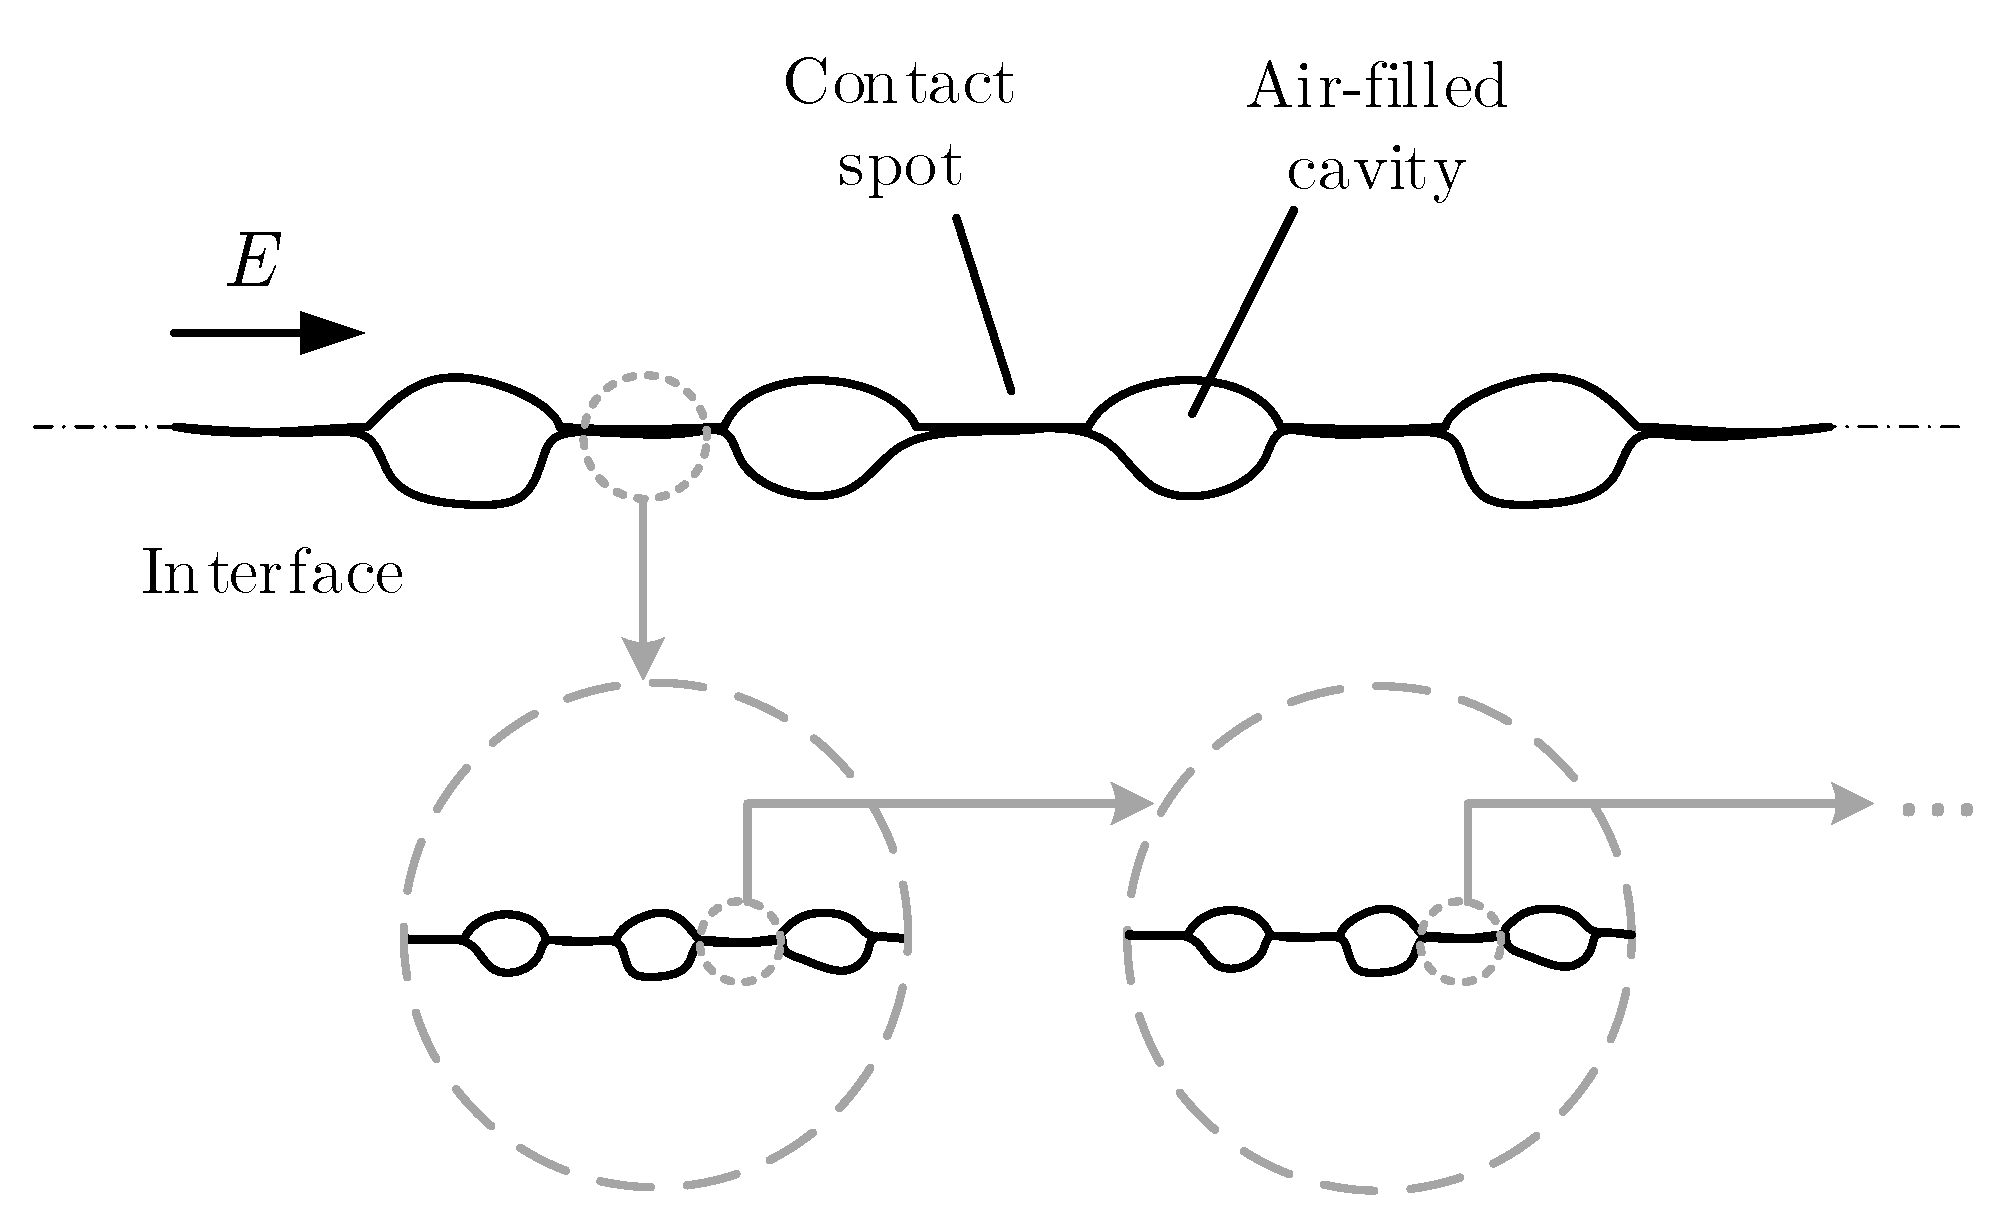
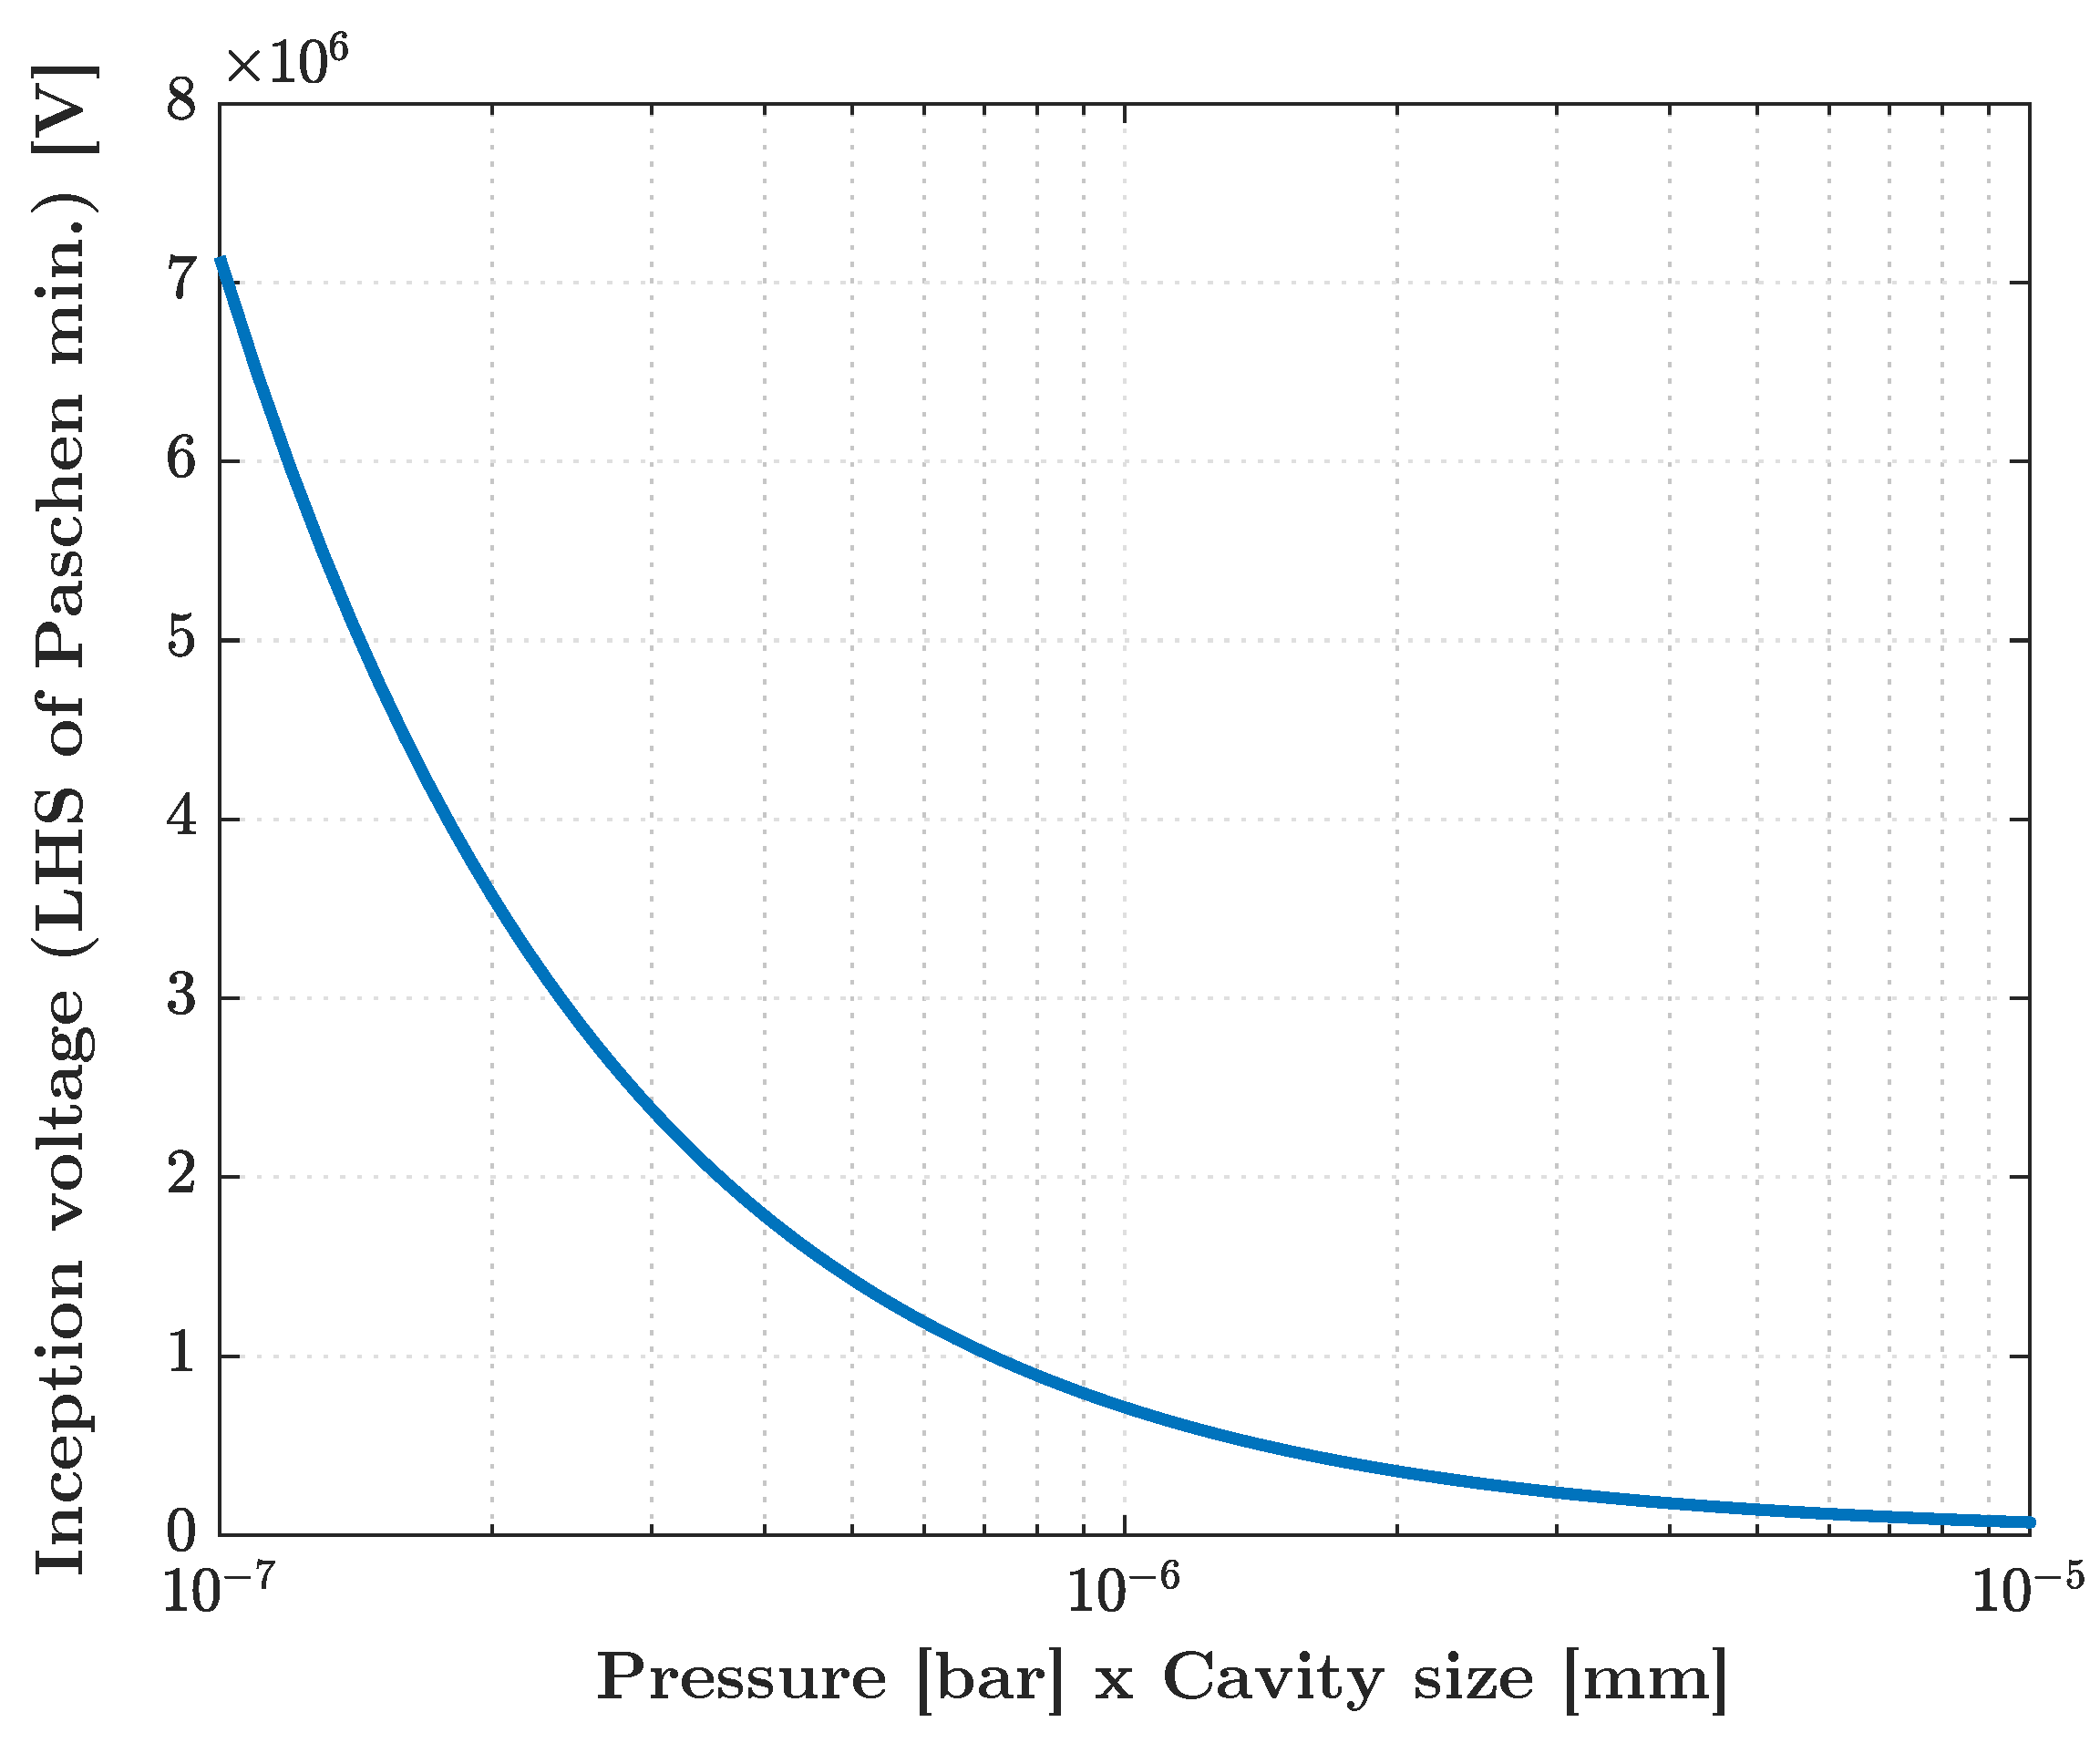
  • The findings from experimental and theoretical studies indicate that different processes control the discharge of air-filled cavities and the breakdown of contact spots. The main conclusion is that the properties of the cavities and contact spots govern the interface breakdown. On the one hand, the size, shape, and insulating medium inside the cavities determine the discharge inception field of the cavities. On the other hand, the tracking resistance of the contact spots between the discharged cavities heavily affects the interfacial breakdown strength. Different tracking resistances of the polymers tend to affect the primary discharge propagation mechanisms of particle bombardment and the light emission from the discharge channel. In contrast, the charge injection, trapping, and de-trapping mechanisms have indirect effects as they result in more intense light emission and local field distortion in the initiation stage.
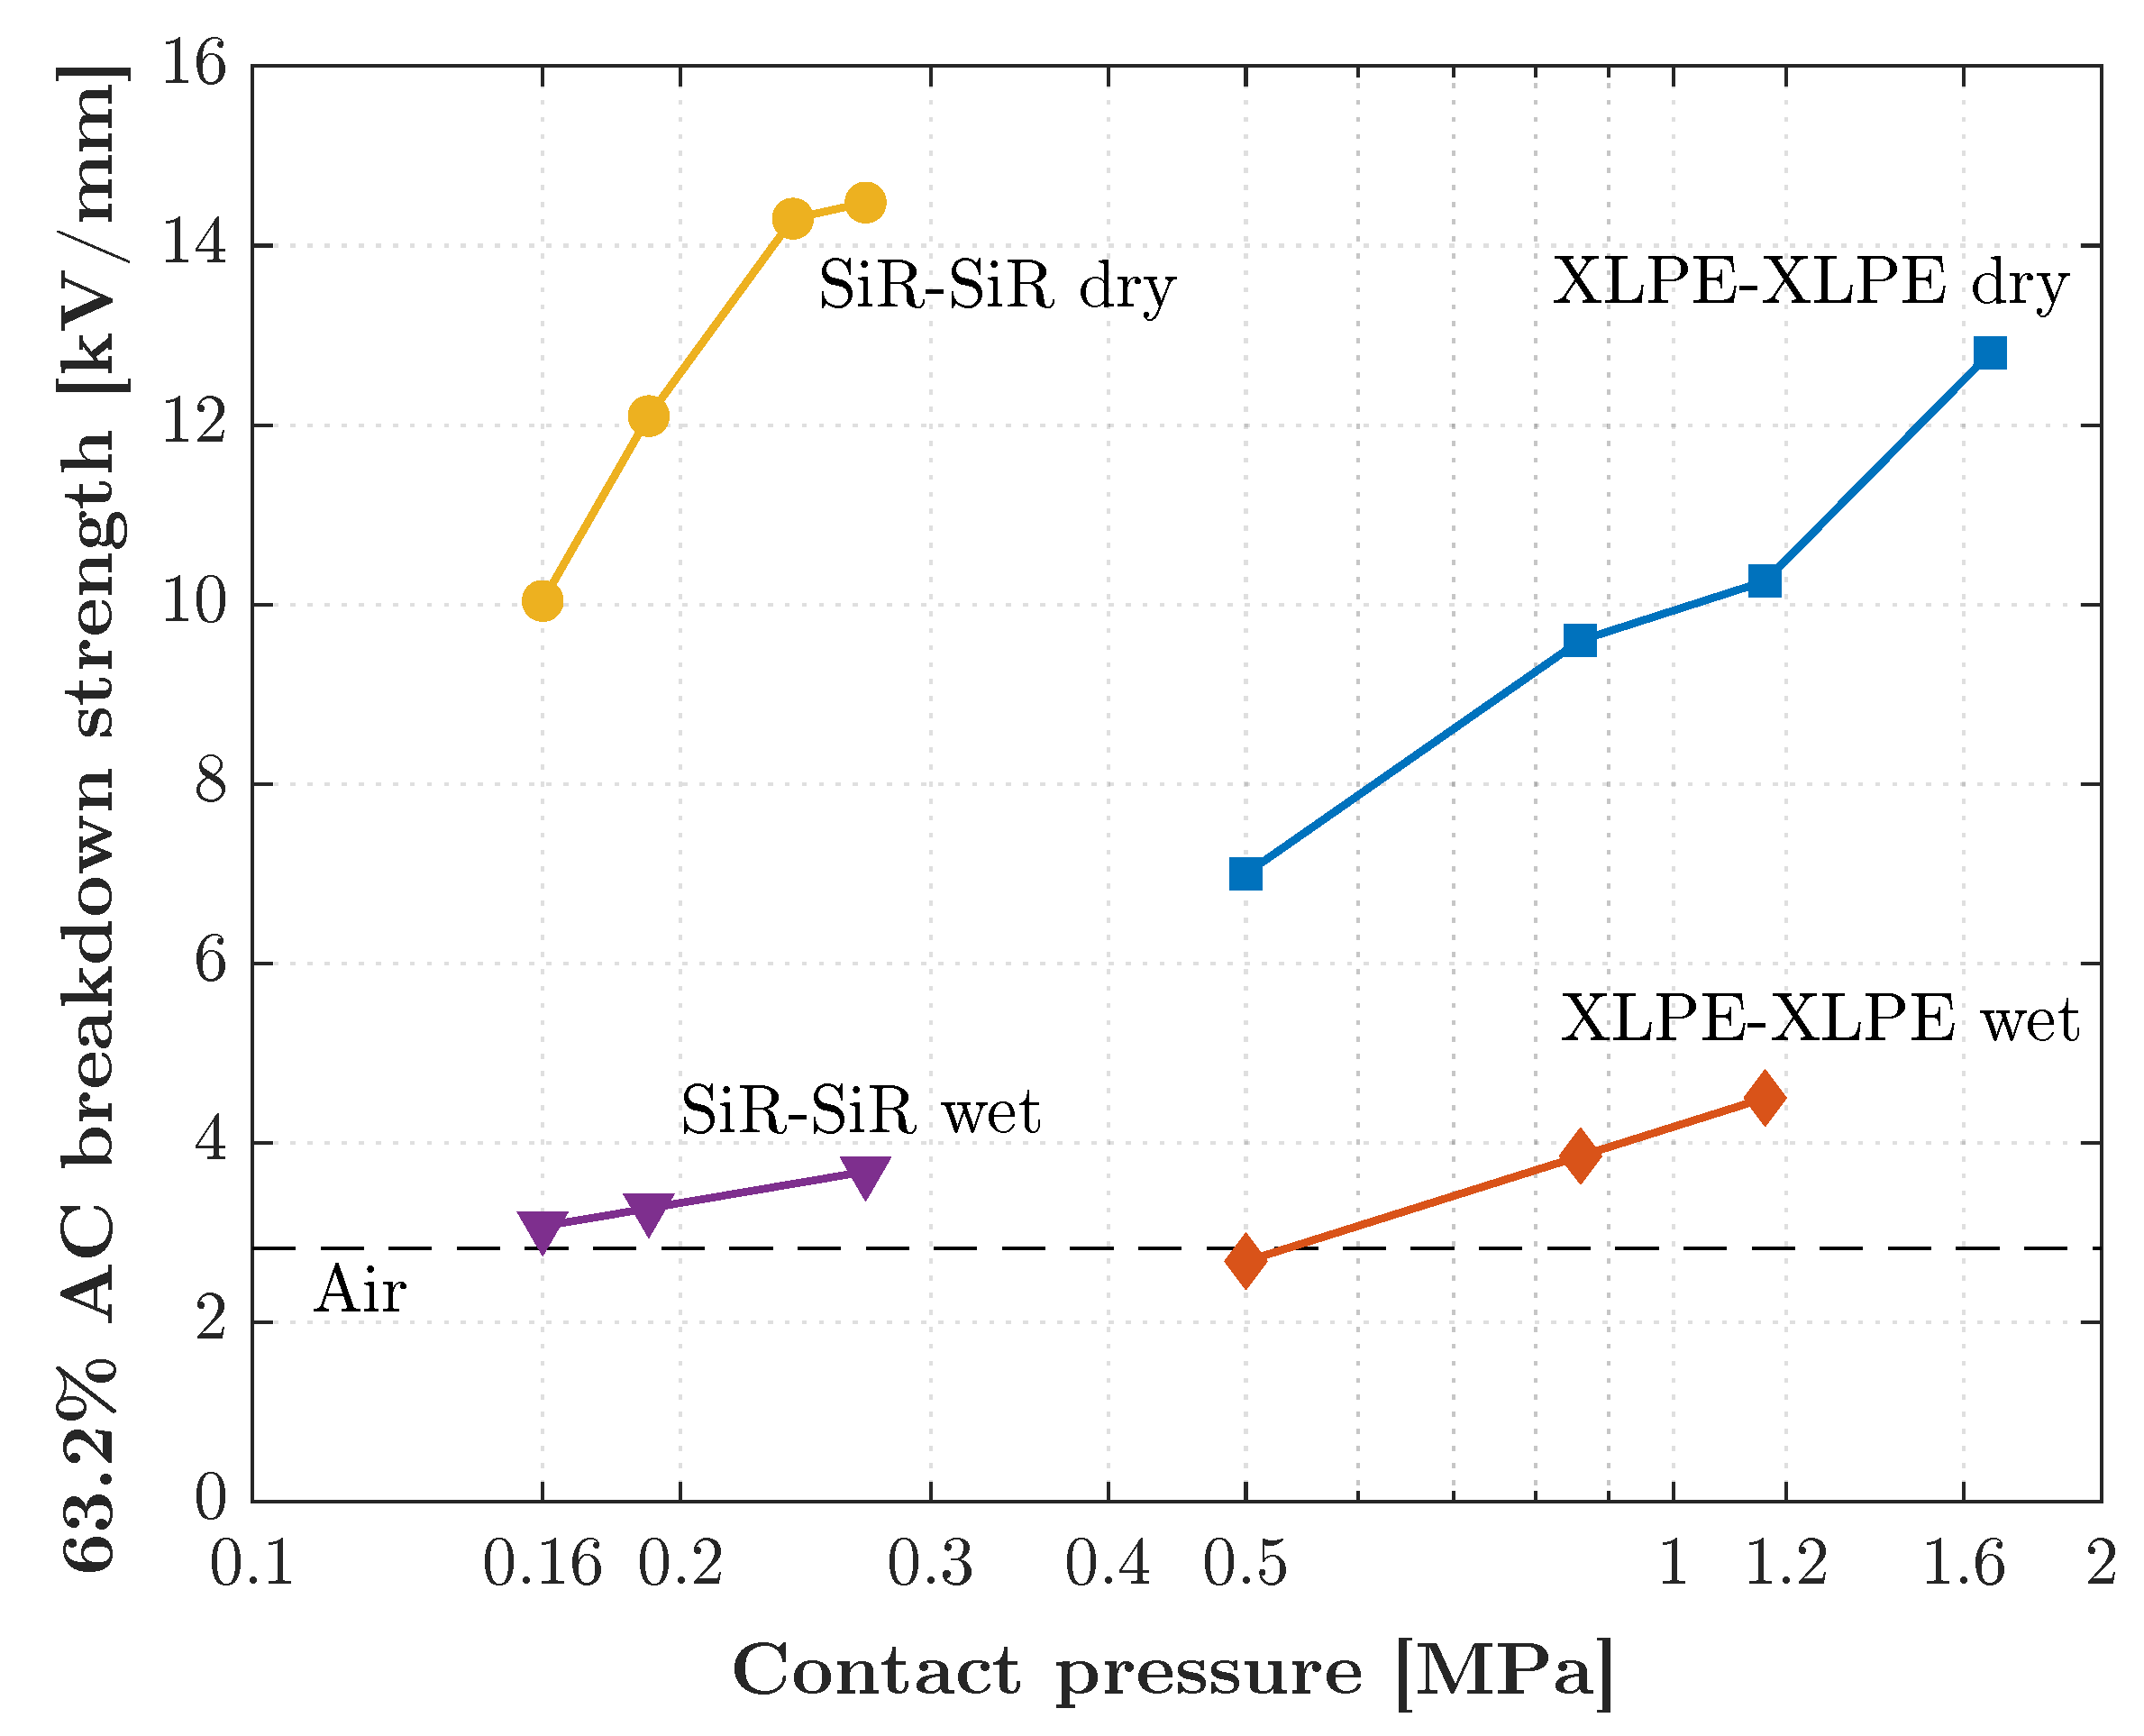
  • The breakdown strengths of the dry-mate interfaces are found to be the highest in the cases where the contact pressure is relatively high, and the interface is as smooth as possible. Consequently, solid–solid interfaces can be made to perform better by introducing a smoother surface and sustaining the interface pressure to be high enough throughout the service life.
  • Air-filled (dry-mate) cavities and water-filled (wet-mate) cavities yield breakdown strength values that are significantly lower than those in the case of oil-mate interfaces. Strong local field stresses arising at the edges of the contact area (due to short-circuited/discharged cavities) dramatically reduce the overall breakdown strength when water is present at an interface. Hence, water intrusion is a serious concern in the design of any HV equipment incorporating solid–solid interfaces.
  • The surface roughness has a significant influence on the interfacial breakdown strength. A high correlation between the interfacial breakdown strength and the surface roughness is found. The breakdown strength may potentially become twice as high from the roughest to the smoothest surface.
  • The elastic modulus stands out as an important material property for solid materials/interfaces because it strongly impacts the interfacial dielectric strength. Specifically, softer materials with low elastic moduli, such as SiR and XLPE, have a much higher breakdown strength when compared with stiffer materials with high elastic moduli.
  • Increased contact pressure yields higher BDS values irrespective of the surface roughness and elasticity, where elasticity can be a limiting factor in elastic contacts. In plastic contacts, the real area of contact does not increase even if the contact pressure is further increased.
  • Considering practical power cables and connectors, avoiding the loss of interfacial pressure between solid materials and water ingress appears to be of considerable value in practical applications to ensure a high breakdown strength and long service life.

Funding

The project is supported by The Research Council of Norway (Project No. 228344/E30).

Institutional Review Board Statement

Not applicable.

Informed Consent Statement

Not applicable.

Data Availability Statement

Not applicable.

Conflicts of Interest

The author declares no conflict of interest.

References

  1. Kunze, D.; Parmigiani, B.; Schroth, R.; Gockenbach, E. Macroscopic Internal Interfaces in High Voltage Cable Accessories; CIGRE Session: Paris, France, 2000; pp. 15–203. [Google Scholar]
  2. Siemens. Spectron. Available online: https://assets.siemens-energy.com/siemens/assets/api/uuid:e0e64e11-b801-4629-9f0f-50cd0c544f6f/spectronbrochure.pdf (accessed on 30 November 2021).
  3. Midttveit, S.; Monsen, B.; Frydenlund, S.; Stenevik, K. SS on Implications of subsea processing power distribution-subsea power systems—A key enabler for subsea processing. In Proceedings of the Offshore Technology Conference, Houston, TX, USA, 3–6 May 2010. [Google Scholar]
  4. Weiss, P.; Beurthey, S.; Chardard, Y.; Dhedin, J.; Andre, T.; Rabushka, K.; Tourcher, C.; Gauch, F.; Micoli, C. Novel wet-mate connectors for high voltage and power transmissions of ocean renewable energy systems. In Proceedings of the 4th International Conference on Ocean Energy, Dublin, Ireland, 17–19 October 2012. [Google Scholar]
  5. ∅stergaard, I.; Nysveen, A.; Romanisko, T. MECON: A High Voltage Subsea Connector. In Proceedings of the Offshore Technology Conference, Houston, TX, USA, 3–6 May 1999. [Google Scholar] [CrossRef]
  6. Myklatun, J.T. Condition Monitoring of Subsea Connectors. Master’s Thesis, Norwegian University of Science and Technology, Trondheim, Norway, 2014. [Google Scholar]
  7. Nysveen, A. Coupling-and Switch System for Subsea Electrical Power Distribution. U.S. Patent 5834721, 22 May 1998. [Google Scholar]
  8. Peschke, E.; von Olshausen, R. Cable Systems for High and Extra-High Voltage: Development, Manufacture, Testing, Installation and Operation of Cables and Their Accessories; Wiley-VCH: Hoboken, NJ, USA, 1999. [Google Scholar]
  9. Argaut, P.; Becker, J.; Dejean, P.M.; Sin, S.; Dorison, E. Studies and Development in France of 400 kV Cross-Linked Polyethylene Cable Systems; CIGRE Session: Paris, France, 2000; pp. 15–203. [Google Scholar]
  10. Argaut, P. (Ed.) Accessories for HV and EHV Extruded Cables; CIGRE Green Books; Springer: Berlin/Heidelberg, Germany, 2021. [Google Scholar]
  11. Hasheminezhad, S.M. Tangential Electric Breakdown Strength and PD Inception Voltage of Solid-Solid Interface. Ph.D. Thesis, Norwegian University of Science and Technology, Trondheim, Norway, 2016. [Google Scholar]
  12. Bogoeva-Gaceva, G.; Dimeski, D.; Srebrenkoska, V. Friction Mechanism of Polymers and Their Composites. Maced. J. Chem. Chem. Eng. 2018, 37, 1–11. [Google Scholar] [CrossRef]
  13. Takahashi, T.; Okamoto, T.; Ohki, Y.; Shibata, K. Breakdown strength at the interface between epoxy resin and silicone rubber—A basic study for the development of all solid insulation. IEEE Trans. Dielectr. Electr. Insul. 2005, 12, 719–724. [Google Scholar] [CrossRef]
  14. Fournier, D.; Dang, C.; Paquin, L. Interfacial breakdown in cable joints. In Proceedings of the 1994 IEEE International Symposium on Electrical Insulation, Pittsburgh, PA, USA, 5–8 June 1994; pp. 450–452. [Google Scholar] [CrossRef]
  15. Fournier, D.; Lamarre, L. Interfacial breakdown phenomena between two EPDM surfaces. In Proceedings of the Sixth International Conference on Dielectric Materials, Measurements and Applications, Manchester, UK, 7–10 September 1992; pp. 330–333. [Google Scholar]
  16. Fournier, D. Effect of the surface roughness on interfacial breakdown between two dielectric surfaces. In Proceedings of the Montreal, Montreal, QC, Canada, 16–19 June 1996; Volume 2, pp. 699–702. [Google Scholar]
  17. Du, B.; Gu, L. Effects of interfacial pressure on tracking failure between XLPE and silicon rubber. IEEE Trans. Dielectr. Electr. Insul. 2010, 17, 1922–1930. [Google Scholar] [CrossRef]
  18. Du, B.; Zhu, X.; Gu, L.; Liu, H. Effect of surface smoothness on tracking mechanism in XLPE-Si-rubber interfaces. IEEE Trans. Dielectr. Electr. Insul. 2011, 18, 176–181. [Google Scholar] [CrossRef]
  19. Dissado, L.A.; Fothergill, J.C. Electrical Degradation and Breakdown in Polymers; IET: London, UK, 1992; Volume 9. [Google Scholar]
  20. Bhushan, B. Contact mechanics of rough surfaces in tribology: Multiple asperity contact. Tribol. Lett. 1998, 4, 1–35. [Google Scholar] [CrossRef]
  21. Bhushan, B.; Tian, X. A numerical three-dimensional model for the contact of rough surfaces by variational principle. ASME J. Tribol 1996, 118, 33–42. [Google Scholar]
  22. CIGRE Technical Brochure 210. Joint Task Force 21/15: Interface in Accessories for Extruded HV and EHV Cables; CIGRE: Paris, France, 2002. [Google Scholar]
  23. Albayrak, S.; Becker-Willinger, C.; Aslan, M.; Veith, M. Influence of nano-scaled zirconia particles on the electrical properties of polymer insulating materials. IEEE Trans. Dielectr. Electr. Insul. 2012, 19, 76–82. [Google Scholar] [CrossRef]
  24. Roy, M.; Nelson, J.K.; MacCrone, R.K.; Schadler, L.S.; Reed, C.W.; Keefe, R. Polymer nanocomposite dielectrics-the role of the interface. IEEE Trans. Dielectr. Electr. Insul. 2005, 12, 629–643. [Google Scholar] [CrossRef]
  25. Ding, H.Z.; Varlow, B.R. Effect of nano-fillers on electrical treeing in epoxy resin subjected to AC voltage. In Proceedings of the 17th Annual Meeting of the IEEE Lasers and Electro-Optics Society, Boulder, CO, USA, 20 October 2004; pp. 332–335. [Google Scholar]
  26. Li, J.; Du, B.X.; Xu, H. Suppressing interface charge between LDPE and EPDM for HVDC cable accessory insulation. IEEE Trans. Dielectr. Electr. Insul. 2017, 24, 1331–1339. [Google Scholar] [CrossRef]
  27. Du, B.X.; Li, J. Interface charge behaviors between LDPE and EPDM filled with carbon black nanoparticles. IEEE Trans. Dielectr. Electr. Insul. 2016, 23, 3696–3703. [Google Scholar] [CrossRef]
  28. Du, B.X.; Xu, H.; Li, J. Effects of mechanical stretching on space charge behaviors of PP/POE blend for HVDC cables. IEEE Trans. Dielectr. Electr. Insul. 2017, 24, 1438–1445. [Google Scholar] [CrossRef]
  29. Huuva, R.; Englund, V.; Gubanski, S.M.; Hjertberg, T. A versatile method to study electrical treeing in polymeric materials. IEEE Trans. Dielectr. Electr. Insul. 2009, 16, 171–178. [Google Scholar] [CrossRef]
  30. Chen, X.; Xu, Y.; Cao, X.; Gubanski, S.M. Electrical treeing behavior at high temperature in XLPE cable insulation samples. IEEE Trans. Dielectr. Electr. Insul. 2015, 22, 2841–2851. [Google Scholar] [CrossRef]
  31. Fothergill, J.C. Filamentary electromechanical breakdown. IEEE Trans. Electr. Insul. 1991, 26, 1124–1129. [Google Scholar] [CrossRef]
  32. Eichhorn, R.M. Treeing in Solid Extruded Electrical Insulation. IEEE Trans. Electr. Insul. 1977, EI-12, 2–18. [Google Scholar] [CrossRef]
  33. Mason, J.H. Assessing the resistance of polymers to electrical treeing. IEE Proc. A Phys. Sci. Meas. Instrum. Manag. Educ. Rev. 1981, 128, 193–201. [Google Scholar] [CrossRef]
  34. Roseen, P.A.; Gubanski, S.M.; Gedde, U.W. External PD resistance of thermoplastic and XLPE containing voltage stabilizers. IEEE Trans. Dielectr. Electr. Insul. 1998, 5, 189–194. [Google Scholar] [CrossRef]
  35. Hammarström, T.J.Å.; Bengtsson, T.; Gubanski, S.M. Partial discharge characteristics of electrical treeing in XLPE insulation exposed to voltages of different rise times. In Proceedings of the 2017 International Symposium on Electrical Insulating Materials (ISEIM), Toyohashi, Japan, 11–15 September 2017; Volume 1, pp. 407–410. [Google Scholar] [CrossRef]
  36. Chen, X.; Murdany, D.; Liu, D.; Andersson, M.; Gubanski, S.M.; Gedde, U.W.; Suwarno. AC and DC pre-stressed electrical trees in LDPE and its aluminum oxide nanocomposites. IEEE Trans. Dielectr. Electr. Insul. 2016, 23, 1506–1514. [Google Scholar] [CrossRef]
  37. Chen, X.; Xu, Y.; Cao, X.; Gubanski, S.M. On the conducting and non-conducting electrical trees in XLPE cable insulation specimens. IEEE Trans. Dielectr. Electr. Insul. 2016, 23, 95–103. [Google Scholar] [CrossRef]
  38. Zheng, Y.; Serdyuk, Y.V.; Gubanski, S.M. Space charge controlled electric field preceding inception of electric tree in XLPE at AC voltage. In Proceedings of the 2015 IEEE 11th International Conference on the Properties and Applications of Dielectric Materials (ICPADM), Sydney, NSW, Australia, 19–22 July 2015; pp. 132–135. [Google Scholar] [CrossRef]
  39. Jarvid, E.M.; Johansson, A.B.; Blennow, J.H.M.; Andersson, M.R.; Gubanski, S.M. Evaluation of the performance of several object types for electrical treeing experiments. IEEE Trans. Dielectr. Electr. Insul. 2013, 20, 1712–1719. [Google Scholar] [CrossRef]
  40. Chen, X.R.; Hu, L.B.; Xu, Y.; Cao, X.L.; Gubanski, S.M. Investigation of temperature effect on electrical trees in XLPE cable insulation. In Proceedings of the 2012 Annual Report Conference on Electrical Insulation and Dielectric Phenomena, Montreal, QC, Canada, 14–17 October 2012; pp. 612–615. [Google Scholar] [CrossRef]
  41. Jarvid, M.; Johansson, A.; Englund, V.; Gubanski, S.; Andersson, M.R. Electrical tree inhibition by voltage stabilizers. In Proceedings of the 2012 Annual Report Conference on Electrical Insulation and Dielectric Phenomena, Montreal, QC, Canada, 14–17 October 2012; pp. 605–608. [Google Scholar] [CrossRef]
  42. Sonerud, B.; Blennow, J.; Gubanski, S.M.; Nilsson, S.; Bengtsson, T. Continuous monitoring of dielectric properties of LDPE samples during electrical treeing. In Proceedings of the 2010 10th IEEE International Conference on Solid Dielectrics, Potsdam, Germany, 4–9 July 2010; pp. 1–4. [Google Scholar] [CrossRef]
  43. Roseen, P.A.; Reitberger, T.; Gubanski, S.M.; Gedde, U.W. PD resistance of thermally aged polyethylene and carbonyl-containing model polymers. IEEE Trans. Dielectr. Electr. Insul. 1999, 6, 191–201. [Google Scholar] [CrossRef]
  44. Dang, C.; Fournier, D. Dielectric performance of interfaces in premolded cable joints. IEEE Tran. Power Deliv. 1997, 12, 29–32. [Google Scholar] [CrossRef]
  45. Fournier, D.; Lamarre, L. Effect of pressure and length on interfacial breakdown between two dielectric surfaces. In Proceedings of the Conference Record of the 1992 IEEE International Symposium on Electrical Insulation, Baltimore, MD, USA, 7–10 June 1992; pp. 270–272. [Google Scholar] [CrossRef]
  46. Fournier, D.; Lamarre, L. Effect of pressure and temperature on interfacial breakdown between two dielectric surfaces. In Proceedings of the 1992 Annual Report: Conference on Electrical Insulation and Dielectric Phenomena, Victoria, BC, Canada, 18–21 October 1992; pp. 229–235. [Google Scholar]
  47. Kantar, E.; Mauseth, F.; Ildstad, E. Effect of pressure and elastic modulus on tangential breakdown strength of solid-solid interfaces. In Proceedings of the 2016 IEEE Electrical Insulation Conference (EIC), Montreal, QC, Canada, 19–22 June 2016; pp. 431–435. [Google Scholar] [CrossRef]
  48. Kantar, E.; Panagiotopoulos, D.; Ildstad, E. Factors Influencing the Tangential AC Breakdown Strength of Solid-Solid Interfaces. IEEE Trans. Dielectr. Electr. Insul. 2016, 23, 1778–1788. [Google Scholar] [CrossRef] [Green Version]
  49. Kunze, D. Untersuchungen an Grenzflächen Zwischen Polymerwerkstoffen Unter Elektrischer Hochfeldbeanspruchung in der Garniturentechnik VPE-Isolierter Hochspannungskabel; Shaker: Düren, Germany, 2000. [Google Scholar]
  50. Du, B.; Gu, L.; Zhang, X.; Zhu, X. Fundamental research on dielectric breakdown between XLPE and silicon rubber interface in HV cable joint. In Proceedings of the 2009 IEEE 9th International Conference on the Properties and Applications of Dielectric Materials, Harbin, China, 19–23 July 2009; pp. 97–100. [Google Scholar]
  51. Chen, X.; Gu, L.; He, X.; Liao, H. Tracking failure process of XLPE–Silicone rubber interface under impulse voltage. In Proceedings of the 2012 International Conference on High Voltage Engineering and Application, Shanghai, China, 17–20 September 2012; pp. 51–54. [Google Scholar]
  52. Hasheminezhad, M.; Ildstad, E. Application of contact analysis on evaluation of breakdown strength and PD inception field strength of solid-solid interfaces. IEEE Trans. Dielectr. Electr. Insul. 2012, 19, 1–7. [Google Scholar] [CrossRef]
  53. Hasheminezhad, M.; Ildstad, E. Partial discharge inception of interface voids versus mechanical surface pressure. In Proceedings of the 2010 International Conference on High Voltage Engineering and Application, New Orleans, LA, USA, 11–14 October 2010; pp. 397–400. [Google Scholar] [CrossRef]
  54. Hasheminezhad, S.M.; Ildstad, E.; Nysveen, A. Breakdown strength of solid-solid interface. In Proceedings of the 2010 10th IEEE International Conference on Solid Dielectrics, Potsdam, Germany, 4–9 July 2010; pp. 1–4. [Google Scholar] [CrossRef] [Green Version]
  55. Hasheminezhad, S.M. Breakdown strength of solid | solid interfaces. In Proceedings of the Trondheim PowerTech, Trondheim, Norway, 19–23 June 2011; pp. 1–7. [Google Scholar]
  56. Hasheminezhad, M.; Ildstad, E. Breakdown strength of solid-solid interfaces. In Proceedings of the Nordic Insulation Symposium (NORD-IS), Trondheim, Norway, 9–12 June 2011. [Google Scholar]
  57. Kantar, E.; Ildstad, E. Modeling longitudinal breakdown strength of solid-solid interfaces using contact theory. In Proceedings of the 2016 IEEE International Conference on Dielectrics (ICD), Montpellier, France, 3–7 July 2016; Volume 1, pp. 398–401. [Google Scholar] [CrossRef]
  58. Kantar, E.; Hvidsten, S.; Mauseth, F.; Ildstad, E. On the Tangential AC Breakdown Strength of Polymeric Interfaces Considering Elastic Modulus. In Proceedings of the 2017 IEEE Conference on Electrical Insulation and Dielectric Phenomenon (CEIDP), Fort Worth, TX, USA, 22–25 October 2017; pp. 816–819. [Google Scholar] [CrossRef] [Green Version]
  59. Kantar, E.; Hvidsten, S.; Mauseth, F.; Ildstad, E. Tangential AC Breakdown Strength of Solid-Solid Interfaces Considering Surface Roughness. In Proceedings of the 2017 IEEE Conference on Electrical Insulation and Dielectric Phenomenon (CEIDP), Fort Worth, TX, USA, 22–25 October 2017; pp. 580–583. [Google Scholar] [CrossRef] [Green Version]
  60. Kantar, E.; Hvidsten, S.; Mauseth, F.; Ildstad, E. Longitudinal AC Breakdown Voltage of XLPE-XLPE Interfaces Considering Surface Roughness and Pressure. IEEE Trans. Dielectr. Electr. Insul. 2017, 24, 3047–3054. [Google Scholar] [CrossRef] [Green Version]
  61. Kantar, E.; Hvidsten, S.; Ildstad, E. Effect of Material Elasticity on the Longitudinal AC Breakdown Strength of Solid-Solid Interfaces. IEEE Trans. Dielectr. Electr. Insul. 2019, 26, 655–663. [Google Scholar] [CrossRef]
  62. Kantar, E.; Hvidsten, S.; Mauseth, F.; Ildstad, E. A Stochastic Model for Contact Surfaces at Polymer Interfaces Subjected to an Electrical Field. Tribol. Int. 2018, 127, 361–371. [Google Scholar] [CrossRef]
  63. Kantar, E. Mechanisms Governing Longitudinal AC Breakdown at Solid-Solid Interfaces. In Proceedings of the 2020 IEEE Conference on Electrical Insulation and Dielectric Phenomena (CEIDP), East Rutherford, NJ, USA, 18–30 October 2020; pp. 279–283. [Google Scholar] [CrossRef]
  64. Du, B.X.; Ma, Z.L.; Cheng, X.X.; Liu, Y. Hydrophobicity evaluation of silicone rubber insulator using PD-induced electromagnetic wave. IEEE Trans. Dielectr. Electr. Insul. 2012, 19, 1060–1067. [Google Scholar] [CrossRef]
  65. Illias, H.A. Measurement and Simulation of Partial Discharges within a Spherical Cavity in a Solid Dielectric Material. Ph.D. Thesis, University of Southampton, Southampton, UK, 2011. [Google Scholar]
  66. Illias, H.; Chen, G.; Lewin, P.L. Modeling of partial discharge activity in spherical cavities within a dielectric material. IEEE Electr. Insul. Mag. 2011, 27, 38–45. [Google Scholar] [CrossRef]
  67. Illias, H.; Yuan, T.S.; Mokhlis, H.; Chen, G.; Lewin, P.L. Partial discharge patterns in high voltage insulation. In Proceedings of the 2012 IEEE International Conference on Power and Energy (PECon), Kota Kinabalu, Malaysia, 2–5 December 2012; pp. 750–755. [Google Scholar]
  68. Adhikari, D.; Hepburn, D.M.; Stewart, B.G. PD characteristics and degradation in PET insulation with vented and unvented internal voids. Electr. Power Syst. Res. 2013, 100, 65–72. [Google Scholar] [CrossRef]
  69. Adhikari, D.; Hepburn, D.M.; Stewart, B.G. Analysis of partial discharge characteristics in artificially created voids. In Proceedings of the 45th International Universities Power Engineering Conference UPEC2010, Cardiff, UK, 31 August–3 September 2010; pp. 1–4. [Google Scholar]
  70. Mas’ud, A.A.; Stewart, B.G. An investigative study on the influence of correlation of PD statistical features on PD pattern recognition. In Proceedings of the 2018 IEEE 2nd International Conference on Dielectrics (ICD), Budapest, Hungary, 1–5 July 2018; pp. 1–5. [Google Scholar] [CrossRef]
  71. Mohamed, F.P.; Siew, W.H.; Sheng, B.; Stewart, B. Effect of voltage reduction in minimising partial discharge activity in cables—Experimental study. In Proceedings of the 2017 IEEE Conference on Electrical Insulation and Dielectric Phenomenon (CEIDP), Fort Worth, TX, USA, 22–25 October 2017; pp. 331–334. [Google Scholar] [CrossRef]
  72. Adhikari, D.; Hepburn, D.M.; Stewart, B.G. Comparison of partial discharge characteristics and degradation in several polymeric insulators. IET Sci. Meas. Tech. 2012, 6, 474–484. [Google Scholar] [CrossRef]
  73. Reid, A.J.; Hepbum, D.M.; Stewart, B.G. The influence of external magnetic fields on the partial discharge characteristics of voids. In Proceedings of the 2013 IEEE Electrical Insulation Conference (EIC), Ottawa, ON, Canada, 2–5 June 2013; pp. 147–150. [Google Scholar] [CrossRef]
  74. Kantar, E.; Hvidsten, S. A deterministic breakdown model for dielectric interfaces subjected to tangential electric field. J. Phys. D Appl. Phys. 2021, 54, 295503. [Google Scholar] [CrossRef]
  75. Gu, L.; He, X. Microcavity on tracking failure of XLPE-SiR interface. In Proceedings of the 2012 Asia-Pacific Power and Energy Engineering Conference, Shanghai, China, 27–29 March 2012; pp. 1–4. [Google Scholar]
  76. Kantar, E.; Ildstad, E. A Novel Methodology to Monitor Partial Discharges in Microvoids at Solid-Solid Interfaces. In Proceedings of the 2019 IEEE Conference on Electrical Insulation and Dielectric Phenomena (CEIDP), Richland, WA, USA, 20–23 October 2019; pp. 113–117. [Google Scholar] [CrossRef] [Green Version]
  77. Kato, M.; Nishimura, Y.; Osawa, N.; Yoshioka, Y.; Yanase, H.; Okamoto, K. Effects of Compressive Force and Dielectric Materials on Contact Area for High-Pressure Region and Interfacial AC Breakdown between Two Solid Dielectrics. In Proceedings of the 21st International Symposium on High Voltage Engineering (ISH 2019), Budapest, Hungary, 26–30 August 2019; pp. 118–129. [Google Scholar] [CrossRef]
  78. Kantar, E. Longitudinal AC Electrical Breakdown Strength of Polymer Interfaces. Ph.D. Thesis, Norwegian University of Science and Technology, Trondheim, Norway, 2019. [Google Scholar]
  79. Gao, Y.; Yuan, Y.; Chen, L.; Li, J.; Huang, S.; Du, B. Direct Fluorination Induced Variation in Interface Discharge Behavior between Polypropylene and Silicone Rubber Under AC Voltage. IEEE Access 2018, 6, 23907–23917. [Google Scholar] [CrossRef]
  80. Dissado, L.A. Understanding electrical trees in solids: From experiment to theory. IEEE Trans. Dielectr. Electr. Insul. 2002, 9, 483–497. [Google Scholar] [CrossRef]
  81. Borodich, F.M.; Pepelyshev, A.; Savencu, O. Statistical approaches to description of rough engineering surfaces at nano and microscales. Tribol. Int. 2016, 103, 197–207. [Google Scholar] [CrossRef] [Green Version]
  82. Almqvist, A. On the Effects of Surface Roughness in Lubrication. Ph.D. Thesis, Luleå Tekniska Universitet, Luleå, Sweden, 2006. [Google Scholar]
  83. Ciavarella, M.; Demelio, G.; Barber, J.; Jang, Y.H. Linear elastic contact of the Weierstrass profile. Proc. R. Soc. Lond. Ser. A Math. Phys. Eng. Sci. 2000, 456, 387–405. [Google Scholar] [CrossRef] [Green Version]
  84. Majumdar, A.; Bhushan, B. Fractal model of elastic-plastic contact between rough surfaces. J. Tribol. 1991, 113, 1–11. [Google Scholar] [CrossRef]
  85. Majumdar, A.; Bhushan, B. Role of fractal geometry in roughness characterization and contact mechanics of surfaces. J. Tribol. 1990, 112, 205–216. [Google Scholar] [CrossRef]
  86. Ganti, S.; Bhushan, B. Generalized fractal analysis and its applications to engineering surfaces. Wear 1995, 180, 17–34. [Google Scholar] [CrossRef]
  87. Bhushan, B. Handbook of Micro/Nano Tribology; CRC Press: Boca Raton, FL, USA, 1998. [Google Scholar]
  88. Zhuravlev, V. On the question of theoretical justification of the Amontons-Coulomb law for friction of unlubricated surfaces. Proc. IMechE Part J. 2007, 221, 895–898. [Google Scholar] [CrossRef]
  89. Greenwood, J.; Williamson, J. Contact of nominally flat surfaces. Proc. R. Soc. Lond. Ser. A Math. Phys. Eng. Sci. 1966, 295, 300–319. [Google Scholar]
  90. Bhushan, B. Principles and Applications of Tribology; John Wiley & Sons: Hoboken, NJ, USA, 2013. [Google Scholar]
  91. Bhushan, B. Analysis of the Real Area of Contact between a Polymeric Magnetic Medium and a Rigid Surface. J. Tribol. 1984, 106, 26–34. [Google Scholar] [CrossRef]
  92. Williamson, J.; Pullen, J.; Hunt, R. The shape of solid surfaces. Surf. Mech. ASME 1969, 9, 334. [Google Scholar]
  93. Greenwood, J. The area of contact between rough surfaces and flats. J. Lubr. Tech. 1967, 89, 81–87. [Google Scholar] [CrossRef]
  94. Greenwood, J.; Tripp, J. The contact of two nominally flat rough surfaces. Proc. Instit. Mech. Eng. 1970, 185, 625–633. [Google Scholar] [CrossRef]
  95. Kantar, E. A Deterministic Model for Contact Surfaces at Dielectric Interfaces Subjected to an Electrical Field. In Proceedings of the 2020 IEEE Conference on Electrical Insulation and Dielectric Phenomena (CEIDP), East Rutherford, NJ, USA, 18–30 October 2020; pp. 21–26. [Google Scholar] [CrossRef]
  96. Zhu, B.; Jia, Z.; Hu, H.; Ouyang, X.; Wang, X. Relationship between the Interfacial DC Breakdown Voltage and the Morphology of the XLPE/SiR Interface. IEEE Trans. Dielectr. Electr. Insul. 2019, 26, 689–697. [Google Scholar] [CrossRef]
Figure 1. Categories covered in the literature review.
Energies 14 08067 g001
Figure 2. Plug and receptacle of a subsea connector [2].
Energies 14 08067 g002
Figure 3. Illustration of the insulation system of a subsea connector with two nested, oil-filled diaphragms [2].
Energies 14 08067 g003
Figure 4. Illustration of a subsea connector and possible failure mechanisms. Reproduced from [6], NTNU: 2014.
Energies 14 08067 g004
Figure 5. Illustration of the tangential electric field distribution in a subsea connector: (a) Contour plot. (b) Surface plot. Reproduced from [6], NTNU: 2014.
Energies 14 08067 g005
Figure 6. Illustration of a cable joint highlighting the parts where the solid–solid interfaces exist and why the tangential electric field is of concern: (a) prefabricated EHV silicone joint for 400 kV XLPE-insulated cables. Reproduced from [11], NTNU: 2016. (b) Calculated potential distribution in a prefabricated slip-on joint. Reproduced from [1], CIGRE: 2000. (c) Calculated field patterns in a prefabricated slip-on joint. Reproduced from [1], CIGRE: 2000.
Energies 14 08067 g006
Figure 7. Illustration of surface asperities leading to cavities and contact spots at solid–solid interfaces at (a) no-load, (b) increased contact area and reduced cavity size under load. Reproduced from [12], Macedonian Journal of Chemistry and Chemical Engineering: 2018.
Energies 14 08067 g007
Figure 8. (a) Demonstration of two rough surfaces in contact. (b) Contact area and cavities at the interface in 3D. (c) A two-dimensional illustration of cavities at the interface. Reproduced from [21], ASME Journal of Tribology: 1996.
Energies 14 08067 g008
Figure 9. Parameters influencing the breakdown voltage (dielectric strength) of solid–solid interfaces. (a) Balloon chart summarizing the parameters. (b) Electrical interface strength vs. pressure and roughness. Reproduced from [22], CIGRE: 2002.
Energies 14 08067 g009
Figure 10. Overview of the resulting breakdown strength values of dry and wet-mate interfaces using XLPE-insulated cable samples in Hasheminezhad’s Ph.D. thesis [11]. Reproduced from [11], NTNU:2016.
Energies 14 08067 g010
Figure 11. Longitudinal AC BDS values of dry-mate and wet-mate XLPE–XLPE #500 and SiR–SiR #500 interfaces vs. the contact pressure (the BDS of air (∼2.8 kV/mm (RMS)) is measured using the same experimental setup in ambient air at the laboratory with an electrode distance of 4 mm, as performed in the interface breakdown experiments).
Energies 14 08067 g011
Figure 12. Discharge activity observed at the PEEK#500–glass interface (main discharge source is a 1-mm artificial cavity). Reproduced from [76], IEEE: 2021. (a) Continuous discharge channels with high cross-section. (b) Continuous discharge channels with low cross-section. (c) Isolated, discharged micro-cavities.
Energies 14 08067 g012
Figure 13. Processes for the degradation and breakdown of ideal contact areas at different phases of the interfacial discharge. Reproduced from [79], IEEE: 2018. (a) Initiation phase. (b) Propagation phase.
Energies 14 08067 g013
Figure 14. Characterization of rough surfaces in a multiscale-form by fractal approaches.
Energies 14 08067 g014
Figure 15. The left side of the Paschen minimum for air at atmospheric air pressure (1 bar).
Energies 14 08067 g015
Figure 16. Illustration of a measured 3D surface profile of an XLPE sample (polished by sandpaper grit #180) with a filled-contour plot for the projection of the 3D surface on a 2D surface at (a) 0.5 MPa, (b) 4.46 MPa.
Energies 14 08067 g016
Figure 17. Measured (no-load) 2D surface profile of the XLPE–XLPE #180 interface, displacement of peaks after loading (4.46 MPa), deformed profile, and distribution of contact pressure at contact spots. Nominal longitudinal distance ( x r e f ) is 1.2532 mm.
Energies 14 08067 g017
Table 1. Overview of the experimental results on the effect of surface roughness. ’#’ stands for the sandpaper grit no. used for each interface while R a is the mean arithmetic height of the asperities at each interface.
XLPE–XLPE Interface 63.2 % BDS [ kV / mm ] at p a
0.5 MPa 0.86 MPa 1.16 MPa
# 180 ( R a = 8.9 μ m ) 5.92 7.13 8.67
# 500 ( R a = 7.8 μ m ) 6.99 9.61 10.26
# 1000 ( R a = 1.7 μ m ) 7.56 10.13 11.62
# 2400 ( R a = 0.3 μ m ) 10.98 14.69 18.70
Table 2. Overview of the experimental results on the effect of elasticity.
Contact PressureSiR–SiRXLPE–XLPEEPOXY–EPOXYPEEK–PEEK
p a 63.2 % BDS p a 63.2 % BDS p a 63.2 % BDS p a 63.2 % BDS
[ MPa ] [ kV / mm ] [ MPa ] [ kV / mm ] [ MPa ] [ kV / mm ] [ MPa ] [ kV / mm ]
p a 1 0.16 10.0 0.5 7.0 1.16 8.9 1.16 6.3
p a 2 0.19 12.1 0.86 9.6 1.67 10.0 1.67 8.1
p a 3 0.24 14.3 1.16 10.3 2.25 12.6 2.25 11.1
p a 4 0.27 14.5 1.67 12.8 3.34 15.6 3.34 15.1
Publisher’s Note: MDPI stays neutral with regard to jurisdictional claims in published maps and institutional affiliations.

