Article

Experimental Validation of a Dynamic Photovoltaic/Thermal Collector Model in Combination with a Thermal Energy Storage Tank

by
Klemen Sredenšek
1,*,
Sebastijan Seme
1,2,
Bojan Štumberger
1,2,
Miralem Hadžiselimović
1,2,
Amor Chowdhury
1,2 and
Zdravko Praunseis
1
1
Faculty of Energy Technology, University of Maribor, Hočevarjev trg 1, 8270 Krško, Slovenia
2
Faculty of Electrical Engineering and Computer Science, University of Maribor, Koroška cesta 46, 2000 Maribor, Slovenia
*
Author to whom correspondence should be addressed.
Energies 2021, 14(23), 8162; https://doi.org/10.3390/en14238162
Submission received: 11 November 2021 / Revised: 1 December 2021 / Accepted: 2 December 2021 / Published: 6 December 2021

Abstract

:
The primary objective of this paper is to present a dynamic photovoltaic/thermal collector model in combination with a thermal energy storage tank. The added value of the proposed model is the use and integration of existing dynamic models for describing the entire photovoltaic/thermal system. The presented model was validated using measurements on the experimental system located at the Institute of Energy Technology, Faculty of Energy Technology, University of Maribor. The validation was carried out based on three different weather conditions—sunny, cloudy, and overcast. The validation results were evaluated using the normalized root mean square error and mean absolute percentage error for the temperature and output power of the photovoltaic/thermal collector and the temperature of the thermal energy storage tank. The model results concurred with the measurements, as the average mean absolute percentage error values for the temperature and output power of the photovoltaic/thermal collector and thermal energy storage tank temperature were 5.82%, 1.51%, and 7.58% respectively.

1. Introduction

Photovoltaic/thermal (PV/T) solar systems have appeared on the market in the last 15 years to improve the performance, lifespan, and energy yield of commercial PV systems. Unlike commercial PV modules, PV/T collectors have a heat exchanger or cooling fins mounted on the rear of the PV module. The primary task of the heat exchanger is to reduce the temperature of the PV module, thus increasing the electrical efficiency of the PV module and consequently also the yield of electricity production [1]. The excess heat taken from the PV module can be used for low-temperature heating applications. Pool heating is one of the many heating applications of a waste heat PV/T collector. Vanoli et al. [2] present a thermo-economic analysis of a PV/T system for an indoor-outdoor swimming pool. Given that PV/T modules produce more energy per unit area than PV and solar collectors separately, these systems are particularly suitable for applications where the available surface area is limited. PV/T systems are not only suitable for installation on roofs of buildings or meadow/degraded surfaces but are also increasingly used as facade panels. Medved et al. [3] present a multi-purpose facade structure designed as a semi-transparent modular building-integrated PV/T facade panel. The integration of facade panels decreases the energy required from 55% to 40%, depending on the heating season climate conditions and contributes to fulfilling sustainable building requirements. PV/T systems are the subject of research and analysis in most countries and are still not integrated to the same extent as commercial PV systems. However, it is noticeable that there is growing demand in western Europe, while eastern Europe needs more awareness and demonstration projects [4]. Excess heat from PV/T collectors can be used in several ways, one of which is the storage of excess heat in a thermal energy storage tank (TEST). TESTs are basically divided into open, closed, and hybrid systems. Open systems, unlike closed systems, include an internal heat exchanger that separates the working medium (glycol) from domestic hot water (DHW), while hybrid systems are composed of a combination of both.
Meteorological conditions change rapidly during the day. Therefore, the description of the operation of the PV/T system is inherently dynamic [5]. A steady-state model describing the temperature of a PV/T module or the temperature of the working medium is not suitable for forecasting in cases of sudden changes in the atmosphere or rapid changes in the flow of the working medium. Therefore, for an accurate assessment of the temperature distribution in a PV/T system, various studies have been described in the literature review, which is divided into static and dynamic models based on the mathematical principle.

1.1. Literature Review of Existing Studies

Based on a large number of dynamic and static mathematical models of PV/T collectors and thermal energy storage tanks, a comprehensive review of the existing research studies was carried out in this part of the study. The literature review mainly covers mathematical descriptions of dynamic and static models of the PV/T system (PV/T collector and TEST), published in various international journals. To date, quite a few static [6,7,8,9,10,11,12,13,14,15,16] and dynamic [17,18,19,20,21,22,23,24,25,26,27] models of PV/T modules and TESTs have been found. Below, the authors of this study have described models that represent added value and key findings for further research work. Simonetti et al. [28] present the development and evaluation of a comprehensive dynamic mathematical model of an eleven-layer PV/T collector. The added value of this research is the precise determination of heat transfer between the heat exchanger and the working medium. The proposed model is presented in a two-dimensional space where the temperature distribution in each layer is uniform. A similar study using dynamic modeling and temperature distribution in two-dimensional space was performed by Yu et al. [29] and Guarracino et al. [30]. Guarracino et al. [31] accurately assess electrical and thermal energy generation for PV/T collectors using steady-state and dynamic models. Additionally, Pierrick et al. [32] present a high accuracy model validated under a steady-state and dynamic regime. Consideration of the temperature levels of each cell and the mismatch effect are unique features of this model. Das et al. [33] present a dynamic seven-layer model of a PV/T collector that considers thermal contact resistance and ohmic losses in the PV cell layer. Silva et al. [34] introduce thermodynamic modeling of a PV/T system using a modular strategy approach devised by Matlab/Simulink. This study is based on a similar modeling strategy. Ji et al. [35] present a dynamic model of a PV evaporator in a PV/T solar-assisted heat pump. Refrigerant conditions, such as pressure, temperature, and vapor quality, are spatially distributed as two-dimensional results. Ciabattoni et al. [19] present a dynamic model of a PV/T collector, which has been linearized and discretized. The discrete linear model was first validated using a continuous non-linear model and then using the novel PV/T collector measurements. Fan et al. [36] present the development of a dynamic PV/T model with a solar air heater. Unlike classic sheet-and-tube PV/T collectors, the proposed model describes longitudinal fins and includes a method for discretizing the system into several control volumes. Hussain et al. [37] present a dynamic model of a trapezoidal-shaped sheet-and-tube heat exchanger of a PV/T collector. The transient response of a nanoengineered PV/T collector is developed using Matlab software. Sakellariou et al. [38] propose a dynamic first-order PV/T model with optical losses calculated analytically according to the principles of optics. The results of the model concur with the measurements, as the PV/T outlet temperature was estimated at 0.66% for stable weather conditions and 4.22% for extreme weather conditions. Finally, Al-Waeli et al. [39] represent dynamic modeling of a PV/T system using nanofluids and a nano-PCM working medium. The dynamic model concurs with the measurements on the real experimental system, as the electrical and thermal efficiencies differ by only 0.5% and 0.7%, respectively.
Given that static or steady-state models are not the main topic of this study, it only covers the main research achievements to date. Maadi et al. [40] present a coupled thermo-optical numerical model created in ANSYS Fluent software. The numerical model considers the optical properties of PV/T collector layers and different scenarios according to the number and diameter of sheet-and-tube heat exchangers. Angola et al. [41] study numerical modeling of the spatial distribution of the temperature of each PV cell using ANSYS Fluent software. Ghani et al. [42] conducted a similar three-step numerical analysis of model flow distribution, temperature variation, and PV yield for a PV/T collector. Jonas et al. [43] present a thermal performance model using TRNSYS, which is proposed as a standardized performance model for PV/T collectors.
In addition to the significant achievements of the description of dynamic models, there are many other interesting static/dynamic models, including various optimization methods and techno-economic analyses. Buononano et al. [44] represent a numerical analysis to assess the technical and economic indicators of PV/T collectors. Evola et al. [45] present a thermo-economic optimization of a PV/T module, whereby the change in the flow of the working medium consequently changes the electrical efficiency. Behzadi et al. [46] describe a dynamic model of a new PV/T-based smart building energy system, which is comprehensively analyzed from a thermodynamic and economic point of view using TRNSYS software. The added value of this research is the optimization of the design and size of the building. Dai et al. [47] present a multi-objective optimization of a PV/T system for domestic hot water applications, using TRNSYS and NSGA-II software with the aim of studying and optimizing the prime energy-saving efficiency and lifecycle savings of a PV/T DHW system for an entire year. Markides et al. [48] made another interesting optimization, which included two target functions. The first objective was to minimize the payback time and associated production costs per kWh of energy for residential buildings, while the second was to minimize the interactions of PV/T systems with the grid (exported compared to imported ones) and to limit the amount of excess heat emitted into the environment to avoid overheating the TEST. In addition to optimizations, the literature review also covered the forecast of electrical and thermal energy from PV/T systems via artificial neural networks (ANN). Chaichan et al. [49] present ANN modeling based on a multi-layer perceptron system. The proposed ANN approach increases the electrical efficiency by 5.25%, using a nanofluid/nano-PCM working medium. Similarly, Ammar et al. [50] propose an ANN algorithm that maximizes the electrical and thermal power generation from a PV/T system using the mass flow rate of the working medium as an optimization parameter.
Throughout the literature review, the authors of this study found that there are quite a few very accurate dynamic PV/T collector models that do not include a TEST when modeling the entire PV/T system. The following studies [23,34,46,51] of PV/T system modeling include a TEST description, albeit in a simplified static/dynamic form. To this end, the background of TEST research and an overview of dynamic modeling through various literature are also included in this study. Nash et al. [52] represent dynamic modeling of a TEST with an internally mounted spiral heat exchanger, with the minimization of the number of dynamic states required to describe the system being crucial. The presented model is also useful for controlling the system, as in certain parts, the computational complexity can be limited and the simulation takes place 1200× faster than in real-time. Maveety et al. [53] introduce the calculation of a two-dimensional cylindrical shaped TEST model using a second-order partial approximation and a NaK working medium. Nelson et al. [54] tested the influence of insulation thickness on the outside of a TEST in their paper. They found that wall insulation did not improve TEST thermal stratification but did increase thermal degradation due to the axial conductivity of the walls. This effect can be reduced by increasing the length of the TEST and reducing the wall thickness of the TEST using materials with low thermal conductivity. The TEST response can generally be calculated using multi-dimensional partial differential equations describing energy, momentum, mass ratios, geometry, and heat transfer. Several authors [53,55,56,57,58,59,60] have used this approach in their contributions to calculate two- or three-dimensional numerical models of a TEST. These models are, as previously mentioned, particularly suitable for analyzing specific problems; however, they are very expensive in terms of calculation speed. Therefore, they are not useful in calculating larger energy systems containing at least two or more TESTs. For this purpose, simplified models based on ordinary differential equations are used while maintaining precision.

1.2. Aims and Specifics of the Current Research

A unique feature of this paper is the development of a dynamic model of a PV/T collector in combination with a TEST. In this part, the temperature distribution of the PV/T collector and TEST is described based on dynamic modeling in a one-dimensional space, while the output power of the PV/T collector is described using an implicit method. The dynamic model of the PV/T collector is summarized and made based on numerous research studies [19,29,30,31,32,33,34] to calculate the temperature distribution. In contrast, a double-diode model of a PV cell is used to calculate the output power, which also considers the description of the electrical parameters depending on the solar radiation G and the temperature of the PV/T collector T. The dynamic TEST model is taken from [60] and adapted to the geometry of the TEST installed at the Institute of Energy Technology, Faculty of Energy Technology, University of Maribor. Dynamic models of individual components of PV/T systems have been presented several times in various studies; however, no research was found during the course of the literature review that accurately described the modelling of an entire PV/T system. The proposed dynamic model of the PV/T collector in combination with a TEST was made using the Matlab/Simulink software package, where the differential equations are described using a block called ‘s-function’. To this end, the aim of this research was to describe an entire PV/T system and carry out validation of an existing PV/T system.

2. Materials and Methods

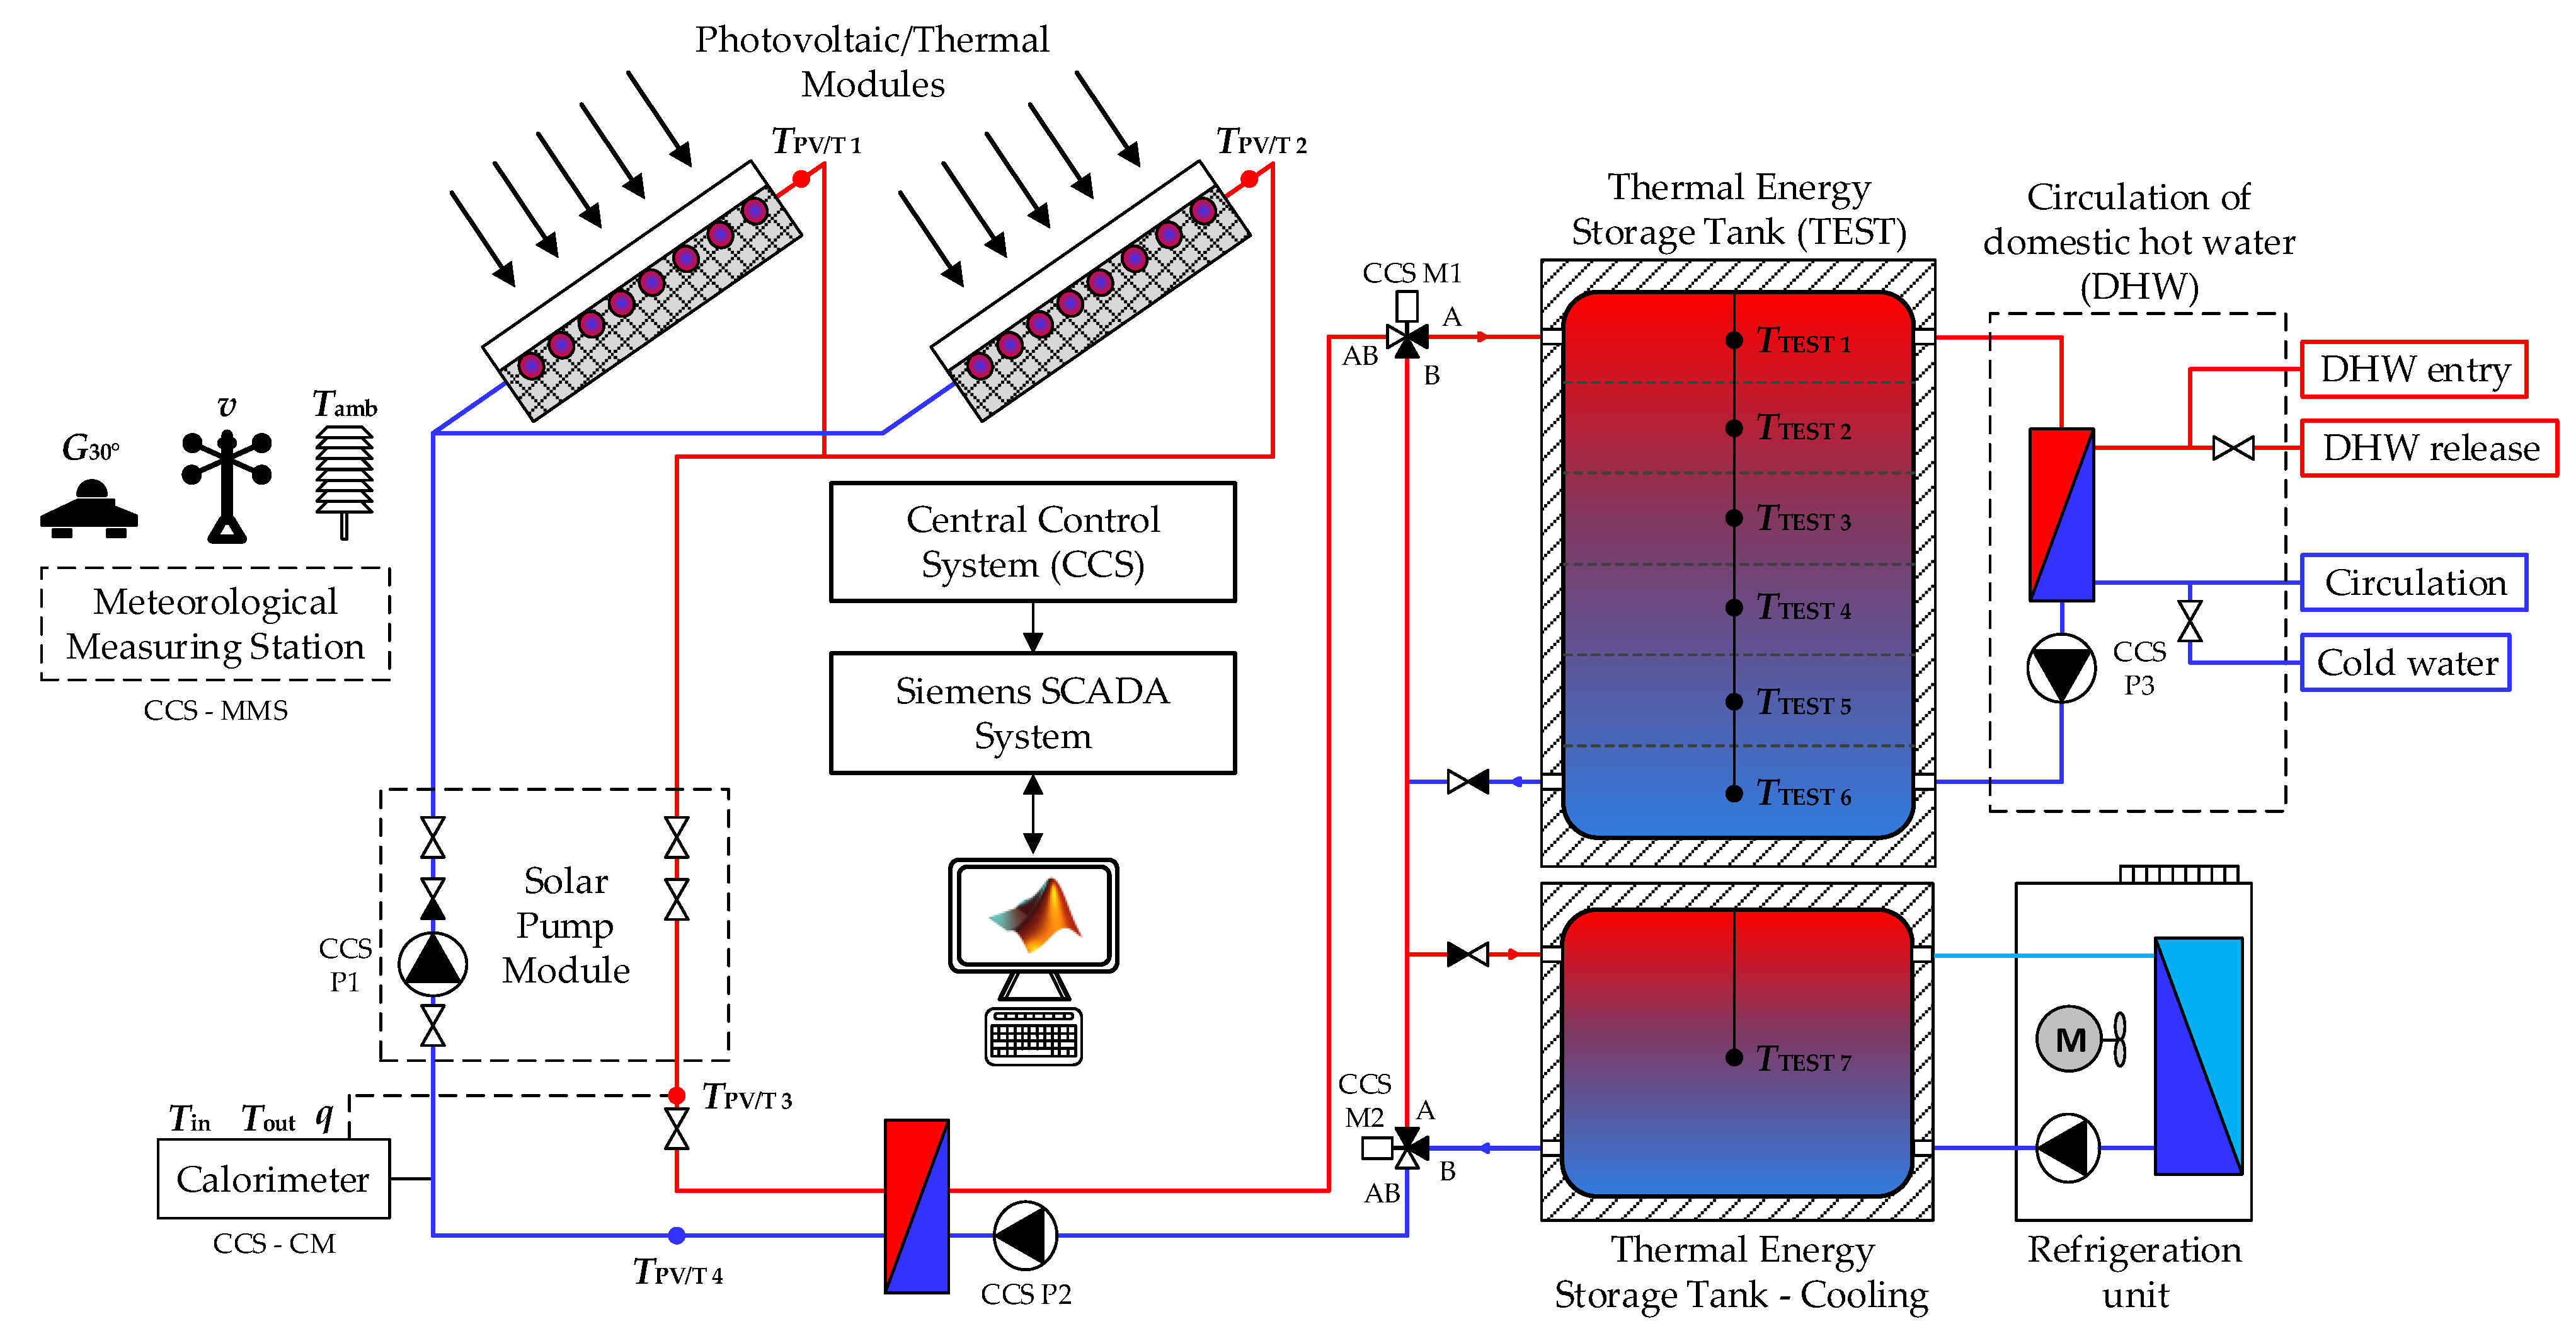
2.1. Experimental Set-Up

The experimental set-up represents the photovoltaic/thermal system located at the Institute of Energy Technology, Faculty of Energy Technology, University of Maribor, Slovenia. The PV/T system mainly consists of ten PV/T modules (total installed power of 3300 W), a thermal energy storage tank (TEST), two heat exchangers, and a refrigeration unit. In addition, it includes circulating pumps, expansion vessels, three-way control valves with motor drive, temperature sensors, and a meteorological station, which is controlled via a central control system (CCS). Monitoring of measurements is displayed through a SCADA graphical user interface and includes measurement of the working medium temperature in the primary (PV/T modules) and secondary (TEST) circuit, working medium flow, solar radiation on an inclined surface, ambient temperature, wind speed, and wind direction. The entire cooling manifold is filled with a mixture (water-glycol 35%), which enables the system to operate even in winter (freezing point temperature is −25 °C). The waste thermal energy of the PV/T modules is stored in the TEST with a capacity of 500 L via the primary heat exchanger, which enables the layering of thermal energy according to the temperature gradient. Inside the TEST, six temperature sensors (PT100) are installed at certain heights, which allow the temperature level to be monitored. In the event of a heat sink, the working medium can be cooled with an additional air-cooled refrigeration unit (air-water). The secondary heat exchanger (glycol-water) is installed on the secondary side of the TEST, which heats domestic hot water (DHW) up to 45 °C. The PV/T modules are at the same angle, equipped with a pyranometer for measuring solar radiation, temperature sensors at the inlet and outlet of the working medium in the PV/T modules, and a calorimeter. The calorimeter determines the thermal energy produced based on the flow of the working medium and temperature difference at the inlet and outlet. The functional scheme of the PV/T system with additional graphical material is shown in Figure 1 and Figure 2.
The control system of the PV/T system is divided into 3 different operational regimes:
Daily mode control:
  • TPV/T 1 or TPV/T 2 > TTEST 1 = M1-A & M2-A + P1 & P2 (ON)
  • TPV/T 4 ≥ 75 °C = M1-B & M2-A+B
  • TPV/T 4 ≥ 90 °C = P1 (OFF)
Control during heat consumption:
  • TPV/T 1 or TPV/T 2 ≥ 80 °C = refrigeration unit (ON)
  • TTEST 1 ≥ 75 °C = refrigeration unit (ON)
  • or TTEST 1 ≥ 75 °C = DHW release (ON)
Night mode control (between 10 p.m. and 5 a.m.):
  • TPV/T 1 or TPV/T 2 < TTEST 1 = M1-A & M2-A + P1 & P2 (ON)

2.2. Model Setup

The model setup represents the description of a dynamic model of the PV/T system. The model of the PV/T system was created in the Matlab/Simulink software package using a block called ‘s-function’. The measurement data of the PV/T system with a sampling time of 300 s were entered directly into the Simulink model via the interface and are shown in the left part of Figure 3. The central part of Figure 3 presents a complete dynamic model of a PV/T system, described using the ‘s-function’ block. An s-function block is computer language used for describing dynamic systems. A numerical method called TR-BDF2 (Trapezoidal Rule with second order Backward Difference Formula) with a simulation sampling time of Ts = 0.0001 s was chosen to solve the differential equations of the PV/T collector and TEST.

2.3. Dynamic Model of the Photovoltaic/Thermal Collector

The dynamic model of the PV/T collector is divided into electrical and thermal models. The dynamic electrical model represents the calculation of the output power of the PV/T collector and the following electrical parameters. Furthermore, the dynamic thermal model describes the temperature distribution in the PV/T collector or the temperature of the working medium connecting the TEST.

2.3.1. Electric Model of the Photovoltaic/Thermal Collector

In this paper, the output power of the PV/T collector is calculated using an equivalent circuit of a double-diode model. Many research papers presented in the literature review [17,28,29,41] mainly use simple explicit equations or single-diode models to calculate output power. Furthermore, during the course of the literature review, the authors of this study did not come across any research papers that consider the dependences of solar radiation and the temperature of PV/T collectors. To this end, the goal of this study was to calculate the output power with the highest possible accuracy and consider other electrical parameters in different dependencies. The governing equation of equivalent circuit of a double-diode model is formulated using Kirchoff’s current law for current I by (1):
I = I ph I 01 ( exp ( U + I R s ( n 1 K T q ) N s ) 1 ) I 02 ( exp ( U + I R s ( n 2 K T q ) N s ) 1 ) ( U + I R s R sh )
The photo-generated current is described by (2).
I ph = ( I SC + μ I SC ( T T STC ) ) G G STC
The diode saturation current for the first and second diode is shown in (3) and (4).
I 01 = ( I SC ( exp U OC q T K N S n 1 1 ) ) ( T T STC ) 3 exp ( q E g 0 ( 1 T STC 1 T ) n 1 K )
I 02 = ( I SC ( exp U OC q T K N S n 2 1 ) ) ( T T STC ) 3 exp ( q E g 0 ( 1 T STC 1 T ) n 2 K )
As mentioned above, four electrical parameters, namely short-circuit current ISC, open-circuit voltage UOC, series Rs, and parallel resistance Rsh [61], were described as a function of solar radiation G and temperature of the PV/T collector T, thus providing more accurate output power of the PV/T collector. The following electric parameters are described by (5)–(8).
I SC ( G , T ) = ( G G STC ) ln ( I SC , STC I SC ) ln ( G STC G ) ( I SC , STC + α PV ( T T STC ) )
U OC ( G , T ) = U OC , STC + N S K T n q ln ( G ) + β PV ( T T STC )
R s ( G , T ) = G STC ( V OC , STC V MPP , STC ) 4 ( G ( I MPP , STC + α PV ( T T STC ) ) )
R sh ( G , T ) = 2 G STC ( U MPP , STC β PV ( T T STC ) ) ( G ( I SC , STC I MPP , STC ) )
Table 1 presents the electrical parameters of the considered mono-crystalline PV/T collector under STC conditions, manufactured by SOLIMPEKS [62].

2.3.2. Thermal Model of the Photovoltaic/Thermal Collector

The PV/T collector is basically composed similar to a commercial PV module, with the exception that the PV/T collector includes additional layers such as an adhesive, copper absorber, heat exchanger, working medium (glycol and water mixture), Styrofoam/glass wool, and protective layer. Figure 4 shows a cross-section of the PV/T collector. A mathematical notation of the temperature distribution of each layer separately is illustrated below.
The glass layer covers both the input and output heat flow. The input heat flow includes absorbed solar radiation and reflection between the glass and the PV cell layer, while the output heat flow includes conductive heat transfer with the first layer of EVA foil, convective heat transfer with air, and radiation heat transfer with the sky and ground. The temperature distribution of the glass layer is described by (9):
ρ g d g C g d T g d t = α o , g ( 1 + τ o , g α o , pv ρ o , g ρ o , pv ) G T g T e 1 1 2 [ ( d g k g ) + ( d e 1 k e 1 ) ] h g air ( T g T a ) ε g σ F g , sky ( T g 4 T sky 4 ) ε g σ F g , ground ( T g 4 T a 4 ) σ ( T g 4 T pv 4 ) 1 ε g 1 ε pv 1
The convective heat transfer coefficient between the glass layer and the air can be determined for natural (Gr/Re2 < 1), forced (Gr/Re2 > 1), or mixed convection (Gr/Re2 ≈ 1). In the case of the simplified model [45], the convective heat transfer coefficient can be determined by (10):
h g air = 5.7 + 3.8 v
In the radiation heat transfer part (9), the ground temperature is assumed to be equal to the ambient temperature, while the temperature of the sky is calculated using different meteorological models. The models cover the ratio of the diffuse and global components of solar radiation to estimate the scattering of solar radiation and temperature. Due to a lack of measurements of diffuse solar radiation, this paper considers the assumption that the ambient temperature is equal to the temperature of the sky until the solar radiation falls below 100 W/m2. Based on this assumption, the sky temperature can be determined by (11):
T sky = { 0.0552 T a 1.5 if G 100 W / m 2 T a if G 100 W / m 2
The view factors for glass-to-sky and glass-to-ground are described in (12) and (13):
F g , sky = 1 + cos ( β ) 2
F g , ground = 1 cos ( β ) 2
Assuming that the first layer of EVA foil is an intermediate layer between the glass and the PV cell layers, the input and output heat flows are defined as the conductive heat transfer with the glass and the PV cell layers. The temperature distribution of the first layer of EVA foil is determined by (14):
ρ e 1 d e 1 C e 1 d T e 1 d t = T g T e 1 1 2 [ ( d g k g ) + ( d e 1 k e 1 ) ] T e 1 T pv 1 2 [ ( d e 1 k e 1 ) + ( d pv k pv ) ]
As is the case for the glass, the PV cell layer also comprises both input and output heat flow. The input heat flow includes absorbed solar radiation, reflections between the glass and PV cell layers, conductive heat transfer through the first layer of EVA foil, and radiation heat transfer through the glass layer. The output heat flow includes conductive heat transfer through the second layer of EVA foil and the electricity produced by the PV cell. The calculation of the electricity produced by the PV/T collector is shown in sub-Section 2.3.1. The temperature distribution of the PV cell layer is determined by (15):
ρ pv d pv C pv d T pv d t = T e 1 T pv 1 2 [ ( d e 1 k e 1 ) + ( d pv k pv ) ] T pv T e 2 1 2 [ ( d pv k pv ) + ( d e 2 k e 2 ) ] + ( τ o , g α o , pv 1 ρ o , g ρ o , pv ) G + σ ( T g 4 T pv 4 ) 1 ε g 1 ε pv 1 P
Assuming that the second layer of EVA foil is an intermediate layer between the PVF foil layer (tedlar) and the PV cell layer, the input and output heat flows are defined as conductive heat transfer with the PVF foil layer and the PV cell layer. The temperature distribution of the second layer of EVA foil is determined by (16):
ρ e 2 d e 2 C e 2 d T e 2 d t = T pv T e 2 1 2 [ ( d pv k pv ) + ( d e 2 k e 2 ) ] T e 2 T pvf 1 2 [ ( d e 2 k e 2 ) + ( d pvf k pvf ) ]
Similarly, the inlet and outlet heat flows for a layer of PVF foil are defined as conductive heat transfer with a second layer of EVA foil and adhesive layer. The temperature distribution of the PVF foil layer is determined by (17):
ρ pvf d pvf C pvf d T pvf d t = T e 2 T pvf 1 2 [ ( d e 2 k e 2 ) + ( d pvf k pvf ) ] T pvf T ad 1 2 [ ( d pvf k pvf ) + ( d ad k ad ) ]
The input and output heat flows for the adhesive layer are defined as the conductive heat transfer with the PVF foil layer and the copper absorber layer. The temperature distribution of the adhesive layer is determined by (18):
ρ ad d ad C ad d T ad d t = T pvf T ad 1 2 [ ( d pvf k pvf ) + ( d ad k ad ) ] T ad T ca 1 2 [ ( d ad k ad ) + ( d ca k ca ) ]
The input and output heat flows for the copper absorber layer are defined as the conductive heat transfer with the adhesive layer and the heat exchanger layer. The temperature distribution of the copper absorber layer is determined by (19).
ρ ca d ca C ca d T ca d t = T ad T ca 1 2 [ ( d ad k ad ) + ( d ca k ca ) ] T ca T he 1 2 [ ( d ca k ca ) + ( ln ( D he , OUT D he , IN ) 2 π k he ) ]
A heat exchanger layer in which the input heat flow is defined as conductive heat transfer through the copper absorber layer, while the output heat flow is divided into conductive heat transfer through a Styrofoam layer and convective heat transfer to the working medium in the heat exchanger. The temperature distribution of the heat exchanger layer is determined by (20):
ρ he C he D he , OUT 2 D he , IN 2 2 D he , OUT d T he d t = T ca T he 1 2 [ ( d ca k ca ) + ( ln ( D he , OUT D he , IN ) 2 π k he ) ] T ins T he 1 2 [ ( d ins k ins ) + ( ln ( D he , OUT D he , IN ) 2 π k he ) ] π D he , IN h f ( T f T he )
The inlet heat flow of the working medium consists of the advective heat flux of the inlet working medium and the convective heat transfer between the heat exchanger and the working medium. The output heat flow of the working medium is expressed as the output advective heat flux of the working medium. The temperature distribution of the working medium is determined by (21):
ρ f C f d T f d t = π D he , IN h f ( T f T he ) m ˙ f C f ( T f , OUT T f , IN )
The convective heat transfer coefficient of the working medium hf depends primarily on the flow regime (laminar or turbulent). In the case of natural or forced circulation of the working medium, the calculation of hf is determined by (22) and (23). In night mode or when the circulating pump is not running, the convective heat transfer of the working medium to the heat exchanger is converted into conductive heat transfer and hf is calculated by (23).
h f = 4.36 k f D H       for R e < 2300 ;
h f = k f D H 0 . 23 Re 0 . 8 Pr 0 . 4       for R e > 2300 ;
h f = 2 k f D H
As stated, the temperature of the PV/T collector is uniform in each layer. This assumption is highly accurate for thin layers or layers with high thermal conductivity; however, it may lead to less accurate results for thick layers or layers with low thermal conductivity. To solve this problem, some research suggests dividing the insulation layer into a larger number of sublayers [28]. The temperature distribution of the Styrofoam layer is determined by (25):
ρ ins d ins C ins d T ins d t = T ins T he 1 2 [ ( d ins k ins ) + ( ln ( D he , OUT D he , IN ) 2 π k he ) ] T ins T pl 1 2 [ ( d ins k ins ) + ( d pl k pl ) ]
In the last layer of the PV/T collector or protective layer, the input heat flow is defined as the conductive heat transfer through the Styrofoam layer, while the output heat flow is defined as the convective heat transfer to the surroundings and radiation heat transfer between the ground and sky. The temperature of the protective layer is determined by (26):
ρ pl d pl C pl d T pl d t = T ins T pl 1 2 [ ( d ins k ins ) + ( d pl k pl ) ] h pl air ( T pl T a ) ε pl σ F pl , sky ( T pl 4 T sky 4 ) + ε pl σ F pl , ground ( T pl 4 T a 4 )
The convective heat transfer coefficient between the protective layer and air hpl-air is calculated similarly to the convective heat transfer coefficient between the glass layer and air hg-air with (10). The view factors between the protective layer and the sky Fpl,sky and the protective layer and the earth Fpl,ground are determined by (27) and (28):
F pl , sky = 1 cos ( β ) 2
F pl , ground = 1 + cos ( β ) 2
The thermal, mechanical, and optical parameters of the considered mono-crystalline PV/T collector are shown in Table 2 (based on the literature [28,30,31,36]).

2.4. Dynamic Model of the Thermal Energy Storage Tank

The dynamic TEST model presented in this section is described based on an open TEST system (shown in Figure 5a). An open TEST system is defined as a combination of convection and conduction in a working medium. To accurately determine the temperature distribution at a given height, the TEST was divided into the i-th number of layers. Figure 5b shows the cross-section of the i-th layer of the TEST and the determination of the input and output heat flows.
Based on the presented cross-section of the i-th layer of the TEST and its input and output heat flows in Figure 5b, the temperature distribution in each i-th layer is defined by (29):
M c p d T i d t = m ˙ in c p ( T in ) + m ˙ out c p ( T i ) m ˙ dowm c p ( T i - 1 ) m ˙ up c p ( T i ) + m ˙ down c p ( T i ) m ˙ up c p ( T i + 1 ) + k + Δ k d x i + 1 A c , i ( T i + 1 T i ) + + k + Δ k d x i + 1 A c , i ( T i 1 T i ) + ( U + Δ U ) A s , i ( T a T i )
Newton [63] developed a method used to calculate thermal conduction through the TEST walls by calculating the total thermal conduction qtotal as the sum of the thermal conduction of the working medium qf and the thermal conduction of the TEST wall qwall for the dynamic TEST model given by (30). This assumes that the TEST wall and the working medium are at the same temperature at the location of each layer.
q total = q wall + q f = k wall A c , wall d x ( T i + T i + 1 ) + k A c d x ( T i + T i + 1 )
The total thermal conduction can be written in abbreviated form with (31), equal to the sum of the heat transfer of the working medium.
q total = ( k + Δ k ) A c d x ( T i + T i + 1 )

3. Results and Discussion

The validation of the dynamic model of the PV/T collector in combination with a TEST was performed based on measurements of electrical and thermal quantities and meteorological data for 83 days in 2021 (from August to October). Figure 6 and Figure 7 show measurements of the thermal quantities of the PV/T system, which were used in the paper as input data or data for validation of the proposed dynamic model.
In the dynamic model of the PV/T collector, the input of the thermal properties of the working medium (mixture of glycol and water) appears in (21–24). The thermal properties of solid materials do not change significantly depending on low temperatures. In contrast to the working medium, which occurs in the liquid state, the thermal properties (such as density, specific heat, thermal conductivity, kinematic viscosity, and Prandtl number) were described as a function of temperature for further calculation of Reynolds number, which is shown in Figure 8.
Figure 9, Figure 10 and Figure 11 show the validation of the dynamic model of the PV/T collector and TEST with measurements and deviations between them for 83 days. The dynamic model of the PV/T collector is divided into a dynamic electric (calculation of output power) and dynamic thermal model (calculation of temperature distribution of the PV/T collector).
As shown from Figure 9, Figure 10 and Figure 11, the model concurs with the measurements. On average, the deviation values for the temperature and output power of the PV/T collector and TEST temperature are 1.2 °C, 0.89 W, and 0.71 °C, respectively. In addition to the above, more significant deviations (more detailed on days 58, 59, 62, 63, 78, and 82) caused by technical problems with the calorimeter can also be seen in Figure 7 and Figure 9. Mentioned days were removed in the further calculation of the deviation. For a more accurate assessment, validation of the dynamic models was performed based on three different meteorological conditions: sunny (22 days), cloudy (36 days), and overcast (25 days) weather. Figure 12 shows the validation of the results of the dynamic model of the PV/T collector and TEST with measurements for a randomly selected day.
In order to evaluate the accuracy of the proposed dynamic model of the PV/T system, two methods were chosen to calculate the deviation between the dynamic model and measurements: normalized root mean square error (nRMSE) and mean absolute percentage error (MAPE).
n R M S E = 1 n i = 0 n ( y i , m e a s y i , m o d e l ) 2 y i , m e a s max y i , m e a s min
M A P E = 1 n i = 0 n | y i , m e a s y i , m o d e l y i , m e a s 100 |
Figure 13 shows the validation of the dynamic model of the PV/T collector and TEST with measurements using the nRMSE and MAPE methods (TPV/T, P, TTEST) based on three different weather conditions: sunny, cloudy, and overcast.
As can be seen from Figure 13, there are minor deviations in the case of sunny weather when calculating the temperature distribution of the PV/T collector and the TEST, since a smaller proportion of diffuse solar radiation is present at that time. In addition to the above, to calculate the output power in the case of sunny weather, it is necessary to consider the precisely defined optical properties of the glass layer and the PV cell layer due to the higher proportion of reflected solar radiation. While the optical properties in the case of cloudy and overcast weather do not have a significant effect, it is necessary to pay attention to the accuracy of the measurements of ambient temperature and wind speed (more significant influence of natural and forced convection from the environment). On average, there is a more significant deviation, especially during cloudy and overcast weather, where the diffuse component of solar radiation is present and represents a more complex calculation and unpredictable changes in the atmosphere. The output power deviation in the case of MAPE ranges between 1.30% and 1.72%, which reflects the outstanding accuracy of the dynamic model of the PV/T collector. It should be noted that the calculation of the output power of the PV/T collector is more complex than that of the output power of a commercial PV module, as it is necessary to take into account the dynamics of temperature changes of the working medium inside the heat exchanger. Given that all three dynamic models are connected and consequently dependent on each other, it is possible to trace a pattern of repetitions of deviations in the case of sunny, cloudy, and overcast weather.

4. Conclusions

This paper presents a novel dynamic model of a PV/T collector in combination with a TEST, which consists of three interconnected parts via temperature and output power. The dynamic model of the PV/T collector is described by the heat balance equation for eleven layers (glass, EVA foil, PV cell, EVA foil, PVF foil, adhesive, absorption plate, heat exchanger, working medium, Styrofoam, and protective layer), while the dynamic model of the TEST is described by the heat balance of six uniform transverse layers. Based on a literature review, it was found that there are quite a few dynamic models which describe the temperature distribution of PV/T collectors and TESTs; however, none of them include a detailed description and simultaneous connectivity of these two components. In most cases, the dynamic models are presented as temperature distribution in the transverse or longitudinal direction (one-dimensional temperature distribution) where the temperature of each layer is uniform. However, some dynamic models present the temperature distribution using the heat partial differential equation, in which the uniform temperature distribution over the layers is also described in two-dimensional space. In addition, most studies use an equivalent circuit of a single-diode model to calculate the output power of a PV/T system, with specific electrical parameters selected as constants. In contrast, this paper discusses the description of the output power with an equivalent circuit of a double-diode model and a more detailed description depending on the solar radiation and temperature of the PV/T collector.
This aim of this paper was to present a novel dynamic model of a PV/T collector in combination with a TEST based on known equations. Validation of the proposed model was performed based on measurements of electrical and thermal quantities and meteorological data of the presented experimental PV/T system. The validation was performed under the most common meteorological conditions: sunny, cloudy, and overcast weather. The validation for three different meteorological conditions was performed mainly due to the dynamic changes in the atmosphere. From this point of view, it was determined that minor deviations occur in the case of sunny weather when direct solar radiation has the most significant impact. In sunny weather conditions, additional attention must be paid to the coefficients of optical losses, which change with the inclination angle of the PV/T collectors. A slightly larger deviation occurs in the case of cloudy/overcast weather due to the presence of diffuse solar radiation. The lowest deviations between the models can be found in the dynamic electric model of the PV/T collector (output power), in which the MAPE values range between 1.3% to 1.72%.
In contrast, the temperature deviations (PV/T collector and TEST) are slightly higher and reach average MAPE values of 5.82% and 7.58%, respectively. Higher values of the temperature deviation can mainly be attributed to the dynamics of the working medium and by disregarding diffuse solar radiation. The presented model of a PV/T system will further include the modeling of a battery system and flow optimization of the working medium based on consumer demand.

Author Contributions

Conceptualization, K.S. and S.S.; methodology, K.S.; software, K.S.; validation, K.S.; formal analysis, K.S.; investigation, K.S.; resources, S.S., M.H., A.C. and B.Š.; data curation, K.S.; writing—original draft preparation, K.S.; writing—review and editing, S.S. and Z.P.; visualization, K.S.; supervision, S.S., M.H., B.Š., A.C. and Z.P.; project administration, S.S., M.H., A.C. and B.Š.; funding acquisition, Z.P. All authors have read and agreed to the published version of the manuscript.

Funding

This research received no external funding.

Institutional Review Board Statement

Not applicable.

Informed Con sent Statement:

Not applicable.

Acknowledgments

The authors acknowledge the use of research equipment Thermoelectric solar system and energy storage system RIUM, procured within the operation “Upgrading national research infrastructures—RIUM”, which was co-financed by the Republic of Slovenia and the European Union from the European Regional Development Fund within the Operational Program for European Cohesion Policy period 2014–2020.

Conflicts of Interest

The authors declare no conflict of interest. The funders had no role in the design of the study; in the collection, analyses or interpretation of data; in the writing of the manuscript or in the decision to publish the results.

Nomenclature

ANNartificial neural network
CCScentral control system
DHWdomestic hot water
EVAethylene-vinyl acetate
MAPEmean absolute percentage error
MPPmaximum power point
MPPTmaximum power point tracking
NOCTnominal operating cell temperature
nRMSEnormalized root mean square error
PCMphase change material
PVphotovoltaic
PV/Tphotovoltaic/thermal
PVFpolyvinyl fluoride
STCstandard test condition
TESTthermal energy storage tank
TR-BDF2trapezoidal rule with second order backward difference formula
Quantities used in equations:
Ac,icross-sectional area of the i-th layer of the TEST (m2)
As,iinner surface of the i-th layer of the TEST (m2)
Cspecific heat (J/kgK)
dthickness (m)
Dheat exchanger pipe diameter (m)
Eg0bandwidth of cell material (eV)
Fview factor
Gsolar radiation (W/m2)
GSTCsolar radiation at STC (W/m2)
hconductive heat transfer coefficient (W/m2K)
I01reverse saturation current of the first diode (A)
I02reverse saturation current of the second diode (A)
IMPP,STCcurrent at maximum power point under STC conditions (A)
Iphphoto-generated current (A)
ISCshort-circuit current (A)
ISC,STCshort-circuit current under STC conditions (A)
KBoltzmann constant (1.38065 × 10²³ J/K)
kthermal conductivity (W/mK)
nnumber of observations
n1the diode ideality factor of the first diode
n2the diode ideality factor of the second diode
NSnumber of series-connected PV cells
mmass flow (kg/s)
Mmass of the working medium inside TEST (kg)
Poutput power (W)
qelectron charge (1.602 × 10¹⁹ C)
qfthermal conduction of the working medium (W/mK)
qtotaltotal thermal conduction (W/mK)
qwallthermal conduction of the TEST wall (W/mK)
PrPrandtl number
Rsseries resistance (Ω)
Rshshunt resistance (Ω)
Ttemperature (°C)
Taambient temperature (°C)
TPV/Ttemperature of the PV/T module (°C)
TTESTtemperature of the TEST (°C)
vwind speed (m/s)
VMPP,STCvoltage at maximum power point under STC conditions (V)
VOCopen-circuit voltage (V)
VOC,STCopen-circuit voltage under STC conditions (V)
VT1thermal voltage of the first diode (V)
VT2thermal voltage of the second diode (V)
ymeasmeasured values
ymodelmodeled values
αoabsorptivity
αPVtemperature coefficient of ISC (%/°C)
βPVtemperature coefficient of VOC (%/°C)
γPVtemperature coefficient of PMPP (%/°C)
εemissivity
ρdensity (kg/m3)
ρoreflectivity
τotransmissivity
νkinematic viscosity (mm2/s)

References

  1. Libra, M.; Petrík, T.; Poulek, V.; Tyukhov, I.I.; Kouřím, P. Changes in the Efficiency of Photovoltaic Energy Conversion in Temperature Range with Extreme Limits. IEEE J. Photovolt. 2021, 11, 1479–1484. [Google Scholar] [CrossRef]
  2. Buonomano, A.; de Luca, G.; Figaj, R.D.; Vanoli, L. Dynamic simulation and thermo-economic analysis of a PhotoVoltaic/Thermal collector heating system for an indoor-outdoor swimming pool. Energy Convers. Manag. 2015, 99, 176–192. [Google Scholar] [CrossRef]
  3. Arkar, C.; Žižak, T.; Domjan, S.; Medved, S. Dynamic parametric models for the holistic evaluation of semi-transparent photovoltaic/thermal façade with latent storage inserts. Appl. Energy 2020, 280, 115994. [Google Scholar] [CrossRef]
  4. Barbu, M.; Darie, G.; Siroux, M. Analysis of a residential photovoltaic-thermal (PVT) system in two similar climate conditions. Energies 2019, 12, 3595. [Google Scholar] [CrossRef] [Green Version]
  5. Chow, T.T. Performance analysis of photovoltaic-thermal collector by explicit dynamic model. Sol. Energy 2003, 75, 143–152. [Google Scholar] [CrossRef]
  6. Hu, H.; Wang, R.; Fang, G. Dynamic characteristics modeling of a hybrid photovoltaic-thermal heat pump system. Int. J. Green Energy 2010, 7, 537–551. [Google Scholar] [CrossRef]
  7. Salameh, T.; Tawalbeh, M.; Juaidi, A.; Abdallah, R.; Hamid, A.K. A novel three-dimensional numerical model for PV/T water system in hot climate region. Renew. Energy 2021, 164, 1320–1333. [Google Scholar] [CrossRef]
  8. Sakellariou, E.; Axaopoulos, P. Simulation and experimental performance analysis of a modified PV panel to a PVT collector. Sol. Energy 2017, 155, 715–726. [Google Scholar] [CrossRef]
  9. Shahsavar, A.; Ameri, M. Experimental investigation and modeling of a direct-coupled PV/T air collector. Sol. Energy 2010, 84, 1938–1958. [Google Scholar] [CrossRef]
  10. Dubey, S.; Tiwari, G.N. Analysis of PV/T flat plate water collectors connected in series. Sol. Energy 2009, 83, 1485–1498. [Google Scholar] [CrossRef]
  11. Tonui, J.K.; Tripanagnostopoulos, Y. Performance improvement of PV/T solar collectors with natural air flow operation. Solar Energy 2008, 82, 1–12. [Google Scholar] [CrossRef]
  12. Tonui, J.K.; Tripanagnostopoulos, Y. Air-cooled PV/T solar collectors with low-cost performance improvements. Sol. Energy 2007, 81, 498–511. [Google Scholar] [CrossRef]
  13. Misha, S.; Abdullah, A.L.; Tamaldin, N.; Rosli, M.A.M.; Sachit, F.A. Simulation CFD and experimental investigation of PVT water system under natural Malaysian weather conditions. Energy Rep. 2020, 6, 28–44. [Google Scholar] [CrossRef]
  14. Sami, S. Modeling and Simulation of a Novel Combined Solar Photovoltaic-Thermal Panel and Heat Pump Hybrid System. Clean Technol. 2018, 1, 7. [Google Scholar] [CrossRef] [Green Version]
  15. Shan, F.; Tang, F.; Cao, L.; Fang, G. Comparative simulation analyses on dynamic performances of photovoltaic-thermal solar collectors with different configurations. Energy Convers. Manag. 2014, 87, 778–786. [Google Scholar] [CrossRef]
  16. Touafek, K.; Haddadi, M.; Malek, A. Modeling and experimental validation of a new hybrid photovoltaic thermal collector. IEEE Trans. Energy Convers. 2011, 26, 176–183. [Google Scholar] [CrossRef]
  17. Amrizal, N.; Chemisana, D.; Rosell, J.I. Hybrid photovoltaic-thermal solar collectors dynamic modeling. Appl. Energy 2013, 101, 797–807. [Google Scholar] [CrossRef]
  18. Amrizal, N.; Chemisana, D.; Rosell, J.I.; Barrau, J. A dynamic model based on the piston flow concept for the thermal characterization of solar collectors. Appl. Energy 2012, 94, 244–250. [Google Scholar] [CrossRef]
  19. Ciabattoni, L.; Ippoliti, G.; Longhi, S. Experimental validation of a dynamic linear model of photovoltaic-thermal collector. In Proceedings of the 2013 IEEE 39th Photovoltaic Specialists Conference (PVSC), Tampa, FL, USA, 16–21 June 2013; pp. 1495–1499. [Google Scholar] [CrossRef]
  20. Jarimi, H.; Abu Bakar, M.N.; Othman, M.; Din, M.H. Bi-fluid photovoltaic/thermal (PV/T) solar collector: Experimental validation of a 2-D theoretical model. Renew. Energy 2016, 85, 1052–1067. [Google Scholar] [CrossRef]
  21. Zhou, J.; Ma, X.; Zhao, X.; Yuan, Y.; Yu, M.; Li, J. Numerical simulation and experimental validation of a micro-channel PV/T modules based direct-expansion solar heat pump system. Renew. Energy 2020, 145, 1992–2004. [Google Scholar] [CrossRef]
  22. Zhang, H.; Liang, K.; Chen, H.; Gao, D.; Guo, X. Thermal and electrical performance of low-concentrating PV/T and flat-plate PV/T systems: A comparative study. Energy 2019, 177, 66–76. [Google Scholar] [CrossRef]
  23. Zhang, P.; Rong, X.; Yang, X.; Zhang, D. Design and performance simulation of a novel hybrid PV/T-air dual source heat pump system based on a three-fluid heat exchanger. Sol. Energy 2019, 191, 505–517. [Google Scholar] [CrossRef]
  24. De Rosa, M.; Romano, G.; Rossi, C.; Scarpa, F.; Tagliafico, L.A. Dynamic thermal model for hybrid photovoltaic panels. Energy Procedia 2015, 81, 345–353. [Google Scholar] [CrossRef] [Green Version]
  25. Su, D.; Jia, Y.; Huang, X.; Alva, G.; Tang, Y.; Fang, G. Dynamic performance analysis of photovoltaic-thermal solar collector with dual channels for different fluids. Energy Convers. Manag. 2016, 120, 13–24. [Google Scholar] [CrossRef]
  26. Jeffrey Kuo, C.F.; Lee, Y.W.; Lazuardi Umar, M.; Yang, P.C. Dynamic modeling, practical verification and energy benefit analysis of a photovoltaic and thermal composite module system. Energy Convers. Manag. 2017, 154, 470–481. [Google Scholar] [CrossRef]
  27. Cai, J.; Ji, J.; Wang, Y.; Zhou, F.; Yu, B. A novel PV/T-air dual source heat pump water heater system: Dynamic simulation and performance characterization. Energy Convers. Manag. 2017, 148, 635–645. [Google Scholar] [CrossRef]
  28. Simonetti, R.; Molinaroli, L.; Manzolini, G. Development and validation of a comprehensive dynamic mathematical model for hybrid PV/T solar collectors. Appl. Therm. Eng. 2017, 133, 543–554. [Google Scholar] [CrossRef]
  29. Yu, Q.; Hu, M.; Li, J.; Wang, Y.; Pei, G. Development of a 2D temperature-irradiance coupling model for performance characterizations of the flat-plate photovoltaic/thermal (PV/T) collector. Renew. Energy 2020, 153, 404–419. [Google Scholar] [CrossRef]
  30. Guarracino, I.; Mellor, A.; Ekins-Daukes, N.J.; Markides, C.N. Dynamic coupled thermal-and-electrical modelling of sheet-and-tube hybrid photovoltaic/thermal (PVT) collectors. Appl. Therm. Eng. 2016, 101, 778–795. [Google Scholar] [CrossRef] [Green Version]
  31. Guarracino, I.; Freeman, J.; Ramos, A.; Kalogirou, S.A.; Ekins-Daukes, N.J.; Markides, C.N. Systematic testing of hybrid PV-thermal (PVT) solar collectors in steady-state and dynamic outdoor conditions. Appl. Energy 2019, 240, 1014–1030. [Google Scholar] [CrossRef]
  32. Pierrick, H.; Christophe, M.; Leon, G.; Patrick, D. Dynamic numerical model of a high efficiency PV-T collector integrated into a domestic hot water system. Sol. Energy 2015, 111, 68–81. [Google Scholar] [CrossRef]
  33. Das, D.; Kalita, P.; Dewan, A.; Tanweer, S. Development of a novel thermal model for a PV/T collector and its experimental analysis. Sol. Energy 2019, 188, 631–643. [Google Scholar] [CrossRef]
  34. Da Silva, R.M.; Fernandes, J.L.M. Hybrid photovoltaic/thermal (PV/T) solar systems simulation with Simulink/Matlab. Sol. Energy 2010, 84, 1985–1996. [Google Scholar] [CrossRef]
  35. Ji, J.; He, H.; Chow, T.; Pei, G.; He, W.; Liu, K. Distributed dynamic modeling and experimental study of PV evaporator in a PV/T solar-assisted heat pump. Int. J. Heat Mass Transf. 2009, 52, 1365–1373. [Google Scholar] [CrossRef]
  36. Fan, W.; Kokogiannakis, G.; Ma, Z.; Cooper, P. Development of a dynamic model for a hybrid photovoltaic thermal collector-Solar air heater with fins Publication Details Development of a dynamic model for a hybrid photovoltaic thermal collector-Solar air heater with fins. Renew. Energy 2017, 101, 816–834. [Google Scholar] [CrossRef] [Green Version]
  37. Hussain, M.I.; Kim, J.T. Performance optimization of unglazed nanofluid photovoltaic/thermal system: Energy and exergy analyses. Int. J. Photoenergy 2018, 2018, 3895013. [Google Scholar] [CrossRef] [Green Version]
  38. Sakellariou, E.; Axaopoulos, P. An experimentally validated, transient model for sheet and tube PVT collector. Sol. Energy 2018, 174, 709–718. [Google Scholar] [CrossRef]
  39. Al-Waeli, A.H.A.; Chaichan, M.T.; Sopian, K.; Kazem, H.A.; Mahood, H.B.; Khadom, A.A. Modeling and experimental validation of a PVT system using nanofluid coolant and nano-PCM. Sol. Energy 2019, 177, 178–191. [Google Scholar] [CrossRef]
  40. Maadi, S.R.; Khatibi, M.; Ebrahimnia-Bajestan, E.; Wood, D. Coupled thermal-optical numerical modeling of PV/T module—Combining CFD approach and two-band radiation DO model. Energy Convers. Manag. 2019, 198, 111781. [Google Scholar] [CrossRef]
  41. D’Angola, A.; Enescu, D.; Mecca, M.; Ciocia, A.; di Leo, P.; Fracastoro, G.V.; Spertino, F. Theoretical and numerical study of a photovoltaic system with active fluid cooling by a fully-coupled 3D thermal and electric model. Energies 2020, 13, 852. [Google Scholar] [CrossRef] [Green Version]
  42. Ghani, F.; Duke, M.; Carson, J.K. Effect of flow distribution on the photovoltaic performance of a building integrated photovoltaic/thermal (BIPV/T) collector. Sol. Energy 2012, 86, 1518–1530. [Google Scholar] [CrossRef]
  43. Jonas, D.; Lämmle, M.; Theis, D.; Schneider, S.; Frey, G. Performance modeling of PVT collectors: Implementation, validation and parameter identification approach using TRNSYS. Sol. Energy 2019, 193, 51–64. [Google Scholar] [CrossRef]
  44. Buonomano, A.; Calise, F.; Vicidomini, M. Design, simulation and experimental investigation of a solar system based on PV panels and PVT collectors. Energies 2016, 9, 497. [Google Scholar] [CrossRef]
  45. Evola, G.; Marletta, L. Exergy and thermoeconomic optimization of a water-cooled glazed hybrid photovoltaic/thermal (PVT) collector. Sol. Energy 2014, 107, 12–25. [Google Scholar] [CrossRef]
  46. Behzadi, A.; Arabkoohsar, A.; Yang, Y. Optimization and dynamic techno-economic analysis of a novel PVT-based smart building energy system. Appl. Therm. Eng. 2020, 181, 115926. [Google Scholar] [CrossRef]
  47. Chen, J.F.; Zhang, L.; Dai, Y.J. Performance analysis and multi-objective optimization of a hybrid photovoltaic/thermal collector for domestic hot water application. Energy 2018, 143, 500–516. [Google Scholar] [CrossRef]
  48. Herrando, M.; Ramos, A.; Freeman, J.; Zabalza, I.; Markides, C.N. Technoeconomic modelling and optimisation of solar combined heat and power systems based on flat-box PVT collectors for domestic applications. Energy Convers. Manag. 2018, 175, 67–85. [Google Scholar] [CrossRef]
  49. Al-Waeli, A.H.A.; Sopian, K.; Yousif, J.H.; Kazem, H.A.; Boland, J.; Chaichan, M.T. Artificial neural network modeling and analysis of photovoltaic/thermal system based on the experimental study. Energy Convers. Manag. 2019, 186, 368–379. [Google Scholar] [CrossRef]
  50. Ammar, M.b.; Chaabene, M.; Chtourou, Z. Artificial Neural Network based control for PV/T panel to track optimum thermal and electrical power. Energy Convers. Manag. 2013, 65, 372–380. [Google Scholar] [CrossRef]
  51. Liang, R.; Zhang, J.; Zhou, C. Dynamic Simulation of a Novel Solar Heating System Based on Hybrid Photovoltaic/Thermal Collectors (PVT). Procedia Eng. 2015, 121, 675–683. [Google Scholar] [CrossRef] [Green Version]
  52. Nash, A.L.; Badithela, A.; Jain, N. Dynamic modeling of a sensible thermal energy storage tank with an immersed coil heat exchanger under three operation modes. Appl. Energy 2017, 195, 877–889. [Google Scholar] [CrossRef]
  53. Maveety, J.G.; Razani, A. A two-dimensional numerical investigation of the optimal removal time and entropy production rate for a sensible thermal storage system. Energy 1996, 21, 1265–1276. [Google Scholar] [CrossRef]
  54. Nelson, J.E.B.; Balakrishnan, A.R.; Murthy, S.S. Parametric studies on thermally stratified chilled water storage systems. Appl. Therm. Eng. 1999, 19, 89–115. [Google Scholar] [CrossRef]
  55. Kong, L.; Yuan, W.; Zhu, N. CFD Simulations of Thermal Stratification Heat Storage Water Tank with an Inside Cylinder with Openings. Procedia Eng. 2016, 146, 394–399. [Google Scholar] [CrossRef] [Green Version]
  56. Abdulla, A.; Reddy, K.S. Effect of operating parameters on thermal performance of molten salt packed-bed thermocline thermal energy storage system for concentrating solar power plants. Int. J. Therm. Sci. 2017, 121, 30–44. [Google Scholar] [CrossRef]
  57. Yin, H.; Ding, J.; Jiang, R.; Yang, X. Thermocline characteristics of molten-salt thermal energy storage in porous packed-bed tank. Appl. Therm. Eng. 2017, 110, 855–863. [Google Scholar] [CrossRef]
  58. Raccanello, J.; Rech, S.; Lazzaretto, A. Simplified dynamic modeling of single-tank thermal energy storage systems. Energy 2019, 182, 1154–1172. [Google Scholar] [CrossRef]
  59. Karim, A.; Burnett, A.; Fawzia, S. Investigation of stratified thermal storage tank performance for heating and cooling applications. Energies 2018, 11, 49. [Google Scholar] [CrossRef] [Green Version]
  60. Rahman, A.; Smith, A.D.; Fumo, N. Performance modeling and parametric study of a stratified water thermal storage tank. Appl. Therm. Eng. 2016, 100, 668–679. [Google Scholar] [CrossRef]
  61. Hansen, C.; King, B. Determining series resistance for equivalent circuit models of a PV module. IEEE J. Photovolt. 2019, 9, 538–543. [Google Scholar] [CrossRef]
  62. Photovoltaic/Thermal Collector—SOLIMPEKS VOLTHER POWERVOLT. Available online: https://www.archiexpo.com/prod/solimpeks-solar/product-74376-2098999.html (accessed on 8 November 2021).
  63. Newton, B.J. Modelling of Solar Storage Tanks. Master’s Thesis, University of Wisconsin-Madison, Madison, WI, USA, 1995. [Google Scholar]
  64. Thermal Properties of Glycole Mixture. Available online: https://tyfo.de/downloads/TYFOCOR-L_en_TI.pdf (accessed on 30 November 2021).
Figure 1. Functional scheme of the photovoltaic/thermal system.
Energies 14 08162 g001
Figure 2. PV/T system: (1) PV/T modules, (2) heat exchangers, (3) refrigeration unit, (4) TEST, (5) pyranometer, and (6) anemometer and ambient temperature sensor.
Energies 14 08162 g002
Figure 3. Model setup: PV/T collectors in combination with a TEST model created in the Matlab/Simulink software package.
Energies 14 08162 g003
Figure 4. Cross-section of the PV/T collector and description of each layer.
Energies 14 08162 g004
Figure 5. Thermal energy storage tank: (a) schematic representation of the open TEST system; (b) cross-section of the i−th layer of the TEST (summarized by [63]).
Energies 14 08162 g005
Figure 6. Temperature measurements on the outlet (Tout) and inlet (Tin) side of the PV/T collectors and mass (m) and volume (Q) flow of the working medium for 83 days (from August to October 2021).
Energies 14 08162 g006
Figure 7. Temperature measurements of the working medium within the TEST at six different heights for 83 days (from August to October 2021).
Energies 14 08162 g007
Figure 8. Thermal properties of the working medium as a function of temperature summarized by [64].
Energies 14 08162 g008
Figure 9. Validation of a dynamic thermal model of a PV/T collector with measurements for 83 days.
Energies 14 08162 g009
Figure 10. Validation of a dynamic electric model of a PV/T collector with measurements for 83 days.
Energies 14 08162 g010
Figure 11. Validation of a dynamic model of a TEST with measurements for 83 days.
Energies 14 08162 g011
Figure 12. Validation of the dynamic model of a PV/T collector and TEST with measurements (TPV/T, P, TTEST) for three different weather conditions: sunny, cloudy, and overcast.
Energies 14 08162 g012
Figure 13. Validation of the dynamic model of PV/T collector and TEST with measurements using nRMSE and MAPE method (TPV/T, P, TTEST) based on three different weather conditions: sunny, cloudy, and overcast.
Energies 14 08162 g013
Table 1. Parameters of the considered mono-crystalline PV/T collector under STC conditions.
SOLIMPEKS Volther
Dimensions (l × w × h) (mm)995 × 1670 × 60
PV cell size (mm2)156 × 156
PMPP (W)330
UMPP (V)37.77
IMPP (A)9.15
UOC (V)39.86
ISC (A)9.77
αPV (%/°C)0.048
βPV (%/°C)−0.255
γPV (%/°C)−0.331
Number of PV cells connected in series60
Table 2. Thermal, mechanical, and optical parameters of the considered mono-crystalline PV/T collector.
Materialαo (/)ε (/)ρo (/)τo (/)ρ (kg/m3)C (J/kgK)k (W/mK)d (mm)
Glass0.0230.90.90.07930005001.84
EVA----96020900.350.4
PV cell0.90.9500.123306771480.3
EVA foil----96020900.350.4
PVF foil----145013000.150.2
Adhesive----10609801.400.1
Copper absorber----27008802374
Heat exchanger----2700880237/
Styrofoam----105012000.1320
Protective layer00.8200.18120012500.21
Publisher’s Note: MDPI stays neutral with regard to jurisdictional claims in published maps and institutional affiliations.

