Article

Pine Wood and Sewage Sludge Torrefaction Process for Production Renewable Solid Biofuels and Biochar as Carbon Carrier for Fertilizers

1
Faculty of Process and Environmental Engineering, Lodz University of Technology, Wolczanska 213, 90-924 Lodz, Poland
2
Faculty of Energy and Fuels, AGH University of Science and Technology, al. Mickiewicza 30, 30-059 Krakow, Poland
3
Faculty of Economics and Management, University of Zielona Góra, ul. Licealna 9, 65-246 Zielona Góra, Poland
4
Department of Plant Ecophysiology, Faculty of Biology and Environmental Protection, University of Lodz, Str. Banacha 12/16, 92-237 Lodz, Poland
5
Faculty of Biotechnology and Food Science, Lodz University of Technology, Wolczanska 171/173, 90-924 Lodz, Poland
*
Authors to whom correspondence should be addressed.
Energies 2021, 14(23), 8176; https://doi.org/10.3390/en14238176
Submission received: 15 October 2021 / Revised: 24 November 2021 / Accepted: 1 December 2021 / Published: 6 December 2021
(This article belongs to the Special Issue Biomass Torrefaction and Its Applications in Low-Carbon Industry)

Abstract

:
This work presents the results of research on the thermo-chemical conversion of woody biomass–pine wood coming from lodzkie voivodship forests and sewage sludge from the Group Sewage Treatment Plant of the Łódź Urban Agglomeration. Laboratory scale analyses of the carbonization process were carried out, initially using the TGA technique (to assess activation energy (EA)), followed by a flow reactor operating at temperature levels of 280–525 °C. Both the parameters of carbonized solid biofuel and biochar as a carrier for fertilizer (proximate and ultimate analysis) and the quality of the torgas (VOC) were analyzed. Analysis of the pine wood and sewage sludge torrefaction process shows clearly that the optimum process temperature would be around 325–350 °C from a mass loss ratio and economical perspective. This paper shows clearly that woody biomass, such as pine wood and sewage sludge, is a very interesting material both for biofuel production and in further processing for biochar production, used not only as an energy carrier but also as a new type of carbon source in fertilizer mixtures.

1. Introduction

As a part of the European Union, Poland is a powerful participant in the new European Green Deal which will be a revolution from the point of view of the Polish energy sector. In the future years, new climatic and environmental legislation will provide new obstacles. The Polish energy sector is now confronted with significant issues. The primary issues confronting this sector include high energy consumption, insufficient infrastructure development, production and transportation of fuels and energy, extraction of external energy natural gas, and rising CO2 pricing. Amongst renewable energy sources, thermodynamic and numerical modeling aspects of biomass torrefaction are characterized by unflagging interest. As part of the research, a thermogravimetric analysis was performed on the basis of which the kinetics of chemical reactions taking place during the process were determined. Additionally, measurements of the total volatile organic compounds from the process were carried out and the combustion data were determined for the torrefaction products obtained. The research was carried out as part of the BIOCARBON project, which aims to design a torrefaction installation equipped with a rolling-bed dryer operating in continuous air mode and a reactor using superheated steam for the torrefaction process. Poland is at the forefront of Europe when it comes to forest area. Currently, the forest area in Poland is over 9.3 million ha. Pine is the most common species in lowland and upland areas. According to the Large-Area Inventory of the State of Forests, pine grows on 60% of the forest area of the state forests and approximately 54% of private and communal forests [1]. Pine’s dominance results from the way in which forest management was conducted in the past [2,3,4]. The detailed percentage of pine forest area broken down by voivodeships of Poland is presented in Figure 1.
During this process, the lignin contained in the biomass heats up under the pressure applied and becomes soft and plastic. In this way, the material can be formed into any shape which allows for easy processing and transportation. As a result of the process, the moisture content of the material decreases, and the calorific value increases. The pelletizing process gives the pine wood fuel properties [5,6,7,8,9]. However, in order to be able to fully use pine wood as fuel, it must be subjected to further technological processes. An important direction of development concerns large-scale processes aimed at the preparation of biomass, where, in addition to drying, briquetting, baling, or pelletization, biomass is also subjected to processes aimed at altering its physical character and changing its moisture content. One such process is torrefaction. It can be said that torrefaction is a process of preliminary thermo-chemical processing of biomass under an inert atmosphere [10,11,12,13,14,15]. Its main task is to approximate the properties of biomass to the properties of average coals [16]. Sewage sludge is considered to be one of the many harmful substances produced by man. In short, it consists of suspensions of various waste substances in water, discharged from industrial plants and households. Unfortunately, it contains significant amounts of chemical compounds, bacteria, and microorganisms harmful to the environment. Therefore, in order to get rid of harmful substances, it must be treated. As certain technological (biological-chemical) processes are carried out, along with the removal of pollutants, sewage sludge is formed. This includes wastes that need to be treated and managed, and interestingly enough these can be a source of additional fuel due to their properties. Torrefaction is a thermo-chemical treatment of biomass at a temperature range of 200–300 °C; many researchers have done research on woody biomass torrefaction process and its influence on the woody biomass molecular structure [17,18,19,20,21,22,23]. It comprises a process that leads to an increase in biomass energy density, mainly as a result of decomposition of the reactive component of biomass, as in hemicellulose under anaerobic conditions [24,25,26,27,28,29,30]. During this process, about 30% of the initial weight of the raw material is reduced. This is mainly due to the removal of moisture from the material, but also the release of volatile substances. Due to the carbonization of biomass taking place during torrefaction, the biomass obtains properties that make it similar to coal [31,32,33,34,35]. Torrefied biomass is used not only as a renewable fuel in the energy sector [36,37,38,39,40,41,42,43,44]. Due to its developed specific surface and microporosity, it can also be used in environmental protection to remove pollutants from water and sewage [45,46]. Another sector of use concerns agriculture. The addition of torrefied biomass to the soil improves its properties and may contribute to reducing the use of fertilizers and plant protection products. It can also increase the effectiveness of using natural fertilizers [47,48,49,50]. Due to its very low thermal conductivity and absorption properties, torrefied biomass is also used in construction to produce insulation [51,52].
The sewage sludge used in this study came from the Group Sewage Treatment Plant of the Łódź Urban Agglomeration, which is located on the south-western border of Łódź. The sewage network in Łódź is characterized by a large share of combined sewage, which during heavy rainfalls and snowmelts causes troublesome irregularity in the amount of sewage flowing to the treatment plant. The areas from which wastewater flows into the plant are inhabited by approximately 820,000 people. The facility is a typical mechanical and biological treatment plant with increased removal of biogenic compounds. The biological process is periodically supported by iron coagulant and an external carbon source. The sludge consists of a large amount of organic compounds that affect its calorific value. This is similar to the calorific value of brown coal and can be 10–15 MJ/kg d.m.
One of the many methods of sewage sludge treatment is its thermal conversion. Depending on the technology used, there is a significant reduction in the amount of sludge and a reduction in the onerous impact on the environment. However, each method is fraught with the problem of continuous waste generation, regardless of the time of year or weather conditions. Significant developments in thermal treatment technologies have been observed during the last decade. In addition to legal requirements, technical, economic, and aesthetic considerations have also forced changes in this field. Thermal treatment can also be a source of energy and a source for the recovery of various materials used in road construction and elements such as phosphorus. The mechanism of sewage sludge torrefaction is similar to the torrefaction of plant biomass. The main fractions that are formed during the thermal decomposition of the sludge in an inert atmosphere are as follows: Gaseous fraction; are non-condensing gases (NCG) containing mainly hydrogen, methane, carbon monoxide, carbon dioxide and other gases in smaller concentrations; Solid fraction, mainly consisting of pure carbon with some inert substances. It should be noted that the share of individual fractions depends on the temperature, residence time in the reactor, pressure, turbulence, as well as the properties of sewage sludge (pH, organic matter content, dry matter content). The torrefaction process can be tested by thermogravimetry (TG), differential scanning calorimetry (DSC) and additionally by mass spectrometry (MS) and chromatographic techniques [19,27].

2. Materials and Methods

2.1. Thermogravimetric Analysis

Pinewood and sewage sludge were dried before the thermogravimetric tests. For this purpose, crucibles were calcined for 3 h at 900 °C. Biomass was placed in the prepared crucibles. The drying process was carried out in the Binder 9010-0082 dryer at a temperature of 105 °C for 24 h [53]. Dried samples were transferred to a desiccator to cool down. The next stage of the research was thermogravimetric analysis of biomass, which was aimed at measuring changes in the mass of a given sample depending on the analysis temperature and its time. Measurements were made with a NETZSCH TG 209 F3 Tarsus thermogravimeter. The analysis consisted of heating the biomass sample weighing about 10 mg to the following temperatures; for pine wood 285, 325 and 525 °C and for sewage sludge within the range of 280–520 °C, with a heating rate of 5, 10 and 20 K/min, with a flow of inert gas-nitrogen at a rate of 20 mL/min. The residence time of the sample in the thermogravimeter was set up for 5 to 10 min. The thermogravimetric analysis determines the mass losses as a function of temperature during the biomass torrefaction process. Figure 2 shows a diagram of the installation for the drying process and thermogravimetric analysis of pine wood and sewage sludge.

2.2. Kinetic Analysis

Based on the findings obtained from the thermogravimetric analysis with the use of NETZSCH Kinetics 3 software, the reaction kinetics and chemical kinetics for pinewood and sewage sludge were determined. This software is used for thermal measurements of chemical reactions. The analysis allowed for the determination of the speed of chemical processes and the speed of reactions taking place during the torrefaction, and for the determination of the mechanism of individual elementary reactions occurring during the process.
The first method used was the Kissinger method, which determines the linear dependence of the activation energy and the Arrhenius pre-exponential factor on the temperature rise rate as well as the temperature at which the decomposition rate is the highest. It refers to the maximum rate of degradation based on the TG or DTG curves. This method has been standardized to the ASTM E698 method, which is based on the results of differential thermal analysis [54,55,56]. For the first order reaction, taking place under non-isothermal conditions, at different rates of temperature increase, the rate of decomposition is described by the relationship:
l n   l n   β T m a x 2 = E a R T m a x
where: β—sample heating speed (K/min); Tmax—the temperature at which the sample mass loss rate is greatest (K); A—pre-exponential coefficient; Ea—activation energy (J/mol).
Another method was the Friedman method, which is the most general differential method [57,58] and uses a logarithmic equation:
l n   l n   d x d t = + l n   l n   f x    
The last method was the Ozawa–Flynn–Wall method, which, as the Friedman method, allows determination of the activation energy value without the necessity of adopting a specific kinetic model [59,60]. It is based on the integral form of the equation:
G x = d x f x = A β T 0 T e x p   E a R T d t

2.3. Study of the Emission of the Total Volatile Organic Compounds

The next stage of the research was to determine the emission of the total volatile organic compounds from the pine wood and sewage sludge torrefaction process. The dried sample, weighing about 2 g, was placed on a quartz boat, and then the prepared vessel was placed in the PR-45/1350 M electric furnace for 1 h [61]. The tests were carried out at temperatures of 285, 325, and 525 °C. The torrefaction process was carried out in the presence of CO2, the flow rate of which was 1 L/min. Each trial was repeated 3 times to verify the results provided. The course of the emission of total volatile organic compounds over time was measured continuously during the heating of the sample. A stationary JUM FID 3-500 analyzer was used to determine the emissions. Figure 3 shows a diagram of the installation for conducting VOC total emission tests.
Based on the results of the emission of the sum of VOCs over time and the emission factor was calculated, which defines the amount of pollutants emitted in relation to the amount of fuel undergoing the process.
w V O C = Q C O 2   · 1 τ p 0 t c τ d t   · τ p m
where: QCO2—carbon dioxide flow rate (m3/s); τ p —torrefaction time (s), c—average concentration of volatile organic compounds (mg/m3); m—sample weight (g).

2.4. Determination of the Heat of Combustion Value of the Obtained Torrefaction

The combustion heat value of the obtained torrefied pine wood and sewage sludge was measured using the Parr 6400 calorimeter. The analysis consisted in burning a given sample in an oxygen atmosphere. From the obtained torrefied material, samples weighing about 1 g were weighed and then placed into a tablet. The prepared samples were placed in crucibles and then in a calorimetric bomb to start the measurement. Figure 4 shows a diagram of the apparatus.

3. Results

3.1. Thermogravimetric Analysis

An example of a thermogravimetric analysis graph for pine wood was shown at Figure 5. The results presented relate to the process carried out at a temperature of 525 °C, with a heating rate of 20 K/min and a residence time of 8 min. As can be seen in the first stage of the process, drying, the greatest loss of mass was recorded, amounting to approximately 96%. At a later stage of the process, during the torrefaction process, the weight loss was about 28%.
Figure 6 and Figure 7 show the changes in the weight of the pine wood and sewage sludge with respect to the temperature and duration of the torrefaction process resulting from changes in the chemical structure, water loss, and degassing of the material. Increases in temperature were linked to significantly higher mass loss in the sewage sludge. In addition to parameters such as combustion temperature and residence time, the heating rate was examined. Figure 6 shows the results of the pine wood weight loss for the thermogravimetric analysis conducted at a heating ratio of 5–10–20 K/min.
At a heating speed of 5 K/min, the highest weight loss, 84–97%, was recorded at the temperature of 525 °C. The longer the sample remains at this temperature, the smaller the weight loss. At 285 °C, the weight loss was 22–26%. The longer the sample residence time was, the greater the weight loss was recorded. At 325 °C, the weight loss was 55–64%. At the heating speed of 10 K/min at the temperature of 525 °C, the weight losses were significantly lower than in the case of the heating ratio of 5 K/min and amounted to 83–86%. Lower weight losses were also noted at 325 °C, 51–54%. At 285 °C, the lowest weight losses were observed, which amounted to 22–28%. The last heating ratio used during the tests was 20 K/min. At 285 °C, the weight loss was 20–25%. At a temperature of 325 °C, this value increased to 43–54%, and at a temperature of 525 °C from 80–84%.
Figure 7 shows the results of the weight loss of sewage sludge for the thermogravimetric analysis conducted at a heating ratio of 5–10–20 K/min.
At the maximum temperature of 520 °C, the mass loss was observed in a range of 47–50% with a heating rate of 5 K/min. Minimum and maximum mass losses were found to be 16 and 55% with respect to the lower and higher working temperatures at a 10 K/min rate. Average mass loss during the 10 K/min heating rate was found to be higher than 5 K/min. Minimum and maximum mass losses were found as 17 and 56% at 20 K/min heating rate. In the case of sewage sludge, the lowest weight loss was achieved during the process at a heating speed of 10 K/min, a residence time of 5 min, and a temperature of 280 °C. Figure 8 indicates the sewage sludge mass loss during thermogravimetric analysis at every 10 °C point in the scale 250–520 °C.
A 37–41% mass loss was found at 350 °C and an 18–24% mass loss was observed at 350 °C. The results show the residence time does not have not as much effect on mass loss as temperature. Desired mass loss, 30%, was reached at 300 °C and further. Over 480 °C, 50% mass loss was observed.

3.2. Kinetic Analysis

A kinetic study of the pine wood and sewage sludge torrefaction process was performed based on the findings of thermogravimetric measurements with the use of three different heating rates, 5–10–20 K/min. The sample weighed 10 ± 1 mg where temperatures ranging from 200 to 500 °C were used for the kinetic analysis. Figure 9 and Figure 10 show the TG curves of the sewage sludge torrefaction process for three different rates in a temperature range from 200 to 500 °C.
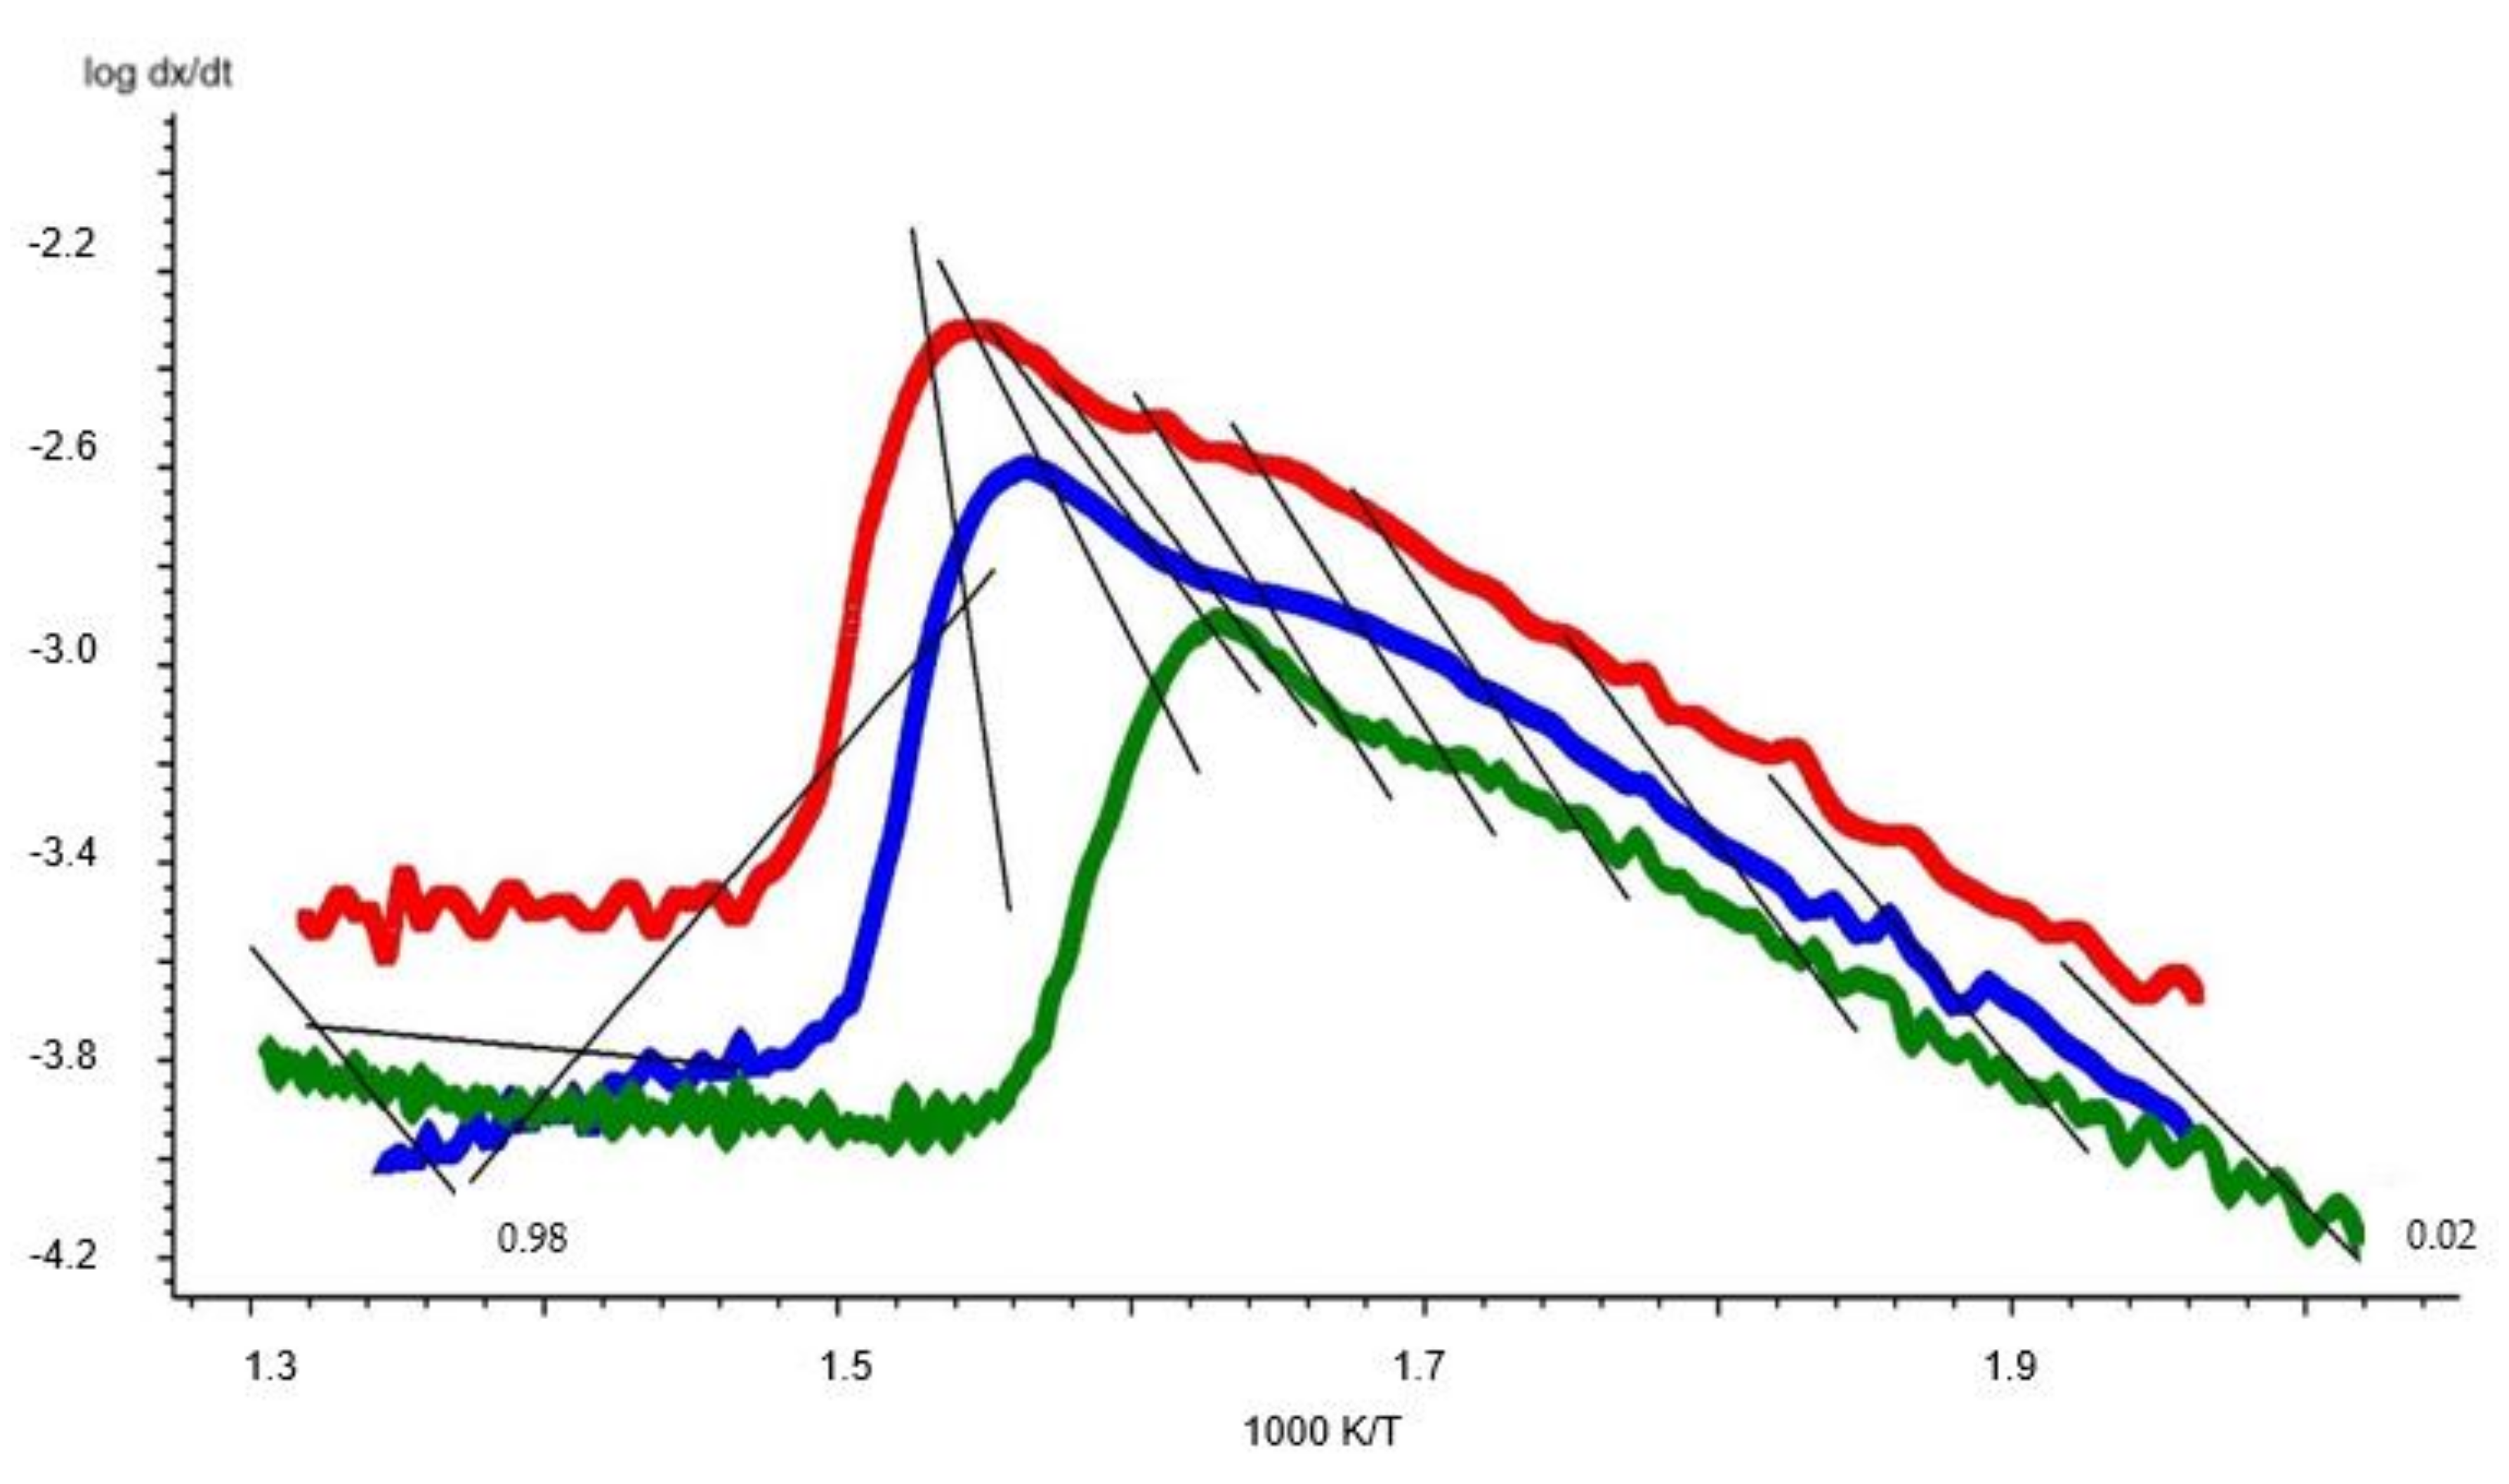
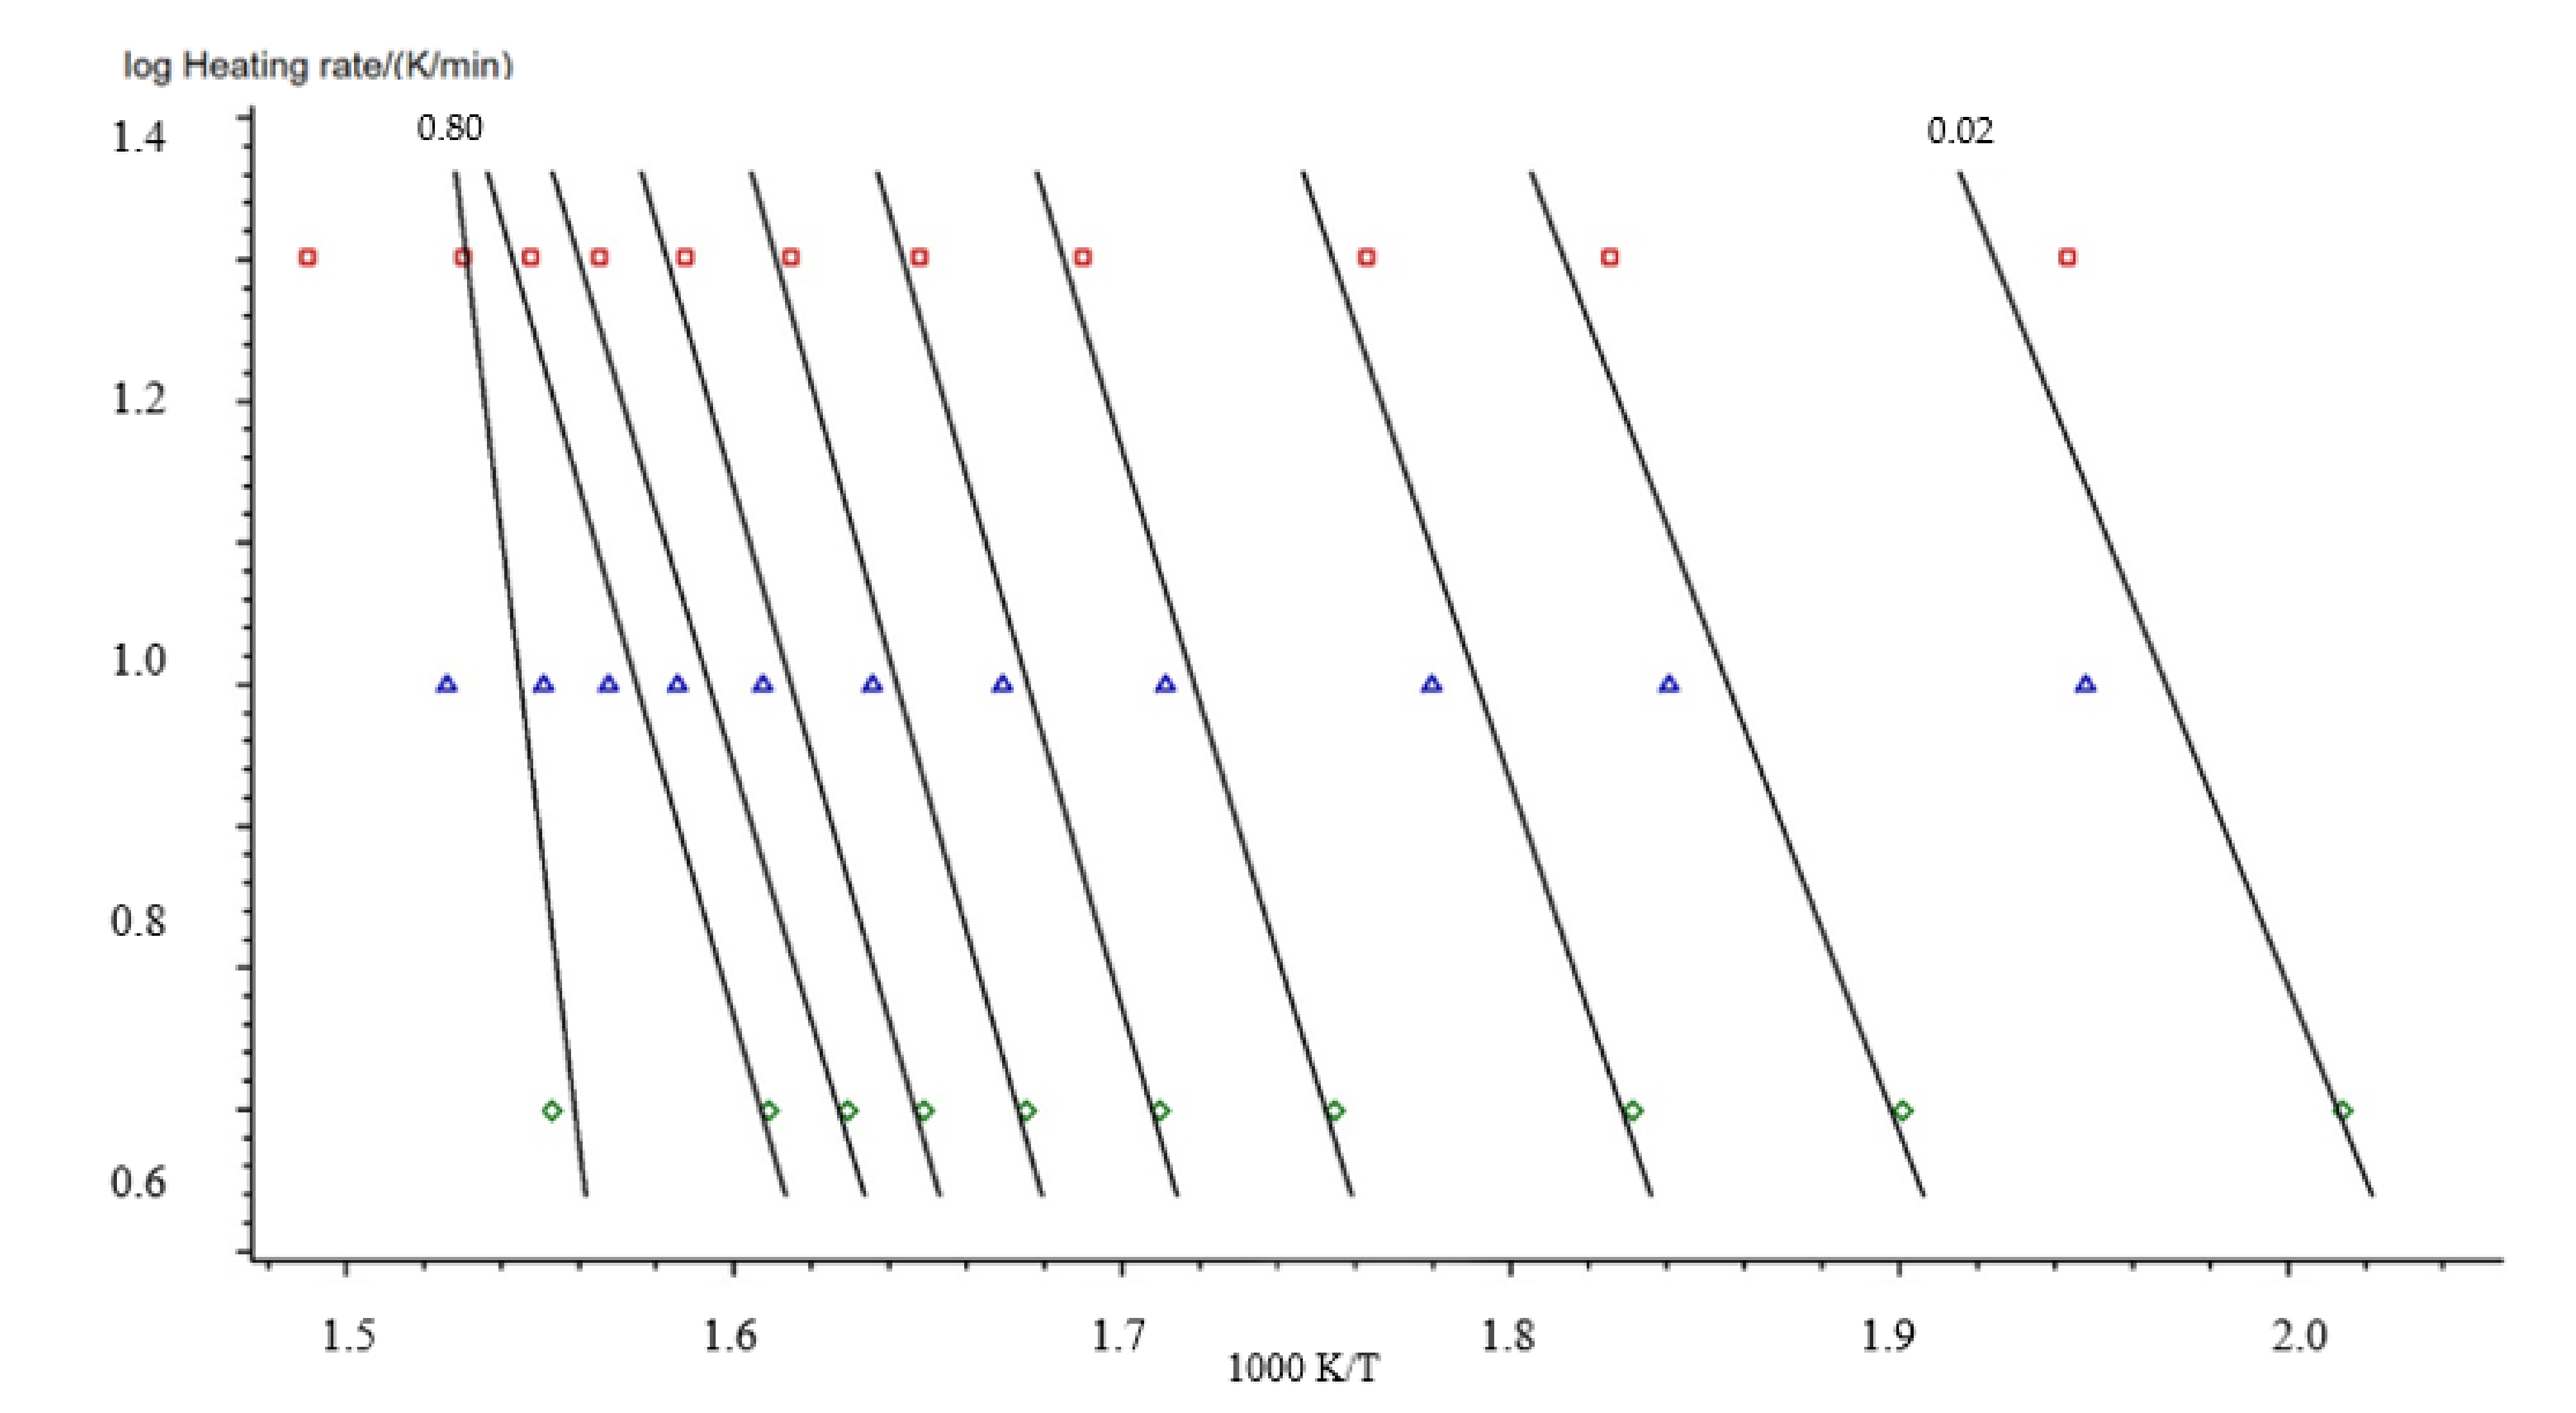
The determination of the kinetics of the reactions occurring during the torrefaction process began with isoconversion analyses, which allowed the activation energy to be calculated without knowing the reaction model. The first used was the Kissinger analysis method according to ASTM E698, which is based on the assumption that the maximum of a one-step reaction is reached with the same degree of conversion regardless of the heating rate. The activation energy of a solid’s thermal decomposition may be estimated using this approach. Its result is a plot of the logarithm of the sample heating speed as a function of the reciprocal of the temperature at the moment when the mass loss rate is the highest. The results are presented in Figure A1 and Figure A2 in Appendix A. Then, the Friedman analysis was performed, which consists of determining the logarithm of the conversion as a function of the reciprocal of temperature. The results of the analysis are presented in Figure A3 and Figure A4. The next method that was used to determine the kinetics of the reaction was the Ozawa-Flynn-Wall method. Thanks to this method, the logarithm dx/dt was plotted as a function of the reciprocal of temperature and, despite the lack of knowledge of the reaction mechanisms at this stage, the activation energy and the pre-exponential coefficient were calculated for each conversion stage. Figure 11 and Figure 12 show the results of the analysis both for pine wood and sewage sludge.
The analysis by the Ozawa–Flynn–Wall method allowed the value of the pre-exponential coefficient and the activation energy as a function of the conversion degree to be presented. The results of the analysis are presented in Figure 13 and Figure 14.
To better illustrate the results, the above data are presented below in Table 1 and Table 2 for both biomasses.
Similarly to the Friedman method, the activation energy value shows a significant variability from about 120 to 400 kJ/mol. This confirms that the pyrolysis of pine wood samples consists of a series of overlapping reactions. For the case of pine wood analyzed, it is assumed that the pyrolysis process is carried out in one stage. The kinetic equation transforms into a thermo-kinetic equation in dynamic circumstances. Using the Kinetics 3 program, an attempt has been made to mathematically adjust one of the models of the thermal breakdown reaction based on the TG curves acquired as a function of temperature. After taking into account the assumed reaction model, the kinetic parameters of the reaction were determined, meaning the constant pre-exponential coefficient, as well as the activation energy and the matching coefficient. The most accurate fit against the experimental data for the pine wood sample was obtained for the n-order reaction model for n = 2.9. For such a match, the value of the correlation coefficient was 0.9945, the activation energy was 158.65 kJ/mol and the pre-exponential coefficient was 11.61. The results of the model fit are presented in Figure 15 for pine wood. As in the case of kinetic parameters determined by the Friedman method, their great variability is noticeable. We observe an increase in the values of parameters determined for both low and high conversion rates. It should be noted that for the degree of conversion above 0.9, the activation energy values and errors in its estimation assume absurd values. This may indicate the imperfection of the computational methodology as we approach the boundary conditions and the complexity of changes taking place in the sewage sludge in the considered temperature range. The best fit to the experimental data for the sewage sludge sample was obtained for the nth order reaction model for n = 4.98. The correlation coefficient R2 was 0.9885, the activation energy was 122.74 kJ/mol, and the pre-exponential coefficient (ln A) was 9.42. Figure 16 shows the adjustment of the equation with the calculated coefficients to the experimental data for sewage sludge.
It should be noted that the calculated triplet (n, Ea, ln A) represents just the optimal mathematical fit of the equation to the experimental data, and in this case it has no strict physical meaning (reaction order). This method of calculating activation energy is obvious: it merely serves to correlate the model with experimental data and has no relevance as a definition. The research results presented refer only to research biomass pine wood and sewage sludge.

3.3. Study of the Emission of the Sum of Volatile Organic Compounds

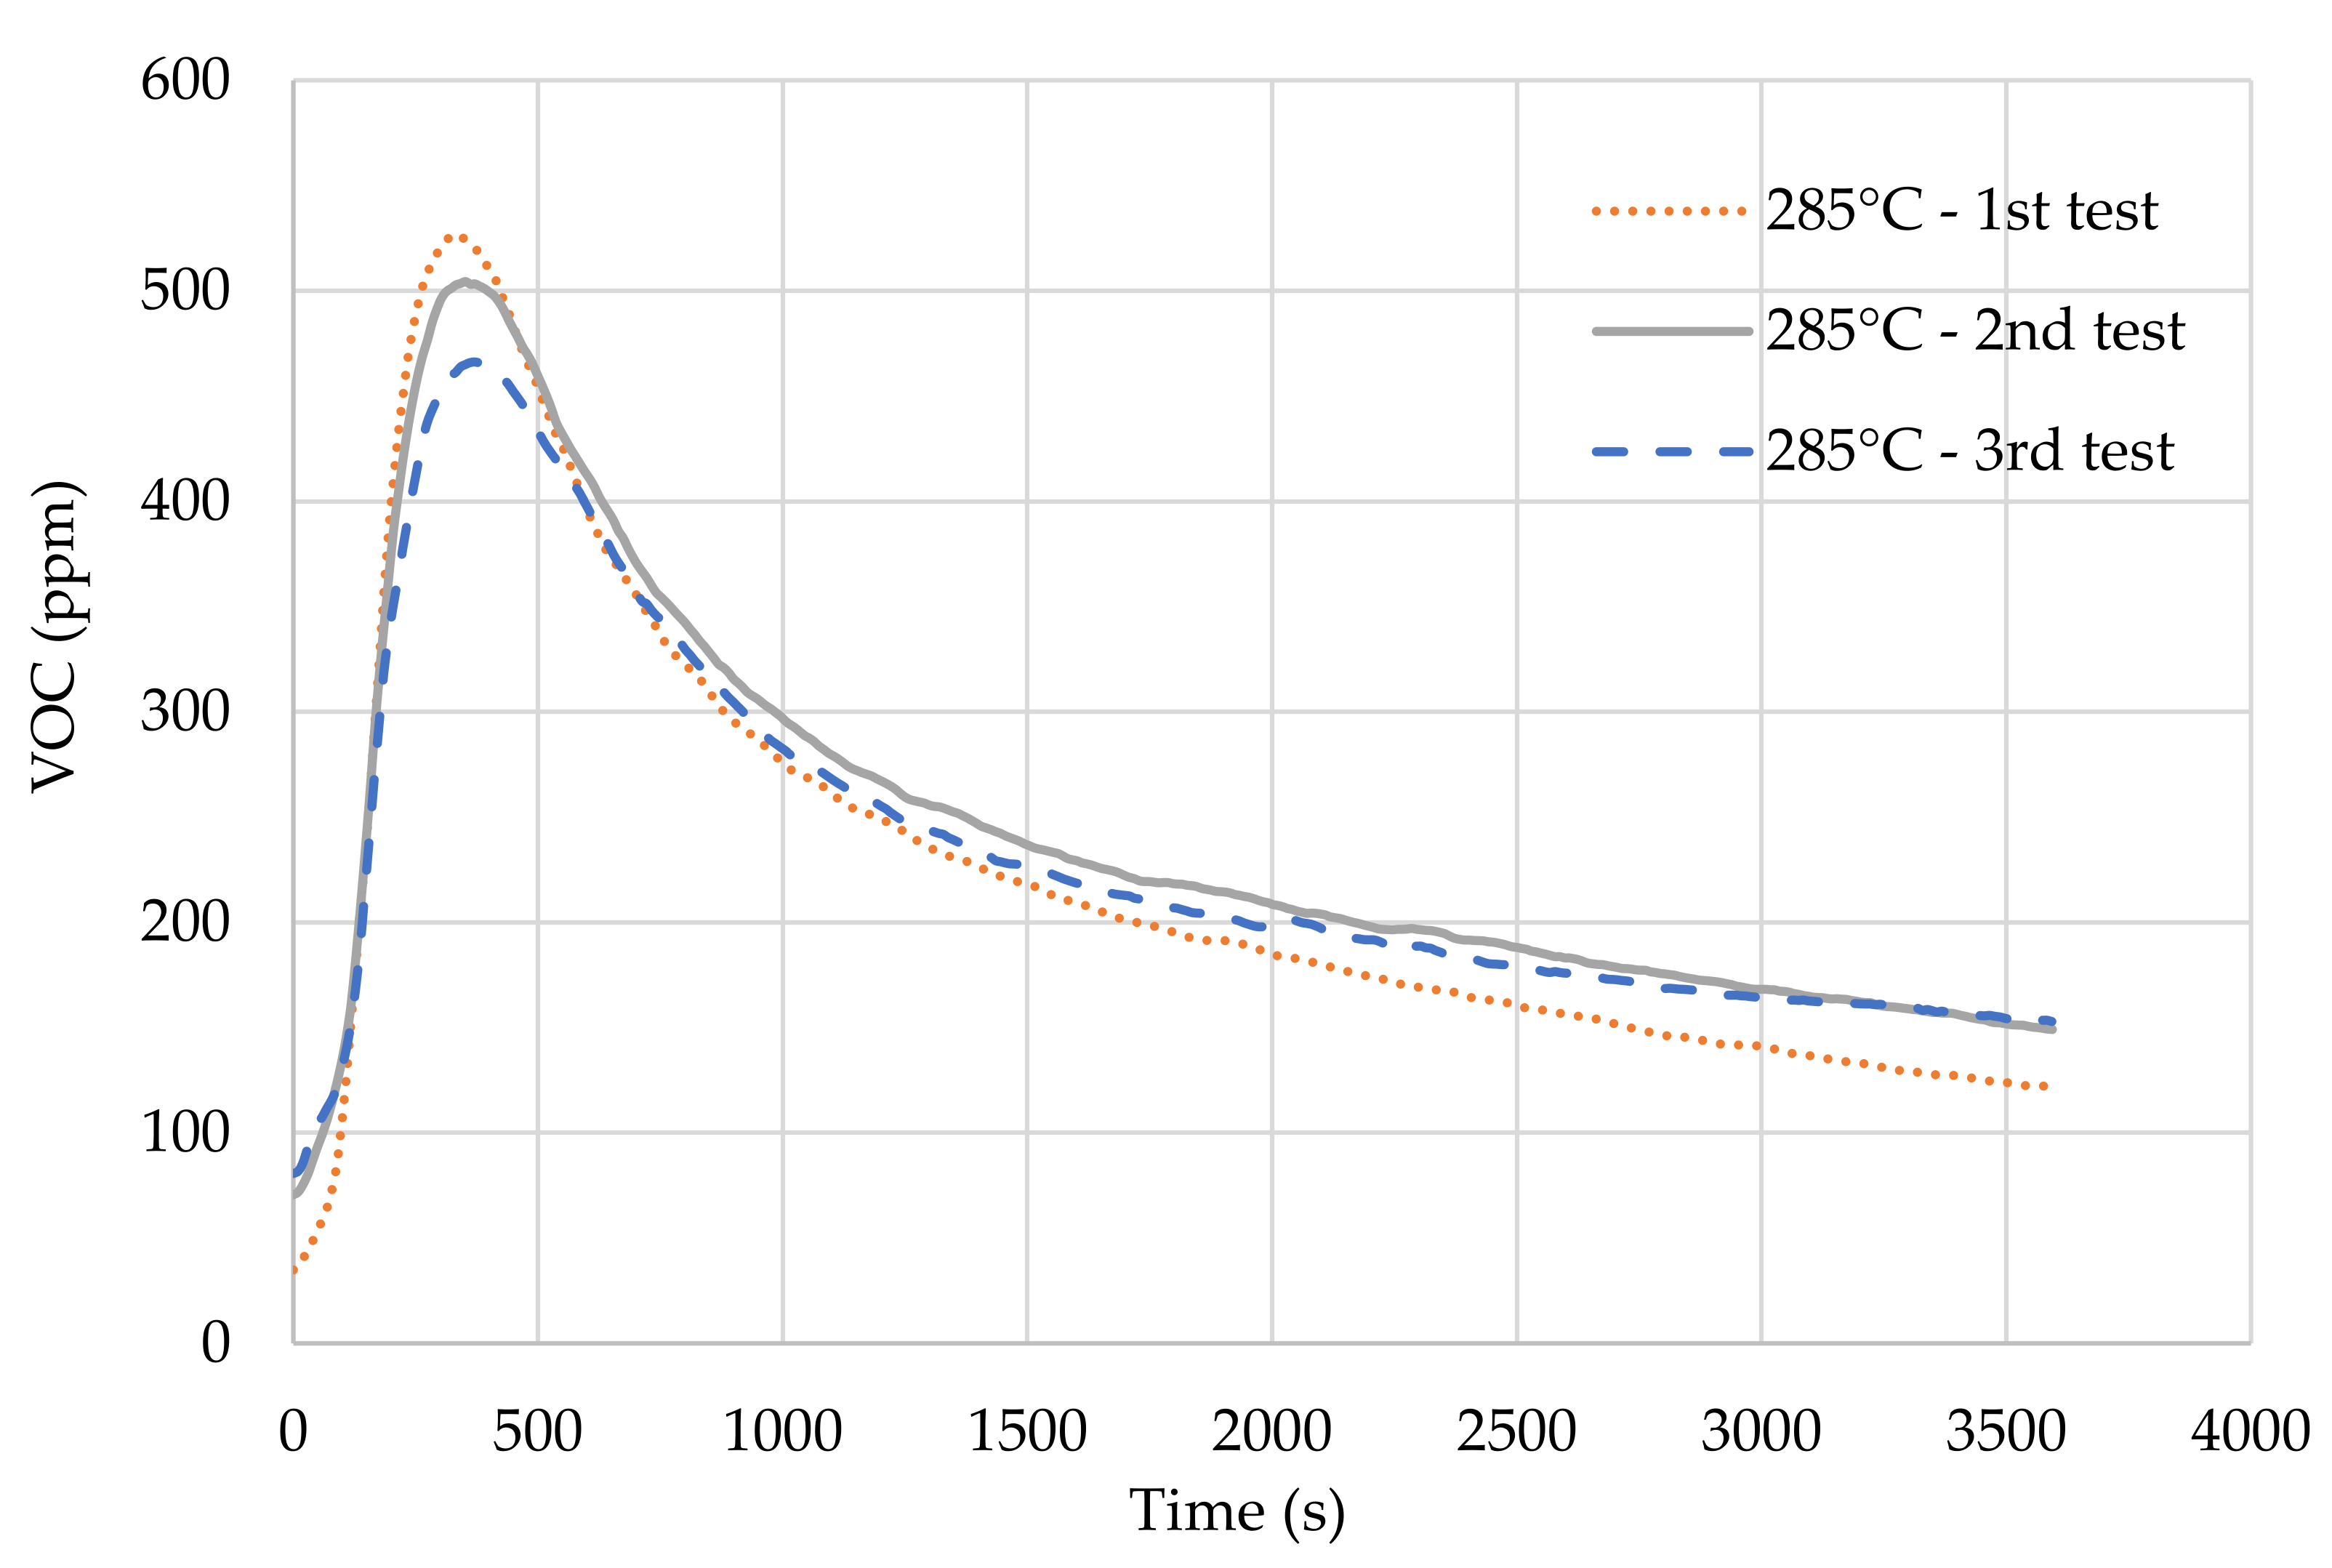
The next stage of the research was to determine the emission of the total volatile organic compounds from the process. The analysis conducted provided data on the course of emission of the total VOC over time, thanks to which the pollutant emission index from the process was calculated. Figure 17 shows the course of emissions of the total VOC over time at 285 °C.
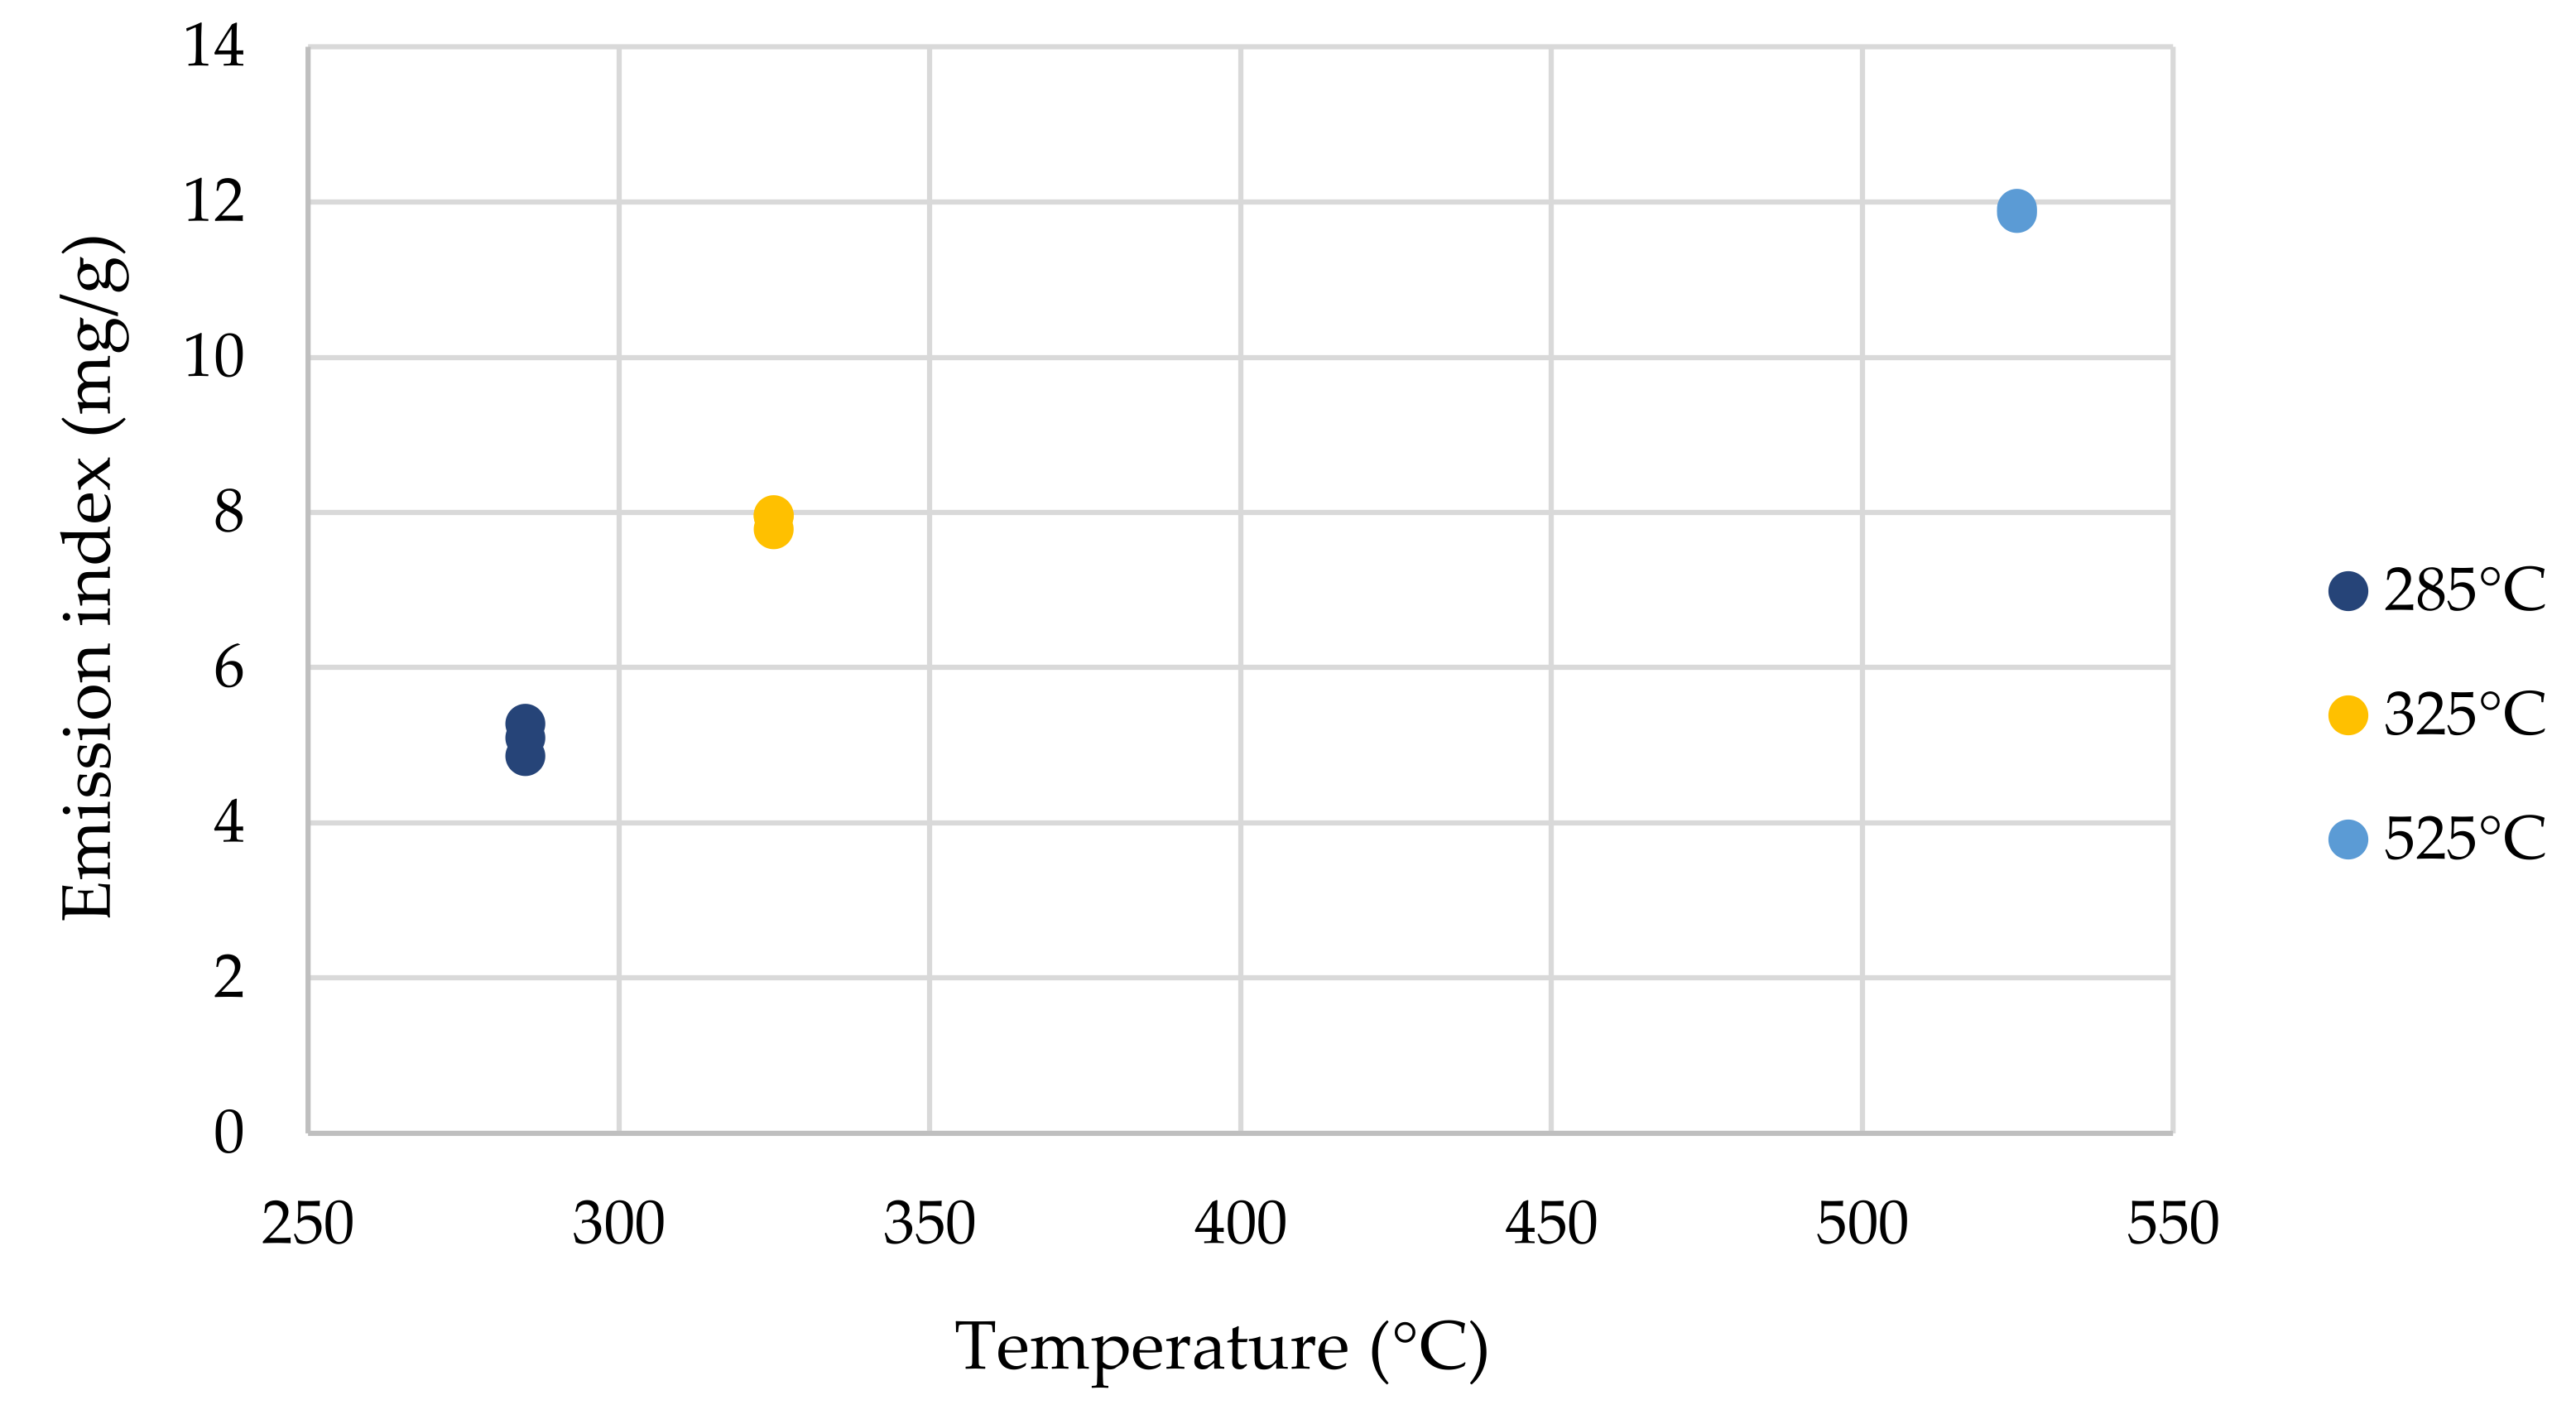
During the process at 285 °C, the maximum emission was reached in 342 s and was about 525 ppm. At the temperature of 325 °C, this value increased to about 1100 ppm, and at the temperature of 525 °C to 8200 ppm. Based on these results, the emission factor was calculated in accordance with formula (4). The results are shown in Figure 18.
The highest value of the emission index was achieved at the highest temperature of the process, and it was about 12 mg/g. For a temperature of 285 °C the value was about 5 mg/g and for 325 °C it was about 8 mg/g.

3.4. Determination of the Heat of Combustion Value of the Obtained Torrefaction Products

The combustion heat of the pine wood torrefacts obtained was measured using a Parr model 6400 calorimeter. Table 3 shows the results obtained.
The Higher Heating Value (HHV) of the raw biomass was found to be 18.1898 MJ/kg at the ambient temperature. When heat of 525 °C was applied, the calorific value of the sawdust increased by 73% compared to raw biomass. Even though there was no actual difference in calorific value between 20 and 285 °C, there was an obvious increase between 285 and 325 °C. One possible reason may be due to the high content of essential oils in the pine wood sample, which decomposes at temperatures above 300 °C.

4. Discussion

This work is based on an attempt to optimize the most effective parameters for solid biofuels production and biochar as a carrier for fertilizers in the torrefaction process. Different residence time and heating rate results show that there are no significant changes in mass loss for both pine wood and sewage sludge, unlike temperature. At the lowest temperature, the mass loss of sewage sludge was found higher from pinewood. The reason may be that lignocellulosic structure of pine wood is more thermally stable than non-lignocellulosic biomass. When the temperature was increased to 325 °C, the differences reached 20% and for 525 °C, the mass loss of PW reached 97%, whereas for SS it was only 55%. This can be explained by the fact that the ash content of sewage sludge is much higher than pine wood. Nguyen et al. (2020) also mention that non-fibrous structures such as sewage sludge have less thermal resistance, while the fibrous structure of lignocellulosic biomass degradation requires a much longer time to reach the same percentages of mass loss [57]. The volatile substance of PW was much higher than that of SS, while the ash content of SS was much higher than that of PW. Nwabunwanne et al. (2021) found that sewage sludge torrefaction temperatures should not exceed 300 °C because of the unwanted high ash amount. In addition, they have proved that a thermally pretreated sewage sludge torrefaction process leads to the achievement of more stable solid biofuel with less ash amount [62]. While pine wood has 65–72% volatile matter, sewage sludge has around 50% wt [63,64]. Huang et al. (2016) found very similar results in their work with leucaena and the sewage sludge torrefaction process [65,66]. Summarizing the above results, it can be noted that the torrefaction process is complex. The process conditions, such as temperature, residence time, and heating speed, should be selected in such a way as to obtain the lowest possible loss of mass in the shortest possible time. In both cases of pine wood and sewage sludge, the lowest weight losses were achieved during the process at a heating speed of 20 K/min, a residence time of 5 min, and a temperature of 285 °C.

The Effect of the Torrefaction Residence Time

The TGA analysis of pine wood and sewage sludges revealed that torrefaction process temperatures over 320 °C resulted in lower mass yields and energy. Effects of the torrefaction process residence time were investigated for temperatures under 525 °C. In Figure 6, Figure 7 and Figure 8 we can see correlation between the effects of the woody biomass and sewage sludge torrefaction residential time on the physico-chemical characteristics of pine wood and sewage sludge torrefaction. It can be observed that the effect of torrefaction residence time on volatile matter and ash content was not as significant as the influence of biomass torrefaction process temperature. In Figure 6, Figure 7 and Figure 8 we can observe that when the residence time of torrefaction increases, the mass yield decreases. Above observations can be described by the effect of reduction in the water and volatile content of the woody biomass and sewage sludges. In addition, at the beginning there was a significant mass loss of the sewage sludge torrefaction process, while the change in mass yield was not as significant with a longer torrefaction residence time. The results can be explained by the fact that more reactive components decompose at the beginning of the torrefaction. It was also observed that the mass yield decreases with the torrefaction residence time. It can be concluded from Figure 8 that the mass loss increases with a longer torrefaction time. Nevertheless, in all previous investigations, the pine wood and sewage sludges torrefaction residential time has been presented to be less meaningful than the temperature.

5. Conclusions

This work was focused on two different biomass torrefaction processes. The first one (which is the most common in Polish forests) concerns pine wood from the lodzkie voivodship forests and the second sewage sludge from the Group Sewage Treatment Plant of the Łódź Urban Agglomeration. In this article, the authors mainly investigated the impact on the biomass of torrefaction temperature, mass loss, moisture content, HHV, and VOC emission during the torrefaction process. In addition, the authors quantified various parameters of the pine wood torrefaction process and sewage sludge to be used as carbonized solid biofuels and as an additive for fertilizers. A kinetic analysis was conducted, and the proper temperature for the carbonization process and residence time for specific mass loss ratios were determined.
As a result of this research, it was found that from a mass loss ratio and economical perspective, the most optimal torrefaction temperatures for pine wood and sewage sludge to produce biochar, which can be a carrier for biofertilizers, lie between 325 and 350 °C. However, the temperatures can be changeable in practice based on the type of raw material, amount of heating ratio, and also the chemical structure of the untreated material. In a further investigation, torgas can be utilized as a heat source for the carbonization process due to the high quantities of volatile organic compounds in the tracks. The variability of the activation energy value depending on the degree of conversion probably indicates that the reactions of pine wood pyrolysis are not homogeneous but rather consist of many overlapping and parallel thermo-chemical processes. This can also have an influence on the bio-economy since an appropriate mass loss ratio to energy loss for diverse woody biomass during the carbonization process has a substantial impact on the pricing of torrefied solid biofuel and biochar as fertilizer price carriers (the use of under or over heat throughout the process has a major influence on the final product pricing).
In the near future, further work will be concentrated on the pine wood and sewage sludge torrefaction process. This first phase of research work shows which temperatures for pine wood and for sewage sludges are the best to obtain mass loss in a range of 50% compared to untreated substrates and kinetics which were necessary for apparatus design (biomass counter-flow torrefaction reactor). From our previous studies and from economical calculations (costs of bicarbon production at industrial scale for C additives production for fertilizers) we know that 50% is the most reasonable mass loss to produce still relatively cheap bio-product which can be use by companies which are producing biofertilizers. From biomass torrefaction temperature limitations and again from our previous collaboration with agro-engineers, and from their conducted toxicity test we know that biomass should be thermally treated in the temperature range close to 320–350 °C to neutralize toxic substances.
The major task will comprise the design and construction of an installation for a continuous drying and superheated steam torrefaction process using kinetics data from this article. Which includes the design of a biomass dryer run on hot air as well as a torrefaction reactor run on dry steam (superheated steam). As the novelty of this work in the winter of 2021, a new installation will be built including a counter-flow torrefaction reactor with superheated steam torrefaction, and experimental research will be carried out on the conditions of the torrefaction process of woody and agricultural biomass mix with digested solid residues DGS to produce carbonized solid biofuels such as biocarbon as a carrier for organic fertilizers, with data from this study [67,68,69].

Author Contributions

Conceptualization, P.P., S.S. and A.O.; methodology, P.P., Ł.A., W.L., J.C.; software S.S., P.P., Ł.A.; validation, M.M.-G., G.W., W.L., J.C., Z.R.-D. formal analysis, S.S., Ł.A. and P.P.; investigation, Z.R.-D., J.C., M.D., A.O., P.P., W.L., J.C.; resources, P.P., A.O., Ł.A., W.L., J.C.; data curation, S.S., P.P., H.Ü., W.L., M.M.-G., J.C.; writing—original draft preparation, S.S., G.W.; writing—review and editing, S.S., P.P., H.Ü.; visualization, S.S., P.P., W.L., J.C.; supervision, S.S.; project administration, S.S., T.P.O.; funding acquisition, S.S., P.P. All authors have read and agreed to the published version of the manuscript.

Funding

The studies presented were financed by the National Center of Research and Development (NCBR) Poland under the research program LIDER. The research and development project is entitled by the acronym BIOCARBON, with the title “Modern technology biomass torrefaction process to produce fuel mixtures, biocoal as additives for fertilizers, activated carbon for energy sector, agriculture, civil engineering and chemical industry”, “LIDER IX” NCBR 2014–2020 (grant no. LIDER/43/0155/L-9/17/NCBR/2018). The research was also supported by the National Centre of Science from Krakow Research Nr: 2011/03/N/ST8/02776 and grant no.2018/31/B/HS4/00485.

Institutional Review Board Statement

Not applicable.

Informed Consent Statement

Not applicable.

Data Availability Statement

The data presented in this study are available on request from the corresponding author.

Conflicts of Interest

The authors declare no conflict of interest.

Sample Availability

Samples of the compounds of dry and torrefied pine wood and sewage sludges are available from the authors.

Appendix A

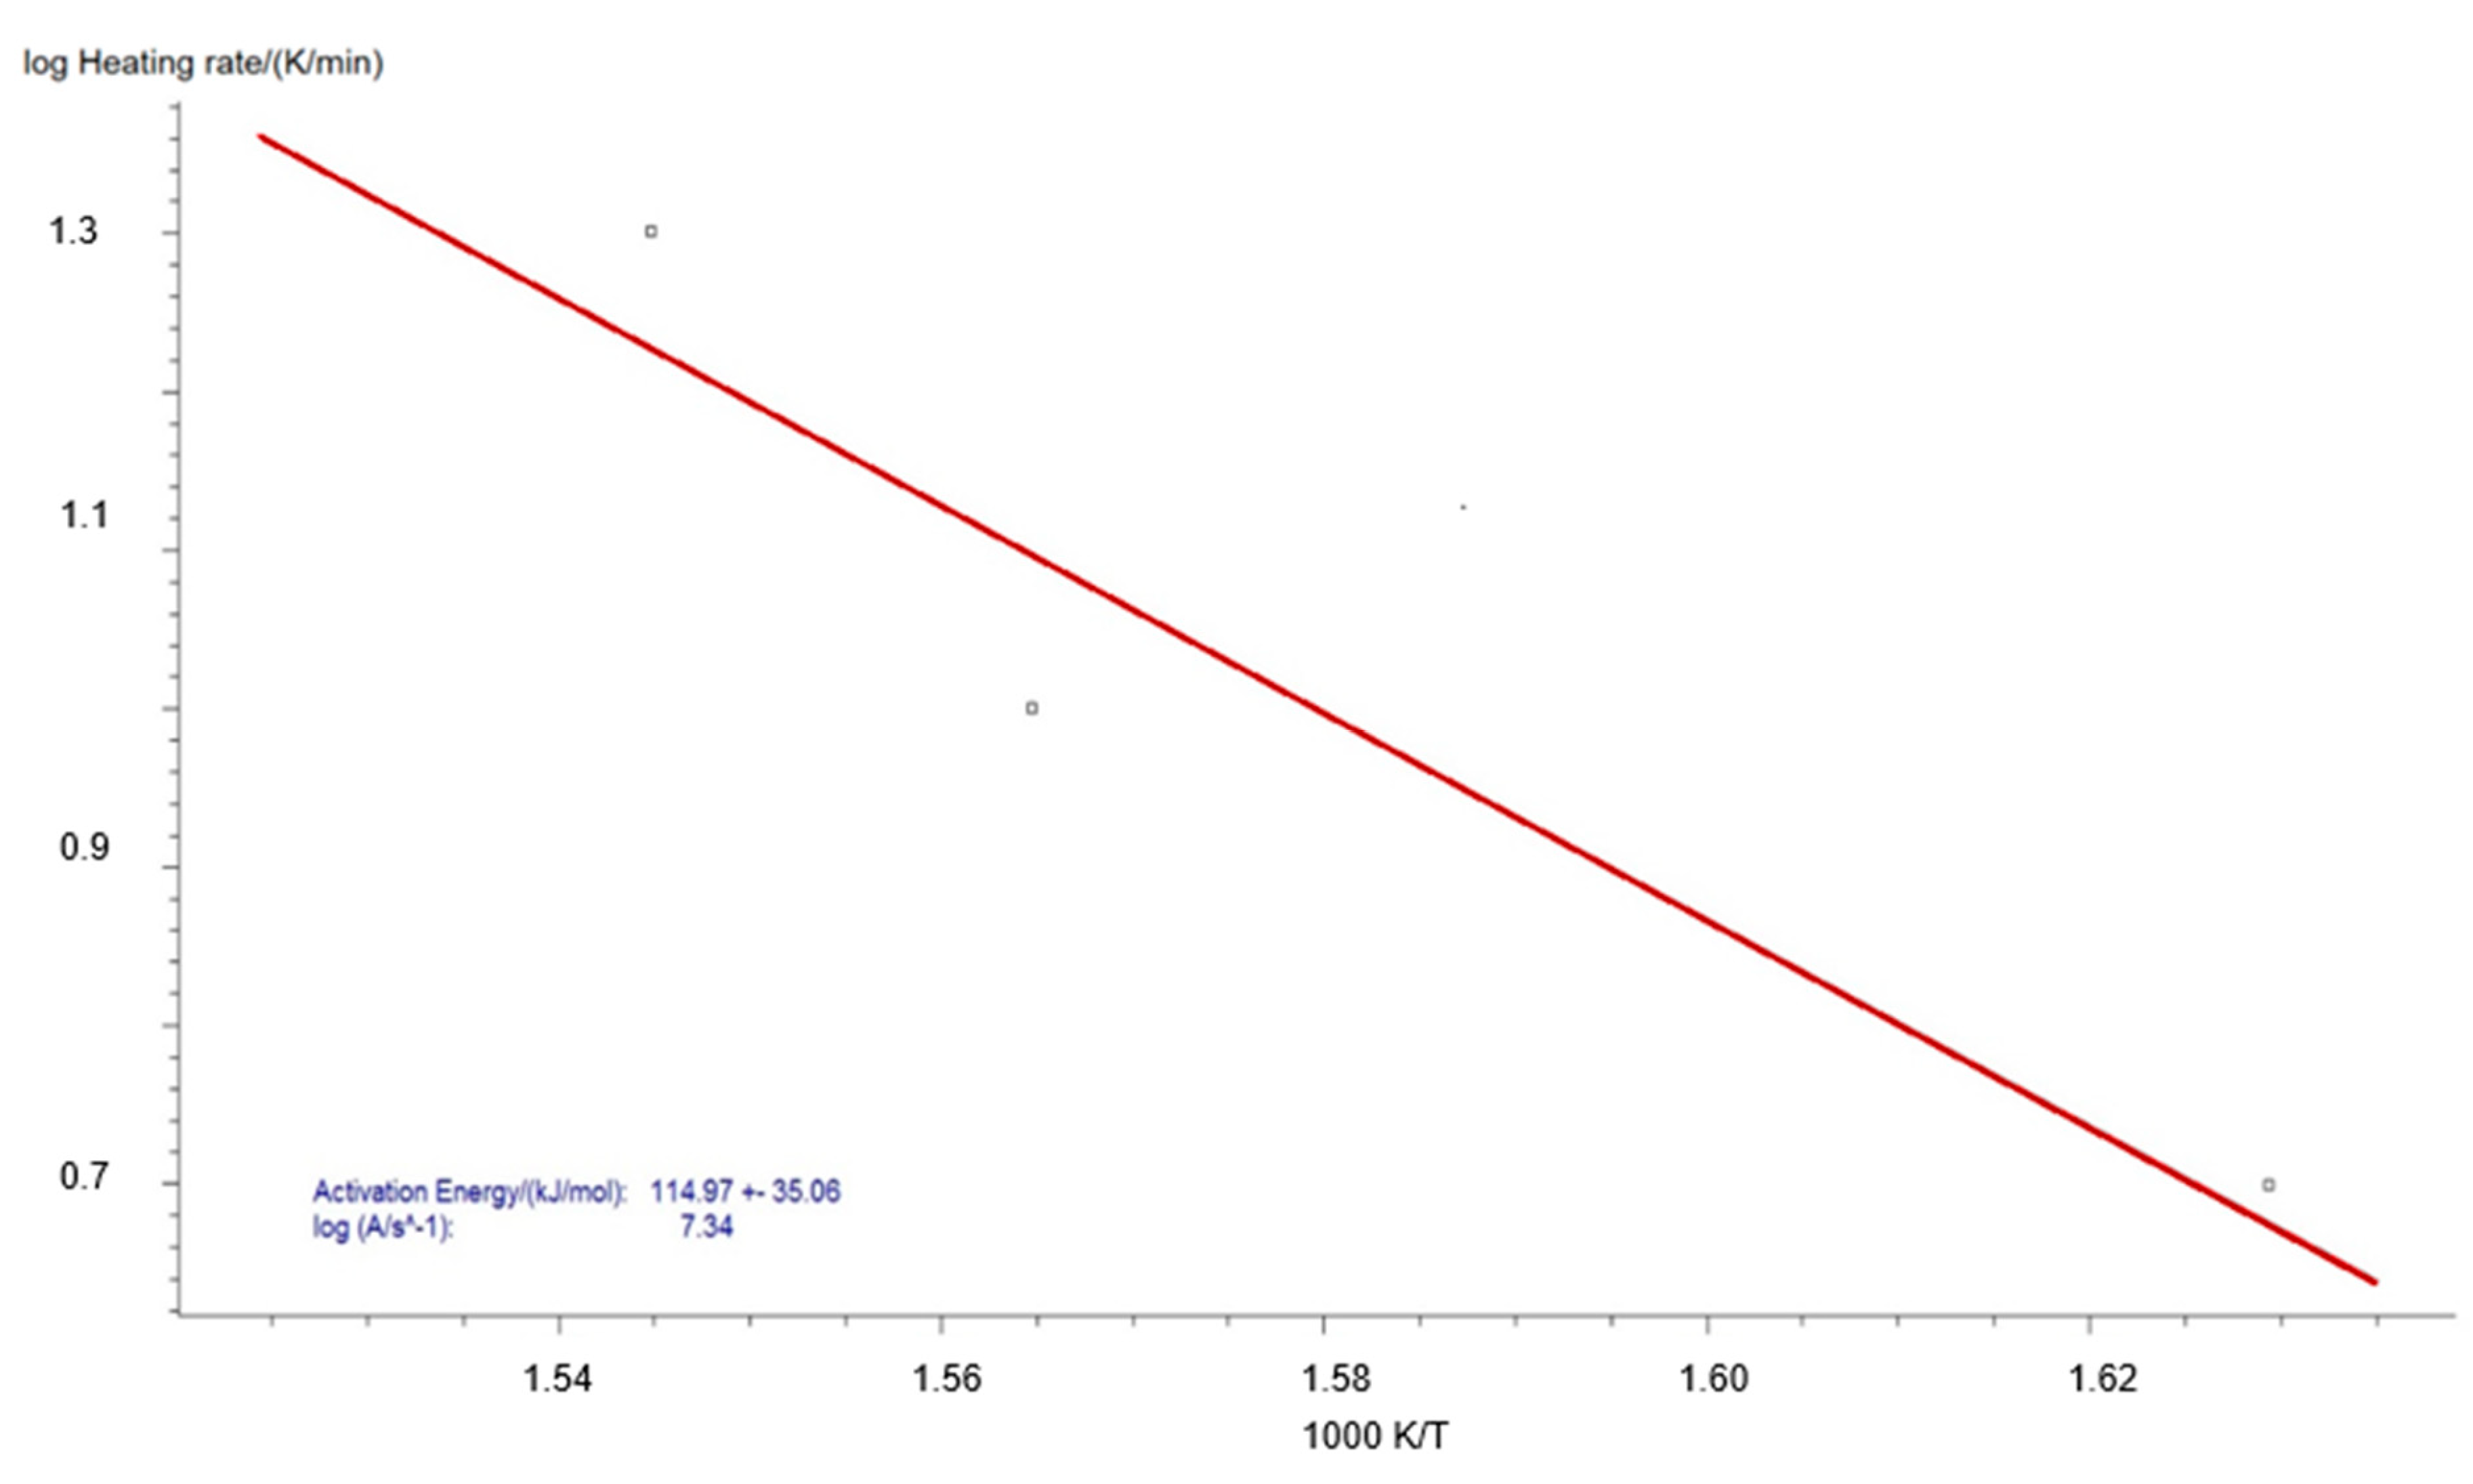
Figure A1 and Figure A2 present data analysis for the Kissinger method (ASTM E698).
Figure A1. Kissinger analysis (ASTM E698) for pine wood.
Energies 14 08176 g0a1
Figure A2. Kissinger analysis (ASTM E698) for sewage sludge.
Energies 14 08176 g0a2
Thanks to the use of the above-mentioned method, the activation energy value of the pine wood pyrolysis process was obtained, which was 115 kJ/mol. However, attention should be paid to the very high relative error of this method, which is about 35 kJ/mol, about 30% of the activation energy value. The obtained value of the activation energy of the sewage sludge torrefaction process was approximately 169 kJ/mol with an error of 4.04 kJ/mol. Figure A3 and A4 represents Friedman method for both biomass pine wood and sewage sludge for 3 different heating rate. Red line represents 20 K/min, blue line is 10 K/min and green line is 5 K/min.
Figure A3. Plot of logarithm dx/dt as a function of reciprocal of temperature by Friedman method for pine wood. Red line represents 20 K/min, blue line is 10 K/min and green line is 5 K/min.
Energies 14 08176 g0a3
Figure A4. Plot of logarithm dx/dt as a function of reciprocal of temperature by Friedman method for sewage sludge. Red line represents 20 K/min, blue line is 10 K/min and green line is 5 K/min.
Energies 14 08176 g0a4
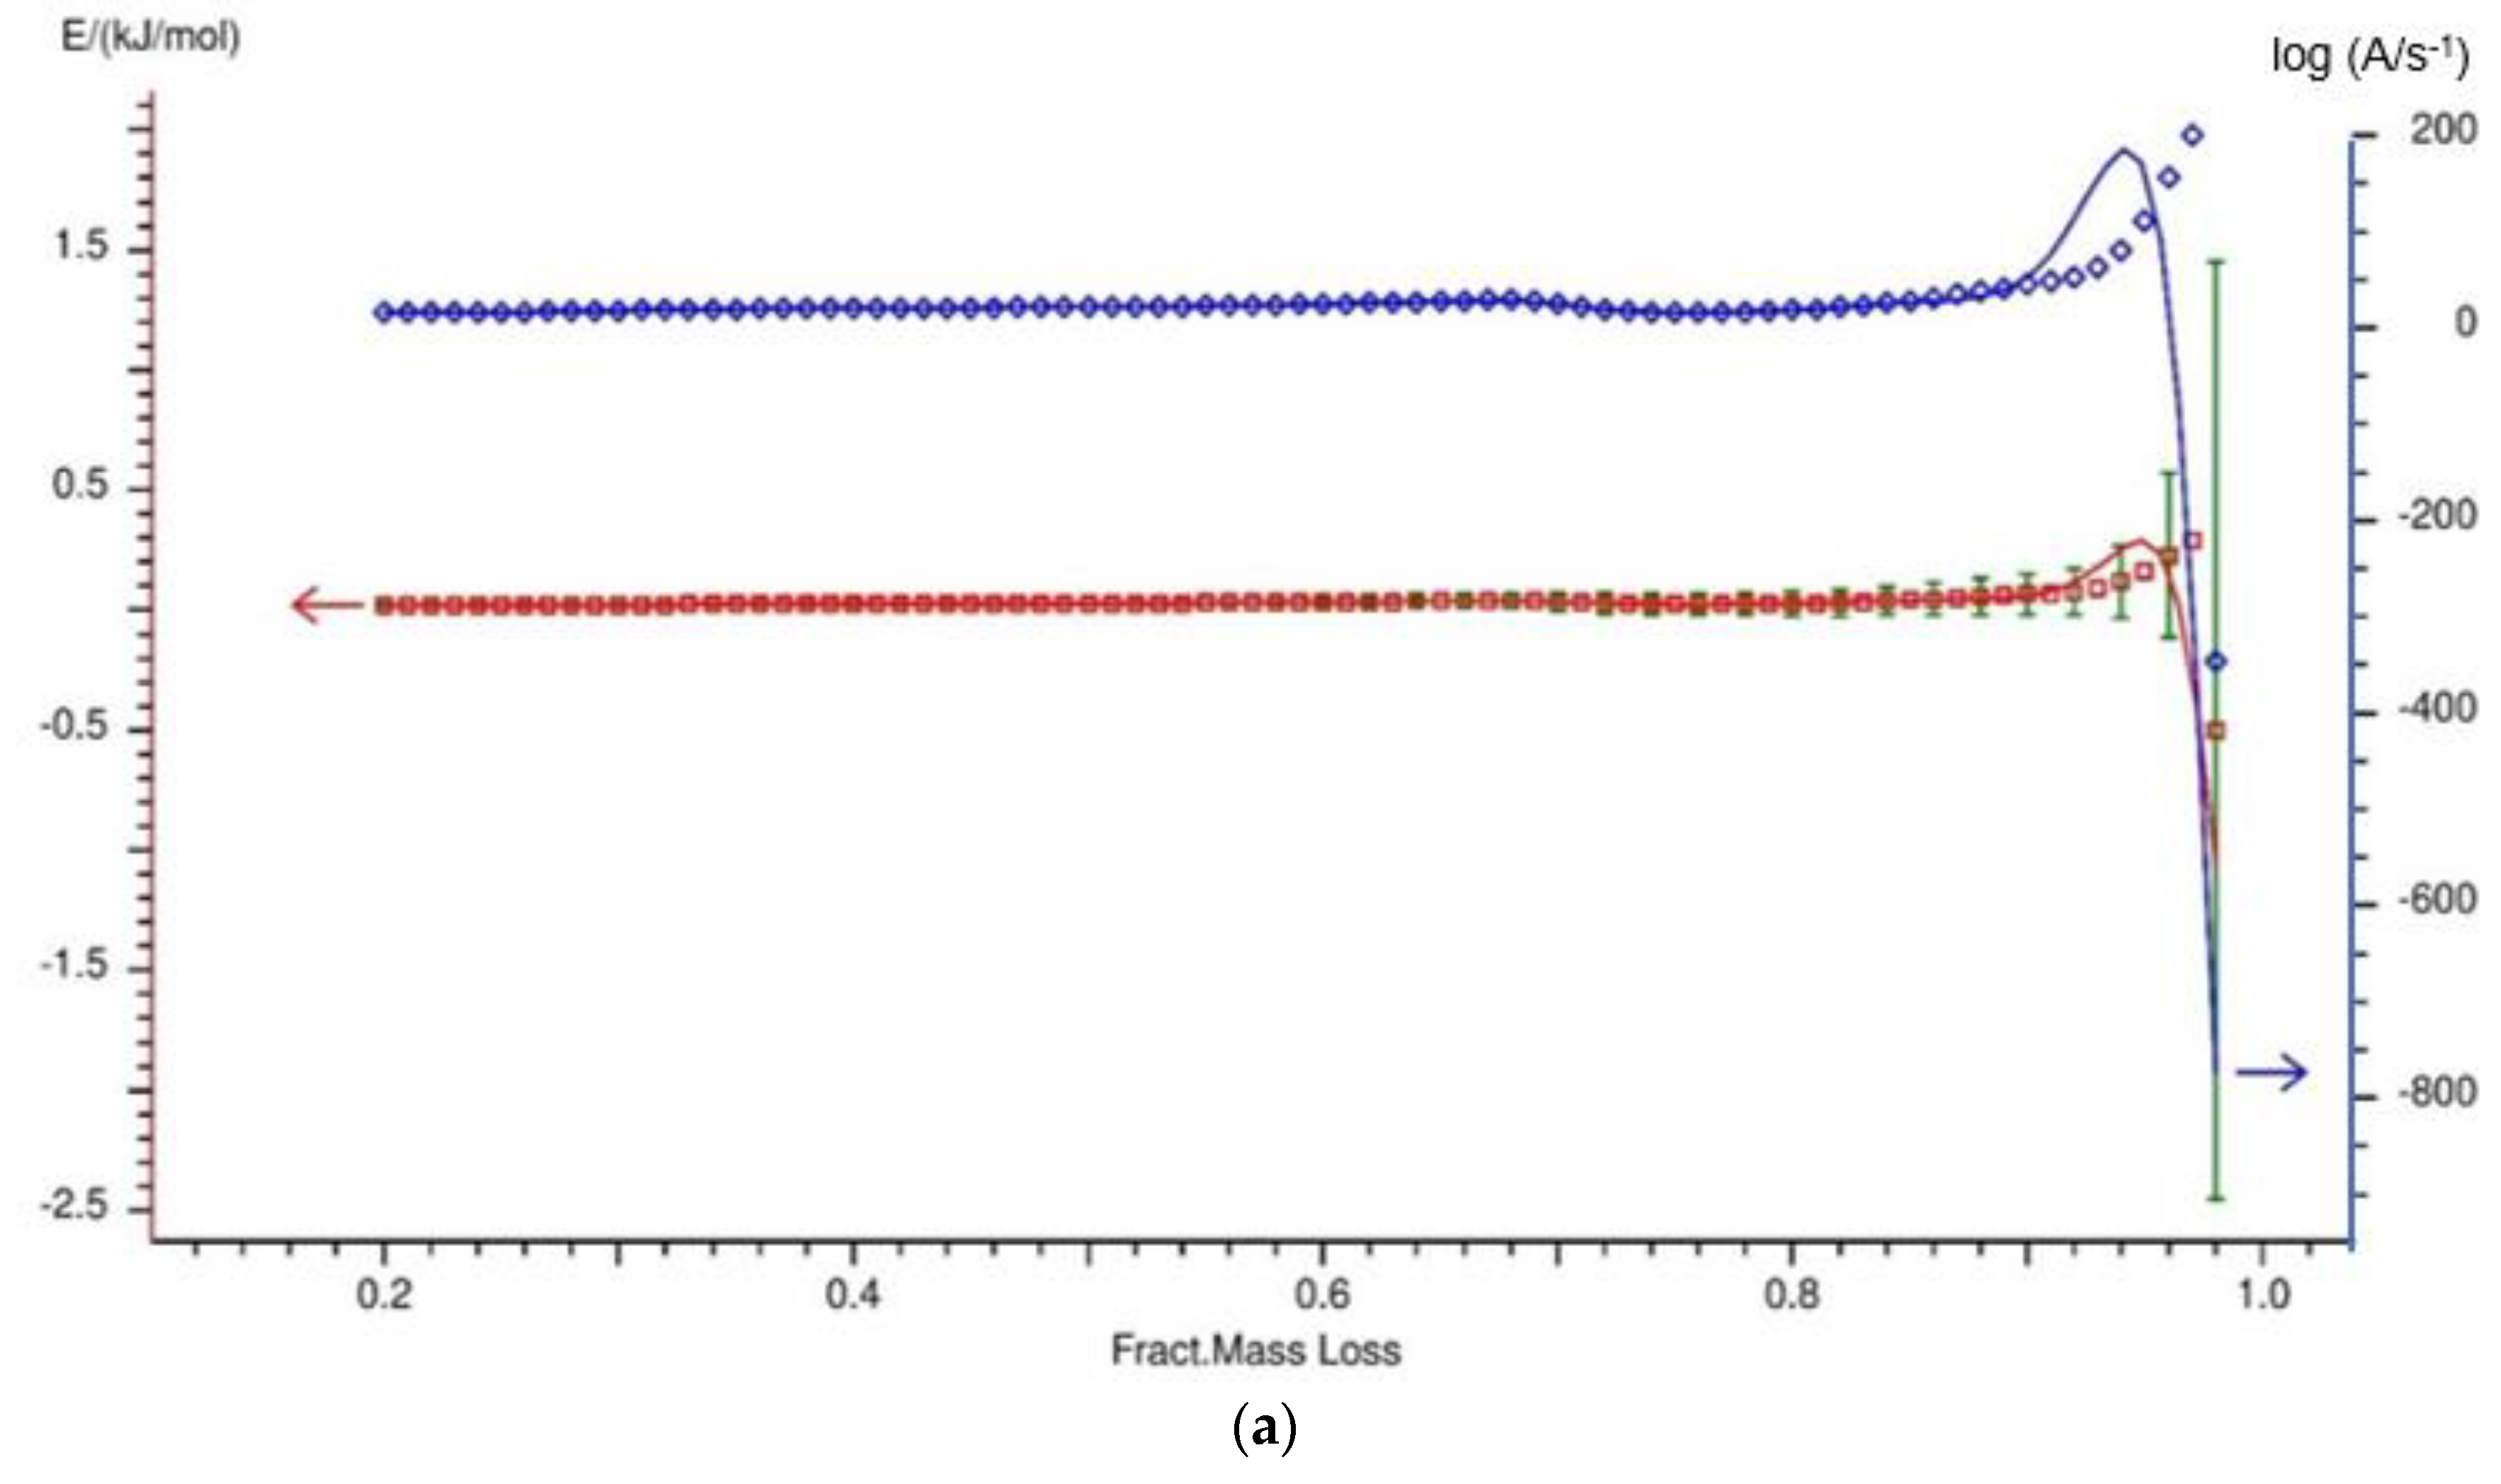
Thanks to the Friedman method, it is also possible to present the values of the activation energy and the pre-exponential coefficient as a function of the degree of conversion, as shown in Figure A5 and Figure A6.
Figure A5. Activation energy (Red color) and pre-exponential coefficient (Blue color) as a function of the degree of reaction determined by the Friedman method for pine wood. Green color represents the statistical error.
Energies 14 08176 g0a5
Figure A6. Activation energy (Red color) and pre-exponential coefficient (Blue color) as a function of the conversion degree: (a) X = 0.20–0.98, (b) X = 0.20–0.90 determined by the Friedman method for sewage sludge. Green color represents the statistical error.
Energies 14 08176 g0a6aEnergies 14 08176 g0a6b
On the basis of Figure A5 and Figure A6, it can be concluded that the activation energy for the pine wood and sewage sludge samples varies depending on the degree of conversion. The variability of the activation energy value as a function of the degree of reaction may indicate the fact that the pyrolysis reaction of pine wood is not homogeneous and consists of many overlapping and parallel processes of thermal decomposition of individual biomass components. The exact values of the determined activation energy are presented in Table A1 and Table A2.
Table A1. Activation energy and pre-exponential coefficient as a function of the degree of reaction determined by the Friedman method for pine wood.
Fract. Mass LossActivation Energy (kJ/mol)Log (A/s−1)
0.020113.71 ± 57.167.79
0.050134.47 ± 43.269.56
0.100154.97 ± 36.9711.25
0.200169.96 ± 27.8612.33
0.300178.59 ± 31.7012.89
0.400179.87 ± 39.0012.82
0.500150.14 ± 42.3210.22
0.600154.05 ± 40.7410.57
0.700224.25 ± 15.2316.32
0.800799.80 ± 798.4562.31
Table A2. Activation energy and pre-exponential coefficient as a function of the degree of reaction determined by the Friedman method for sewage sludge.
Fract. Mass LossActivation Energy (kJ/mol)Log (A/s−1)
0.020378.99 ± 216.0937.70
0.050208.04 ± 83.1718.76
0.100188.15 ± 60.1416.18
0.200195.43 ± 53.6616.23
0.300221.23 ± 53.1018.07
0.400254.79 ± 42.4620.40
0.500277.71 ± 4.0521.62
0.600325.90 ± 97.5724.87
0.700349.52 ± 407.0225.55
0.800272.76 ± 507.6718.33
An analysis of Figure A6 and the data in Table A2 shows that the variability of the determined kinetic parameters (E and A) depending on the degree of reaction is noticeable. Very high variability and accompanying errors are observed when approaching the boundary conditions, that is for low and high values of the conversion degree (X < 0.1 and X > 0.9). These fluctuations result in part from the methodology of determining kinetic parameters. On the other hand, they are a consequence of the complex course of the torrefaction process for material such as sewage sludge.

References

  1. Statistics Poland. Statistical Yearbook of Forestry; Statistics Poland: Warsaw, Poland, 2019; ISSN 2657-3199. [Google Scholar]
  2. Matyjaszczyk, E.; Skrzecz, I. Hou European Union accession and implementation of obligatory integrated pest management influenced forest protection against diseases and weeds: A case study from Poland. Crop Prot. 2020, 127, 104986. [Google Scholar] [CrossRef]
  3. Laurin, G.V.; Puletti, N.; Grotti, M.; Stereńczak, K.; Modzelewska, A.; Lisiewicz, M.; Sadkowski, R.; Kuberski, Ł.; Chirici, G.; Papale, D. Species dominance and above grouns biomass in the Białowieża Forest, Poland, describes by airborne hyperspectral and lider data. Int. J. Appl. Earth Obs. 2020, 92, 102178. [Google Scholar] [CrossRef]
  4. Węgrzyn, M.H.; Kołodziejczak, J.; Fałkowska, P.; Wężyk, P.; Zięba-Kulawik, K.; Szostak, M.; Turowska, A.; Grzesiak, B.; Wietrzyk-Pełka, P. Influence of the enviromental factors on the species composition of lichen Scots pine forests as a guide to maintain the community (Bory Tucholskie National Park, Poland). Glob. Ecol. Conserv. 2020, 22, e017017. [Google Scholar] [CrossRef]
  5. Zribi, M.; Lajili, M.; Escudero-Sanz, F.J. Hydrogen enriched syngas production via gasification of biofuels pellets/powders blended from olive mill solid wastes and pine sawdust under different water steam/nitrogen atmospheres. Int. J. Hydrogen Energy 2019, 44, 11280–11288. [Google Scholar] [CrossRef] [Green Version]
  6. Dębowski, M.; Bukowski, P.; Kobel, P.; Bieniek, J.; Romański, L.; Knutel, B. Comparison of Energy Consumption of Cereal Grain Dryer Powered by LPG and Hard Coal in Polish Conditions. Energies 2021, 14, 4340. [Google Scholar] [CrossRef]
  7. Barskov, S.; Zappi, M.; Buchireddy, P.; Dufreche, S.; Guillory, J.; Gang, D.; Hernandez, R.; Bajpai, R.; Baudier, J.; Cooper, R.; et al. Torrefaction of biomass: A review of production methods for biocoal from cultured and waste lignocellulosic feedstocks. Renev. Energy 2019, 142, 624–642. [Google Scholar] [CrossRef]
  8. Luo, H.; Niedźwiecki, Ł.; Arora, A.; Mościcki, K.; Pawlak-Kruczek, H.; Krochmalny, K.; Baranowski, M.; Tiwari, M.; Sharma, A.; Sharma, T.; et al. Influence of Torrefaction and Pelletizing of Sawdust on the Design Parameters of a Fixed Bed Gasifier. Energies 2020, 13, 3018. [Google Scholar] [CrossRef]
  9. Kryszak, D.; Bartoszewicz, A.; Szufa, S.; Piersa, P.; Obraniak, A.; Olejnik, T.P. Modeling of Transport of Loose Products with the Use of the Non-Grid Method of Discrete Elements (DEM). Processes 2020, 8, 1489. [Google Scholar] [CrossRef]
  10. Soponpongpipat, N.; Nanetoe, S.; Comsawang, P. Thermal Degradation of Cassavaf Rhizome in Thermosyphon-Fixed Bed Torrefaction Reactor. Processes 2020, 8, 267. [Google Scholar] [CrossRef] [Green Version]
  11. Krochmalny, K.; Niedźwiecki, Ł.; Pelińska-Olko, E.; Wnukowski, M.; Czajka, K.; Tkaczuk-Serafin, M.; Pawlak-Kruczek, H. Determination of the marker for automation of torrefaction and slow pyrolysis processes—A case study of spherical wood particles. Renew. Energy 2020, 161, 350–360. [Google Scholar] [CrossRef]
  12. Dzikuć, M.; Kuryło, P.; Dudziak, R.; Szufa, S.; Dzikuć, M.; Godzisz, K. Selected Aspects of Combustion Optimization of Coal in Power Plants. Energies 2020, 13, 2208. [Google Scholar] [CrossRef]
  13. Szufa, S.; Adrian, Ł.; Piersa, P.; Romanowska-Duda, Z.; Grzesik, M.; Cebula, A.; Kowalczyk, S. Experimental studies on energy crops torrefaction process using batch reactor to estimate torrefaction temperature and residence time. In Renewable Energy Sources: Engineering, Technology, Innovation, ICORES 2017; Mudryk, K., Werle, S., Eds.; Springer: Berlin/Heidelberg, Germany, 2018; pp. 365–373. [Google Scholar] [CrossRef]
  14. Szufa, S.; Adrian, Ł.; Piersa, P.; Romanowska-Duda, Z.; Ratajczyk-Szufa, J. Torrefaction process of millet and cane using batch reactor, In Renewable Energy Sources: Engineering, Technology, Innovation; Springer Proceedings in Energy; Wróbel, M., Jewiarz, M., Szlęk, A., Eds.; Springer: Cham, Switzerland, 2020; pp. 371–379. ISBN 978-3-030-13887-5. [Google Scholar] [CrossRef]
  15. Jewiarz, M.; Wróbel, M.; Mudryk, K.; Szufa, S. Impact of the Drying Temperature and Grinding Technique on Biomass Grindability. Energies 2020, 13, 3392. [Google Scholar] [CrossRef]
  16. Friedl, A.; Padouvas, E.; Rotter, H.; Varmuza, K. Prediction of heating values of biomass fuel from elemental composition. Anal. Chim. Acta 2005, 544, 191–198. [Google Scholar] [CrossRef]
  17. Wang, L.; Barta-Rajnai, E.; Skreiberg, Ø.; Khalil, R.; Czégény, Z.; Jakab, E.; Barta, Z.; Grønli, M. Effect of torrefaction on physiochemical characteristics and grindability of stem wood, stump and bark. Appl. Energy 2018, 227, 137–148. [Google Scholar] [CrossRef]
  18. Chen, W.H.; Wang, C.W.; Ong, H.C.; Show, P.L.; Hsieh, T.H. Torrefaction, pyrolysis and two stage thermodegradation of hemicellulose, cellulose and lignin. Fuel 2019, 258, 116168. [Google Scholar] [CrossRef]
  19. Szufa, S.; Dzikuć, M.; Adrian, Ł.; Piersa, P.; Romanowska-Duda, Z.; Marczak, M.; Błaszczuk, A.; Piwowar, A.; Lewandowska, W. Torrefaction of oat straw to use as solid biofuel, an additive to organic fertilizers for agriculture purposes and activated carbon—TGA analysis, kinetics. E3S Web Conf. 2020, 154, 02004. [Google Scholar] [CrossRef] [Green Version]
  20. Peng, J.H.; Bi, X.T.; Sokhansanj, S.; Lim, C.J. Torrefaction and densification of different species of softwood residues. Fuel 2013, 111, 411–421. [Google Scholar] [CrossRef]
  21. Adamski, R.; Siuta, D.; Kukfisz, B.; Frydrysiak, M.; Prochoń, M. Integration of Safety Aspects in Modeling of Superheated Steam Flash Drying of Tobacco. Energies 2021, 14, 5927. [Google Scholar] [CrossRef]
  22. Junga, R.; Pospolita, J.; Niemiec, P. Combustion and grindability characteristics of palm kernel shells torrefied in a pilot-scale installation. Renew. Energy 2020, 147 Pt 1, 1239–1250. [Google Scholar] [CrossRef]
  23. Wen, J.-L.; Sun, S.-L.; Yuan, T.-Q.; Xu, F.; Sun, R.-C. Understanding the chemical and structural transformations of lignin macromolecule during torrefaction. Appl. Energy 2014, 121, 1–9. [Google Scholar] [CrossRef]
  24. Chen, W.-H.; Lu, K.-M.; Tsai, C.-M. An experimental analysis on property and structure variations of agricultural wastes undergoing torrefaction. Appl. Energy 2012, 100, 318–325. [Google Scholar] [CrossRef]
  25. Dacres, O.D.; Tong, S.; Li, X.; Zhu, X.; Edries, E.M.A.; Liu, H.; Luo, G.; Worasuwannarak, N.; Kerdsuwan, S.; Fungtammasan, B.; et al. Pyrolysis kinetics of biomasses pretreated by gas-pressurized torrefaction. Energy Convers. Manag. 2019, 182, 117–125. [Google Scholar] [CrossRef]
  26. Peng, J.; Wang, J.; Bi, X.T.; Lin, C.J.; Sokhansanj, S.; Peng, H.; Jia, D. Effects of thermal treatment on energy density and hardness of torrefied wood pellets. Fuel Process. Technol. 2015, 129, 168–173. [Google Scholar] [CrossRef]
  27. Szufa, S.; Piersa, P.; Adrian, Ł.; Sielski, J.; Grzesik, M.; Romanowska-Duda, Z.; Piotrowski, K.; Lewandowska, W. Acquisition of Torrefied Biomass from Jerusalem Artichoke Grown in a Closed Circular System Using Biogas Plant Waste. Molecules 2020, 25, 3862. [Google Scholar] [CrossRef] [PubMed]
  28. Tong, S.; Xiao, L.; Li, X.; Zhu, X.; Liu, H.; Luo, G.; Worasuwannarak, N.; Kerdsuwan, S.; Fungtammasan, B.; Yao, H. A gas-pressurized torrefaction method for biomass wastes. Energy Convers. Manag. 2018, 173, 29–36. [Google Scholar] [CrossRef]
  29. Bourgonje, K.; Veringa, H.J.; Smeulders, D.M.J.; van Oijen, J.A. Oxygen ad a Torrefaction Control Parameter. Energy Environ. Res. 2018, 8, 18–31. [Google Scholar] [CrossRef] [Green Version]
  30. Romanowska-Duda, Z.; Piotrowski, K.; Wolska, B.; Dębowski, M.; Zieliński, M.; Dziugan, P.; Szufa, S. Stimulating effect of ash from Sorghum on the growth of Lemnaceae—A new source of energy biomass. In Renewable Energy Sources: Engineering, Technology, Innovation; Springer Proceedings in Energy; Wróbel, M., Jewiarz, M., Szlęk, A., Eds.; Springer: Cham, Switzerland, 2020; pp. 341–349. ISBN 978-3-030-13887-5. [Google Scholar] [CrossRef]
  31. Szufa, S.; Wielgosiński, G.; Piersa, P.; Czerwińska, J.; Dzikuć, M.; Adrian, Ł.; Lewandowska, W.; Marczak, M. Torrefaction of Straw from Oats and Maize for Use as a Fuel and Additive to Organic Fertilizers—TGA Analysis, Kinetics as Products for Agricultural Purposes. Energies 2020, 13, 2064. [Google Scholar] [CrossRef] [Green Version]
  32. Singh, S.; Chakraborty, J.P.; Mondal, M.K. Torrefaction od woody biomass (Acacia nilotica): Investigation of fuel and flow properties to study its suitability as a good quality solid fuel. Renew. Energy 2020, 153, 711–724. [Google Scholar] [CrossRef]
  33. Wilk, M.; Magdziarz, A.; Gajek, M.; Zajemska, M.; Jayawaman, K.; Gokalp, I. Combustion and kinetic parameters estimation of torrefied pine, acacia and Miscanthus giganteus using experimental and modelling techniques. Bioresour. Technol. 2017, 243, 304–314. [Google Scholar] [CrossRef] [PubMed]
  34. Chen, D.; Li, Y.; Deng, M.; Wang, J.; Chen, M.; Yan, B.; Yuan, Q. Effect of torrefaction pretreatment and catalytic pyrolysis on the pyrolysis poly-generation of pine wood. Bioresour. Technol. 2016, 214, 615–622. [Google Scholar] [CrossRef]
  35. Leontiev, A.; Kichatow, B.; Korhunov, A.; Kiverin, A.; Zaichenko, V.; Sytchev, S.; Melnikova, K. Oxidative torrefaction of pine pellets in the quiescent layer of mineral filler. Fuel Process. Technol. 2018, 182, 113–122. [Google Scholar] [CrossRef]
  36. Liang, J.; Xu, X.; Yu, Z.; Chen, L.; Liao, Y.; Ma, X. Effects of microwave pretreatment on catalytic fast pyrolysis of pine sawdust. Bioresour. Technol. 2019, 293, 122080. [Google Scholar] [CrossRef]
  37. Cahuanti, M.N.; Doddapaneni, T.R.K.C.; Kikas, T. Biomass torrefaction: An overview on process parameters, economic and environmental aspects and recent advancements. Bioresour. Technol. 2020, 301, 122737. [Google Scholar] [CrossRef] [PubMed]
  38. Mamvura, T.A.; Danha, G. Biomass torrefaction as an emerging technology to aid in energy production. Heliyon 2020, 6, e03531. [Google Scholar] [CrossRef] [PubMed]
  39. Rago, Y.P.; Collard, F.X.; Görgens, J.F.; Surroop, D.; Mohee, R. Torrefaction of biomass and plastic from municipal solid waste streams and their blends: Evaluation of interactive effects. Fuel 2020, 277, 118089. [Google Scholar] [CrossRef]
  40. Świechowski, K.; Hnat, M.; Stępień, P.; Stegenta-Dąbrowska, S.; Kugler, S.; Koziel, J.A.; Białowiec, A. Waste to Energy: Solid Fuel Production from Biodas Plant Digestate and Sewage Sludge by Torrefaction-Process Kinetics, Fuel Properties, and Energy Balance. Energies 2020, 12, 3161. [Google Scholar] [CrossRef]
  41. Ong, H.C.; Chen, W.H.; Singh, Y.; Gan, Y.Y.; Chen, C.Y.; Show, P.L. A state-of-the-art review on thermochemical conversion of biomass for biofuel production: A TG-FTIR approach. Energy Convers. Manag. 2020, 209, 112634. [Google Scholar] [CrossRef]
  42. Ławińska, K.; Serweta, W.; Gendaszewska, D. Applications of Bamboo Textiles in Individualised Children’s Footwear. Fibres Text. East. Eur. 2018, 5, 87–92. [Google Scholar] [CrossRef]
  43. Pawlak-Kruczek, H.; Wnukowski, M.; Krochmalny, K.; Kowal, M.; Baranowski, M.; Zgóra, J.; Czerep, M.; Ostrycharczyk, M.; Niedźwiecki, Ł. The Staged Thermal conversion of Sewage Sludge in the Presence of Oxygen. J. Energy Resour. ASME 2019, 141, 070701. [Google Scholar] [CrossRef]
  44. Tic, W.J.; Guziałowska-Tic, J.; Pawlak-Kruczek, H.; Woźnikowski, E.; Zadorożny, A.; Niedźwiecki, Ł.; Wnukowski, M.; Krochmalny, K.; Czerep, M.; Ostrycharczyk, M.; et al. Novel Concept of an Installation for Sustainable Thermal Utilization of Sewage Sludge. Energies 2018, 11, 748. [Google Scholar] [CrossRef] [Green Version]
  45. Obraniak, A.; Gluba, T.; Lawińska, K.; Derbiszewski, B. Minimisation of environmental effects related with storing fly ash from combustion of hard coal. Environ. Protect. Eng. 2015, 44, 177–189. [Google Scholar] [CrossRef]
  46. Ławińska, K.; Szufa, S.; Obraniak, A.; Olejnik, T.; Siuda, R.; Kwiatek, J.; Ogrodowczyk, D. Disc Granulation Process of Carbonation Lime Mud as a Method of Post-Production Waste Management. Energies 2020, 13, 3419. [Google Scholar] [CrossRef]
  47. Szufa, S.; Piersa, P.; Adrian, Ł.; Czerwińska, J.; Lewandowski, A.; Lewandowska, W.; Sielski, J.; Dzikuć, M.; Wróbel, M.; Jewiarz, M.; et al. Sustainable Drying and Torrefaction Processes of Miscanthus for Use as a Pelletized Solid Biofuel and Biocarbon-Carrier for Fertilizers. Molecules 2021, 26, 1014. [Google Scholar] [CrossRef] [PubMed]
  48. Havrylianchyk, R.; Bilyk, T.; Hutsol, T.; Osadchuk, O.; Mudryk, K.; Jewiarz, M.; Wrobel, M.; Dziedzic, K. Straw of Buckwheat as an Alternative Source of Biofuels. In Renewable Energy Sources: Engineering, Technology, Innovation; Springer: Cham, Switzerland, 2020; pp. 323–329. ISBN 978-3-030-13887-5. [Google Scholar] [CrossRef]
  49. Saxena, J.; Rawat, J.; Kumar, R. Conversion of Biomass Waste into Biochar and the Effect on Mung Bean Crop Production. Clean Soil Air Water 2017, 45, 15010201501020. [Google Scholar] [CrossRef]
  50. Ünyay, H.; Yılmaz, F.; Başar, I.A.; Perendeci, N.A.; Çoban, I.; Şahinkaya, E. Effects of organic loading rate on methane production from switchgrass in batch and semi-continuous stirred tank reactor system. Biomass Bioenergy 2022, 156, 106306. [Google Scholar] [CrossRef]
  51. Karhunov, A.; Kichatov, B.; Sudakov, V.; Kolobov, A.; Gubernov, V.; Golubkov, A.; Libet, P.A.; Kireynov, A.; Yurchenko, S.O. Hydroscopic property of biofuel obtained by torrefaction of wood in a quiescent layer of bentonite. Fuel 2020, 282, 118766. [Google Scholar] [CrossRef]
  52. Abelha, P.; Kiel, J. Techno-economic assessment of biomass upgrading by washing and torrefaction. Biomass Bioenergy 2020, 142, 105751. [Google Scholar] [CrossRef]
  53. Biopaliwa Stałe—Oznaczenie Zawartości Wilgoci—Metoda Suszarkową—Część 1: Wilgoć Całkowita—Metoda Referencyjna; PN-EN ISO 18134-1:2015-11; Sklep PKN: Warszawa, Poland, 2020.
  54. Haseli, Y. Process Modeling of a Biomass Torrefaction Plant. Energy Fuel 2018, 32, 5611–5622. [Google Scholar] [CrossRef]
  55. Peduzzi, E.; Boissonnet, G.; Haarlemmer, G.; Dupont, C.; Maréchal, F. Torrefaction modelling for lignocellulosic biomass conversion processes. Energy 2014, 70, 58–67. [Google Scholar] [CrossRef]
  56. Wojtko, P.; Gaze, B.; Knutel, B.; Wacławek, A.; Bukowski, P.; Romański, L. The use of catalytic additives for the combustion of sunflower husk pellets in a low-power boiler. Przemysł Chem. 2021, 5, 1000–1004. [Google Scholar]
  57. Ngyuen, Q.; Nguyen, D.D.; Vothi, H.; He, C.; Goodarzi, M.; Bach, Q.V. Isothermal torrefaction kinetics for sewage sludge pretreatment. Fuel 2020, 277, 118103. [Google Scholar] [CrossRef]
  58. Haseli, Y. Simplified model of torrefaction-grinding process integrated with a power plant. Fuel Process. Technol. 2019, 188, 118–128. [Google Scholar] [CrossRef]
  59. Bates, R.B.; Ghoniem, A.F. Biomass torrefaction: Modeling of reaction thermochemistry. Bioresour. Technol. 2013, 134, 331–340. [Google Scholar] [CrossRef] [PubMed] [Green Version]
  60. He, Q.; Ding, L.; Gong, Y.; Li, W.; Wei, J.; Yu, G. Effects of torrefaction on pinewood pyrolysis kinetics and thermal behavior using thermogravimetric analysis. Bioresour. Technol. 2019, 280, 104–111. [Google Scholar] [CrossRef] [PubMed]
  61. Szufa, S. Use of superheated steam in the process of biomass torrefaction. Przemysł Chem. 2020, 99, 1797–1801. (In Polish) [Google Scholar] [CrossRef]
  62. Nwabunwanne, N.; Vuyokazi, T.; Olagoke, A.; Patrick, M.; Anthony, O. Improving the solid fuel properties of non-lignocellulose and lignocellulose materials through torrefaction. Materials 2021, 14, 2072. [Google Scholar] [CrossRef] [PubMed]
  63. Atienza-Martínez, M.; Fonts, I.; Ábrego, J.; Ceamanos, J.; Gea, G. Sewage sludge torrefaction in a fluidized bed reactor. Chem. Eng. 2013, 222, 534–545. [Google Scholar] [CrossRef]
  64. Viana, H.F.S.; Rodrigues, A.M.; Godina, R.; Matias, J.C.O.; Nunes, L.J.R. Evaluation of the physical, chemical and thermal properties of Portuguese maritime pine biomass. Sustainable 2018, 10, 2877. [Google Scholar] [CrossRef] [Green Version]
  65. Huang, Y.F.; Te Sung, H.; Te Chiueh, P.; Lo, S.L. Co-torrefaction of sewage sludge and leucaena by using microwave heating. Energy 2016, 116, 1–7. [Google Scholar] [CrossRef]
  66. Poudel, J.; Ohm, T.I.; Lee, S.H.; Oh, S.C. A study on torrefaction of sewage sludge to enhance solid fuel qualities. Waste Manag. 2015, 40, 112–118. [Google Scholar] [CrossRef]
  67. Sobek, S.; Tran, Q.-K.; Junga, R.; Werle, S. Hydrothermal carbonization of the waste straw: A study of the biomass transient heating behavior and solid products combustion kinetics. Fuel 2021, 2021, 122725. [Google Scholar] [CrossRef]
  68. Romanowska-Duda, Z.; Szufa, S.; Grzesik, M.; Piotrowski, K.; Janas, R. The Promotive Effect of Cyanobacteria and Chlorella sp. Foliar Biofertilization on Growth and Metabolic Activities of Willow (Salix viminalis L.) Plants as Feedstock Production, Solid Biofuel and Biochar as C Carrier for Fertilizers via Torrefaction Process. Energies 2021, 14, 5262. [Google Scholar] [CrossRef]
  69. Marczak-Grzesik, M.; Budzyń, S.; Tora, B.; Szufa, S.; Kogut, K.; Burmistrz, P. Low-Cost Organic Adsorbents for Elemental Mercury Removal from Lignite Flue Gas. Energies 2021, 14, 2174. [Google Scholar] [CrossRef]
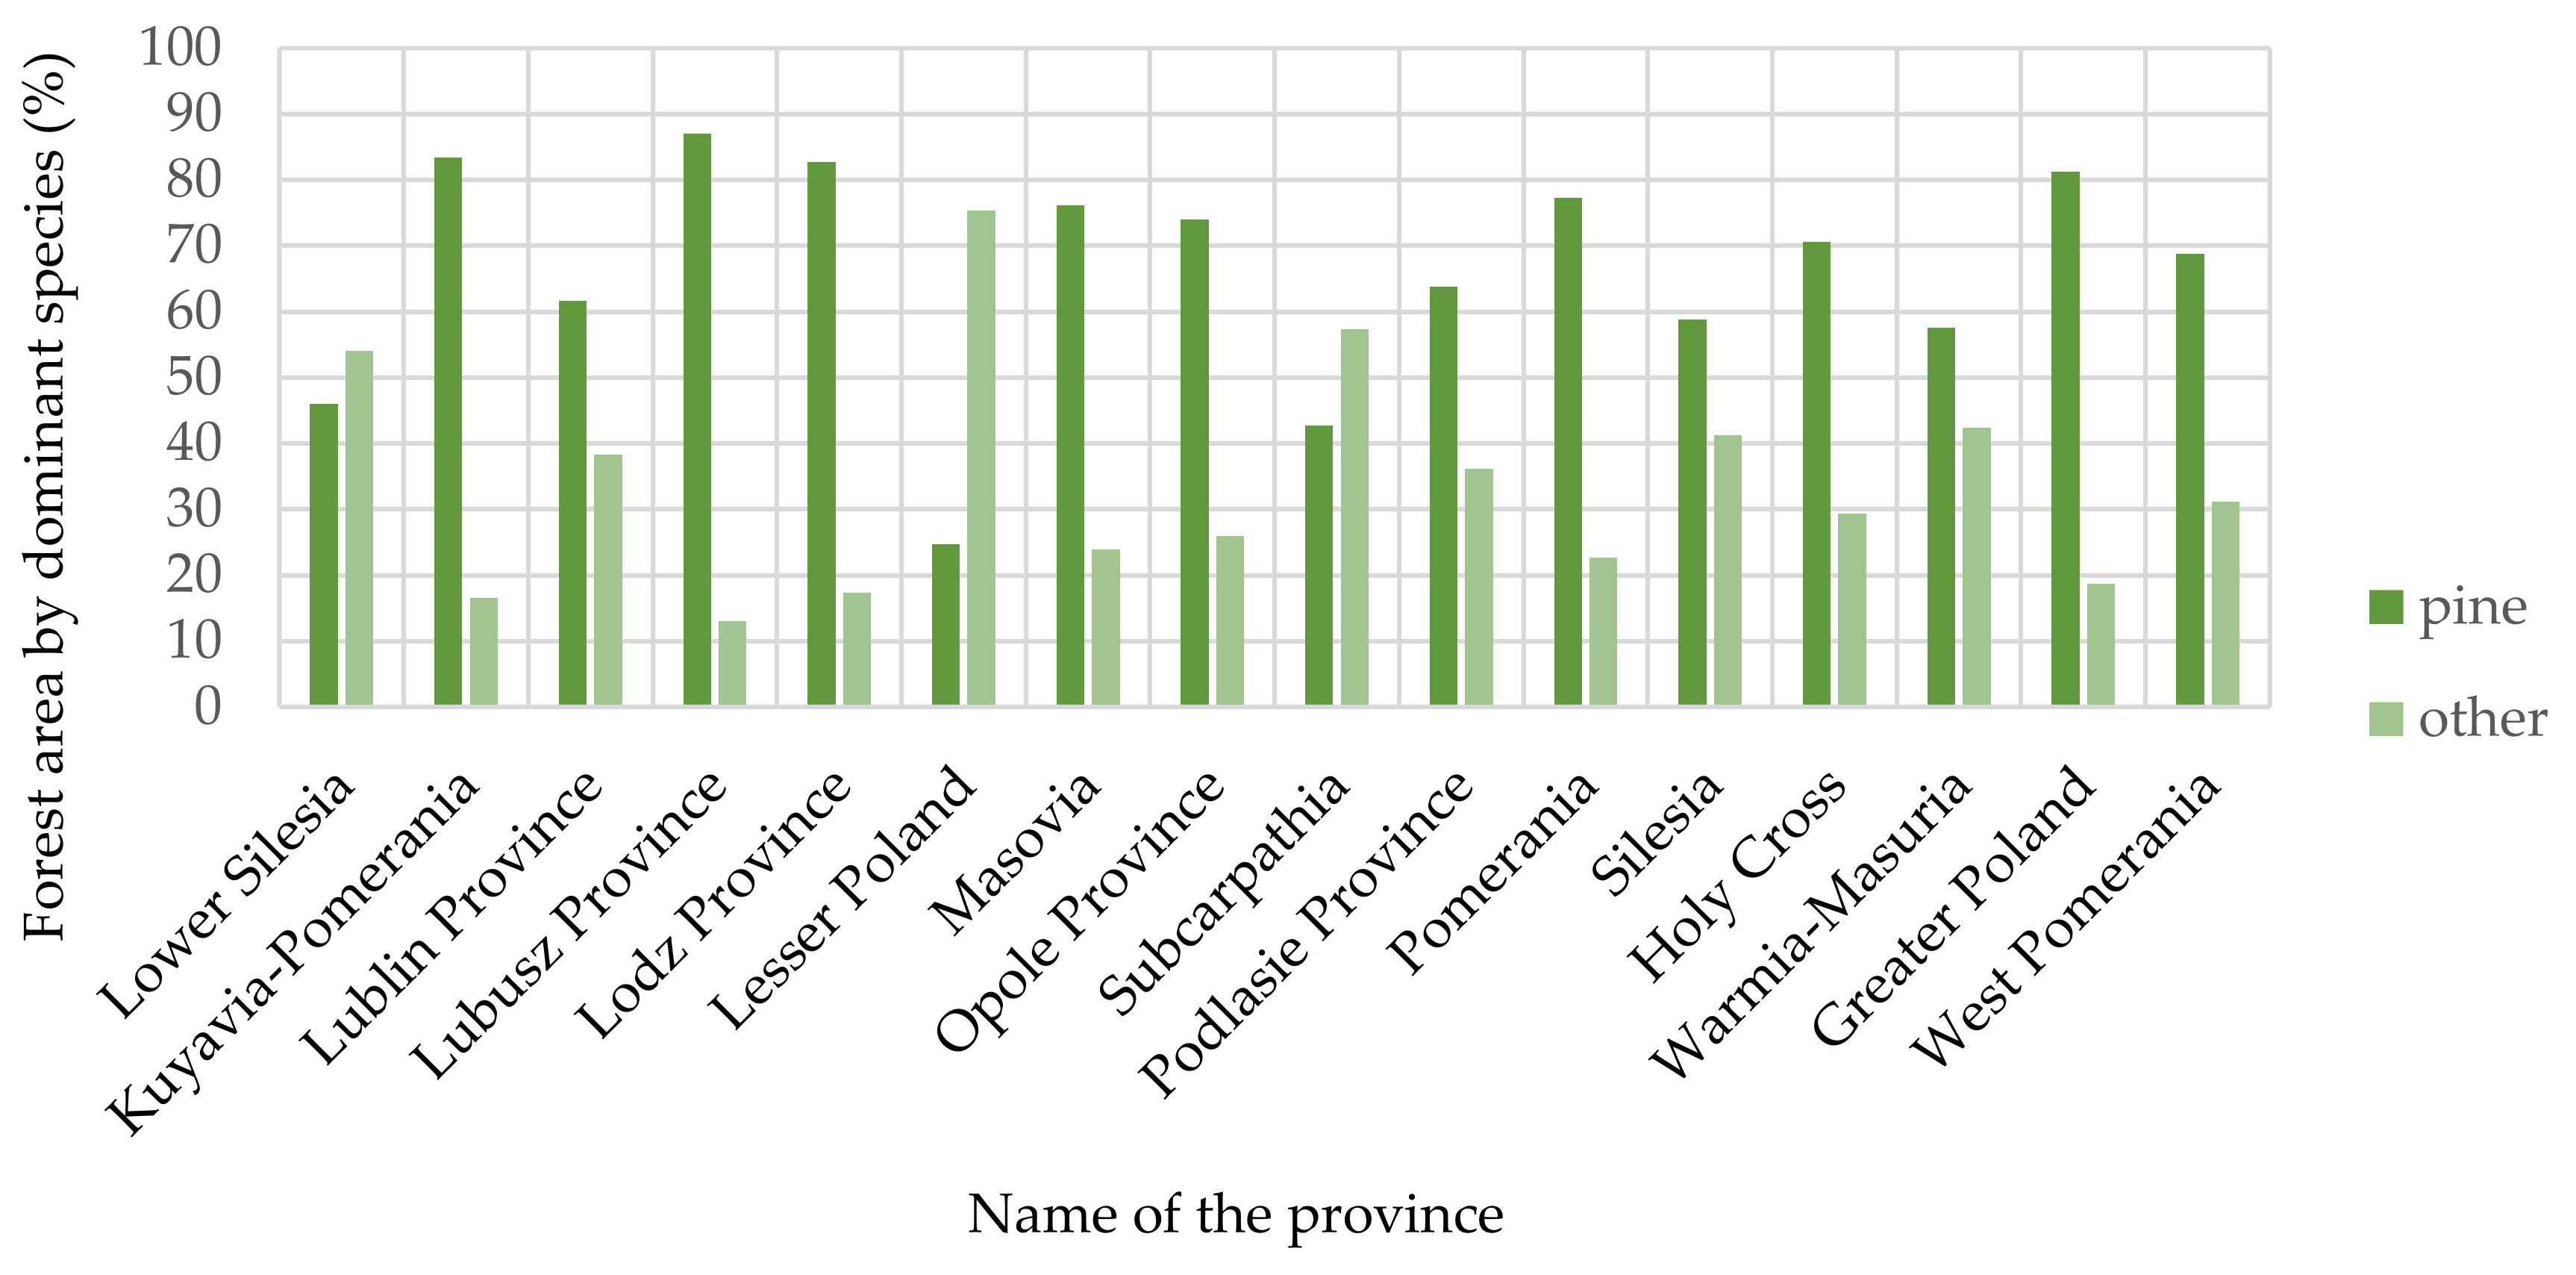
Figure 1. The area of forests on forest land by prevailing species in the voivodship system [1].
Energies 14 08176 g001
Figure 2. Diagram of an installation for thermogravimetric analysis of pine wood and sewage sludge.
Energies 14 08176 g002
Figure 3. Diagram of an installation for determining the emissions of total volatile organic compounds.
Energies 14 08176 g003
Figure 4. Installation diagram for determining the heat of combustion value.
Energies 14 08176 g004
Figure 5. TGA analysis of pine wood and maximum mass loss determination.
Energies 14 08176 g005
Figure 6. Mass losses during thermogravimetric analysis of pine wood.
Energies 14 08176 g006
Figure 7. Mass losses during thermogravimetric analysis of sewage sludge at different temperatures.
Energies 14 08176 g007
Figure 8. Mass losses of sewage sludge at several temperatures of 250–500 °C, residential time and heating ratios.
Energies 14 08176 g008
Figure 9. TG curves for three heating rates for pine wood.
Energies 14 08176 g009
Figure 10. TG curves for three heating rates for sewage sludge.
Energies 14 08176 g010
Figure 11. Plot of logarithm dx/dt as a function of the reciprocal of temperature for the Ozawa–Flynn–Wall method for pine wood. Symbols are representing, heating rates, Red: 20K/min, Blue: 10 K/min and Green: 5 K/min.
Energies 14 08176 g011
Figure 12. Plot of logarithm dx/dt as a function of the reciprocal of temperature for the Ozawa–Flynn–Wall method for sewage sludge. Red: 20K/min, Blue: 10 K/min and Green: 5 K/min.
Energies 14 08176 g012
Figure 13. Activation energy (Red color) and pre-exponential coefficient (Blue color) as a function of the degree of conversion determined by the Ozawa–-Flynn–Wall method for pine wood. Green color represents the statistical error.
Energies 14 08176 g013
Figure 14. Activation energy (Red color) and pre-exponential coefficient (Blue color) as a function of the conversion degree: (a) X = 0.20–0.98, (b) X = 0.20–0.90 determined by the Ozawa–Flynn–Wall method for sewage sludge. Green color represents the statistical error.
Energies 14 08176 g014
Figure 15. Fitting the calculated kinetic model for pine wood to the experimental data.
Energies 14 08176 g015
Figure 16. Fitting the calculated kinetic model for sewage sludge to the experimental data.
Energies 14 08176 g016
Figure 17. Time course of VOC total emission at 285 °C.
Energies 14 08176 g017
Figure 18. Values of the determined VOC total emission factor.
Energies 14 08176 g018
Table 1. Activation energy and pre-exponential coefficient as a function of the degree of reaction determined by the Ozawa–Flynn–Wall method for pine wood.
Fract. Mass LossActivation Energy (kJ/mol)Log (A/s−1)
0.020121.96 ± 61.158.85
0.050128.18 ± 44.829.11
0.100145.76 ± 42.6510.66
0.200161.46 ± 32.5611.85
0.300170.33 ± 31.3012.46
0.400174.80 ± 31.4912.70
0.500170.09 ± 34.5812.16
0.600162.39 ± 35.2311.42
0.700170.42 ± 34.1212.05
0.800402.87 ± 186.3631.02
Table 2. Activation energy and pre-exponential coefficient as a function of the degree of reaction determined by the Ozawa–Flynn–Wall method for sewage sludge.
Fract. Mass LossActivation Energy (kJ/mol)Log (A/s−1)
0.020542.50 ± 172.0956.16
0.050270.33 ± 88.0425.58
0.100203.17 ± 64.5718.12
0.200195.84 ± 53.7016.77
0.300205.04 ± 53.7217.15
0.400240.66 ± 50.4819.89
0.500269.49 ± 19.1621.76
0.600300.83 ± 48.9423.68
0.700312.47 ± 297.9223.59
0.800237.36 ± 492.8416.48
Table 3. Determined values of the heat of combustion of the obtained torrefaction products.
Biomass TypeMoisture, [%]Cad, [%]Nad, [%]Had, [%]Sad, [%]Cl, [%]Volatilead [%]Ash [%]Heat of Combustion, [MJ/kg]
Pine wood7.742.30.635.610.070.11582.44.218.19
Torrefied Pine Wood
(285 °C, 10 min)6.4251.150.676.140.030.01472.364.6421.72
(325 °C, 7 min)2.8353.240.235.620.030.01370.136.9727.48
(525 °C, 5 min)1.3957.290.153.470.040.01237.2310.1231.48
Sewage Sludge7.831.104.465.870.090.0159.840.513.24
Torrefied Sewage Sludge:
(280 °C, 9 min)3.831.44.475.230.010.00927.472.53.68
(320 °C, 6 min)2.232.604.294.610.010.0125.2574.323.44
(520 °C, 5 min)2.026.353.252.420.010.0123.4377.653.29
Publisher’s Note: MDPI stays neutral with regard to jurisdictional claims in published maps and institutional affiliations.