Article

Medical Peat Waste Upcycling to Carbonized Solid Fuel in the Torrefaction Process

by
Kacper Świechowski
,
Małgorzata Leśniak
and
Andrzej Białowiec
*
Department of Applied Bioeconomy, Wrocław University of Environmental and Life Sciences, 37a Chełmońskiego Str., 51-630 Wrocław, Poland
*
Author to whom correspondence should be addressed.
Energies 2021, 14(19), 6053; https://doi.org/10.3390/en14196053
Submission received: 28 August 2021 / Revised: 16 September 2021 / Accepted: 17 September 2021 / Published: 23 September 2021
(This article belongs to the Special Issue Biomass Torrefaction and Its Applications in Low-Carbon Industry)

Abstract

:
Peat is the main type of peloid used in Polish cosmetic/healing spa facilities. Depending on treatment and origin, peat waste can be contaminated microbiologically, and as a result, it must be incinerated in medical waste incineration plants without energy recovery (local law). Such a situation leads to peat waste management costs increase. Therefore, in this work, we checked the possibility of peat waste upcycling to carbonized solid fuel (CSF) using torrefaction. Torrefaction is a thermal treatment process that removes microbiological contamination and improves the fuel properties of peat waste. In this work, the torrefaction conditions (temperature and time) on CSF quality were tested. Parallelly, peat decomposition kinetics using TGA and torrefaction kinetics with lifetime prediction using macro-TGA were determined. Furthermore, torrefaction theoretical mass and energy balance were determined. The results were compared with reference material (wood), and as a result, obtained data can be used to adjust currently used wood torrefaction technologies for peat torrefaction. The results show that torrefaction improves the high heating value of peat waste from 19.0 to 21.3 MJ × kg−1, peat main decomposition takes place at 200–550 °C following second reaction order (n = 2), with an activation energy of 33.34 kJ × mol−1, and pre-exponential factor of 4.40 × 10⁻¹ s−1. Moreover, differential scanning calorimetry analysis revealed that peat torrefaction required slightly more energy than wood torrefaction, and macro-TGA showed that peat torrefaction has lower torrefaction constant reaction rates (k) than wood 1.05 × 10⁻⁵–3.15 × 10⁻⁵ vs. 1.43 × 10⁻⁵–7.25 × 10⁻⁵ s−1.

1. Introduction

Peloids are commonly used in spa treatment and cosmetology for cosmetic and healing purposes. Peloids refer to inorganic, organic, or a mixture matter that originated through geological and/or biological processes. Özay et al. [1] proposed to divide peloids by origin and composition into four groups: peat, sludge (bituminous or mineral), slime (sea or delta), and earth (rock or schist) [1]. The most used peloid in Poland is peat. Leśniak [2] shows that a typical SPA facility in Poland uses from 2.90 to 3.42 Mg of peat yearly. Assuming an average value of 3.16 Mg × year−1 and a current number of spa facilities (103), the annual peat waste (PW) production counts about 324 Mg [2]. The PW management depends on the specific situations in the country and its law regulations [3]. In general, waste peloids generated in beauty salons are safe, but ones from spa centers may be microbiologically contaminated, and in such a situation, PW must be considered as medical waste, requiring a special waste treatments method, e.g., waste incineration. However, other methods of PW recycling and upcycling should be developed. In this study, we check the validity of thermal upcycling of medical/cosmetic peat waste into high-quality solid fuel, free of possible infectious substances using the torrefaction process.

1.1. Peat Applications

Peat can be classified according to different factors such as fiber content or fiber decomposition, organic matter, and vegetation forming the organic content. In addition, ASTM D4427-13, “Standard Classification of Peat Samples by Laboratory Testing”, can be used for peat classification. There is also a special von Post scale, which classifies peat soils based on the degree of its decomposition at 10 points (H1–H10 with the interpretation from none to complete decomposition) [4]. For medical/cosmetic purposes, typically, peat with classes from H6 to H10 is used [5]. Each class corresponds to 10% of decomposition (degree of humification). Where H1 means peat, which squeezed releases almost clear water, plants are identifiable, and no amorphous material is present, while H10 means completely decomposed peat, which squeezed escape between fingers, without discernible plants structures [6]. Medical/cosmetic peat usage in Europe is dated to the 18th century, but external usage as poultices is dated to the early 19th century [7]. Peat in cosmetics is used, inter alia, for facial care treatments supporting the treatment of acne, and scars, and sun discoloration, as an antiaging treatment that improves the elasticity of the facial skin and so on [5]. On the other hand, in a healing spa (peat bath), peat is mainly used to overheat the body. It is possible thanks to high heat capacity and relatively flat cooling curve in comparison to water. As a result, baths improve blood circulation, effects myalgia, and chronic inflammation, and so on [7].
Using peat as fuel started earlier. Since the 12th-century, peat has become an important energy source in Europe. Nevertheless, currently using peat for energy production has ended in most countries [8]. Only six countries in the EU (Estonia, Finland, Ireland, Latvia, Lithuania, and Sweden) use peat for energy purposes excavating around 9.4 mln Mg per year of it. Among these countries, only 208 peat-fired energy plants exist, and only Finland uses peat in significant amounts, covering around 25% of its national heat needs [9]. Nevertheless, peat does not play a significant role in the energy sector of the EU (1.7%), and since 2010, its consumption has decreased. As a result, it is highly probable that peat’s role in the EU energy sector will further decrease [10]. On the other hand, Russia, which has a significant peat reserve (~30% of the world’s peat), is considered to go back to peat mining for energy uses as a more environmentally friendly alternative for coal and to diversify locals’ energy sources. The main peat advantage is its abundance and low-cost mining in comparison to coal. Nevertheless, peat is characterized by high moisture content and relatively high ash content. Therefore, before energy use, peat required seasoning and pretreatment [11,12,13].
Besides medical/cosmetic and energy purposes, peat is also widely used in horticulture and agriculture. Peat-specific properties allow its use as a soil improver, growing medium, compost ingredient, etc. For example, peat mining for agricultural usage is common in such countries as Germany and Poland [10], which do not use it for energy purposes. On the other hand, peat and peatlands represent a valuable global carbon store and are critical for preserving biodiversity [14]. Moreover, the analysis of the European Commission from 2018 shows that limiting the use of peatlands is effective for CO2 emission mitigation [11]. Therefore, peat replacement materials are sought. The opportunity for such replacement material is looking in biochars and hydro-chars obtained from organic waste [15,16]. Since carbon materials alone or in mixtures with organic substances have the potential to substitutes (partially or full) peat for agricultural usages. For example, some biochars (depending on substrate and process conditions) have higher pH, increased surface area, excellent water, and nutrient retention properties in comparison to peat. Moreover, biochars may contain different forms of nitrogen and have a considerable amount of potassium [15]. That suggests that biochar from medical/cosmetic peat waste may partially replace fresh peat usage in agriculture/horticulture or other emerging applications such as odors mitigation [17].

1.2. Peat Thermal-Upgrading Methods

Some studies show that peat can be upgraded thermally by various methods, i.e., torrefaction [18], pyrolysis [19], gasification [20], or hydrothermal carbonization [21]. Each process favors different input substrates, process conditions, and end products. Torrefaction is typically used to improve the calorific value and storage properties (increased hydrophobicity) of biomass. It takes place at 200–320 °C in the absence of oxygen. Solids are the main process products [22]. The pyrolysis also takes place in the absence of oxygen but at temperatures over 320 °C. As a result, depending on pyrolysis conditions main products are liquid, gas, or solid; nevertheless, amounts of solids obtained from pyrolysis always are lower than from torrefaction. On the other hand, gasification takes place in a partially oxidative atmosphere and converts substrates mainly into gases. This process requires temperatures from ~800 to 1150 °C [23,24]. The main drawback of mentioned processes is the fact that materials need to be dry, or additional energy needs to be spent on water removal. Moreover, in the case of pyrolysis and gasification, high process temperatures required much more energy in comparison to torrefaction [25]. Partially, these drawbacks can be overcome by hydrothermal carbonization (HTC), which favors wet substrates, and low temperatures 150–320 °C. Nevertheless, HTC required sophisticated reactors that can stand high pressure up to 50 bars or more [26,27].
Some studies show the prospect of thermal peat upgrading to fuels (gases or solids) using the overmentioned processes [18,19,20,21,28]. Nevertheless, none of them focus on medical/cosmetic peat waste particularly. In addition, none of the studies alone provide comprehensive data of peat upcycling to carbonized solid fuel by torrefaction, including the effect of process conditions on CSF fuel qualities, torrefaction kinetics, energy, and mass balance of the whole process. Especially that peat is not homogenous material, and its composition varies significantly around the world. As a result, adopting data from different studies to make any conclusion may not be fully successful and precise.
The torrefaction is a well-known and world-wise used process for wood energy properties upgrading [29]. Besides energy densification in a solid product, torrefaction removes water, increases hydrophobic characteristics, decreases energy to grind, and decreases biodegradability [30]. As a result, torrefied material becomes easier to transport, manage, and storage [31]. Such positive effects are mainly due to hemicellulose decomposition. The hemicellulose is rich in hydroxyl groups (including carboxylic and phenolic groups), which can form a hydrogen bond with water increasing bonded water content [30,32]. When hemicellulose is decomposed because of depolymerization, demethoxylation, and bond cleavage reactions, these groups are removed as well. As a result, fuel becomes hydrophobic and more fungal-resistant [32]. In addition, changes in chemical composition (decrease in available nutrients and production of toxic chemicals) the resistance to biodegradation increases [30]. The end effect and properties of torrefied material depend on used feedstock, reactor type, and process conditions, i.e., temperature, time, heating rate, feedstock particle size, pressure, etc. [33].

1.3. Aim of the Study

In this study, we performed initial laboratory analyses on medical/cosmetic peat waste upcycling using torrefaction. The analyses covered the effects of process conditions on carbonized solid fuel quality, thermal decomposition kinetics, torrefaction kinetics with lifetime prediction, and theoretical mass and energy balance determination. The analyses were performed following our previous research related to wood biomass torrefaction. Therefore, obtained data are comparable to well-described wood material. As a result, obtained data may be used for adjusting the existing technology used for wood torrefaction to peat torrefaction.

2. Materials and Methods

2.1. Materials

The medical/cosmetic peat come from a peat bog “Kołobrzeg” owned by Uzdrow-isko Kołobrzeg S.A. The peat bog is located around 3.5 km from Kołobrzeg, Poland. The peatland is classified as a low type [2,34], and the medical properties of the peat are confirmed by the National Institute of Public Health. The natural moisture content of peat obtained from the peat bog was 89.9%, and organic dry mass was 92.5% of dry mass. The peat had a degree of humification (according to the van Post scale) between H4 and H6 [2,35].

2.2. Methods

2.2.1. Torrefaction Process—CSF Production

The carbonized solid fuel (CSF) was produced using a muffle furnace (Snol 8.1/1100, Utena, Lithuania). The dry peat samples of ~20 g were placed at ceramic trays and put in the muffle furnace. To keep the inert atmosphere, CO2 was introduced into the furnace. The furnace was heated from room temperature to setpoint temperature (200–300 °C, intervals 20 °C). When the temperature inside reached the setpoint, it was kept for 20, 40, or 60 min. After this time, the furnace was left to self-cooling, and when the temperature dropped below 100 °C, samples were removed. For the CSF production process, mass yield (MY), energy densification ratio (EDr), and energy yield (EY) were determined using Equations (1)–(3).
MY = mCSF/mraw × 100
EDr = HHVCSF/HHVraw
EY = MY × EDr
where:
MY —mass yield, %; m CSF —mass of produced CSF, g; m raw —a mass of substrate used for CSF production, g; EDr —energy densification ratio, -; HHV CSF —high heating value of CSF, J × g−1; HHV raw —high heating value of substrate used for CSF production, J × g−1; EY —energy yield, %.

2.2.2. Proximate Analysis and High Heating Value Determination

Proximate analysis and high heating value determination were performed for raw peat and produced CSF. The proximate analysis consisted of moisture content (MC), volatile matter (VM), ash content (AC), and fixed carbon (FC). Additionally, volatile solids (VS) and combustible parts (CP) were determined. The proximate analysis with additional parameters was determined according to methods presented in previous work [36]. The high heating value (HHV) was determined using a calorimeter (IKA, C200, Staufen, Germany). Each sample was tested in three repetitions. Used standards, methods, and equipment are listed in Appendix A, Table A1.

2.2.3. Statistical Analyses

CSF production data and results of the proximate analysis with HHV were subjected to regression analysis. The regression analysis aimed to provide useful empirical models for easy determination of CSF properties and CSF production process in function of torrefaction temperature and time. The regression was performed according to the methodology described in previous work [37]. In short, empirical data were subjected to four main regression equations (linear, second-order polynomial, factorial regression, and response surface regression). Then, models were compared using the determination coefficient (R2) and the Akaike information criterion (AIC). Then, models with the highest R2 and the lowest AIC were chosen as the best fitted to the experimental data. Next, coefficients significance was checked. When some coefficients turned out to be not significant, it was removed from the model, and rest of the coefficients were recalculated again.
To check if there is an effect of process temperature and the treatment time on CSF properties, ANOVA analyses were performed at (p < 0.05). Then, to check between which groups the difference occurs, a Tukey post-hoc test was performed.

2.2.4. Thermal Decomposition Analysis

The thermal decomposition of dry peat and wood (as reference material) was studied using two different approaches and equipment, TG/DTG-DSC analyzer and macroTG/DTG analyzer. The mentioned abbreviation means TG—thermogravimetry; DTG—difference thermogravimetry; DSC—differential scanning calorimetry. The macro term refers to sample size. In standard TG, the sample is measured in mg, while in macro-TG, the sample mass is measured in g.
Firstly, samples were subjected to TG/DTG-DSC analysis, where samples were decomposed at a range of 30–800 °C. In this test, the temperature increased with a constant rate of 10 °C × min−1. For this analysis, a sample of ~3.6 mg was subjected to a simultaneous thermal analyzer (Netzsch, 449 F1 Jupiter, Selb, Germany) in a nitrogen atmosphere to prevent Boudouard reaction at >700 °C that occur when CO2 is used [38]. Experiment results showed material decomposition in the function of time and allowed for the determination of decomposition kinetics. Moreover, TG-DSC results were used for the calculation of the theoretical mass and energy balance of the torrefaction process (Section 2.2.5) according to previous work [39]. The decomposition kinetics were determined using the well-known Coats–Redfern method (CR) [40]. For the CR method, the kinetic triplet consists of activation energy (Ea), pre-exponential factor (A), and reaction order (n). In this study, kinetic triplets were determined for the whole process as well as decomposition peaks. The full methodology of kinetic triplet determination is described elsewhere [36].
Secondly, dry peat samples were subjected for macroTG/DTG analysis at torrefaction temperature range 200–300 °C. For this test, stand-mounted tubular furnace (Czylok, RST 40 × 200/100, Jastrzębie-Zdrój, Poland) coupled with the laboratory balance (RADWAG, PS 750.3Y, Radom, Poland) was used. The samples of ~3 g were heated by 60 min at 200, 220, 240, 260, 280, and 300 °C in the CO2 atmosphere to imitate conditions of setpoint temperatures of CSF production (Section 2.2.1). The results showed thermal decomposition at specific torrefaction temperature in function of time. Moreover, results were used for torrefaction kinetics determination for isothermal temperature according to previous work [41]. In short, for each torrefaction temperature, the constant reaction rate (k) was determined by experimental data fitting to the first-order reaction. Then, using determined k values, the Arrhenius plot, ln(k) vs. 1/T, was drawn. Next, from the obtained slope and intercept, the activation energy and pre-exponential factor for the torrefaction process were obtained. Then, using obtained kinetic triplet, the prediction of the lifetime of material exposed to isothermal conditions may be performed for any temperatures in the range of 200–300 °C. In this study, kinetic triplet was used for the prediction of the temperatures, which was used for kinetic determination. The result of wood subjected to this method is presented in previous work [41].

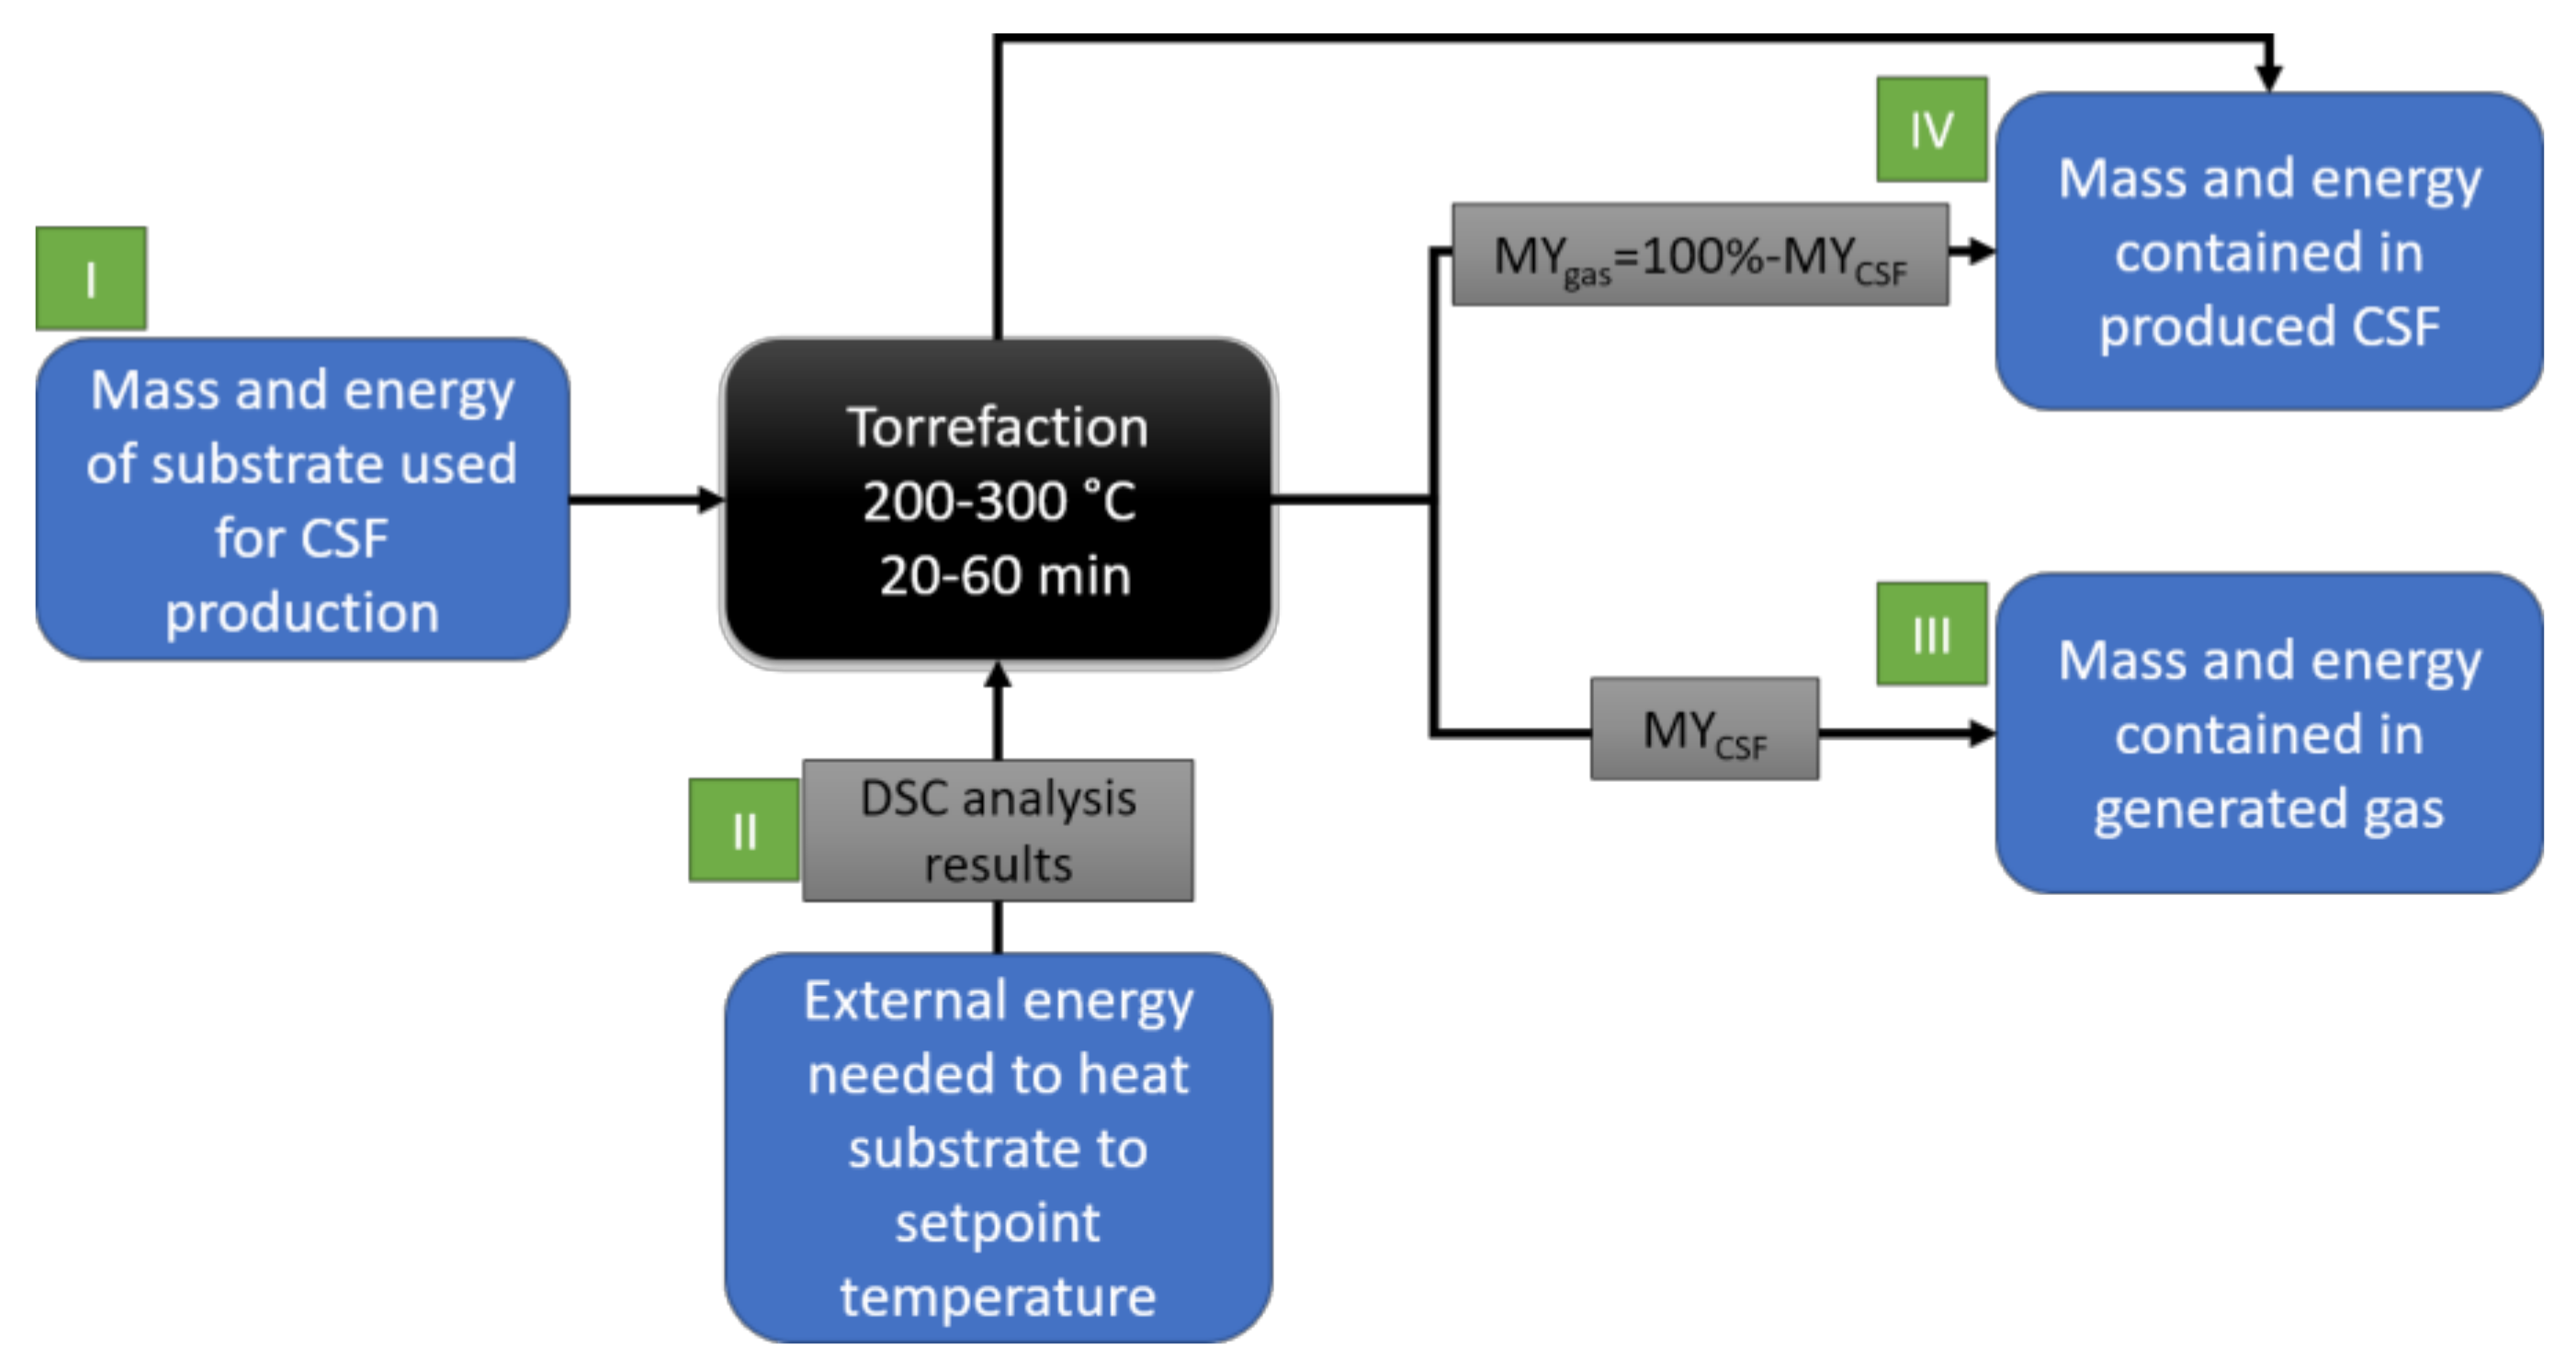
2.2.5. Theoretical Mass and Energy Balance of the Torrefaction Process

Theoretical mass and energy balance of the torrefaction process were calculated for peat and wood (as reference material) using data from some of the analyses. The balances were calculated to produce 1 g of CSF. The balance calculations include the mass of substrate needed to produce 1 g pf CSF; external energy needed to heat this mass of substrate to the setpoint temperature (DSC results) (including mass change during the heating); the energy contained in 1 g of CSF (HHV results); a mass of gas produced during the production of 1 g of CSF, and energy contained in this gas. To calculate the mentioned values, results of MY, HHV, and TG/DSC were used. The graph of balances determination is shown in Figure 1. The green squares represent the order of preformed calculations, the gray squares represent experimental/calculated data used for balances determination, and the blue squares stand for input and output data.
The calculations were performed in four steps. First (I), knowing MY of CSF production, a mass of substrate needed for 1 g of CSF was calculated. Then, knowing the HHV of a substrate, energy contained in the input substrate was calculated. Secondly (II), the results of DSC were used to determine the amount of energy needed to heat a proper amount of substrate to the setpoint temperature. Here, DSC results were given by thermal analyzer software right away in mW per mg. Therefore, by multiplication DSC results by time, the external energy provided to the sample was calculated. Thirdly (III), the energy contained in CSF was determined by experimental HHV determination. Fourthly (IV), the mass and energy contained in the gas produced alongside the production of 1 g of CSF were determined. The mass of gas was calculated as the difference between the used substrate and the mass of obtained CSF, while the energy was calculated as the difference between energy contained in substrate and CSF increased by external energy provided to heat substrate to the setpoint temperature. Here it was assumed that CSF is completely cooled before it is removed from the reactor, and this energy goes to the gas phase (Figure 1).
To keep calculations as simple as possible, the following assumptions were adopted:
(i)
Processed material is completely dry, MC = 0%;
(ii)
Only external energy is used to provide heat for the process;
(iii)
The process has 100% efficiency, no heat losses;
(iv)
All external energy after the process goes to gaseous products.

3. Results and Discussion

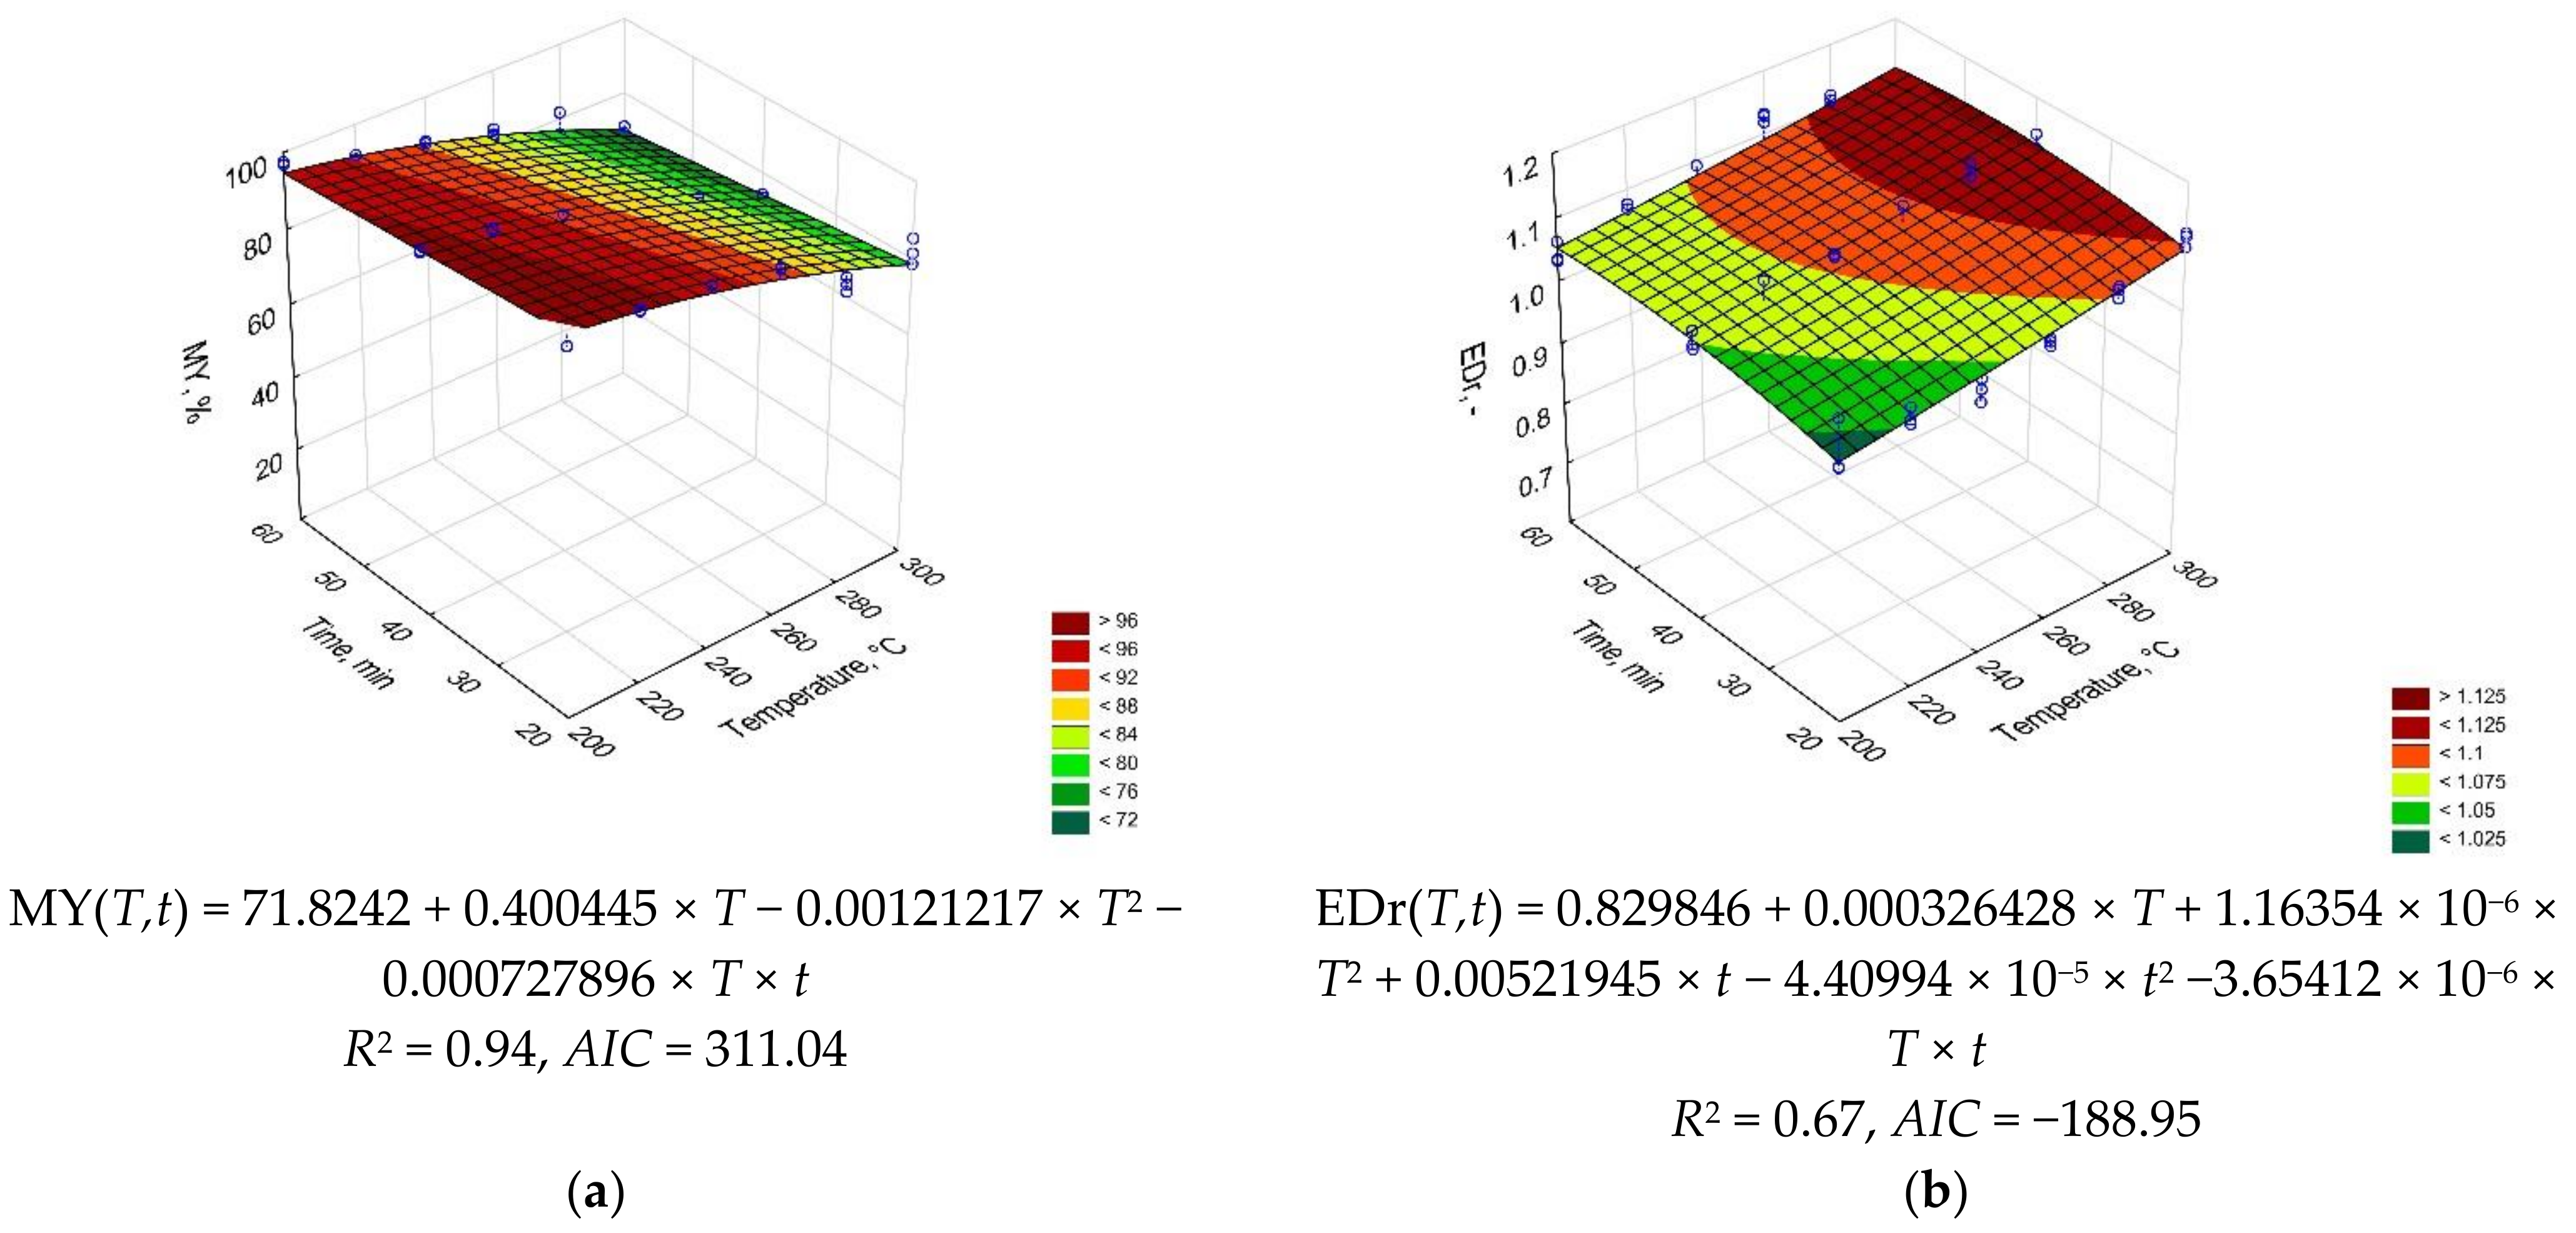
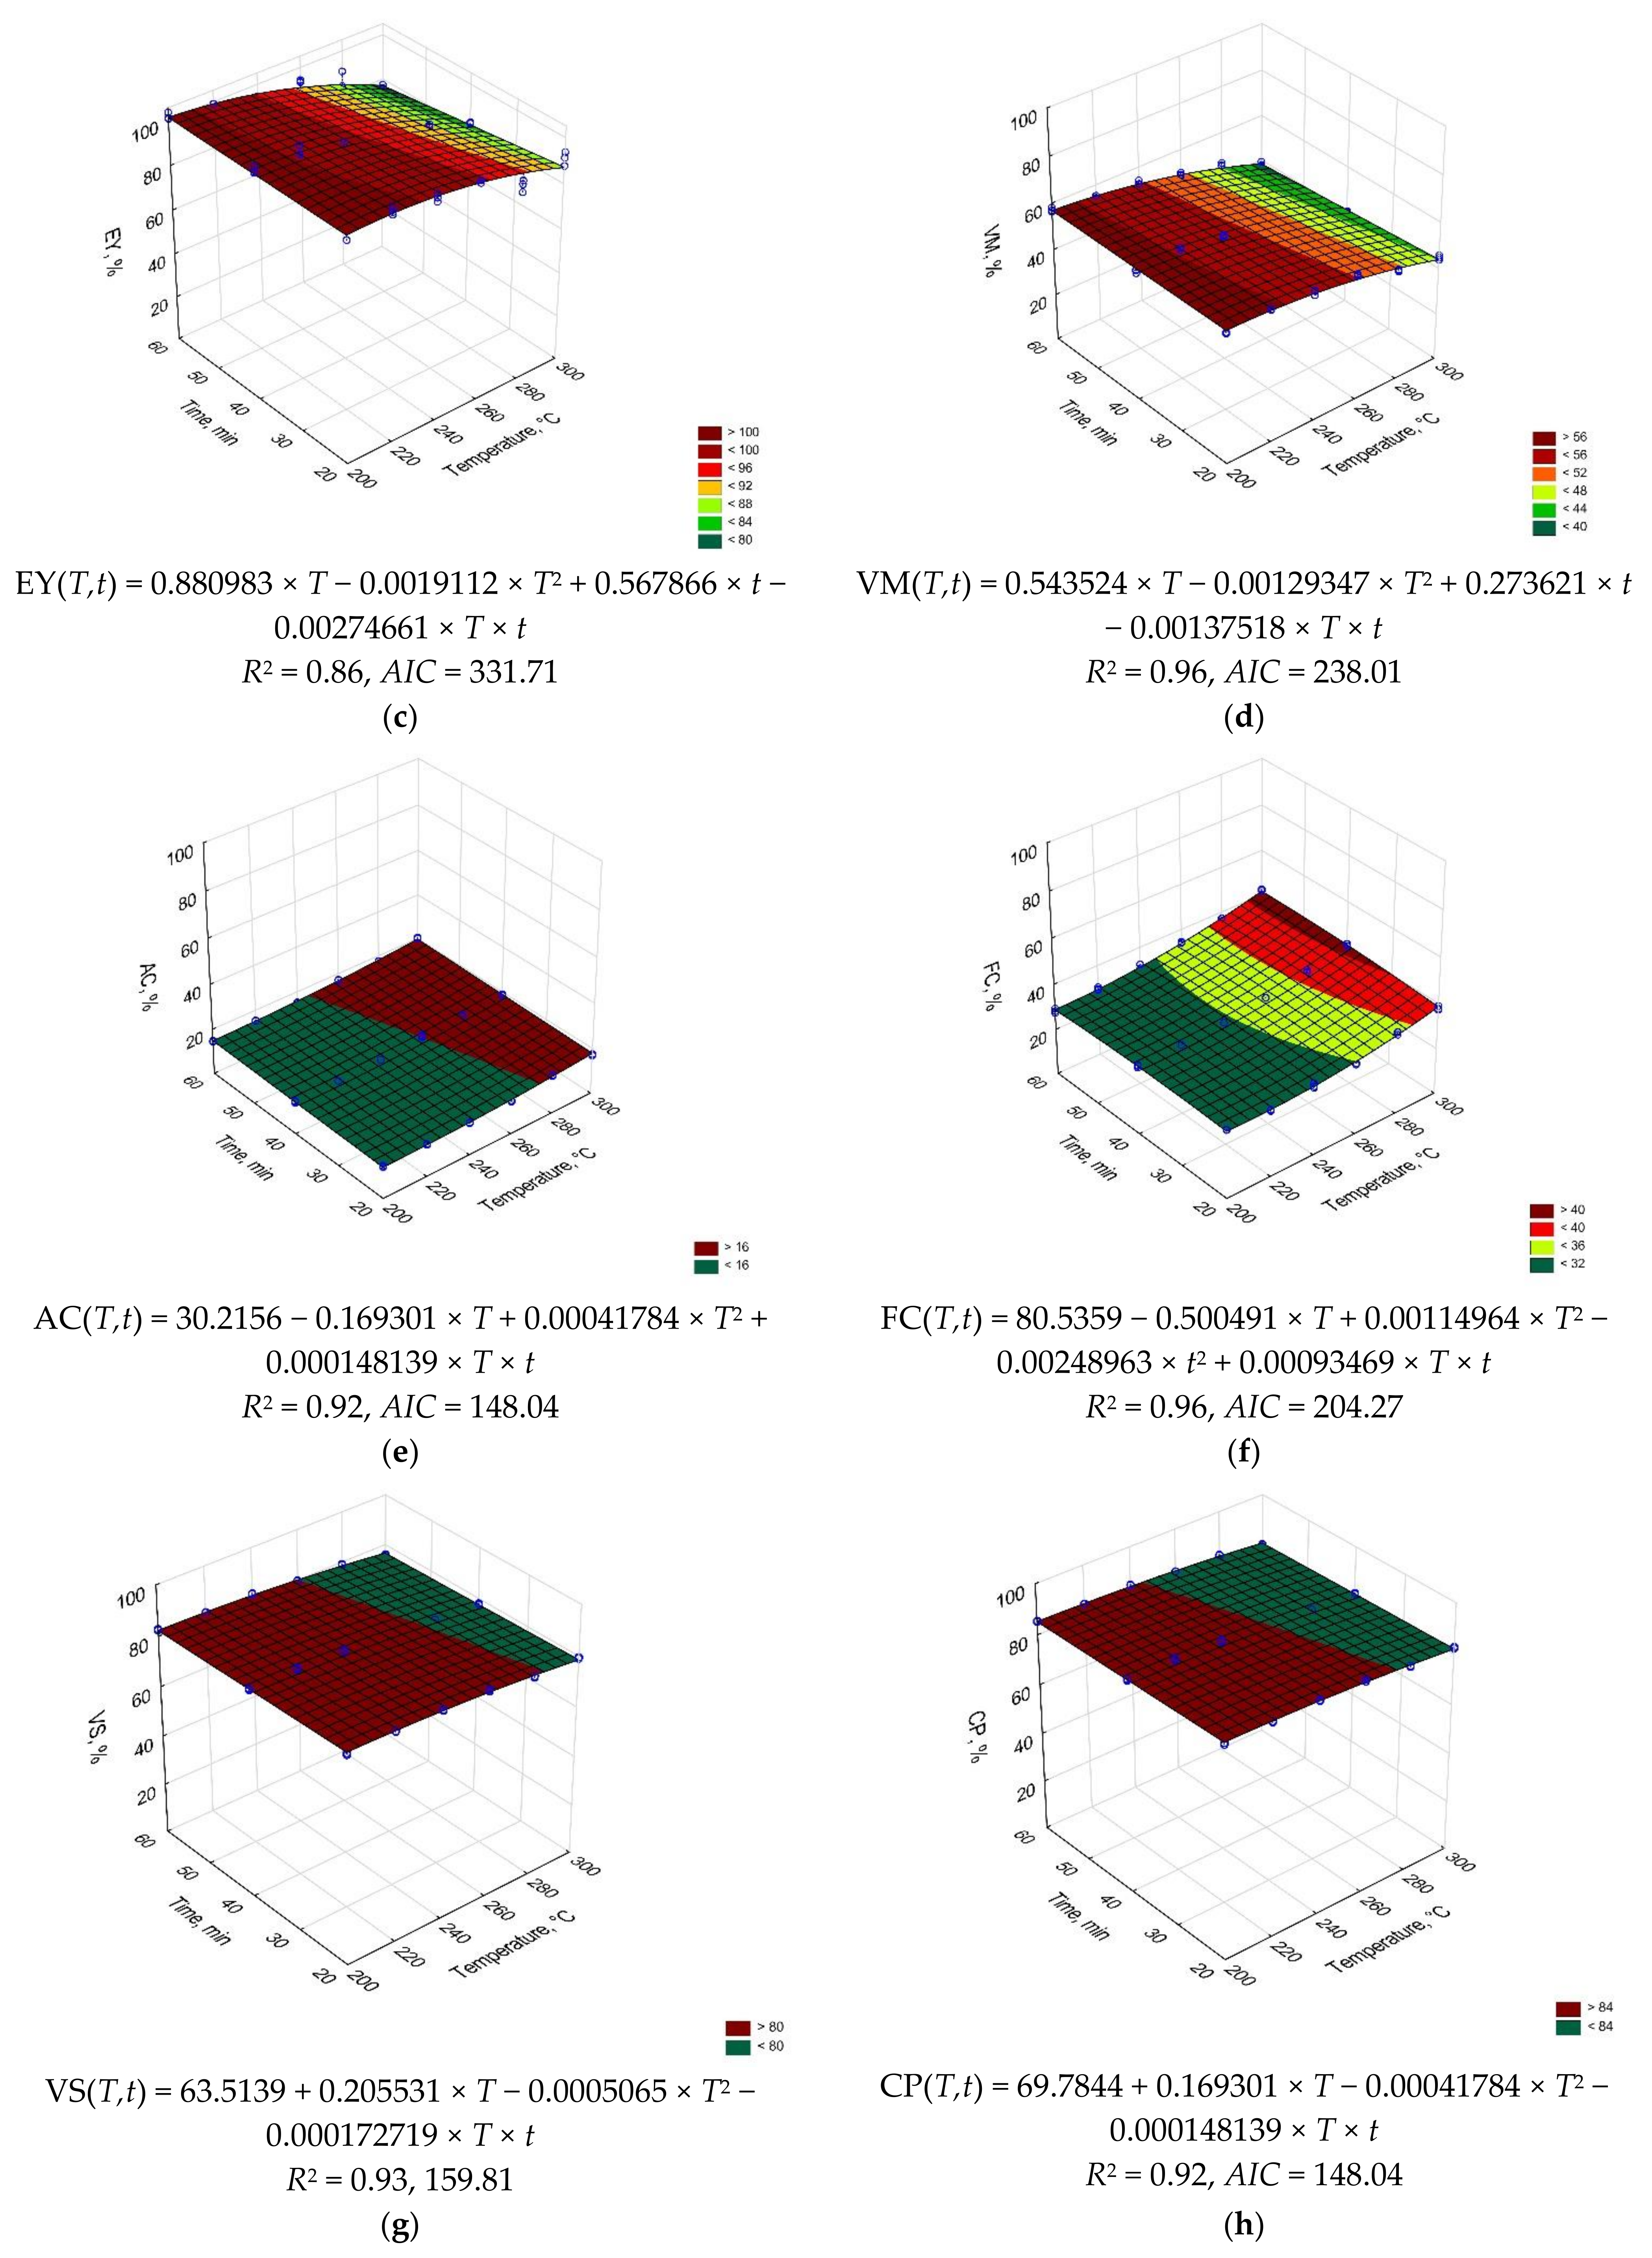
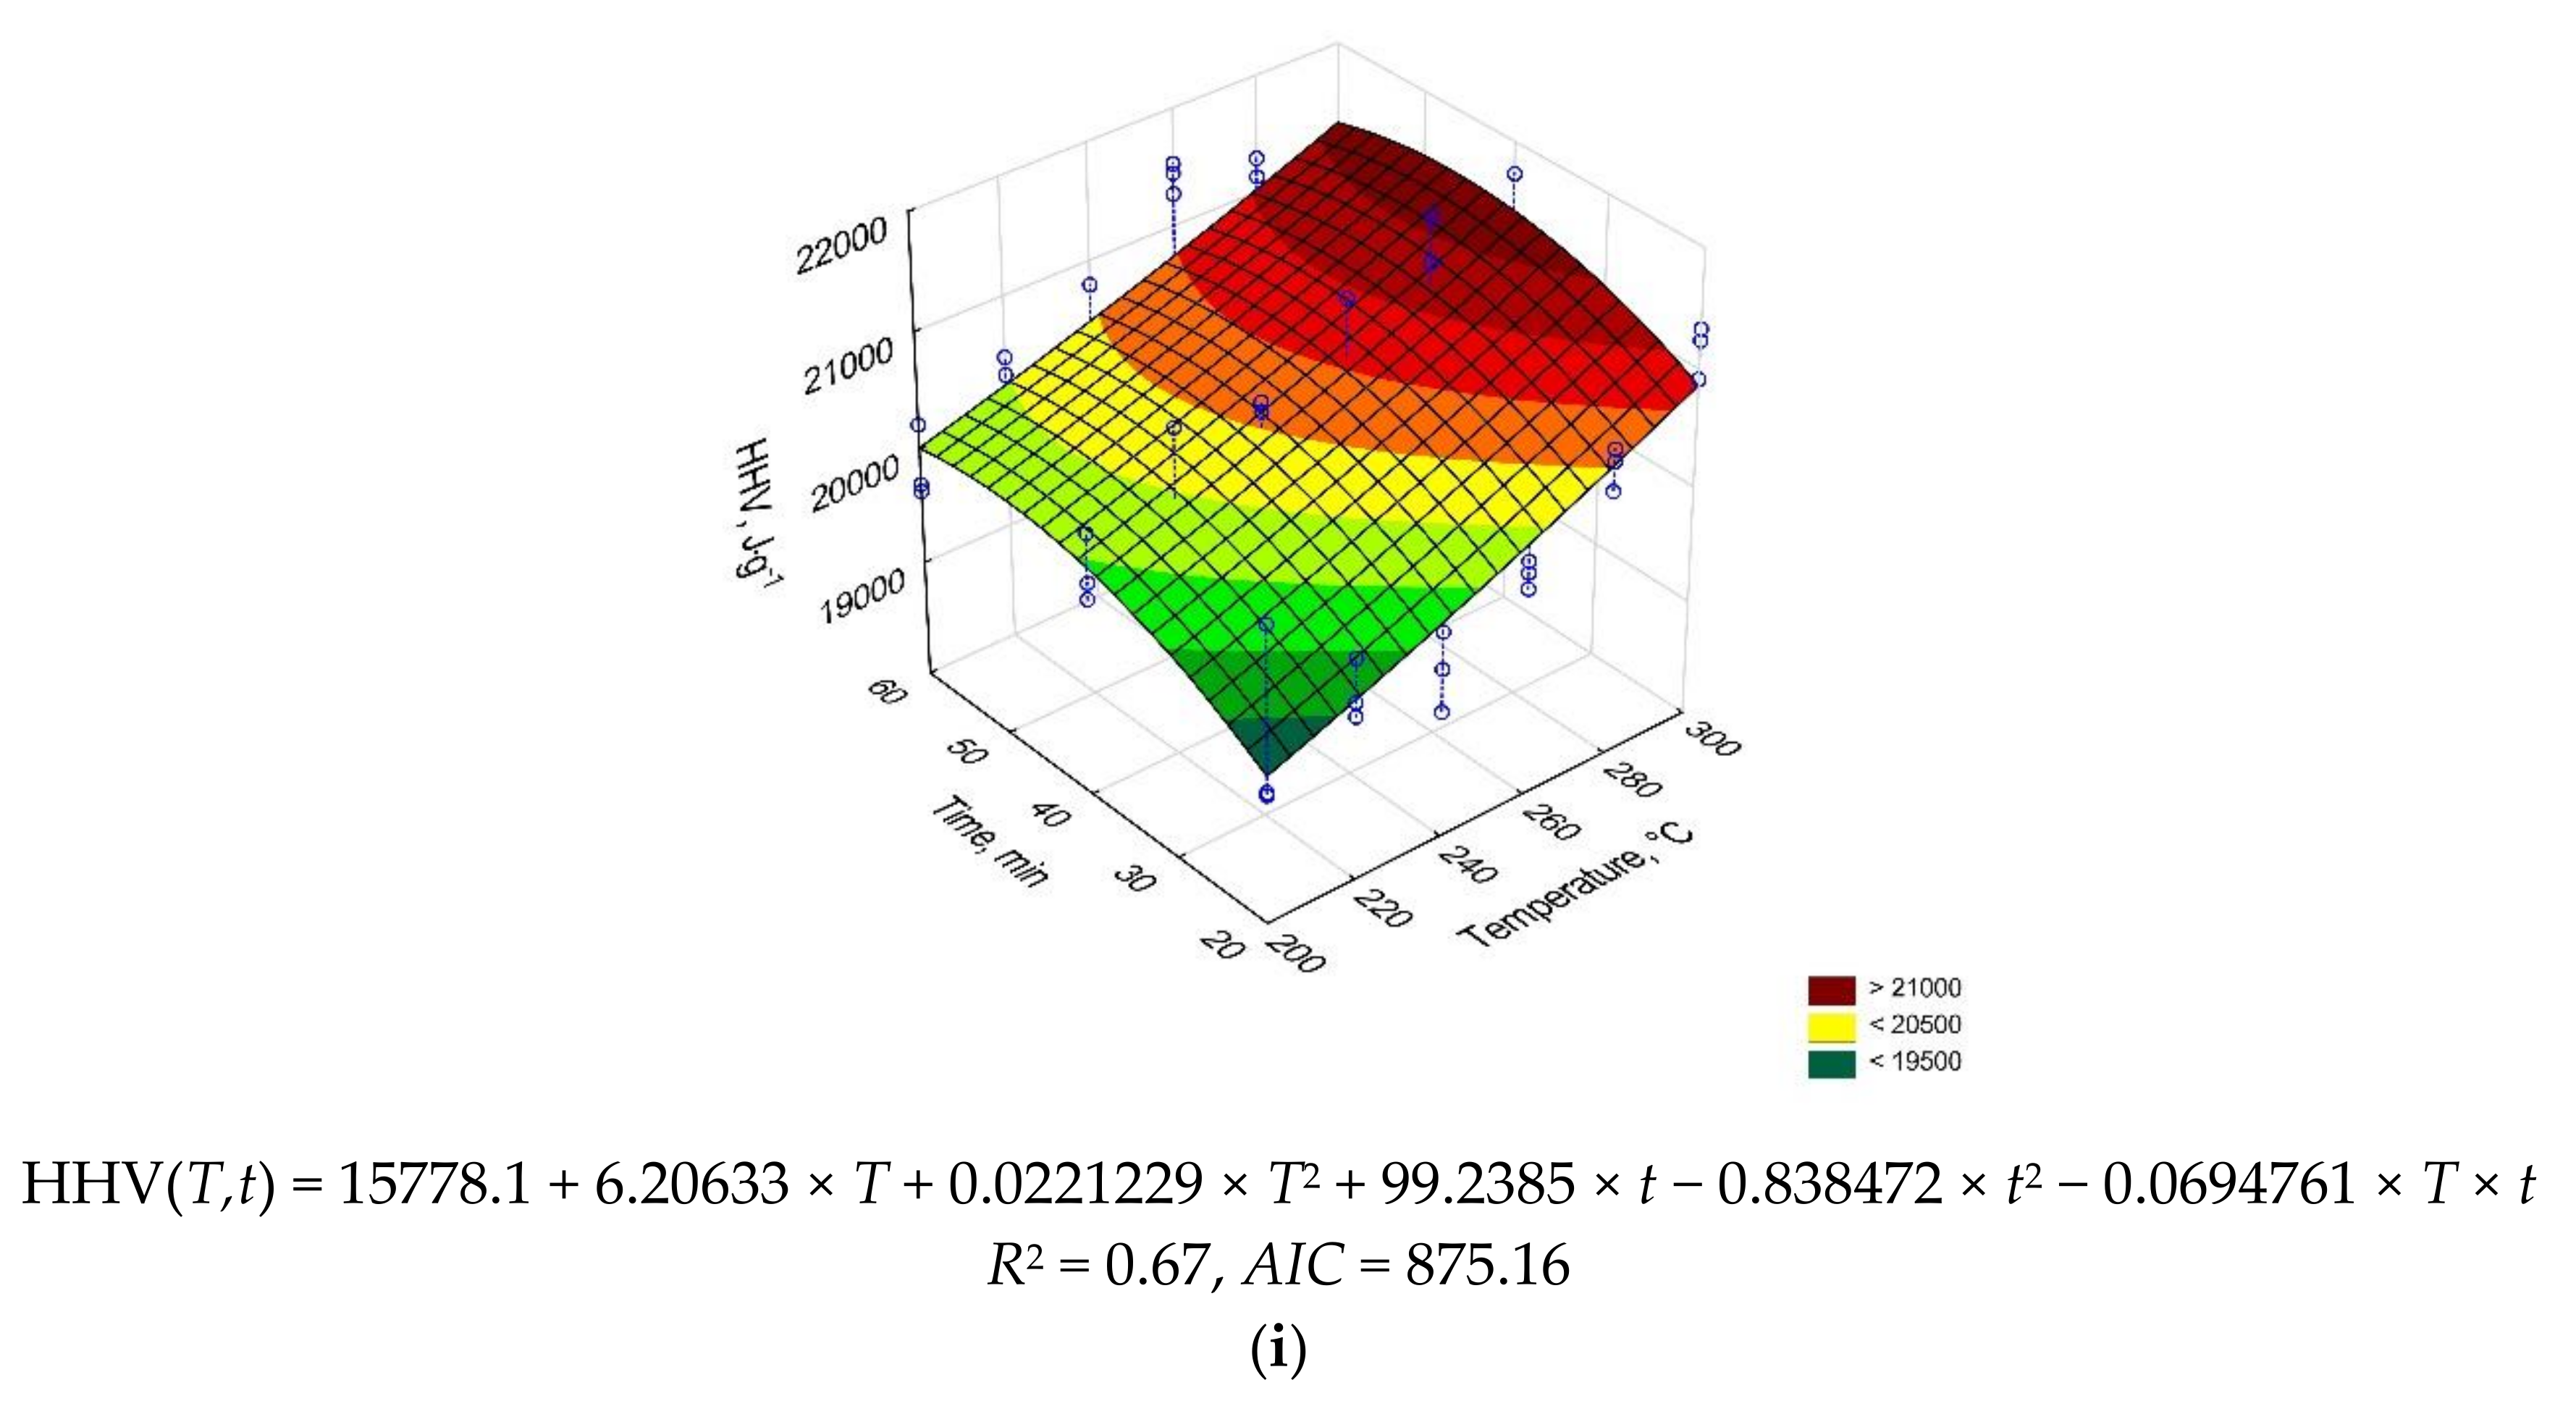
3.1. CSF Production and Proximate Analysis

All raw data generated in this study were given in Supplementary Materials. The result of the raw peat and CSF properties were summarized in Table 1. The 3D models with equations presenting occurring changes in the function of torrefaction temperature and time are presented in Appendix A (Figure A1a–i).
The raw peat used in this study had 84.8% of moisture content, and its dry mass was characterized by 59.3%, 26.3%, and 14.4% content of VM, FC, and AC, respectively. Moreover, the average high heating value was 19,013 J × g−1. The peat composition varies in a wide range. For example, Canadian peat has only 36% of MC, but almost 70% of VM, around 30% of FC, and only 2% of AC [42], while Bangladesh peat was characterized by 20–50% of MC, 7–48% of VM and ash content up to 90% [43]. Therefore, direct data comparison needs to be performed carefully.
The results showed that increasing process temperature and time causes the decrease in peat MY from 97.6% to 69.1% at 200 °C and 20 min and 300 °C and 60 min, respectively (Figure A1a). The opposite trend was observed for EDr, where, with the increase in temperature and process time, the EDr values increased from 1.03 for CSF produced at 200 °C and 20 min to 1.12 for CSF produced at 300 °C and 40 min (Figure A1b). Moreover, with increasing temperature, the EY decreased from 100.6% to 75.9% (Figure A1c) for CSF produced at 200 °C and 20 min and 300 °C and 60 min, respectively. The obtained results have a typical tendency of lignocellulosic materials. For comparison, the wood torrefied at the same conditions is characterized by MY of 92–55%, 1.05–1.20 of EDr, and 96–66% of EY [44]. Since peat showed to has smaller mass losses, comparable EDr, and higher EY than wood, it suggests that it is a suitable material for torrefaction. Weight losses are an inevitable element of each torrefaction, and mass losses are related to water removal and partial devolatilization. When during devolatilization, more oxygen than carbon leaves processed material, its high heating value increases, and as a result increase in EDr is observed. The EDr presents how much energy is in the CSF when compared to not torrefied material, and when EDr is higher than 1, the CSF contains more energy than not torrefied material. Typically, torrefaction leads to EDr increase [45] but some materials, mostly not lignocellulosic, have the opposite trend, e.g., sewage sludge [46]. In this study, EY was over 100% at 200–220 °C (Table 1), which is a result of the inaccuracy of empirical measurements. Theoretically, EY cannot be higher than 100% because it would mean that the produced CSF is more energy than in substrate used for its production. As was mentioned above, during torrefaction, devolatilization always occurs, and they take away some chemical energy and move it to gas and liquid fractions.
Devolatilization is a process where large molecules are thermally decomposed by temperature into smaller ones, and when molecules are small enough, they are released from the material by convection forces. During this phenomenon occurs, inter alia, decarbonization, dehydrogenation, deoxygenation [47]. As a result, volatile matter decreases, and ash and fixed carbon content increase. Typical biomass consists of cellulose, hemicellulose, and lignin, and these components affect the properties of biomass and torrefied biomass. The hemicellulose (xylan) consists of 78.57% of VM, 2.11% of AC, and 19.33% of FC. The cellulose consists of 95.21% of VM and only 4.79% of FC. Ash is not present in cellulose. The lignin has the lowest VM of 54.61% but the highest FC of 29.25%, and AC of 16.15 [48]. Since in the torrefaction temperatures, mainly hemicellulose decomposes, its properties have the highest effect on torrefied material properties.
The torrefaction process resulted in a decrease in VM from 59.3% for dry unprocessed peat to 38.1% for CSF produced at 300 °C and 60 min (Table 1). At the same conditions, AC increased by ~6% from 14.4% to 20.3%, and FC by ~15% from 26.3% to 41.6%. These changes are characterized by smooth trends, where the temperature has much more effect on observed change than the time (Figure A1d–f). In addition, increasing temperature resulted in a decrease in VS and CP from 83% to 75.8% and from 85.6% to 79.7%, respectively (Figure A1g–h). For comparison, the energetic non-woody biomass is characterized by VM of 70–94%, AC of 1.3–17%, and FC of 2.4–17.2% [49,50], while wood biomass has much homogeneous composition, 82–84%, 15.5–16.4, and 0.3–0.8%, respectively [51]. That means the torrefied peat has less VM and more FC than typical wooden biomasses, but it also has much more AC. Peat, torrefied at 300 °C, becomes like lignite (VM of 39.8%, AC of 8.5%, FC of 51.6%) [52].

3.2. Process Kinetics

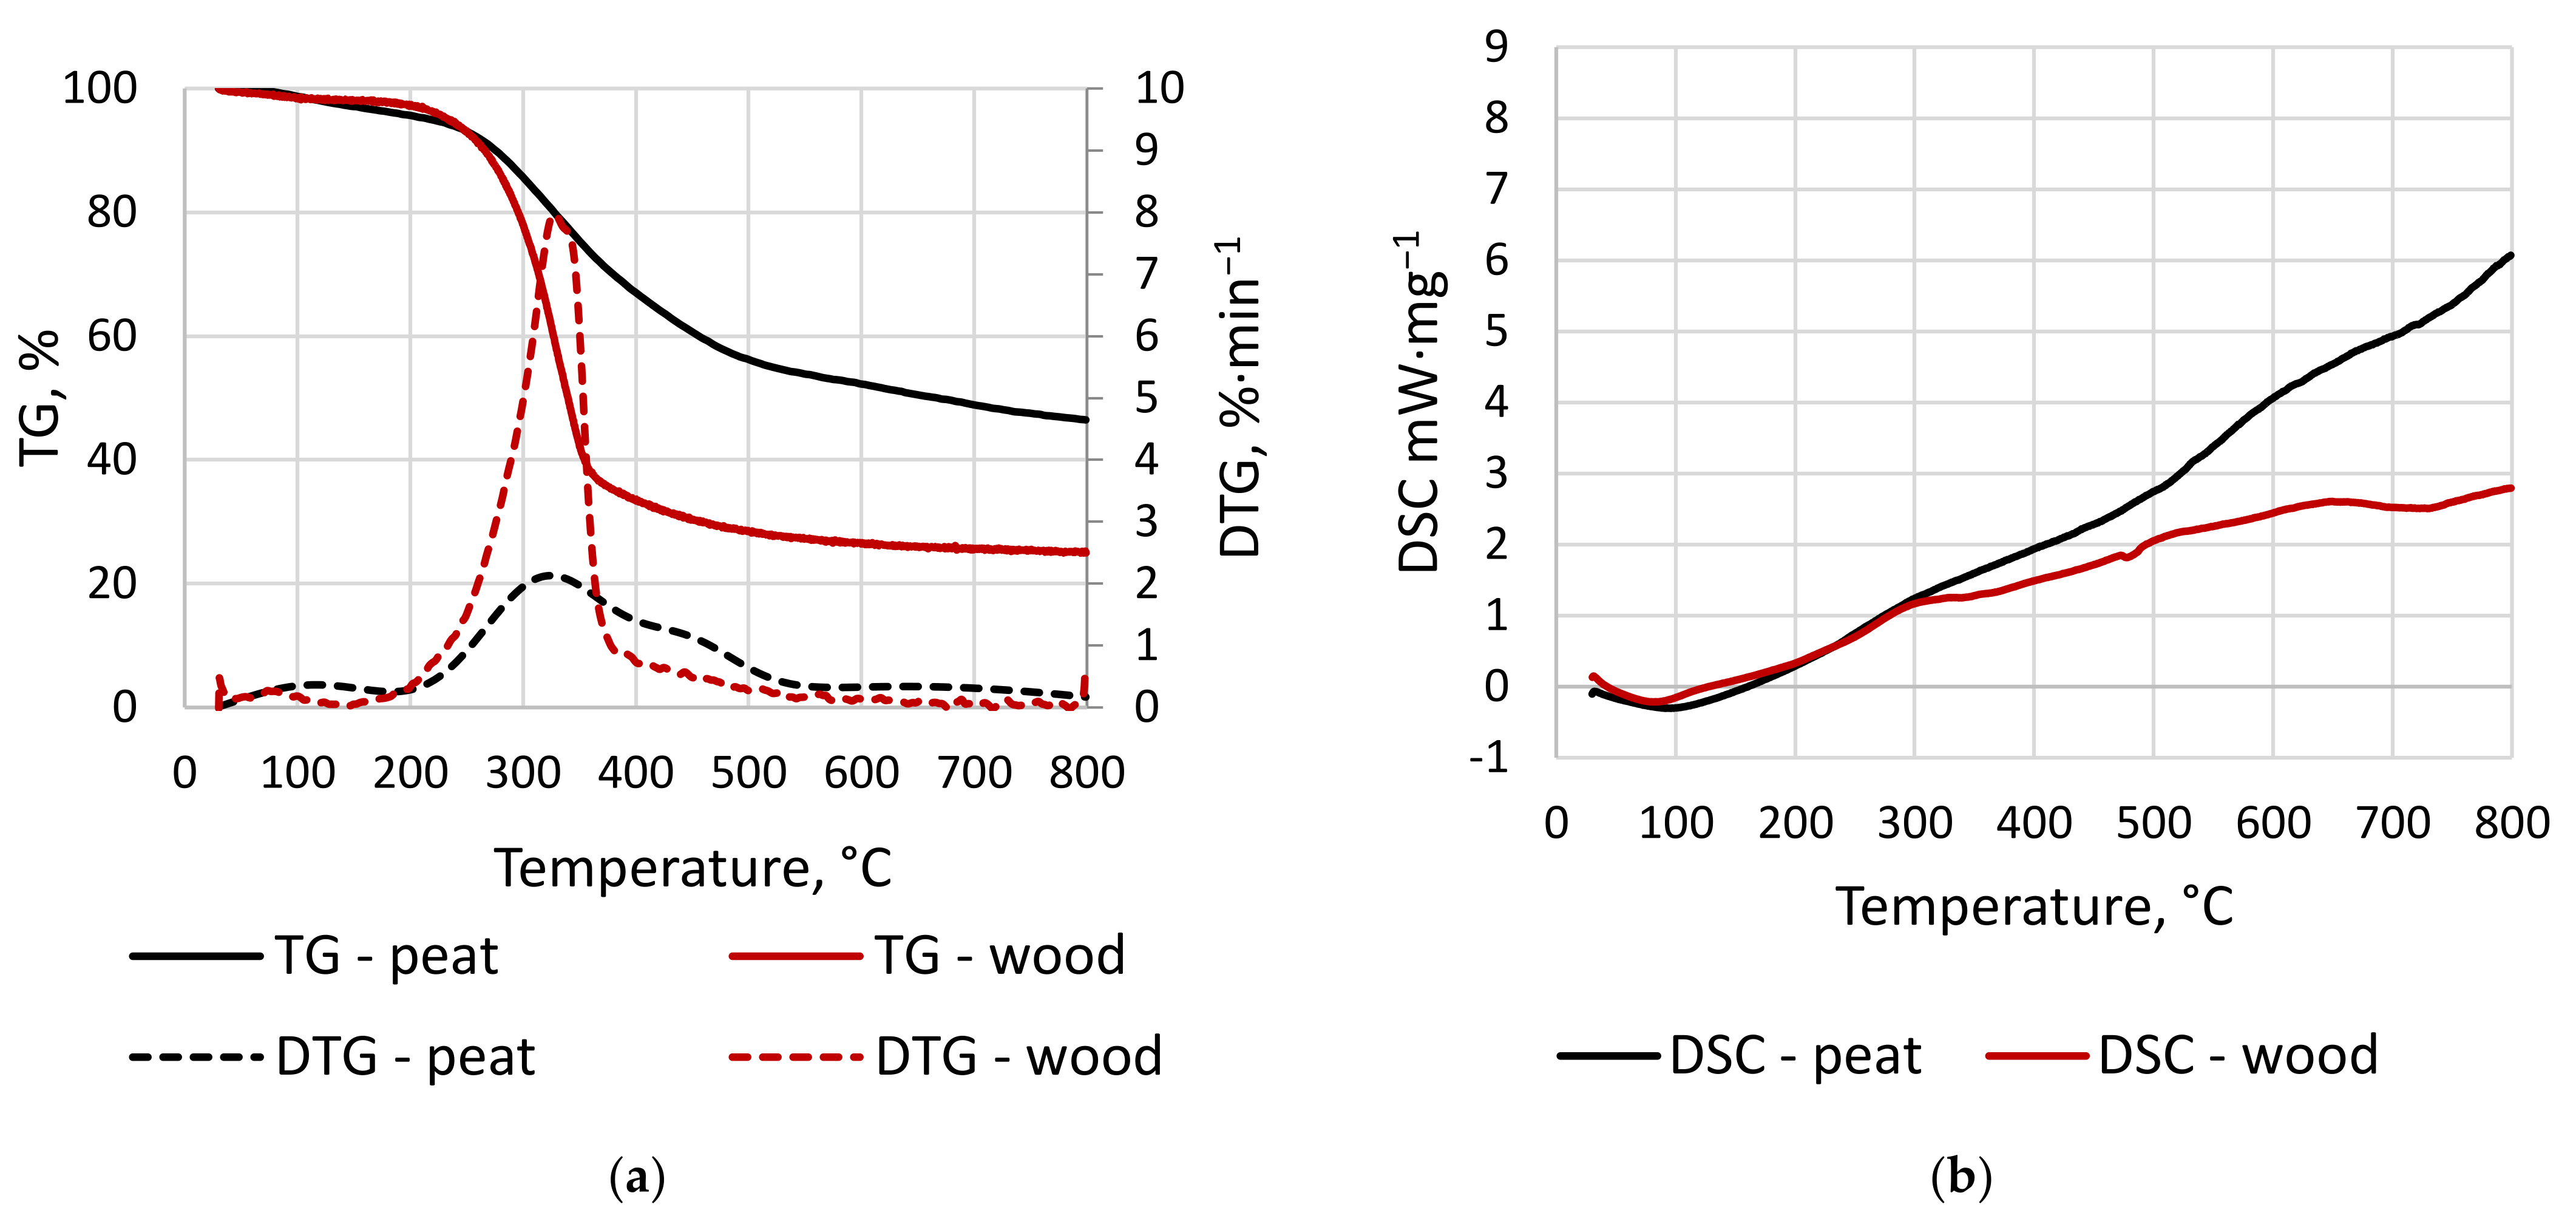
3.2.1. TG/DTG and DSC Results

In Figure 2, the results of TG/DTG and DSC analysis are presented. The TG/DTG curves show that the main decomposition of peat and wood starts at similar temperatures, around 200–220 °C; nevertheless, peat turns out to be more resistant for thermal degradation and is characterized by a much lower mass losses in comparison to wood. It is obvious, as peat is more decomposed material than wood. The used peat has a degree of humification (according to the van Post scale) between H4 and H6 [35], meaning that it may be characterized by moderate decomposition. DTG results also showed that peat main decomposition occurred at 200–550 °C and was characterized by two peaks, the first maximum at ~325 °C and the second at ~450 °C. In contrast, wood main decomposition occurred at ~200–380 °C with a maximum at ~330 °C. DSC results are presented in Figure 2b. For both materials. DSC curves are similar up to 300 °C. First, they have one endothermal reaction at ~100 °C and then one exothermal at ~300 °C. At temperatures higher than 300 °C, the peat curve increases more than a woods curve. Moreover, during peat decomposition, one exothermic reaction occurs at 600 °C, while for wood, two endothermic reactions at 478 and 730 °C may be seen.
The observed differences are related to the chemical composition and degree of humification of tested materials. The wood is made of five elements: lignin (18–35%), carbohydrates such as cellulose (40–50%), hemicelluloses (25–35%), organic extractives, and minerals (ash) [53], while peat is an organic matter mixture consists of partially decomposed plants grown in bogs, swamps, and marshes [54]. The organic matter mixture may vary significantly depending on peat age, depth, groundwater level, and so on [55]. For example, Iglovikov et al. [55] analyzed peat soil that consists of bitumens (6–10%), hemicellulose (14–18%), cellulose (1–1.5%), humic acids (28–34%), fulvic acid (15.5–19%), lignin (5–7%), and other organic and inorganic compounds. The study of Brown et al. [56] showed that cellulose and lignin content vary from 14.9% to 46.7% and from 1.1% to 5.2%, respectively.
Typically, the thermal decomposition of hemicellulose, cellulose, and lignin in an inert atmosphere takes place at 220–315, 290–400, and 100–900 °C, respectively [57,58]. Hemicellulose decomposes with two characteristic peaks at ~245 and ~296 °C, while cellulose decomposes at one stage with a maximum of ~345 °C. This means that the decomposition of cellulose occurs intensively in a shorter time than hemicellulose decomposition [48]. This suggests that visible on Figure 2a wood main decomposition at ~200–380 °C with a maximum at ~330 °C is related to hemicellulose and cellulose decomposition, wherein hemicellulose peak is not visible (lack of left shoulder). Some cellulose presence in the peat sample is also visible in the first main decomposition peak at ~325 °C. Nevertheless, lower mass losses in the peat sample at these temperatures suggest that there is a much lower amount of cellulose than in the wood. On the other hand, the studies [55,56] showed much different cellulose concentrations in the peats (1.5% vs. 46.7%). Therefore, there is a need to take caution to state that this decomposition was mainly related to cellulose. Nevertheless, continuous mass losses in both samples at temperatures higher than 400 °C are mainly related to lignin decomposition.
Because peat has a more complex organic matrix, its thermal degradation cannot be described only by three components such as typical biomass. The bitumens that may be constituents up to 10% of the peat [55] decompose in two stages [59]. The study of Murugan et al. [59] shows that the first stage starts at 80 °C and ends at 360 °C with a maximum peak at 295 °C, while the second stage starts at 360 °C and end at 540 °C with a maximum at 445 °C [59]. On the other hand, Santos et al. [60] analyzed humic and fulvic acid thermal degradation. The humic acid was characterized by multiple decomposition peaks at 280, 500, 575, 620, and 800 °C. In contrast, fulvic acid showed to be more resistant to thermal decomposition than humic acids. Fulvic acid was characterized by continuous mass loss with small decomposition peaks at 200, 310, and 545 °C, and one big decomposition peak at 920 °C [60]. These results suggest that bitumens and humic acids were partially responsible for the main decomposition of peat alongside cellulose and hemicellulose at 200–400 °C, and they are the main reason for visible right shoulder at 400–500 °C (Figure 2a). Moreover, Spedding [54] suggests that up to 110 °C free and absorbed water is evaporated from the peat. Above 110 °C, polymerizations of waxes and resins start and lead to a decrease in peat hydrophilic character. At temperatures higher than 160 °C, gases such as CO2 and CO and colloidally bound water start to be released. From 200 to 320 °C, cellulose, pentosans, and pectin decompose. Since these components contain bound oxygen in their structure, it results in additional water releasing during thermal decomposition, and next, at 280 °C, tars start to be generated alongside other gases.

3.2.2. Peat Thermal Decomposition Kinetics by Coats–Redfern

Table 2 contains kinetic data of peat thermal conversion. The analysis was performed in a nitrogen environment at a heating rate of 10 °C × min−1 using the Coats–Redfern method. The kinetic triplets were calculated for the whole process 30–800 °C and the decomposition peaks. The first peak in both samples is related to water and light volatile organic constituents’ removal [61]. The second peak is related to the main decomposition of compounds that were described in the previous paragraphs. The kinetics analysis revealed that for peat and wood, the first decomposition related to water evaporation was characterized by a reaction order of 3, with an activation energy of 27.11 and 6.67 kJ × mol−1, respectively. The analysis also showed that the main decomposition of peat had second reaction order with an activation energy of 33.34 kJ × mol−1, while wood main decomposition had a 1.68 reaction order with an activation energy of 65.47 kJ × mol−1. The overall whole decomposition process of peat turns out to have n of 1.33 with an Ea of 21.1 kJ × mol−1, while wood has n of 1.68 with 65.47 kJ × mol−1. All kinetic triplets had a high determination coefficient over 0.9. Only the first peat peak had a slightly lower value. The high value of determination coefficients means that the order of reactions and the activation energy were calculated properly.
The provided data cannot be directly compared with other kinetic studies because the peat composition is a complex matrix, and there are many different approaches for kinetics determination. For example, Chen et al. [62] analyzed decomposition kinetics of forest peat under nitrogen atmosphere and described it using reactions of four fractions: moisture, hemicellulose, cellulose, and lignin. The moisture removal had Ea of 61 kJ × mol−1 and n of 2.18. The hemicellulose, cellulose, and lignin had Ea of 90, 121, and 65 kJ × mol−1, respectively, while the reaction orders were 0.96, 0.85, and 2.31, respectively [62]. On the other hand, Wen et al. [63] analyzed peat moss decomposition and distinguished six stages related to observed decomposition peaks. For β = 10 °C × min−1 and CR method only stages 2–4 were determined at 136–309, 309–379, 379–611, and 611–652 °C. For these stages, the Ea changed from 71.3 to 1018.8 kJ × mol−1, while the reaction order changed from 0.6 to 2.6 [63]. Similarly, it is with wood. For example, Fraga et al. [64] analyzed the decomposition of wood using the CR method considering only a first-order reaction model (n = 1). The result showed that wood decomposes in two stages. The first stage occurred at 250–390 °C, while the second one was at 390–612 °C. The Ea for these stages were 190 and 117 kJ × mol−1, respectively [64]. Nevertheless, despite the differences in the observed values, and approaches, the results suggest relatively suitable predictions of conversion in these works.

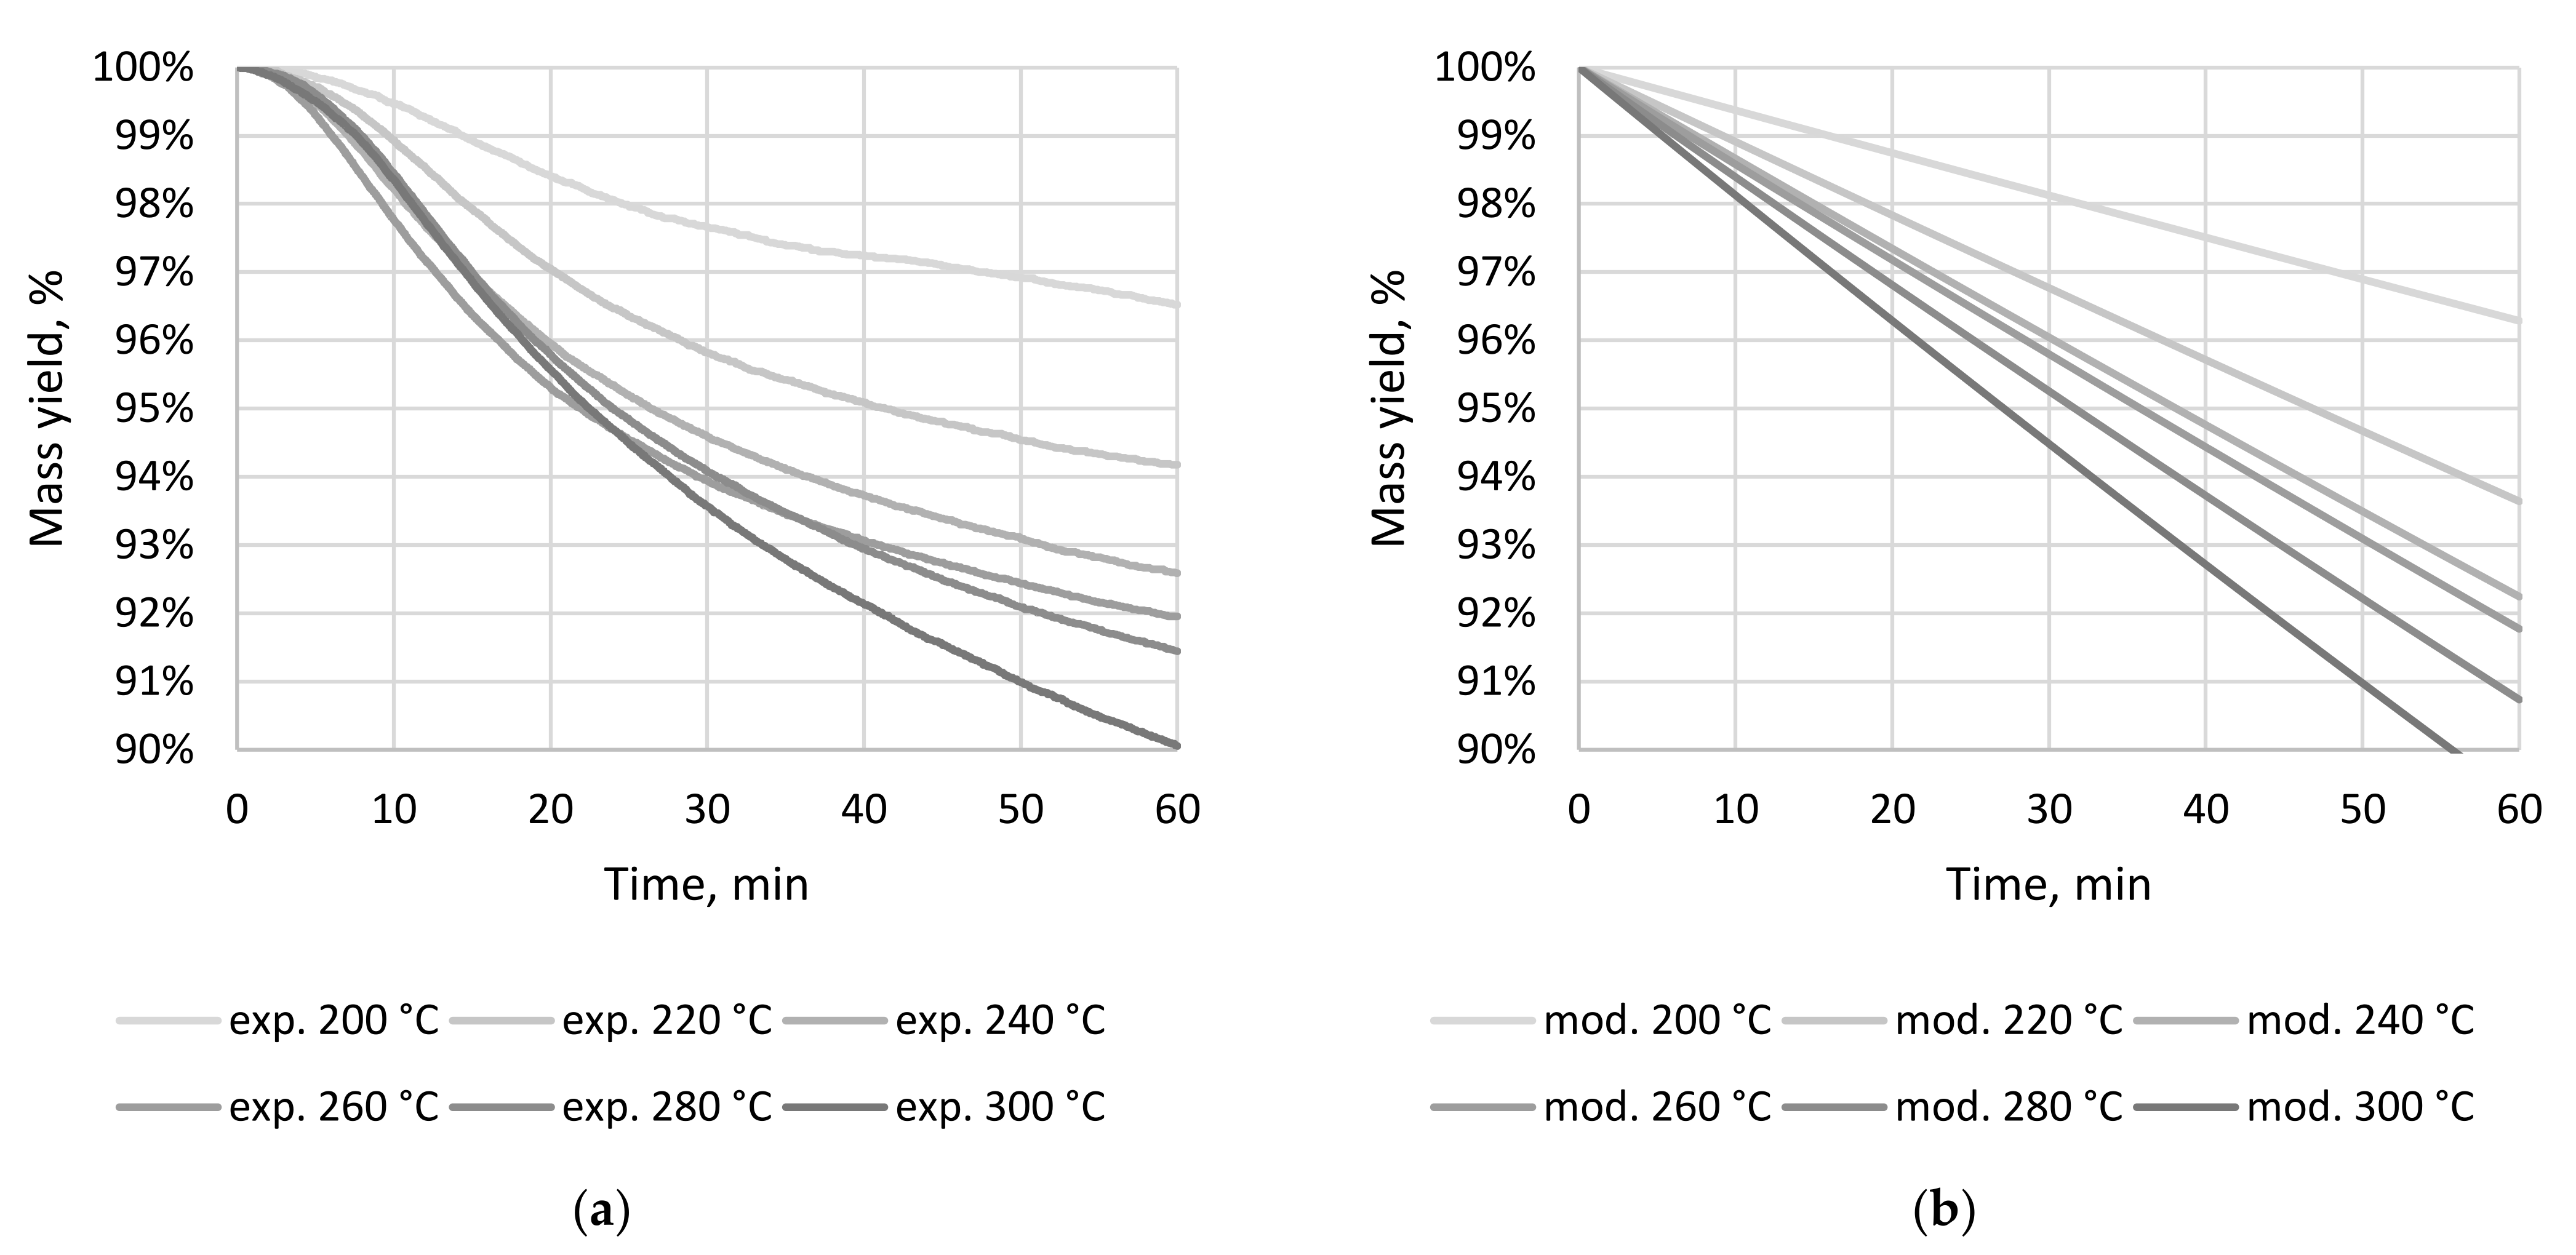
3.2.3. Peat Torrefaction Kinetics by an Isothermal Method

To compare the kinetics of tested peat at torrefaction temperature range, an isothermal experiment using macro-TGA (sample mass of 3 g) was performed according to previous work [41]. The dry peat was heated at temperatures of 200–300 °C (interval 20 °C) in 60 min, and then TG data were subjected for constant reaction rates with assumptions of the first-order decomposition. As a result, constant reaction rates (k) for specific temperatures were determined. The higher k, the higher mass losses are observed, or the same mass loss is obtained at a shorter time. Moreover, determined Ea and A can be used to calculate k for any torrefaction temperature. It was found that k values changed from 1.05 × 10⁻⁵ to 3.15 × 10⁻⁵ s−1 and that Ea and A were 22.02 kJ × mol−1 and 3.41 × 10⁻³ s−1, respectively (Table 3). The experimental mass loss in specific temperatures can be seen in Figure A2a, while mass loss predicted using calculated k values in Figure A2b. In the previous work [39], we summarized and recalculated serval waste material torrefaction kinetics by the same method. The graphic of k values at specific temperatures for wood refuse-derived fuel (RDF), sewage sludge, and digestate is shown in Figure A3. The result shows that peat decomposition is much slower than wood but faster than sewage sludge and digestate up to 260 °C. Torrefaction at over 260 °C is slower for peat than sewage sludge and digestate (Figure A3). Meanwhile, RDF torrefaction is slower than peat at all torrefaction temperatures (Figure A3). These results suggest that the thermal decomposition of peat is comparable with other waste materials but differs from the torrefaction of wood.

3.3. Theoretical Mass and Energy Balance

Table 4 consists of data regarding theoretical torrefaction energy and mass balance. The calculations were performed for peat and wood as reference material. The main goal of the calculations was to show the energy and mass fate during the production of 1 g of CSF at specific conditions. The first and second headings show torrefaction’s specific conditions for which calculations were performed. The third heading contains data of substrate mass used to produce 1 g of CSF at specific conditions. The fourth headings contain data of chemical energy contained in this substrate. The fifth heading is related to external energy provided to the substrate to perform the torrefaction process (here calculated using DSC results). The next one shows the energy contained in 1 g of CSF (here as HHV result). The seventh heading shows the mass of produced gas, and the last heading shows the energy contained in this gas.
The results show that with increasing temperature and time, the mass of substrate needed to produce 1 g of CSF increases. Demand for peat ranged from 1.025 to 1.446 g for 200 and 300 °C, while for wood substrate, demand range from 1.042 to 1.831 g. The required mass of peat is lower than in the case of the wood for all torrefaction conditions. It means that to produce the same amount of CSF, less peat is needed than wood. This is the result of mass yield and decomposition differences between processed materials, as raw peat is more humified material than wood.
With increasing substrate mass, increase the energy of the substrate used to produce a unit of CSF. Up to 260 °C, the differences in substrate chemical energy for peat and wood are negligible, but over 260 °C, much more chemical energy in the wood is consumed to produce 1 g of CSF. The biggest difference occurs at 280 °C in 60 min (24,497 Jsub × J−1CSF vs. 32,177 Jsub × J−1CSF for peat and wood, respectively). This is a result of the high decomposition rate of wood at these temperatures.
The DSC results showed that the external energy required to heat the substrate to setpoint temperature is slightly higher for peat than for wood. The external energy for peat differs from 179 to 633 J × J−1CSF, while for wood differs from 136 to 578 J × J−1CSF. The differences probably result from a difference in substrates composition and its specific heat. The specific heat of peat and wood depends on temperature and moisture. Assuming that both materials were completely dried, the peat should have a higher specific heat than wood because it required more energy. Nevertheless, results of specific heat in the literature provide overlapping data for peat and wood. For example, specific heat for dry peat differs from 0.9 to 1.3 J × (g × K)−1 [65] and for dry wood from 1.1 to 1.45 J × (g × K)−1 [66,67].
The results showed that for both materials, the energy contained in CSF increases with process temperature, which is mainly a result of oxygen removal in the devolatilization process [47]. As a result of progressing mass loss during torrefaction at higher temperatures, an increase in gas production is visible. The gas production for peat ranges from 0.025 to 0.446 g of gas per 1 g of CSF, while for wood, from 0.042 to 0.831 g of gas is produced per 1 g of CSF made from wood. Although, gas constitutes a significant amount as a by-product, especially at 300 °C. It contains much less energy than CSF. Nevertheless, when gas energy is higher than the external energy needed to produce CSF, the process may be self-sufficient (assuming gas combustion). In this study, the results suggest that the production of CSF from wood can be self-sufficient at any torrefaction conditions, while peat requires temperatures higher than 240 °C. However, cautions should be kept with that result interpretation because data show theoretical calculations for dry material and lack of energy losses related to the use of specific torrefaction technology. The peat used in this study had around 85% moisture content, and it can be easily calculated by using latent heat of evaporation (2257 J × g−1H2O at 100 °C). For water evaporation of 1% from any material, there is a demand for 22.57 J of additional energy (assuming dryer efficiency at 100%). It means that for the presented case (peat with 85% of moisture content) for each torrefaction condition, over 1918.5 J per processed gram of fresh peat should be added. As a result, any torrefaction conditions do not provide a self-sufficient process.
For the above, presented results are the initial step and base for future calculations when specific conditions and technology (moisture of processed substrate, drying technology, e.g., mechanical, conventional, solar, mixed drying, torrefaction process, e.g., batch or continuous reactors) will be considered. Furthermore, because the calculations were made with wood materials as a reference, currently available technology for wood torrefaction/pyrolysis can be easier recalculated and redesigned (if needed) for peat.
This paper presents the initial test on medical waste peat torrefaction. We intended to check the influence of temperature and residence time on the basic fuel properties of CSF. However, here we intend to draw the possible applications and needs for additional characterization of CSF. We recommend that the next experimental work should also cover more detailed characterization of CSF following techniques FTIR, XRD, SEM, TEM, and BET, to check other possible applications of CSF, i.e., soil additive, adsorbent.

4. Conclusions

In this work, for the first time, medical/cosmetic peat waste was torrefied, and the effect of torrefaction temperature and time on CSF quality was determined. Parallelly, decomposition of peat waste was determined according to the CR method using TGA equipment (temperature range 30–800 °C) and torrefaction kinetics using macro-TGA equipment (temperature range 200–300 °C) were determined. In addition, macro-TGA was used for lifetime prediction. Moreover, theoretical torrefaction mass and energy balances of peat waste were determined. As a result, the full process of peat torrefaction with its effects was presented. The main findings of performed analyses were:
  • Torrefaction improves fuel properties of peat, HHV increase from 19.0 to 21.3 MJ × kg−1;
  • Peat main decomposition takes place at 200–550 °C following second reaction order (n = 2), with an activation energy of 33.34 kJ × mol−1 and pre-exponential factor of 4.40 × 10⁻¹ s−1;
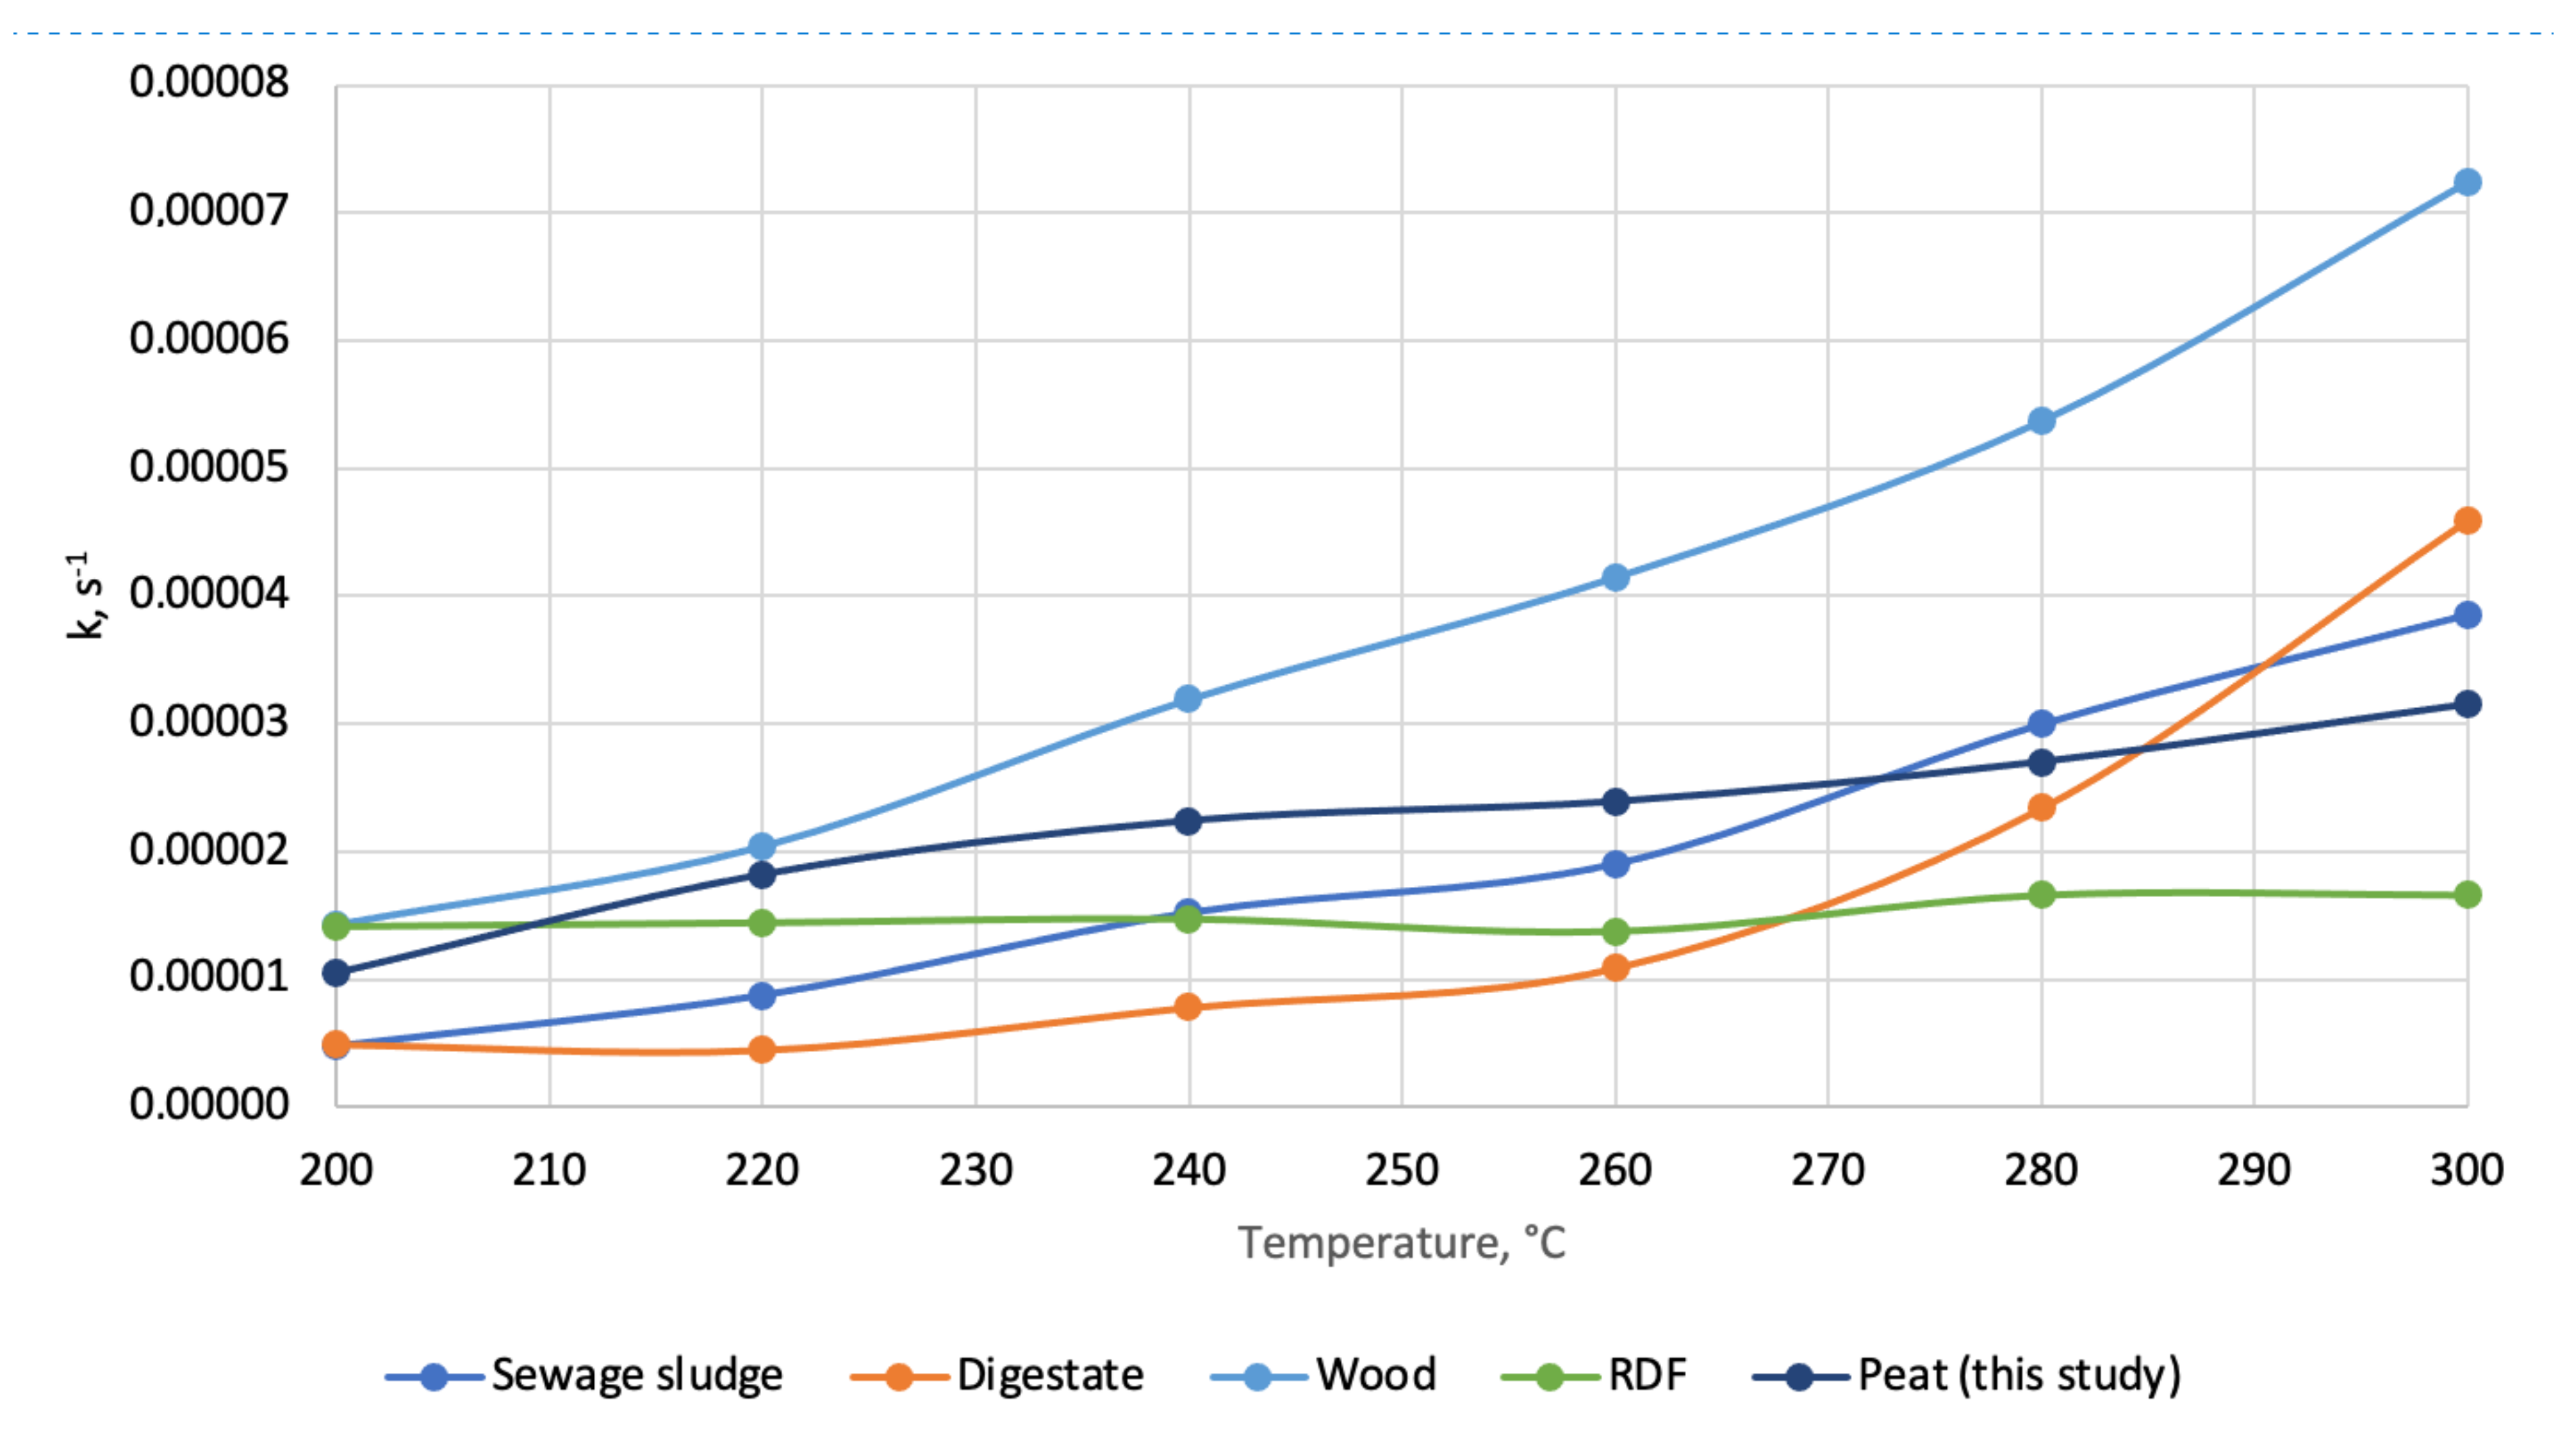
  • Macro-TGA shows that peat decomposition at torrefaction temperature is comparable with other waste materials but differs from wood, for which the constant reaction rates (k) are much lower;
  • Theoretically, torrefaction of dry peat can be self-sufficient at temperatures higher than 240 °C, but future calculations with specific technology need to be performed to find real conditions of self-sufficient peat processing.
Since peat has already been used worldwide, technologies of its use exist. Therefore, there should be no problem finding a place for CSF made from medical/cosmetic peat waste. Moreover, CSF has similar energetic properties to lignite, and as a result, it can be considered as co-fuel to the lignite incineration plant or for gasification for energy or hydrogen purposes. In addition, since biochars are used as partial replacements in agriculture, it may be an additional place for biochar made from peat. Whether medical peat waste will be used for energetic uses or agricultural one, the work provides useful information about its processing and main properties.
Another problem, which has not been arisen here, but should be further studied, is that the distribution of peat waste is very dispersed; therefore, small-scale torrefaction systems should be designed and tested.

Supplementary Materials

The following are available online at https://www.mdpi.com/article/10.3390/en14196053/s1.

Author Contributions

Conceptualization, K.Ś.; methodology, K.Ś.; software, K.Ś.; validation, K.Ś.; formal analysis, M.L.; investigation, M.L.; resources, A.B. and K.Ś.; data curation, K.Ś. and A.B.; writing—original draft preparation, K.Ś., M.L., and A.B.; writing—review and editing, K.Ś. and A.B.; visualization, K.Ś.; supervision, A.B. All authors have read and agreed to the published version of the manuscript.

Funding

The presented article results were obtained as part of the activity of the leading research team—Waste and Biomass Valorization Group (WBVG). The publication is financed under the Leading Research Groups support project from the subsidy increased for the period 2020–2025 in the amount of 2% of the subsidy referred to Art. 387 (3) of the Law of 20 July 2018 on Higher Education and Science, obtained in 2019.

Institutional Review Board Statement

Not applicable.

Informed Consent Statement

Not applicable.

Data Availability Statement

All data generated and used in the study is available in the article and Supplementary Materials.

Conflicts of Interest

The authors declare no conflict of interest.

Abbreviations

APre-exponential factor
ACAsh content
AICAkaike information criterion
ASTMAmerican Society for Testing and Materials
CSFCarbonized solid fuel
CPCombustible parts
CRCoats–Redfern method
DSCDifferential scanning calorimetry
EaActivation energy
EDrEnergy densification ratio
EUThe European Union
EYEnergy yield
FCFixed carbon
HHVHigh heating value
HTCHydrothermal carbonization
MCMoisture content
MYMass yield
nReaction order
PWPeat waste
R2Determination coefficient
SPA facilityA place devoted to a renewal of mind, body, and spirit by different methods
TGAThermogravimetric analysis
VMVolatile matter
VSVolatile solids

Appendix A

Table A1. Standards and methods used for fuel properties determination.
PropertiesStandard/MethodEquipment
(Manufacturer, Model, City, Country)
Ref.
Moisture content (MC)PN-EN 14346:2011Dryer (WAMED, model KBC-65W, Warsaw, Poland)[36]
Volatile matter (VM)TGA methodTGA—tubular furnace (Czylok, RST 40 × 200/100, Jastrzębie-Zdrój, Poland) coupled with a laboratory balance (RADWAG, PS 750.3Y, Warsaw, Poland)
Ash content (AC)PN-Z-15008-04:1993Muffle furnace (Snol 8.1/1100, Utena, Lithuania)
Fixed carbon (FC)by difference (calculation)-
Volatile solids (VS)PN-EN 15169:2011Muffle furnace (Snol 8.1/1100, Utena, Lithuania)
Combustible parts (CP)PN-Z-15008-04:1993Muffle furnace (Snol 8.1/1100, Utena, Lithuania)
High heating value (HHV)PN-Z-15008-04:1993Calorimeter (IKA, C200, Staufen, Germany)
Figure A1. Torrefaction temperature and time effect on properties of CSF produced from medical/cosmetic peat waste, the equations boundary, T = 200–300 °C, t = 20–60 min. (a) mass yield, (b) energy densification ratio, (c) energy yield, (d) volatile matter, (e) ash content, (f) fixed carbon, (g) volatile solids, (h) combustible parts, (i) high heating value.
Energies 14 06053 g0a1aEnergies 14 06053 g0a1bEnergies 14 06053 g0a1c
Figure A2. Results of macro-TGA, the effect of isothermal temperatures in time (a) experimental data, (b) lifetime prediction.
Energies 14 06053 g0a2
Figure A3. The constant reaction rates (k) in function of temperature for different materials at specific temperatures [39].
Energies 14 06053 g0a3

References

  1. Özay, P.; Karagülle, M.; Kardeş, S.; Karagülle, M.Z. Chemical and mineralogical characteristics of peloids in Turkey. Environ. Monit. Assess. 2020, 192, 805. [Google Scholar] [CrossRef] [PubMed]
  2. Leśniak, M. Management of Waste from Cosmetic Industry. Bachelor’s Thesis, Wrocław Univesristy of Envrionmental and Life Sciences, Wroclaw, Poland, 2021. [Google Scholar]
  3. Dudkiewicz, E. Disposal of the post-treatment mud in Polish spas. Gaz Woda i Technika Sanitarna 2015, 1, 25–28. [Google Scholar] [CrossRef]
  4. Sutejo, Y.; Saggaff, A.; Rahayu, W. Hanafiah physical and chemical characteristics of fibrous peat. In Proceedings of the 3rd International Conference on Construction and Building Engineering (Iconbuild) 2017: Smart Construction Towards Global Challenges, Palembang, Indonesia, 14–17 August 2017; AIP Conference Proceedings. American Institute of Physics Inc.: College Park, MD, USA, 2017; Volume 1903, p. 090006. [Google Scholar]
  5. Majcher-Kozieł, M. Borowina-właściwości lecznicze i kosmetologiczne. Chemia w Szkole 2013, 4, 42–44. [Google Scholar]
  6. Von Post Humification Scale. Available online: https://www.blacklandcentre.org/the-science/von-post-humification-scale/ (accessed on 8 August 2021).
  7. Drobnik, J.; Stebel, A. Central European ethnomedical and officinal uses of peat, with special emphasis on the Tołpa Peat Preparation (TPP): An historical review. J. Ethnopharmacol. 2020, 246, 112248. [Google Scholar] [CrossRef]
  8. History of Peat. Available online: https://peatmoss.com/what-is-peat-moss/the-history-of-peat/ (accessed on 11 August 2021).
  9. Kapetaki, Z.; Moya, J. Recent Trends in EU Coal, Peat and Oil Shale Regions; Publications Office of the European Union: Luxembourg, 2021. [Google Scholar]
  10. Kapetaki, Z.; Alves Dias, P.; Conte, A.; Kanellopoulos, K.; Mandras, G.; Medarac, H.; Nijs, W.; Ruiz, P.; Somers, J.; Tarvydas, D. Recent Trends in EU Coal, Peat and Oil Shale Regions; Publications Office of the European Union: Luxembourg, 2021. [Google Scholar]
  11. Tcvetkov, P.S. The history, present status and future prospects of the Russian fuel peat industry. Mires and Peat 2017, 19, 1–12. [Google Scholar] [CrossRef]
  12. Krysanova, K.O.; Krylova, A.Y.; Zaichenko, V.M. Application of hydrothermal carbonization to improve the energy properties of peat. Solid Fuel Chem. 2021, 55, 123–128. [Google Scholar] [CrossRef]
  13. Misnikov, O. Basic technologies and equipment used for peat deposits development in foreign countries. In E3S Web of Conferences, Proceedings of the 3rd International Innovative Mining Symposium, Kemerovo, Russia, 3–5 October 2018; EDP Sciences: Les Ulis, France, 2018; Volume 41. [Google Scholar]
  14. Dalias, P.; Prasad, M.; Mumme, J.; Kern, J.; Stylianou, M.; Christou, A. Low-cost post-treatments improve the efficacy of hydrochar as peat replacement in growing media. J. Environ. Chem. Eng. 2018, 6, 6647–6652. [Google Scholar] [CrossRef] [Green Version]
  15. Chrysargyris, A.; Prasad, M.; Kavanagh, A.; Tzortzakis, N. Biochar type and ratio as a peat additive/partial peat replacement in growing media for cabbage seedling production. Agronomy 2019, 9, 693. [Google Scholar] [CrossRef] [Green Version]
  16. Neumaier, D.; Lohr, D.; Voßeler, R.; Girmann, S.; Kolbinger, S.; Meinken, E. Hydrochars as peat substitute in growing media for organically grown potted herbs. Acta Hortic. 2017, 1168, 377–386. [Google Scholar] [CrossRef]
  17. Chen, B.; Koziel, J.A.; Lee, M.; O’Brien, S.C.; Li, P.; Brown, R.C. Mitigation of acute hydrogen sulfide and ammonia emissions from swine manure during three-hour agitation using pelletized biochar. Atmosphere 2021, 12, 825. [Google Scholar] [CrossRef]
  18. Kosov, V.V.; Sinelshchikov, V.A.; Sytchev, G.A.; Zaichenko, V.M. Effect of torrefaction on properties of solid granulated fuel of different biomass types. High Temp. 2014, 52, 907–912. [Google Scholar] [CrossRef]
  19. Tabakaev, R.; Astafev, A.; Dubinin, Y.; Yazykov, N.; Yakovlev, V. Evaluation of autothermal peat pyrolysis realization for fuel processing technologies. Waste Biomass Valorization 2019, 10, 1021–1027. [Google Scholar] [CrossRef]
  20. Zaitsev, A.S.; Taburchinov, R.I.; Ozerova, I.P.; Pereira, A.O.; Egorov, R.I. Allothermal gasification of peat and lignite by a focused light flow. Appl. Sci. 2020, 10, 2640. [Google Scholar] [CrossRef]
  21. Krysanova, K.; Krylova, A.; Zaichenko, V. Properties of biochar obtained by hydrothermal carbonization and torrefaction of peat. Fuel 2019, 256, 115929. [Google Scholar] [CrossRef]
  22. Dyjakon, A.; Noszczyk, T. Alternative fuels from forestry biomass residue: Torrefaction process of horse chestnuts, oak acorns, and spruce cones. Energies 2020, 13, 2468. [Google Scholar] [CrossRef]
  23. Chen, W.H.; Wang, C.W.; Ong, H.C.; Show, P.L.; Hsieh, T.H. Torrefaction, pyrolysis and two-stage thermodegradation of hemicellulose, cellulose and lignin. Fuel 2019, 258, 116168. [Google Scholar] [CrossRef]
  24. Wei, R.; Li, H.; Chen, Y.; Hu, Y.; Long, H.; Li, J.; Xu, C.C. Environmental issues related to bioenergy. In Reference Module in Earth Systems and Environmental Sciences; Elsevier: Amsterdam, The Netherlands, 2020. [Google Scholar]
  25. Basu, P. Biomass Gasification, Pyrolysis and Torrefaction; Elsevier: Amsterdam, The Netherlands, 2013; ISBN 9780123964885. [Google Scholar]
  26. Nizamuddin, S.; Baloch, H.A.; Griffin, G.J.; Mubarak, N.M.; Bhutto, A.W.; Abro, R.; Mazari, S.A.; Ali, B.S. An overview of effect of process parameters on hydrothermal carbonization of biomass. Renew. Sustain. Energy Rev. 2017, 73, 1289–1299. [Google Scholar] [CrossRef]
  27. Funke, A.; Ziegler, F. Hydrothermal carbonization of biomass: A summary and discussion of chemical mechanisms for process engineering. Biofuels Bioprod. Biorefining 2010, 4, 160–177. [Google Scholar] [CrossRef]
  28. Zaitchenko, V.M.; Krysanova, K.O.; Krysanov, O.N.; Sychev, G.A.; Krylova, A.Y. Effect of temperature on the torrefaction of peat. Solid Fuel Chem. 2018, 52, 70–72. [Google Scholar] [CrossRef]
  29. Nunes, L.J.R. A case study about biomass torrefaction on an industrial scale: Solutions to problems related to self-heating, difficulties in pelletizing, and excessive wear of production equipment. Appl. Sci. 2020, 10, 2546. [Google Scholar] [CrossRef] [Green Version]
  30. Shoulaifar, T.K. Chemical Changes in Biomass during Torrefaction; Åbo Akademi University: Turku, Finland, 2016. [Google Scholar]
  31. Rudolfsson, M.; Borén, E.; Pommer, L.; Nordin, A.; Lestander, T.A. Combined effects of torrefaction and pelletization parameters on the quality of pellets produced from torrefied biomass. Appl. Energy 2017, 191, 414–424. [Google Scholar] [CrossRef]
  32. Wang, L.; Riva, L.; Skreiberg, Ø.; Khalil, R.; Bartocci, P.; Yang, Q.; Yang, H.; Wang, X.; Chen, D.; Rudolfsson, M.; et al. Effect of torrefaction on properties of pellets produced from woody biomass. Energy Fuels 2020, 34, 15343–15354. [Google Scholar] [CrossRef]
  33. Agar, D.; DeMartini, N.; Hupa, M. Influence of elevated pressure on the torrefaction of wood. Energy Fuels 2016, 30, 2127–2136. [Google Scholar] [CrossRef]
  34. Ilnicki, P. Torfowiska i Torf. Recenzje 2004, 50, 203–207. [Google Scholar]
  35. Uzdrowisko Kołobrzeg, S.A. Medical Peat Brochure. Available online: https://spa.uzdrowisko.kolobrzeg.pl/borowina-lecznicza-1-kg-p-7.html (accessed on 26 August 2021).
  36. Syguła, E.; Świechowski, K.; Hejna, M.; Kunaszyk, I.; Białowiec, A. Municipal solid waste thermal analysis—Pyrolysis kinetics and decomposition reactions. Energies 2021, 14, 4510. [Google Scholar] [CrossRef]
  37. Świechowski, K.; Stępień, P.; Syguła, E.; Koziel, J.; Białowiec, A. Lab-scale study of temperature and duration effects on carbonized solid fuels properties produced from municipal solid waste components. Materials 2021, 14, 1191. [Google Scholar] [CrossRef] [PubMed]
  38. Hunt, J.; Ferrari, A.; Lita, A.; Crosswhite, M.; Ashley, B.; Stiegman, A.E. Microwave-specific enhancement of the carbon−carbon dioxide (Boudouard) reaction. J. Phys. Chem. 2013, 117, 26871–26880. [Google Scholar] [CrossRef]
  39. Świechowski, K.; Hnat, M.; Stępień, P.; Stegenta-Dąbrowska, S.; Kugler, S.; Koziel, J.A.; Białowiec, A. Waste to energy: Solid fuel production from biogas plant digestate and sewage sludge by torrefaction-process kinetics, fuel properties, and energy balance. Energies 2020, 13, 3161. [Google Scholar] [CrossRef]
  40. Noszczyk, T.; Dyjakon, A.; Koziel, J.A. Kinetic parameters of nut shells pyrolysis. Energies 2021, 14, 682. [Google Scholar] [CrossRef]
  41. Świechowski, K.; Stegenta-Dabrowska, S.; Liszewski, M.; Babelewski, P.; Koziel, J.A.; Białowiec, A. Oxytree pruned biomass torrefaction: Process kinetics. Materials 2019, 12, 3334. [Google Scholar] [CrossRef] [Green Version]
  42. Badour, C.; Gilbert, A.; Xu, C.; Li, H.; Shao, Y.; Tourigny, G.; Preto, F. Combustion and air emissions from co-firing a wood biomass, a Canadian peat and a Canadian lignite coal in a bubbling fluidised bed combustor. Can. J. Chem. Eng. 2012, 90, 1170–1177. [Google Scholar] [CrossRef]
  43. Al Tanjil, H.; Akter, S. Characterization of peat for identifying the effectiveness as energy source by proximate analysis. Petronelum Coal 2020, 62, 63–70. [Google Scholar]
  44. Świechowski, K.; Liszewski, M.; Babelewski, P.; Koziel, J.A.; Białowiec, A. Oxytree pruned biomass torrefaction: Mathematical models of the influence of temperature and residence time on fuel properties improvement. Materials 2019, 12, 2228. [Google Scholar] [CrossRef] [PubMed] [Green Version]
  45. Nunes, L.J.R.; Matias, J.C.O.; Loureiro, L.M.E.F.; Sá, L.C.R.; Silva, H.F.C.; Rodrigues, A.M.; Causer, T.P.; Devallance, D.B.; Ciolkosz, D.E. Evaluation of the potential of agricultural waste recovery: Energy densification as a factor for residual biomass logistics optimization. Appl. Sci. 2021, 11, 20. [Google Scholar] [CrossRef]
  46. Pulka, J.; Wiśniewski, D.; Gołaszewski, J.; Białowiec, A. Is the biochar produced from sewage sludge a good quality solid fuel? Arch. Environ. Prot. 2016, 42, 125–134. [Google Scholar] [CrossRef] [Green Version]
  47. Zhang, C.; Ho, S.-H.; Chen, W.-H.; Xie, Y.; Liu, Z.; Chang, J.-S. Torrefaction performance and energy usage of biomass wastes and their correlations with torrefaction severity index. Appl. Energy 2018, 220, 598–604. [Google Scholar] [CrossRef]
  48. Zhou, H.; Long, Y.; Meng, A.; Chen, S.; Li, Q.; Zhang, Y. A novel method for kinetics analysis of pyrolysis of hemicellulose, cellulose, and lignin in TGA and macro-TGA. RSC Adv. 2015, 5, 26509–26516. [Google Scholar] [CrossRef]
  49. Bhavsar, P.A.; Jagadale, M.H.; Khandetod, Y.P.; Mohod, A.G. Proximate analysis of selected non woody biomass. Int. J. Curr. Microbiol. Appl. Sci. 2018, 7, 2846–2849. [Google Scholar] [CrossRef]
  50. Słupska, M.; Dyjakon, A.; Stopa, R. Determination of strength properties of energy plants on the example of Miscanthus-Giganteus, Rosa Multiflora and Salix Viminalis. Energies 2019, 12, 3660. [Google Scholar] [CrossRef] [Green Version]
  51. Telmo, C.; Lousada, J.; Moreira, N. Proximate analysis, backwards stepwise regression between gross calorific value, ultimate and chemical analysis of wood. Bioresour. Technol. 2010, 101, 3808–3815. [Google Scholar] [CrossRef]
  52. Donahue, C.J.; Rais, E.A. Proximate analysis of coal. J. Chem. Educ. 2009, 86, 222. [Google Scholar] [CrossRef]
  53. Pettersen, R.C. The chemical composition of wood. In The Chemistry of Solid Wood; American Chemical Society: Washington, DC, USA, 1984; pp. 57–126. [Google Scholar]
  54. Spedding, P.J. Peat. Fuel 1988, 67, 883–900. [Google Scholar] [CrossRef]
  55. Iglovikov, A.; Motorin, A. Composition of organic matter in peat soils of the northern trans-Urals depending on groundwater level. In E3S Web of Conferences, Proceedings of the Innovative Technologies in Environmental Science and Education (ITESE-2019), Divnomorskoe Village, Russia, 9–14 September 2019; EDP Sciences: Les Ulis, France, 2019; Volume 135, p. 01004. [Google Scholar] [CrossRef]
  56. Brown, A.; Mathur, S.P.; Kauri, T.I.; Kushner, D.J. Measurement and significance of cellulose in peat soils. Can. J. Soil Science 1988, 68, 681–685. [Google Scholar] [CrossRef] [Green Version]
  57. Zhang, J.; Chen, T.; Wu, J.; Wu, J. A novel gaussian-DAEM-reaction model for the pyrolysis of cellulose, hemicellulose and lignin. RSC Adv. 2014, 4, 17513. [Google Scholar] [CrossRef] [Green Version]
  58. Yang, H.; Yan, R.; Chen, H.; Lee, D.H.; Zheng, C. Characteristics of hemicellulose, cellulose and lignin pyrolysis. Fuel 2007, 86, 1781–1788. [Google Scholar] [CrossRef]
  59. Murugan, P.; Mani, T.; Mahinpey, N.; Dong, M. Pyrolysis kinetics of athabasca bitumen using a TGA under the influence of reservoir sand. Can. J. Chem. Eng. 2012, 90, 315–319. [Google Scholar] [CrossRef]
  60. Santos, A.; Bertoli, A.; Borges, A.C.; Gomes, R.; Garcia, J.; Trevisan, M. New organomineral complex from humic substances extracted from poultry wastes: Synthesis, characterization and controlled release study. J. Braz. Chem. Soc. 2017, 29, 140–150. [Google Scholar] [CrossRef]
  61. Łyczko, J.; Masztalerz, K.; Lipan, L.; Iwiński, H.; Lech, K.; Carbonell-Barrachina, Á.A.; Szumny, A. Coriandrum Sativum L.—Effect of multiple drying techniques on volatile and sensory profile. Foods 2021, 10, 403. [Google Scholar] [CrossRef]
  62. Chen, H.; Zhao, W.; Liu, N. Thermal analysis and decomposition kinetics of Chinese forest peat under nitrogen and air atmospheres. Energy Fuels 2011, 25, 797–803. [Google Scholar] [CrossRef]
  63. Wen, Y.; Wang, S.; Mu, W.; Yang, W.; Jönsson, P.G. Pyrolysis performance of peat moss: A simultaneous in-situ thermal analysis and bench-scale experimental study. Fuel 2020, 277, 118173. [Google Scholar] [CrossRef]
  64. Fraga, L.G.; Silva, J.; Teixeira, S.; Soares, D.; Ferreira, M.; Teixeira, J. Thermal conversion of pine wood and kinetic analysis under oxidative and non-oxidative environments at low heating rate. Proceedings 2020, 58, 23. [Google Scholar] [CrossRef]
  65. Grishin, A.M.; Golovanov, A.N.; Sukov, Y.V. Experimental determination of thermophysical, thermokinetic, and filtration characteristics of peat. J. Eng. Phys. Thermophys. 2006, 79, 557–562. [Google Scholar] [CrossRef]
  66. Anusha, S.; Samarasekara, L.; Coorey, R.V. Thermal capacity as a function of moisture content of Sri Lankan wood species: Wheatstone bridge method. Proc. Tech. Sess. 2011, 27, 9–16. [Google Scholar]
  67. Nopens, M.; Sazama, U.; Krause, A.; Fröba, M. Specific heat capacity of wood between −140 and 50 °C in dry and wet state. Holzforschung 2021, 75, 779–785. [Google Scholar] [CrossRef]
Figure 1. Theoretical mass and energy balance of the torrefaction process, calculations procedure.
Energies 14 06053 g001
Figure 2. Thermal analysis results of (a) TG/DTG, (b) DSC.
Energies 14 06053 g002
Table 1. Results of CSF production and CSF properties.
Temp.TimeMY, %EDr, -EY, %VM, %AC, %FC, %VS, %CP, %HHV, J × g−1
00---59.314.426.383.085.619,013
2002097.61.03100.656.014.129.983.185.919,598
4097.31.05102.155.814.230.082.985.819,941
6097.11.04101.457.214.628.282.785.419,841
2202098.41.03101.556.814.129.083.285.919,619
4095.41.07101.756.314.329.482.885.720,272
6091.21.0697.055.015.229.781.984.820,217
2402096.71.0298.955.314.230.583.085.819,444
4090.71.0797.054.014.831.282.285.220,341
6087.71.0793.753.015.131.981.984.920,318
2602093.11.0597.554.314.731.082.485.319,922
4083.41.1091.349.316.933.880.083.120,836
6083.41.1393.949.117.033.979.883.021,419
2802081.11.0887.447.516.835.779.983.220,495
4079.91.1289.644.617.737.778.882.321,324
6077.61.1186.245.617.636.879.082.421,124
3002081.81.1191.044.717.338.079.482.721,163
4073.41.1282.240.318.541.277.781.521,315
6069.11.1075.938.120.341.675.879.720,873
Table 2. Kinetic triplets determined at β = 10 °C × min−1 using the Coats–Redfern method.
Material, -Note, -Temperature Range, °Cn, -Ea, kJ × mol−1A, s−1R2, -
PeatWhole process30–8001.3321.101.97 × 10−20.97
PeatFirst peak30–2003.0027.111.92 × 10−10.89
PeatMain decomposition peak200–5502.0033.344.40 × 10−10.99
WoodWhole process30–8001.5427.912.08 × 10−10.91
WoodFirst peak30–2003.006.676.86 × 10−50.99
WoodMain decomposition peak215–4301.6865.479.05 × 1020.98
Table 3. Torrefaction kinetic triplets for isothermal conditions (T = 200–300 °C, t = 60 min) considering a first-order reaction model.
Temperature, °Ck, s−1Ea, kJ × mol−1A, s−1R2, -Reference
Peat2001.05 × 10−522.023.41 × 10−30.894This study
2201.82 × 10−5
2402.24 × 10−5
2602.39 × 10−5
2802.70 × 10−5
3003.15 × 10−5
Wood2001.43 × 10−536.441.53 × 10−10.996[41]
2202.04 × 10−5
2403.19 × 10−5
2604.15 × 10−5
2805.37 × 10−5
3007.25 × 10−5
Table 4. Theoretical torrefaction mass and energy balance.
Temp. °CTime, minMass of Substrate Used to Produce 1 g of CSF, gEnergy Contained in the Raw Material Used to Produce 1 g of CSF, JExternal Energy Needed to Produce 1 g of CSF, J *Energy Contained in 1 g of CSF, J **Mass Of Gas Generated during the Production of 1 g of CSF, gEnergy Contained in Gas after Production of 1 g of CSF, J ***
PeatWoodPeatWoodPeatWoodPeatWoodPeatWoodPeatWood
200201.0251.04219,49119,06817913619,59818,5510.0250.04271654
401.0271.07119,53319,59617913619,94118,9600.0270.071−229773
601.0301.08819,57619,89817913619,84119,1780.0300.088−87856
220201.0161.06319,32619,44022418519,61918,7530.0160.063−70871
401.0491.12519,93920,58922418520,27219,3120.0490.125−1091462
601.0971.13920,84920,83022418520,21719,4400.0970.1398571575
240201.0341.14419,66620,93128925119,44419,4980.0340.1445111684
401.1031.25620,96522,98128925120,34120,0770.1030.2569133155
601.1411.29021,68523,60428925120,31820,3710.1410.29016573484
260201.0741.13320,42520,72037933619,92219,4560.0740.1338831600
401.1991.39122,80425,44237933620,83620,7670.1990.39123475011
601.2001.55422,80928,42837933621,41921,1360.2000.55417707627
280201.2331.30823,44723,93249544620,49520,4670.2330.30834473911
401.2521.53123,80928,01249544621,32421,4320.2520.53129807026
601.2881.75924,49732,17749544621,12421,6460.2880.759386810,976
300201.2231.62123,24829,65363357821,16321,4570.2230.62127188773
401.3631.82925,91833,45463357821,31522,0340.3630.829523611,998
601.4461.83127,49833,49363357820,87322,0020.4460.831725712,069
* Value determined using DSC analysis result; ** value determined using calorimetric analysis result (HHV); *** value is the sum of chemical energy contained in gas and heat from external energy, if no external energy stays in CSF.
Publisher’s Note: MDPI stays neutral with regard to jurisdictional claims in published maps and institutional affiliations.

