Article

Numerical Simulation on Impacts of Thickness of Nafion Series Membranes and Relative Humidity on PEMFC Operated at 363 K and 373 K

1
Division of Mechanical Engineering, Graduate School of Engineering, Mie University, 1577 Kurimamachiya-cho, Tsu 514-8507, Mie, Japan
2
School of Mechanical Engineering, The University of Adelaide, Adelaide, SA 5005, Australia
*
Author to whom correspondence should be addressed.
Energies 2021, 14(24), 8256; https://doi.org/10.3390/en14248256
Submission received: 11 November 2021 / Revised: 30 November 2021 / Accepted: 3 December 2021 / Published: 8 December 2021

Abstract

:
The purpose of this study is to understand the impact of the thickness of Nafion membrane, which is a typical polymer electrolyte membrane (PEM) in Polymer Electrolyte Membrane Fuel Cells (PEMFCs), and relative humidity of supply gas on the distributions of H2, O2, H2O concentration and current density on the interface between a Nafion membrane and anode catalyst layer or the interface between a Nafion membrane and cathode catalyst layer. The effect of the initial temperature of the cell (Tini) is also investigated by the numerical simulation using the 3D model by COMSOL Multiphysics. As a result, the current density decreases along with the gas flow through the gas channel irrespective of the Nafion membrane thickness and Tini, which can be explained by the concentration distribution of H2 and O2 consumed by electrochemical reaction. The molar concentration of H2O decreases when the thickness of Nafion membrane increases, irrespective of Tini and the relative humidity of the supply gas. The current density increases with the increase in relative humidity of the supply gas, irrespective of the Nafion membrane thickness and Tini. This study recommends that a thinner Nafion membrane with well-humidified supply gas would promote high power generation at the target temperature of 363 K and 373 K.

1. Introduction

The polymer electrolyte membrane fuel cell (PEMFC) is one of the promising fuel cell technologies which can use H2 as a fuel for co-generation system and vehicles. Recently, it has been conceived that H2 could be one procedure to realize the target of zero CO2 emissions by 2050 in Japan. Therefore, it is important to develop the efficient PEMFC system by 2050. It is important to develop the efficient PEMFC system as well as green H2 production in order to achieve the net target, i.e., a virtually zero CO2 emission in Japan by 2050. According to the Japanese New Energy and Industry Technology Development Organization (NEDO) road map 2017 [1], a PEMFC system is required to be operated at 363 K and 373 K for stationary and mobility applications, respectively, from 2020 to 2025. However, the normal PEMFC, which uses a Nafion membrane, is usually operated within a lower temperature range, between 333 K and 353 K [2,3]. If PEMFC is operated at a higher temperature than usual, the following advantages can be obtained: (1) promoting electrochemical kinetics in both electrodes, (2) reducing the cooling system for automobile applications due to an increase in the temperature difference between the PEMFC stack and coolant, and (3) endurance enhancement to CO in lower quality reformed H2 [4]. However, operating the PEMFC system at a higher temperature would present challenges, including: (1) degradation of Nafion membranes; (2) catalyst elution; (3) uneven distributions of gas flow, pressure, temperature, voltage and current in a cell of PEMFC. It is necessary to solve them in order to commercialize the PEMFC system operated at a higher temperature [5]. In addition, it is also believed that the temperature distribution influences the phase change of H2O and can influence the performance of the polymer electrolyte membrane (PEM), fuel and oxidant flows in gas diffusion layer (GDL) and catalyst layer at high temperatures. Consequently, it is necessary to analyze the heat and mass transfer mechanism in a cell of PEMFC in order to improve the power generation performance and achieve a longer operation time.
According to the literature on high-temperature PEMFC operated over 373 K, newly developed membranes which can be used at a high temperature include polybenzimidazole-based membrane [6] and bulky N-heterocyclic group functionalized poly (terphenyl piperidinium) membrane [7]. Regarding the development of new electrode, polytetrafluoroethylene (PTFE) binder dispersion [8] and 3D numerical simulation for the optimization of electrode thickness [9] have been reported. In addition, the optimization of the flow channel of a gas separator [10] and multi-objective optimization of operating conditions [11] are popular topics being studied. Mass transport phenomena in a cell such as distributions of H2, O2, and H2O concentration are also being investigated [12,13,14]. The temperature distribution on the back of the separator and the interface between PEM and the cathode catalyst layer has been investigated experimentally [15,16] and numerically [17,18], respectively, by the authors. Though the current density and temperature distribution were studied experimentally [19] and numerically [20] at the same time, there have been no reports investigating the distribution of H2, O2, H2O concentration and current density on the interface between PEM and the anode catalyst layer, where the H2 oxidation reaction occurs or the interface between PEM and the cathode catalyst layer where the O2 reduction reaction occurs. In addition, the previous numerical research [12,13,14] used the contour figure qualitatively. It is not enough to understand the mechanism of electrochemical reaction deciding the power generation performance of PEMFC. It is important to understand the characteristics on the interface between PEM and the anode catalyst layer where the H2 oxidization reaction occurs and the interface between PEM and the cathode catalyst layer where the O2 reduction reaction occurs quantitatively. Therefore, the analysis of these distributions is important to understand the electrochemical reaction and power generation characteristics of PEMFC. Therefore, the purpose of this study is to clarify the distributions of H2, O2, H2O concentration and the current density on the interface between the Nafion membrane, which is used as a typical PEM, and the anode catalyst layer or the interface between the Nafion membrane and cathode catalyst layer under a higher-temperature operation condition than usual. Some new membranes, e.g., polybenzimidazole-based membrane [6], have recently been developed for the high-temperature operation of PEMFC. However, it is easy to apply and commercialize the PEMFC system if the Nafion membrane can be used at a high temperature such as 363 K and 373 K. Numerical simulation using a 3D model by multi-physics simulation software COMSOL Multiphysics has also been carried out to achieve the aim of this study. In addition, the impact of the Nafion membrane thickness on these distributions has also been investigated. When the thinner Nafion membrane is used, lower Ohmic resistance as well as a higher proton flux ratio and back diffusion can be obtained [21,22,23]. Therefore, it is also important to investigate the effect of the Nafion membrane thickness on the distributions of H2, O2, and H2O concentration and current density on the interface between the Nafion membrane and anode catalyst layer or the interface between the Nafion membrane and cathode catalyst layer.

2. Numerical Modeling

2.1. Model Description and Governing Equations

This study has conducted the numerical analysis using a 3D model by multi-physics simulation software COMSOL Multiphysics. It has the simulation code for PEMFC composed of a continuity equation, the Brinkmann equation, considering the momentum transfer; the Maxwell–Stefan equation, considering the diffusion transfer; and the Butler–Volmer equation, considering the electrochemical reaction. This simulation code has been validated well by many previous studies [12,24,25,26].
The continuity equation considering the gas species in porous media such as the catalyst layer, micro porous layer (MPL), and GDL as well as in the gas channel is expressed as follows:
t ( ε p ρ ) + ( ρ u ) = Q m
where εp is the porosity ( ), ρ is the density (kg/m3), u is the velocity vector (m/s), Qm is the mass source term (kg/(m3 s)), and t is the time (s). The relationship between the pressure and gas flow velocity, which is solved in porous media such as the catalyst layer, MPL, and GDL, as well as in the gas channel, can be expressed by the following Brinkmann equation:
ρ ε p ( u t + ( u ) u ε p ) = p + [ 1 ε p { μ ( u + ( u ) T ) 2 3 μ ( u ) I } ] ( κ 1 μ + Q m ε p 2 ) u + F
where p is the pressure (Pa), μ is the viscosity (Pa s), I is the unit vector( ), κ is the permeability (m2), and F is the force vector (kg/(m2·s2)), e.g., gravity.
Mass transfer considering the diffusion, ion transfer, and convection transfer can be expressed by the following Maxwell–Stefan equation:
N i = D i C i z i u m , i F C i φ l + C i u = J i + C i u
C i t + N i = R i , t o t
where N i is the vector of the molar flow rate on the interface between PEM and electrode (mol/(m2 s)), Di is the diffusion coefficient (m2/s), Ci is the concentration of ion i (mol/m3), zi is the valence of ion ( ), um,i is the mobility of ion i ((s mol)/kg), F is the Faraday constant (C/mol), φl is the electrical potential of liquid [27] (V), J is the molar flow rate of the convection transfer (mol/(m2 s)), and Ri,tot is the reaction rate of species (mol/(m3 s)).
The electrochemical reaction is calculated following Butler–Volmer equation:
i = i 0 { exp ( α a F η R T ) exp ( α c F η R T ) }
η = φ s φ l E e q
where i is the current density (A/m2), i0 is the exchange current density (A/m2), αa is the charge transfer coefficient at anode ( ), η is the activation over-potential [27] (V), R is the gas constant (J/(mol K)), T is the temperature (K), αc is the charge transfer coefficient at cathode ( ), φs is the electrical potential of solid [27] (V), Eeq is the equilibrium electric potential [27] (V).
Figure 1 illustrates 3D model of single cell of PEMFC. This structure follows the commercialized single cell used in the previous experimental study [16]. In this model, the outside of the roof of gas separator at anode and cathode sides are omitted. This single cell has a gas separator having a serpentine flow channel which consists not only of five gas channels with the width of 1.0 mm and depth of 1.0 mm but also a rib with a width of 1.0 mm. Table 1 lists the geometrical parameters of the 3D model used in this study. Nafion 115, Nafion NRE-212, and Nafion NRE-211, whose thicknesses are 127 μm, 51 μm, and 25 μm, respectively, have been investigated to assess the impact of the thickness of the Nafion membrane on the distributions of H2, O2, and H2O concentrations and the current density. Physical parameters and operation conditions for numerical simulation in this study are listed in Table 2 and Table 3, respectively. Tini is changed by 353 K, 363 K, and 373 K. This study has conducted the numerical simulation at Tini = 353 K showing the characteristics at a standard operation temperature to compare the characteristics at a higher temperature. The relative humidity of supply gas at the anode and cathode is changed by 40%RH and 80%RH, respectively. The flow rate of supply gas is set at the stoichiometric ratio of 1.5, where the volume flow rate of supply gas at the anode and cathode is 0.210 NL/min and 0.105 NL/min, respectively. The stoichiometric ratio of 1.0 for the flow rate of supply gas can be defined by Equation (7).
C H 2 = I z H 2 F
where CH2 is the molar flow rate of consumed H2 (mol/s), I is the loaded current (A) and zH2 is the electrons moles exchanged in the reaction (=2) ( ). CH2 is the molar flow rate corresponding to the stoichiometric ratio of 1.0. The CO2 is the molar flow rate of consumed O2 (mol/s), which is a half of CH2 (which can be defined by Equation (8)).
H2 + 1/2 O2 = H2O
In this study, O2 is adopted as the cathode gas. In the near future, it can be expected that H2 will be produced from renewable energy via H2O electrolyzer mainly in order to realize a zero-CO2-emission society. After the production of H2 by H2O electrolysis, O2 is also produced as a by-product. This study suggests that not only H2 but also O2 produced from H2O electrolysis are used for PEMFC. The total system consisting of renewable energy, H2O electrolyzer, and PEMFC can be operated effectively by using O2. In addition, if we use O2 as a cathode gas, we can obtain a higher current density on the interface between PEM and the catalyst layer, especially under the rib, compared to the case using air [28]. This is due to the decrease in over-potential by the increase in the concentration of O2. Therefore, it can be expected that higher power generation performance is obtained by using O2. They are the reasons why this study adopts pure O2 instead of air.

2.2. Model Assumption

This study considers the following assumptions:
(i)
The distributions of the inlet gas flow rate at the anode side and cathode side are uniform, respectively.
(ii)
The pressure of the outlet of the gas channel is the atmospheric pressure.
(iii)
No slip on the gas channel wall excluding the inlet and the outlet of the gas channel is considered.
(iv)
The cell voltage obtained by the power generation experiment is set at the cathode electrode and the earth ground is set at the anode electrode. The in-plane distribution of cell voltage at the cathode electrode is uniform.
(v)
Reactant gases are treated as an ideal gas and incompressible Newton fluid.
(vi)
H2O is treated as a vapor.
(vii)
The cell temperature is uniform and the outside boundary of the 3D model is set at Tini.
(viii)
The effective porosity and the permeability of the porous media are isotropic. The conductivity in the porous media is also isotropic.
The impact of the Nafion membrane thickness, Tini, and relative humidity of the supply gas on the distributions of the molar concentration of H2, O2, and H2O and current the density on the interface between the Nafion membrane and anode catalyst layer or the interface between the Nafion membrane and cathode catalyst layer has been investigated, considering the above-described equations and parameters as well as the assumptions.

3. Results and Discussion

3.1. In-Plane Distribution of Mass and Current Density on the Interface between Nafion Membrane and Anode Catalyst Layer or the Interface between Nafion Membrane and Cathode Catalyst Layer

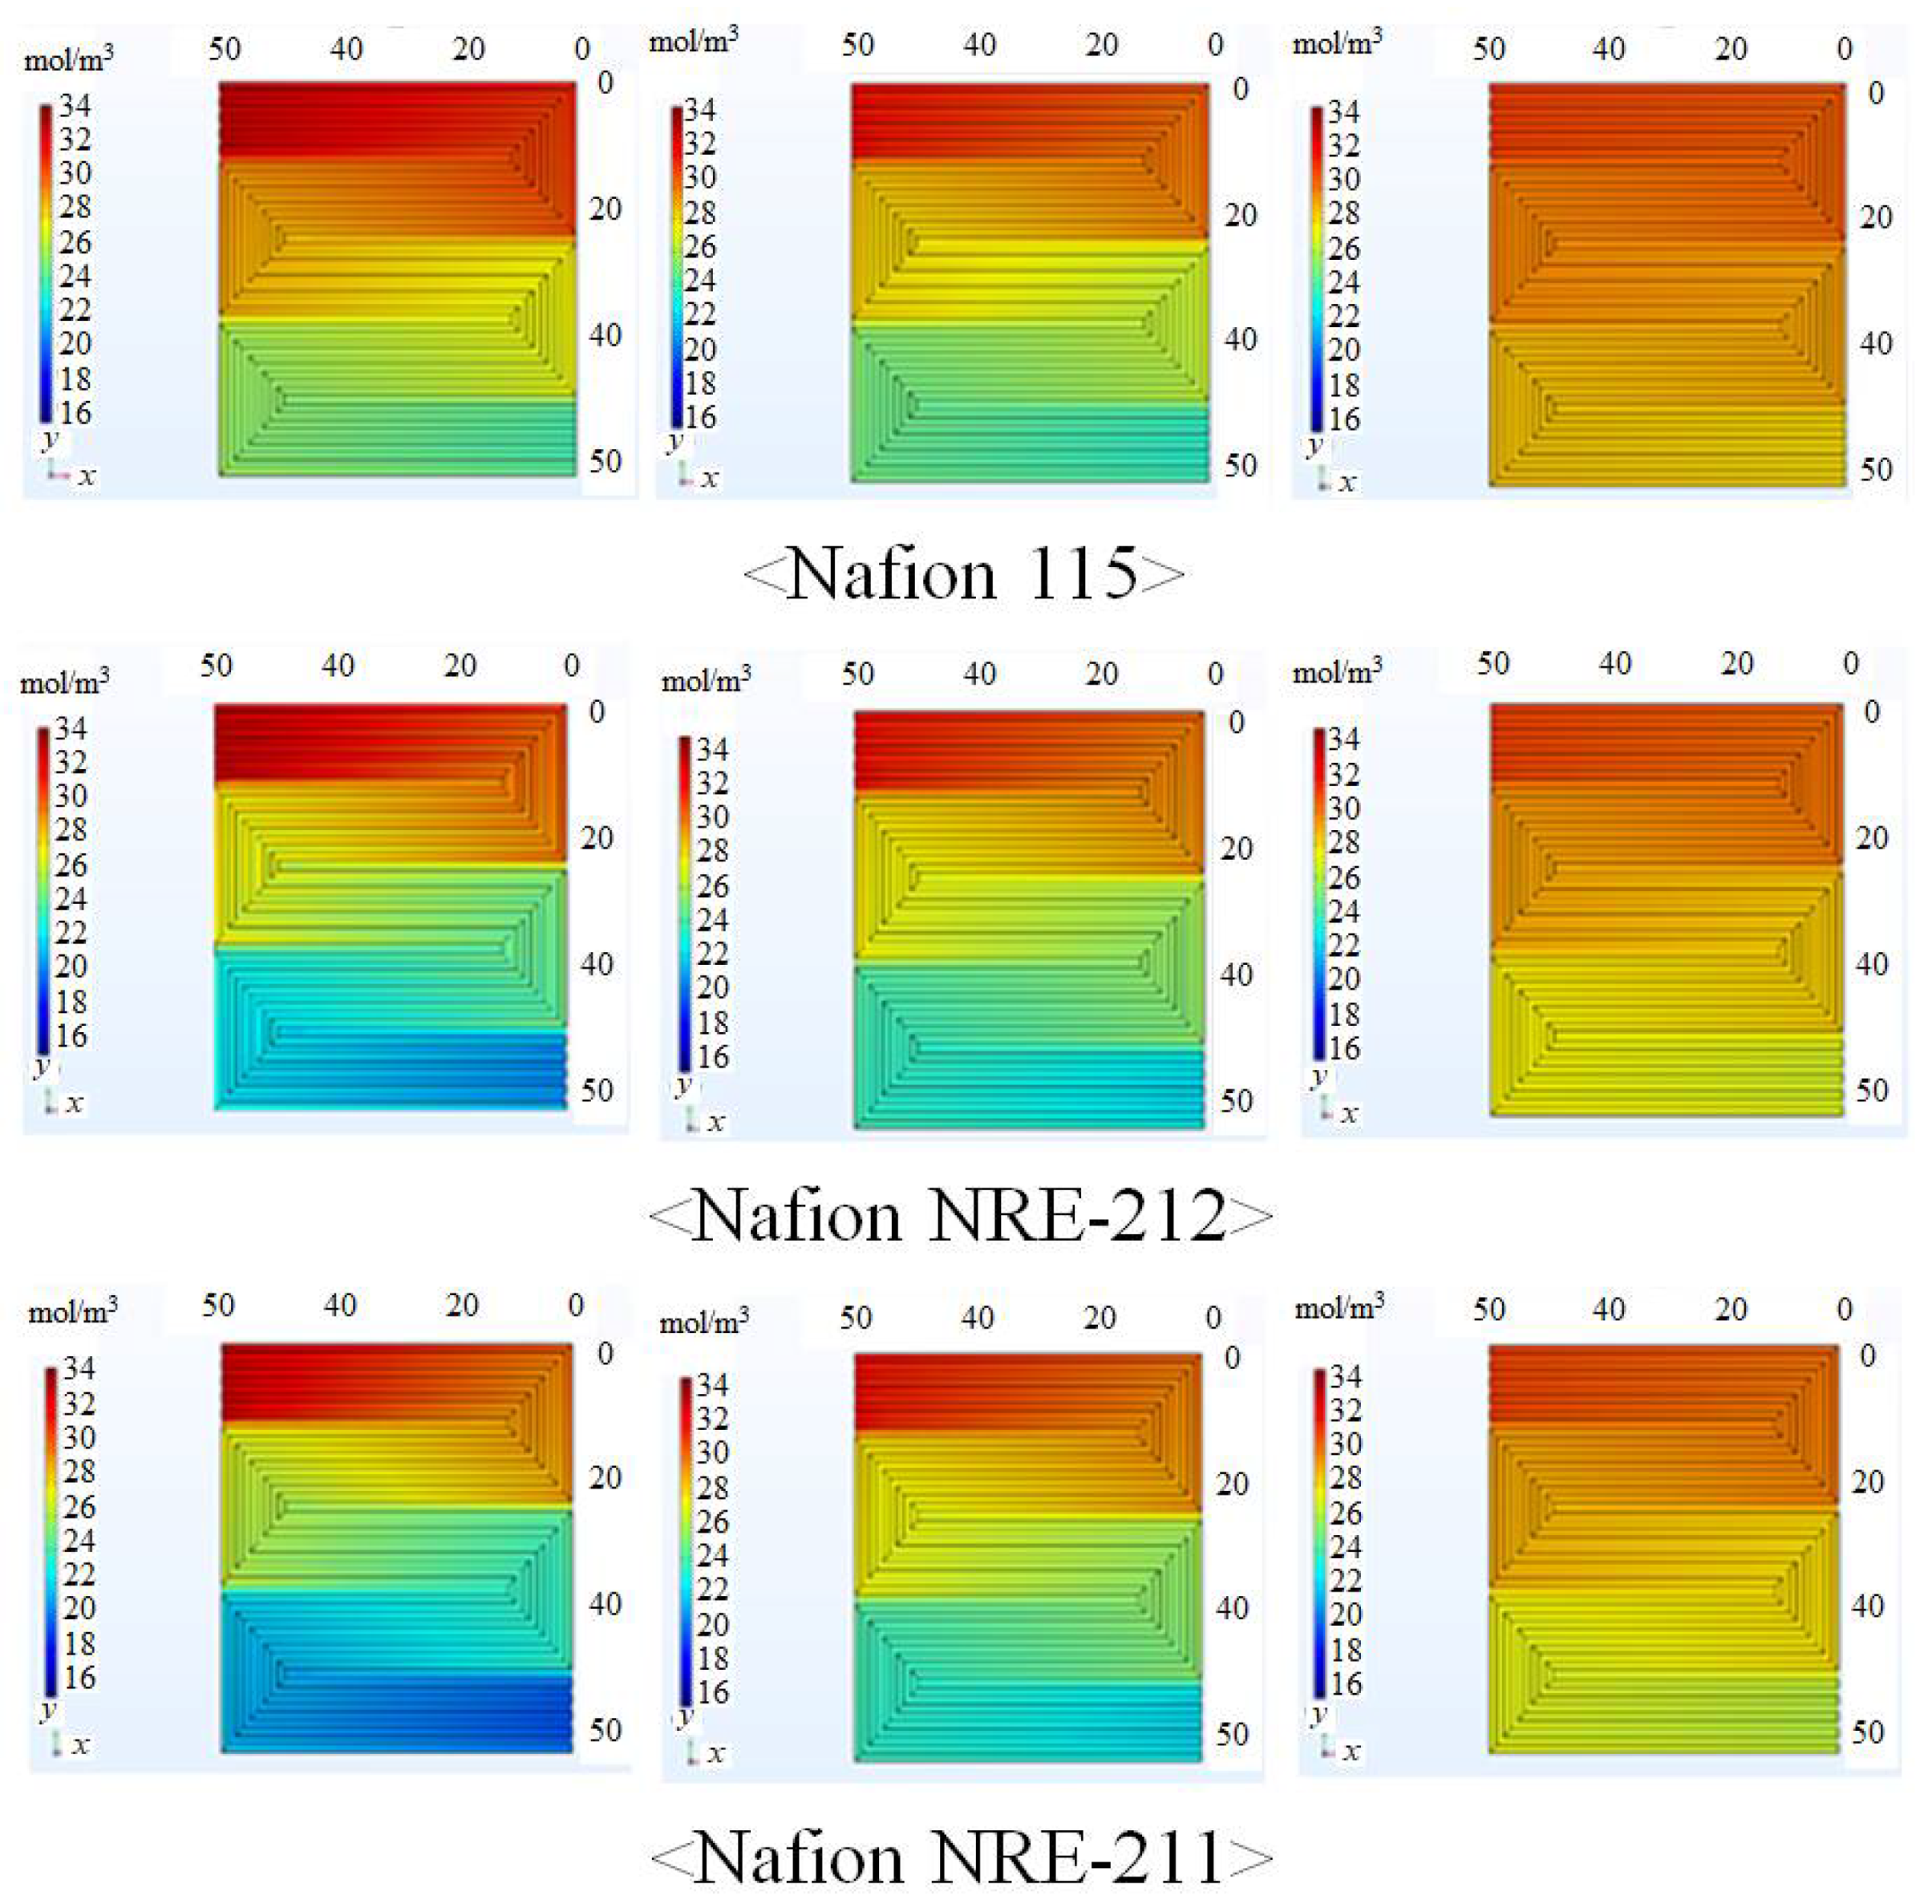
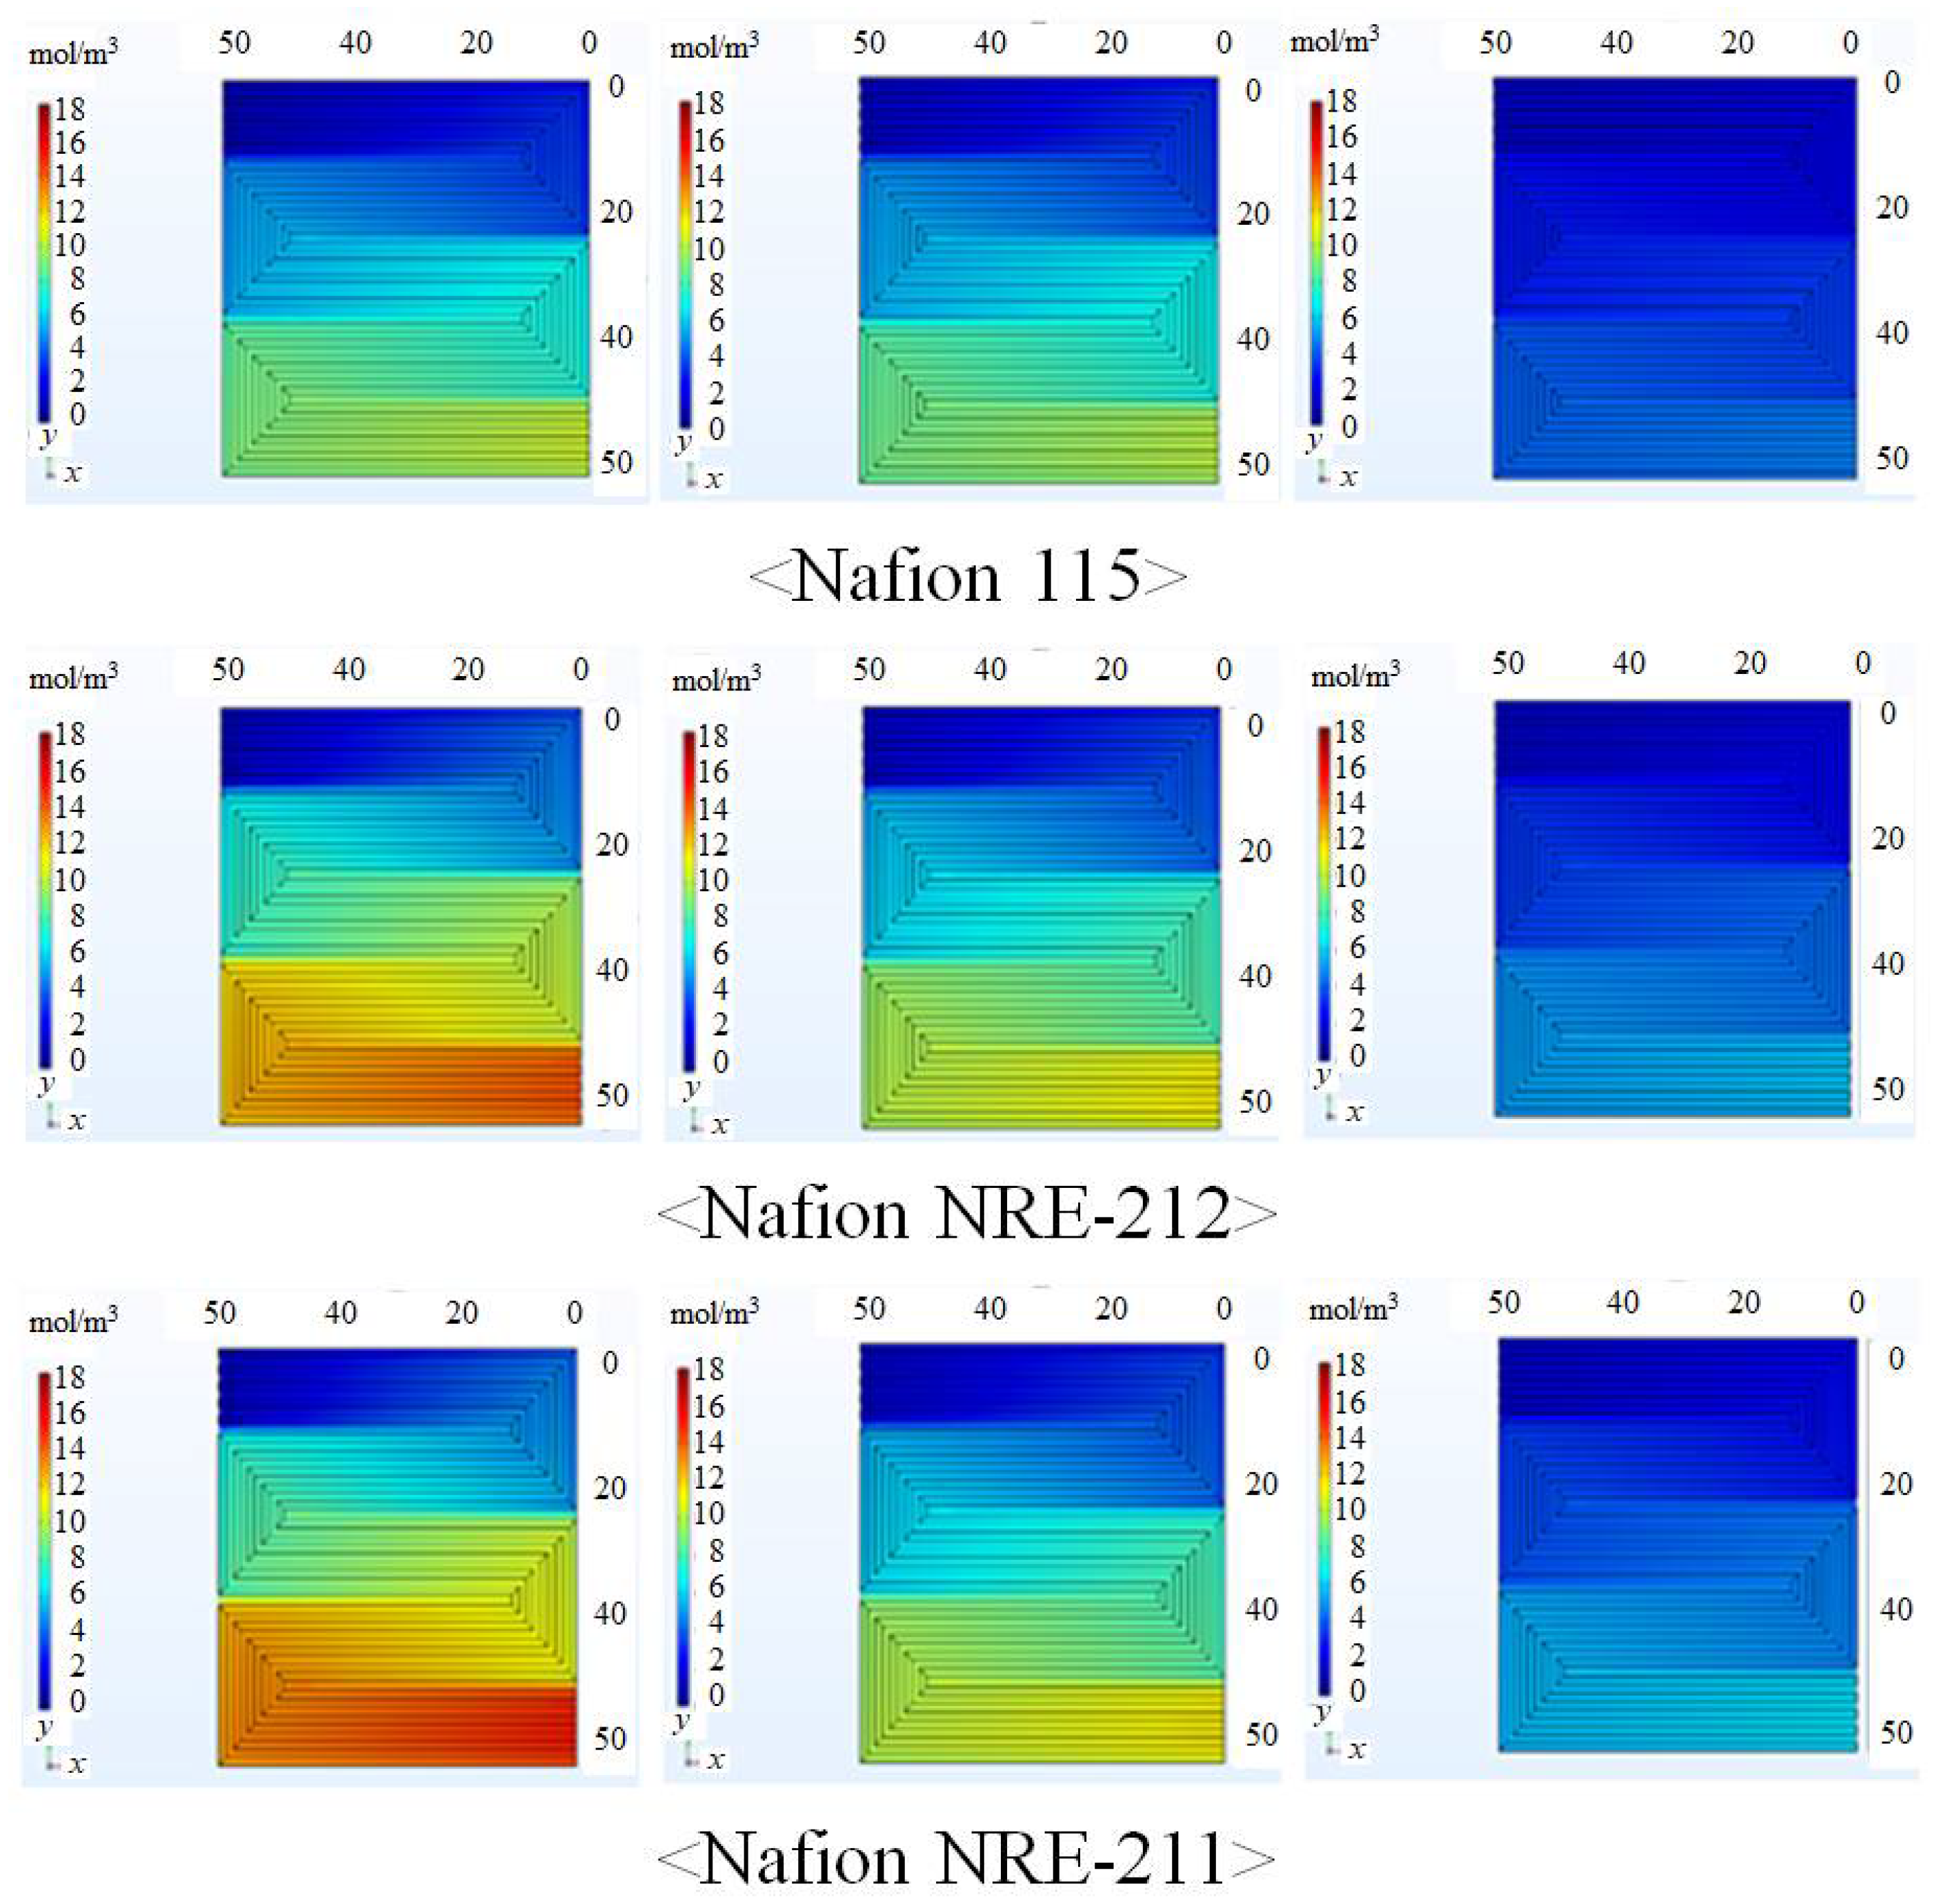
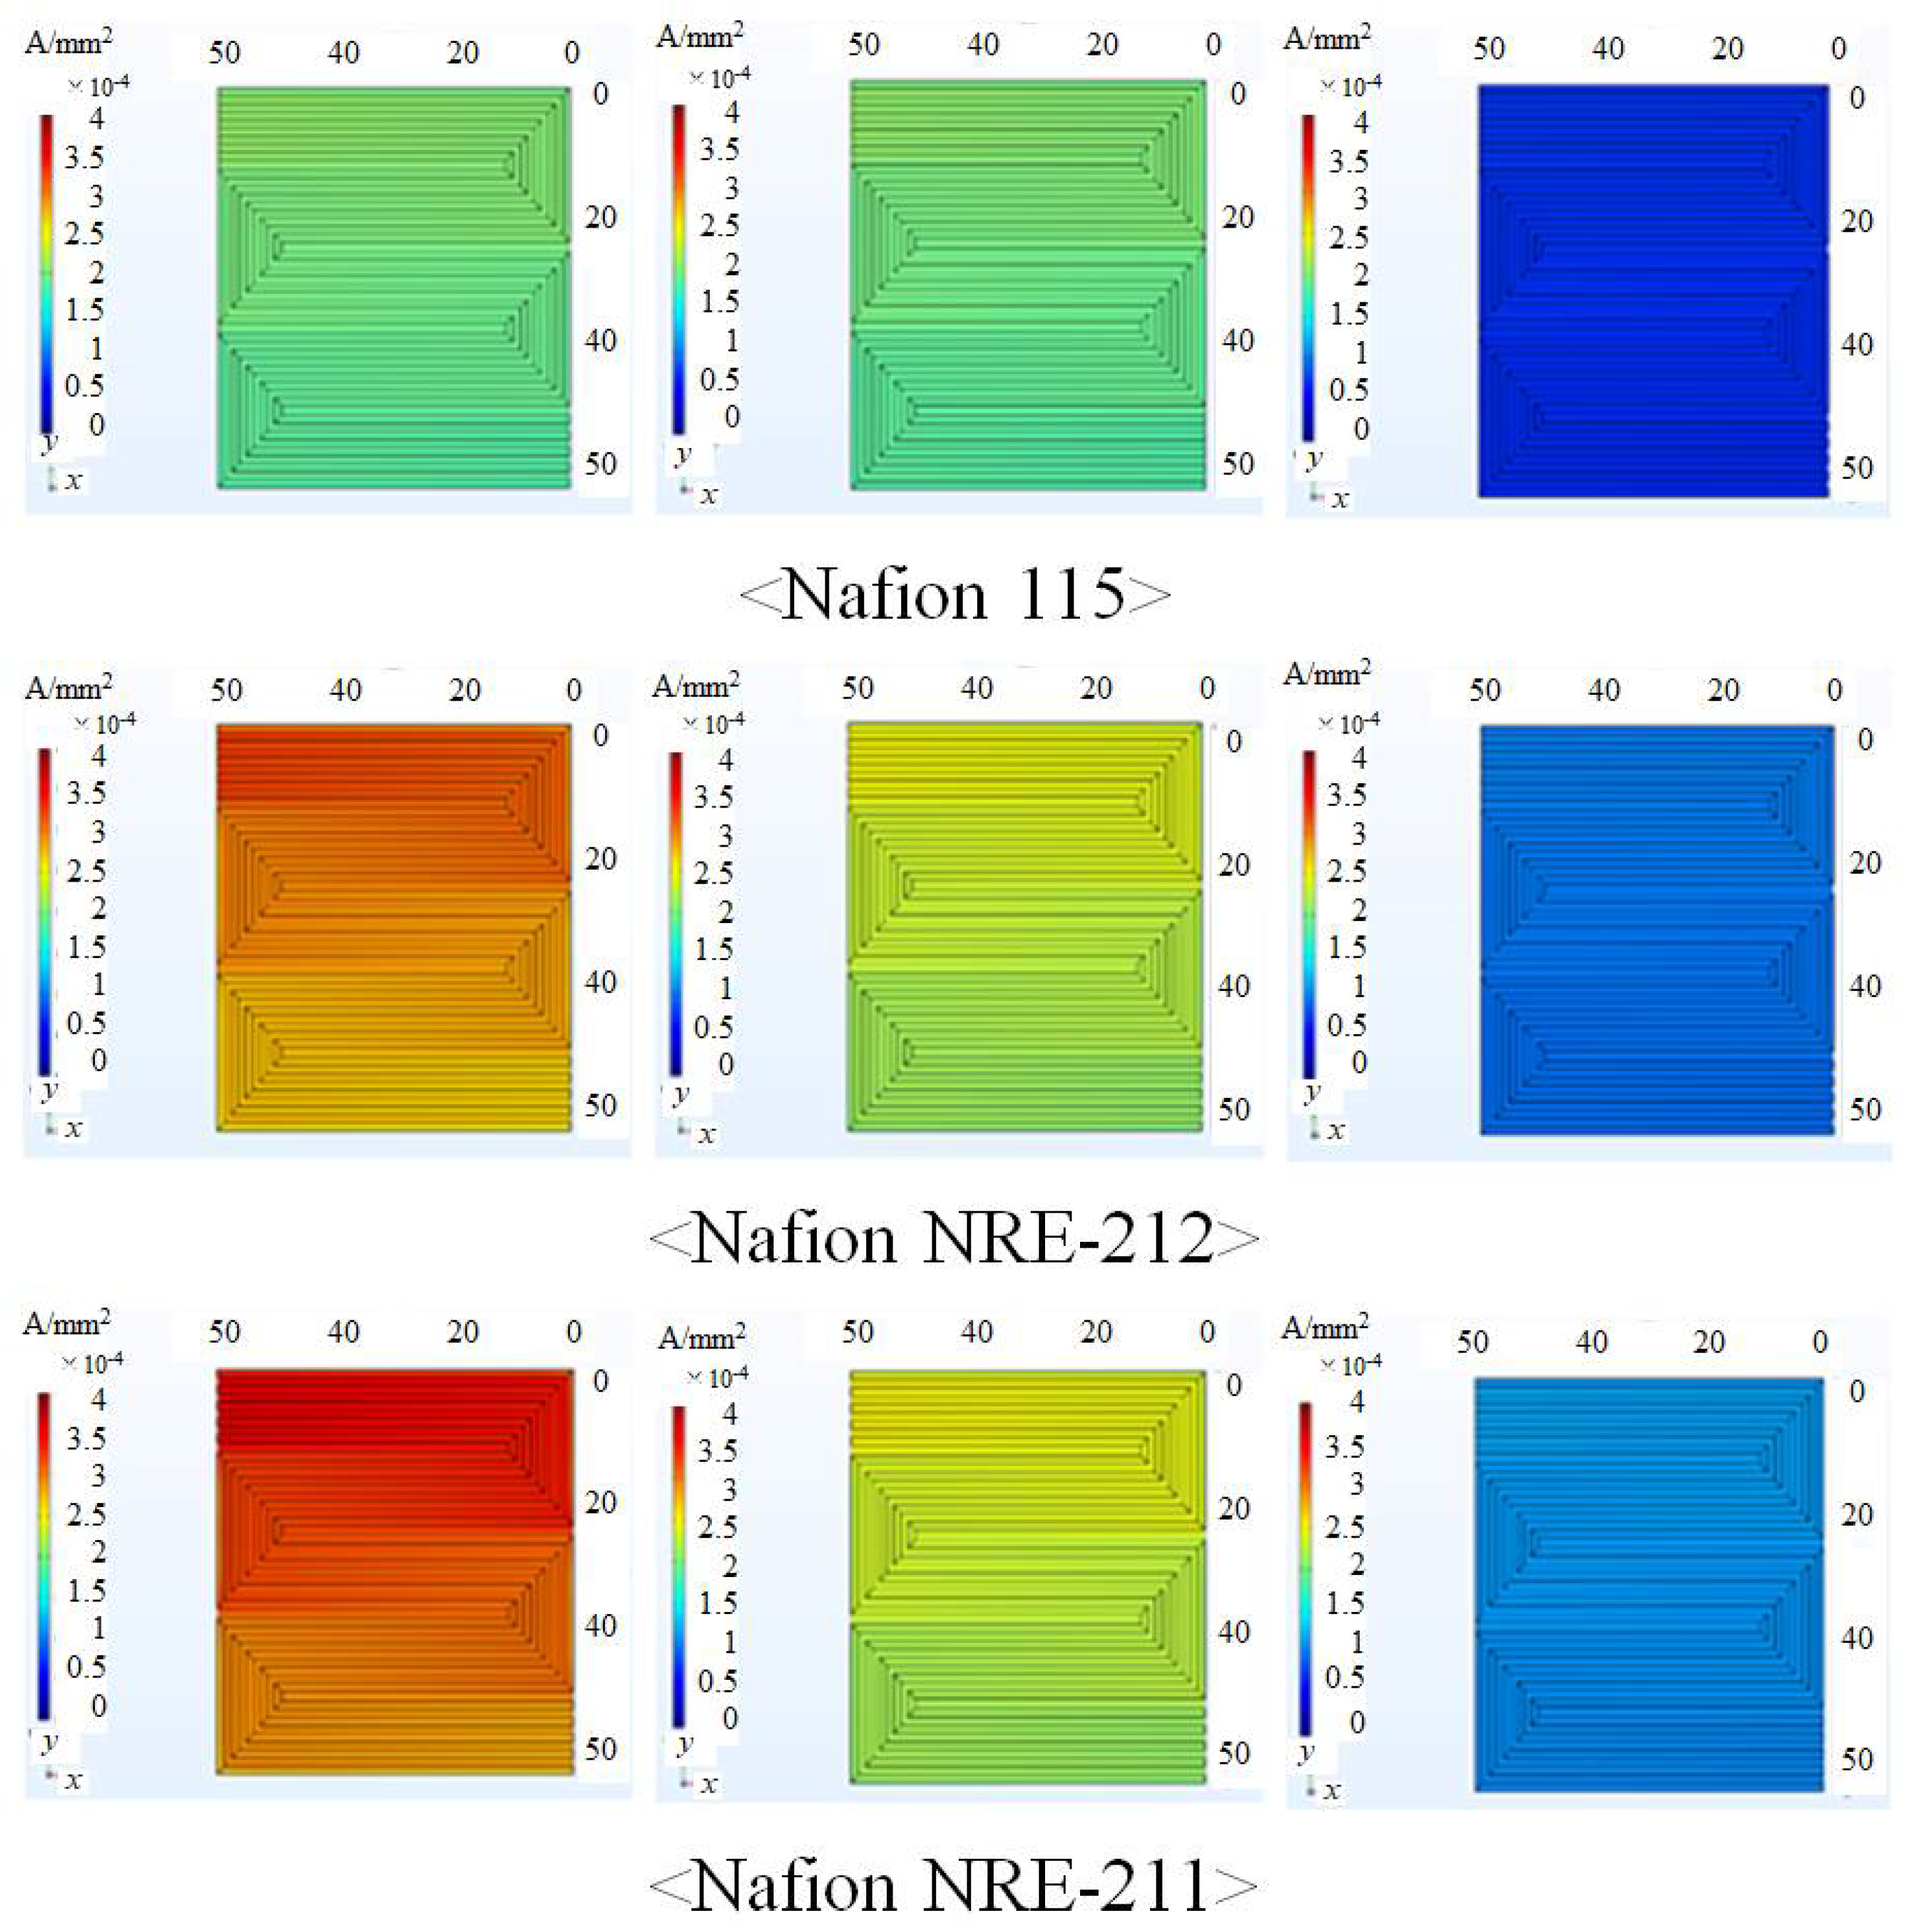
Figure 2 shows the comparison of the in-plane molar concentration distribution of H2 on the interface between the Nafion membrane and anode catalyst layer with a different Nafion membrane and Tini for the relative humidity of the supply gas of the anode of 80%RH and cathode of 80%RH (A80%RH&C80%RH). Figure 3, Figure 4 and Figure 5 show the comparisons of in-plane molar concentration distribution of O2 and H2O and in-plane distribution of the current density on the interfaces, respectively.
According to Figure 2, it is found that the molar concentration of H2 decreases along with the gas flow through the gas channel irrespective of the Nafion membrane thickness and Tini due to the uniform consumption rate of H2 caused by the high permeability through porous media [12]. In addition, it is known that the molar concentration of H2 decreases more with the increase in Tini, irrespective of the Nafion membrane thickness. The molar concentration is defined by dividing the molar quantity of gas species by its volume. Since the gas volume increases when Tini increases, the molar concentration of H2 would decrease with the increase in Tini.
It is seen from Figure 3 that the molar concentration of O2 decreases along with the gas flow through the gas channel irrespective of the Nafion membrane thickness and Tini. It is found that the O2 reduction reaction progresses along with the gas flow through the gas channel. According to Figure 3, the amount of O2 consumption from the inlet to the outlet is the largest at Tini = 353 K, irrespective of the Nafion membrane thickness. The kinetics of the catalyst are faster with the increase in temperature, while the relative humidity influences the performance of the O2 reduction reaction occurring on the ionomer in the cathode catalyst layer [40]. There is the optimum H2O saturation of ionomer in the cathode catalyst layer. On the other hand, the proton conductivity of the Nafion membrane is influenced by the temperature and relative humidity. According to the literature [41,42], the proton conductivity of the Nafion membrane increases with the increase in temperature as well as the increase in relative humidity. Since the saturation pressure of H2O vapor increases with the temperature exponentially [43], it is easy to dehydrate the Nafion membrane at Tini = 373 K compared to Tini = 353 K, resulting in the proton conductivity of the Nafion membrane decreasing at Tini = 373 K. If the proton conductivity of the Nafion membrane decreases, the performance of the O2 reduction reaction drops due to a lack of proton. In addition, since the hydration of the Nafion membrane is not enough at Tini = 373 K, the high O2 partial pressure is needed to progress the O2 reduction reaction [43]. Consequently, it is thought that the amount of O2 consumption decreases at Tini = 373 K. The proton conductivity of the Nafion membrane increases when the temperature increases, even at a temperature above 373 K [40]. However, we have to consider the degradation of the Nafion membrane under the dehydrated condition [44]. Therefore, it is a challenging issue to control the humidification of the Nafion membrane at a temperature above 373 K.
It is seen from Figure 4 that the molar concentration of H2O increases along with the gas flow through the gas channel, irrespective of the Nafion membrane thickness and Tini. This result matches with Figure 3 from the viewpoint of the O2 reduction reaction which produces H2O at the cathode. According to Figure 4, the amount of H2O produced from the inlet to the outlet is the largest at Tini = 353 K, irrespective of the Nafion membrane thickness. The reason why this result is obtained can be explained by the above discussion in Figure 3.
According to Figure 5, the current density decreases along with the gas flow through the gas channel, irrespective of the Nafion membrane thickness and Tini. The molar concentrations of H2 and O2 are the highest at the inlet, respectively, and they decrease along with the gas flow through the gas channel, as shown in Figure 2 and Figure 3, indicating that the electrochemical reaction progresses along with the gas flow through the gas channel. In addition, the current density is the largest at Tini = 353 K among different Tini. Moreover, it is evident that the current density decreases with an increase in the thickness of the Nafion membrane. The authors of this study argue that we have to consider the kinetics of catalyst as well as proton conductivity of Nafion membrane for the discussion of this phenomena. The kinetics of the catalyst are faster with an increase in temperature, while the relative humidity influences the performance of the O2 reduction reaction occurring on the ionomer in the cathode catalyst layer [40]. There is an optimum H2O saturation of ionomer in the cathode catalyst layer. On the other hand, the proton conductivity of the Nafion membrane is influenced by the temperature and relative humidity. According to the literature [41,42], the proton conductivity of the Nafion membrane increases with the increase in temperature as well as the increase in relative humidity. Since the saturation pressure of H2O vapor exponentially increases with the temperature [43], it is easy to dehydrate the Nafion membrane at Tini = 373 K compared to Tini = 353 K, resulting in the proton conductivity of the Nafion membrane decreasing at Tini = 373 K. If the proton conductivity of the Nafion membrane decreases, the performance of the O2 reduction reaction drops due to a lack of proton. In addition, since the hydration of the Nafion membrane is not enough at Tini = 373 K, the high O2 partial pressure is needed to progress the O2 reduction reaction [43]. As a result, it is thought that the amount of O2 consumption decreases at Tini = 373 K. The concentration over-potential increases with a decrease in the O2 consumption, resulting in the current density decreasing as Tini = 373 K. In addition, the ohmic loss due to the proton conductivity of the Nafion membrane increases when thickness of the Nafion membrane increases [45]. Consequently, the current density in the case with Nafion 115 at Tini = 373 K is smaller compared to the other conditions.

3.2. Quantitative Evaluation along with the Gas Flow through the Gas Channel on Mass and Current Density on the Interface between Nafion Membrane and Cathode Catalyst Layer

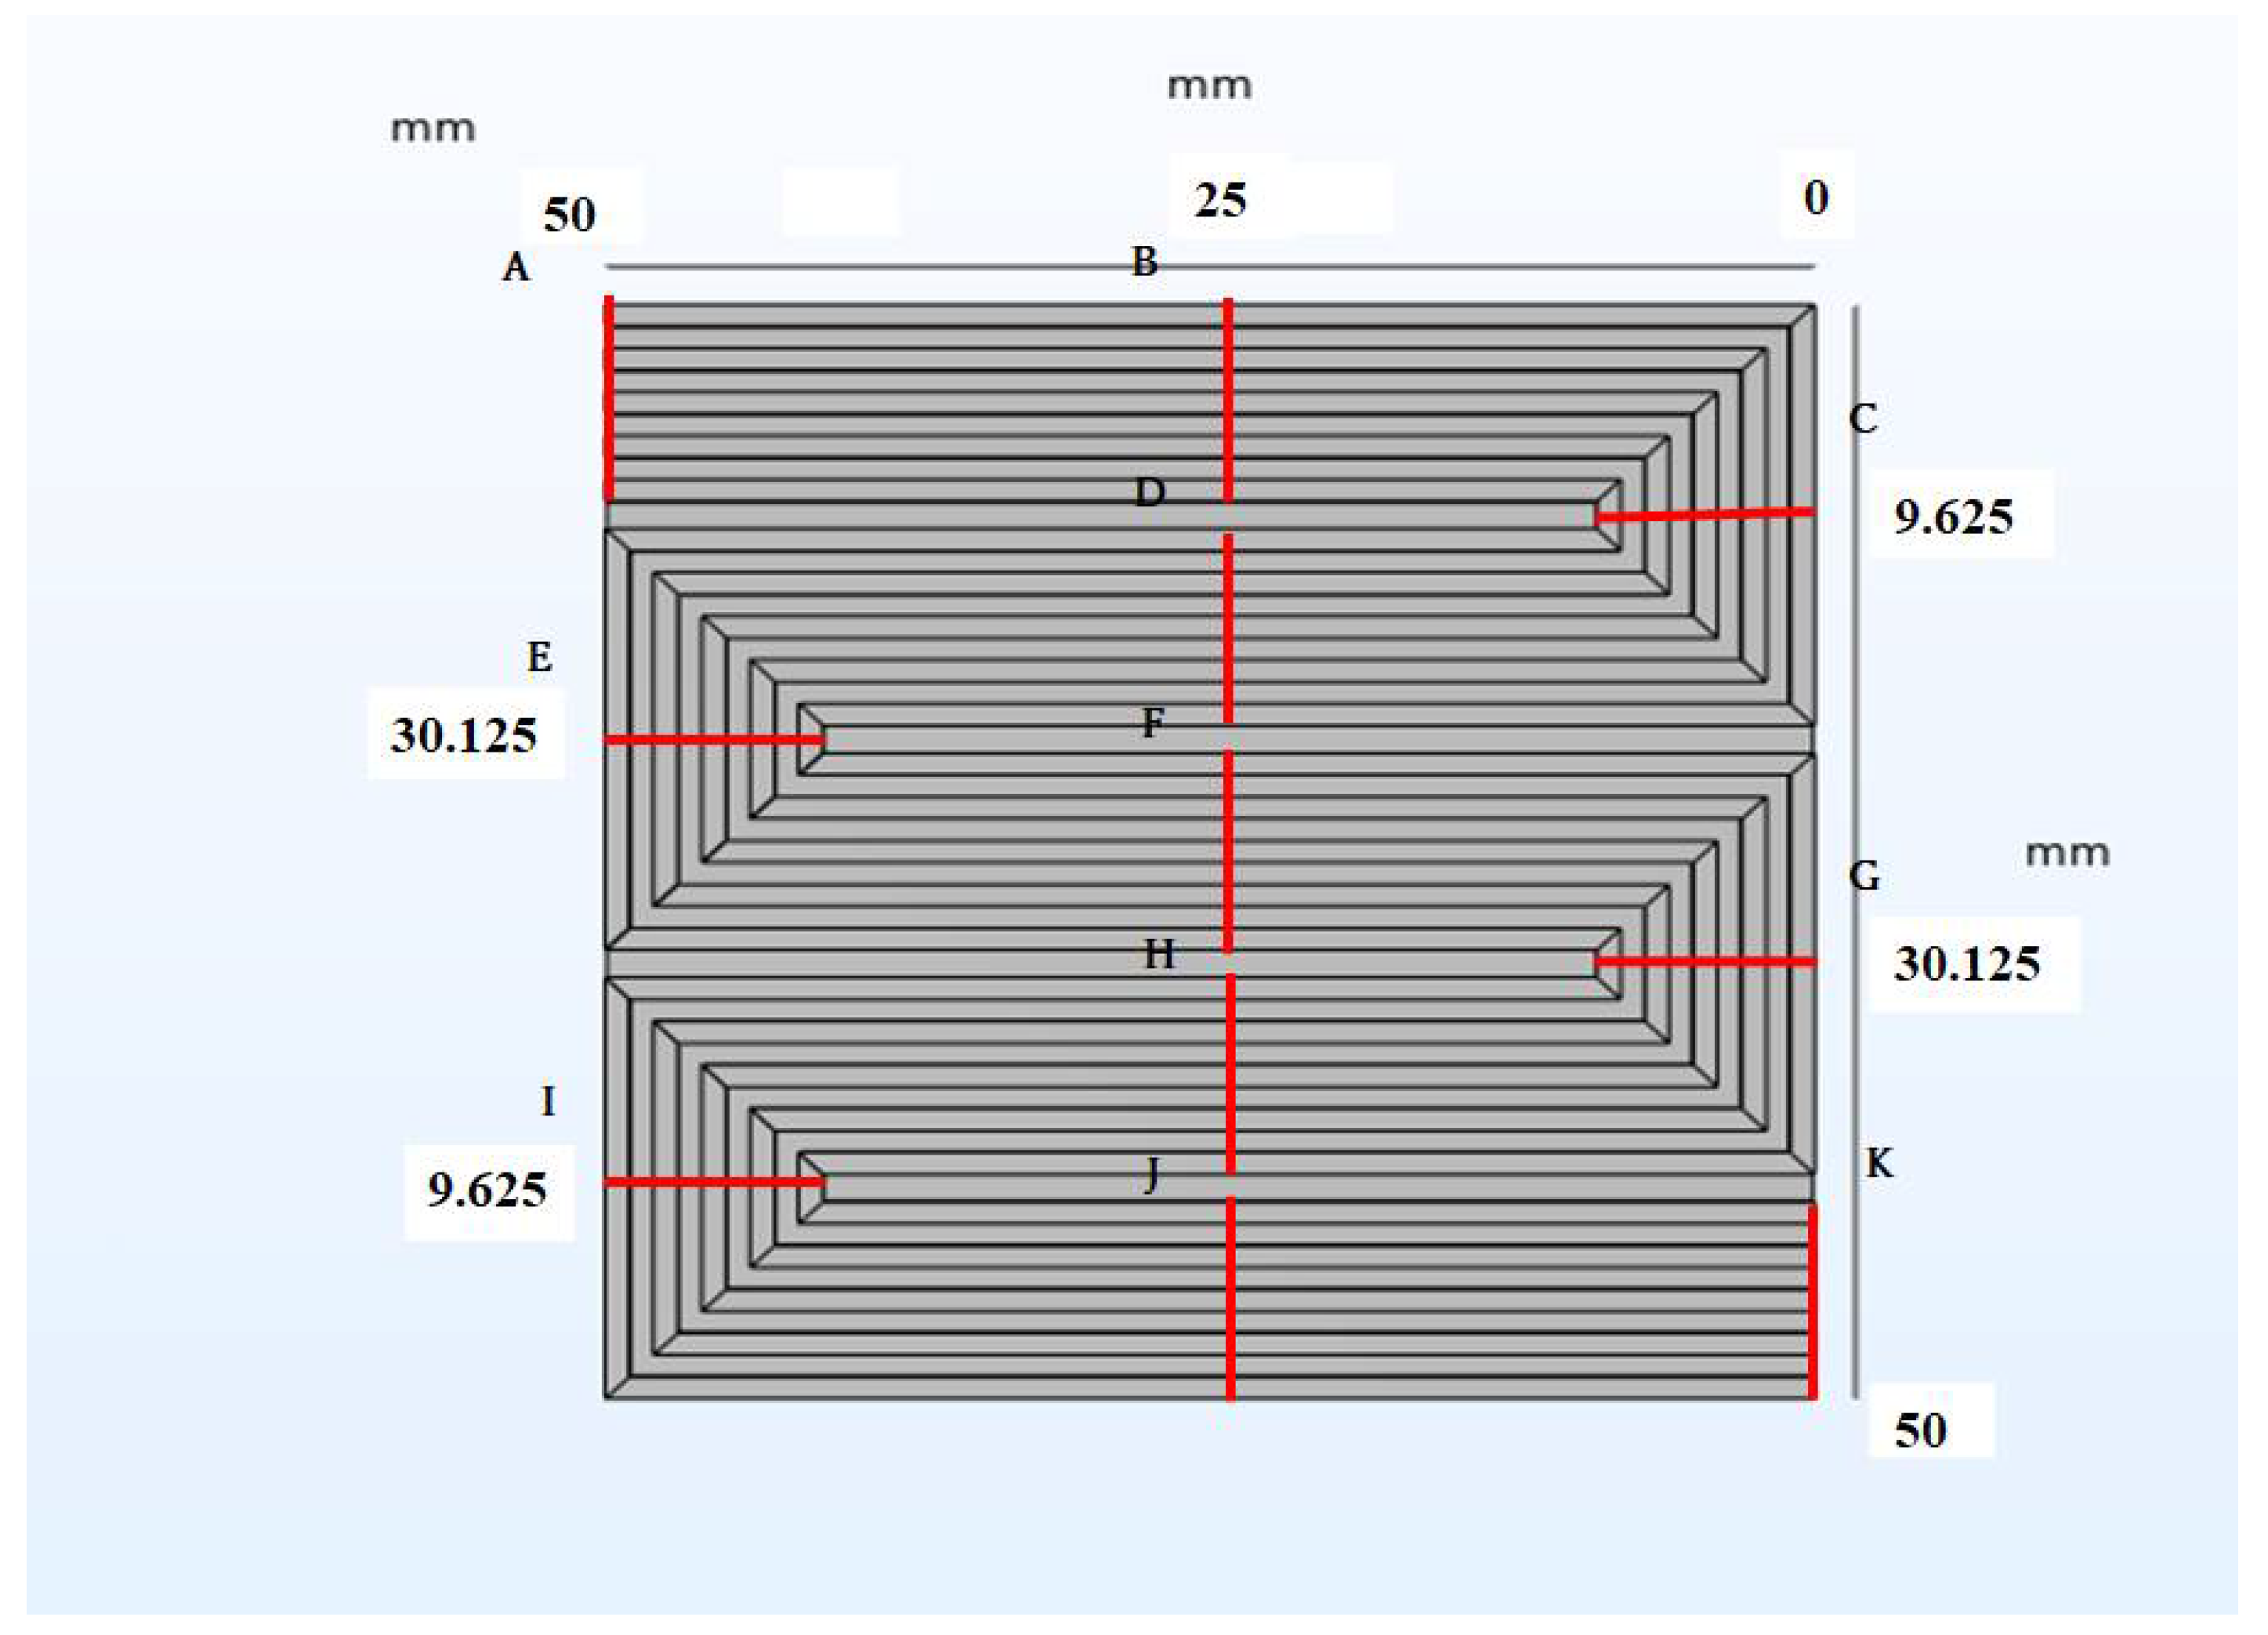
In order to investigate the effect of the Nafion membrane and Tini on the molar concentration distribution of H2O and the distribution of the current density, which can quantitatively indicate the performance of the electrochemical reaction in PEMFC, this study selected the analysis points of A to K, as shown in Figure 6. The average value on the cross sectional area of the interface between the Nafion membrane and cathode catalyst layer at each point, which covers both part under gas channel and that under rib, has been calculated.
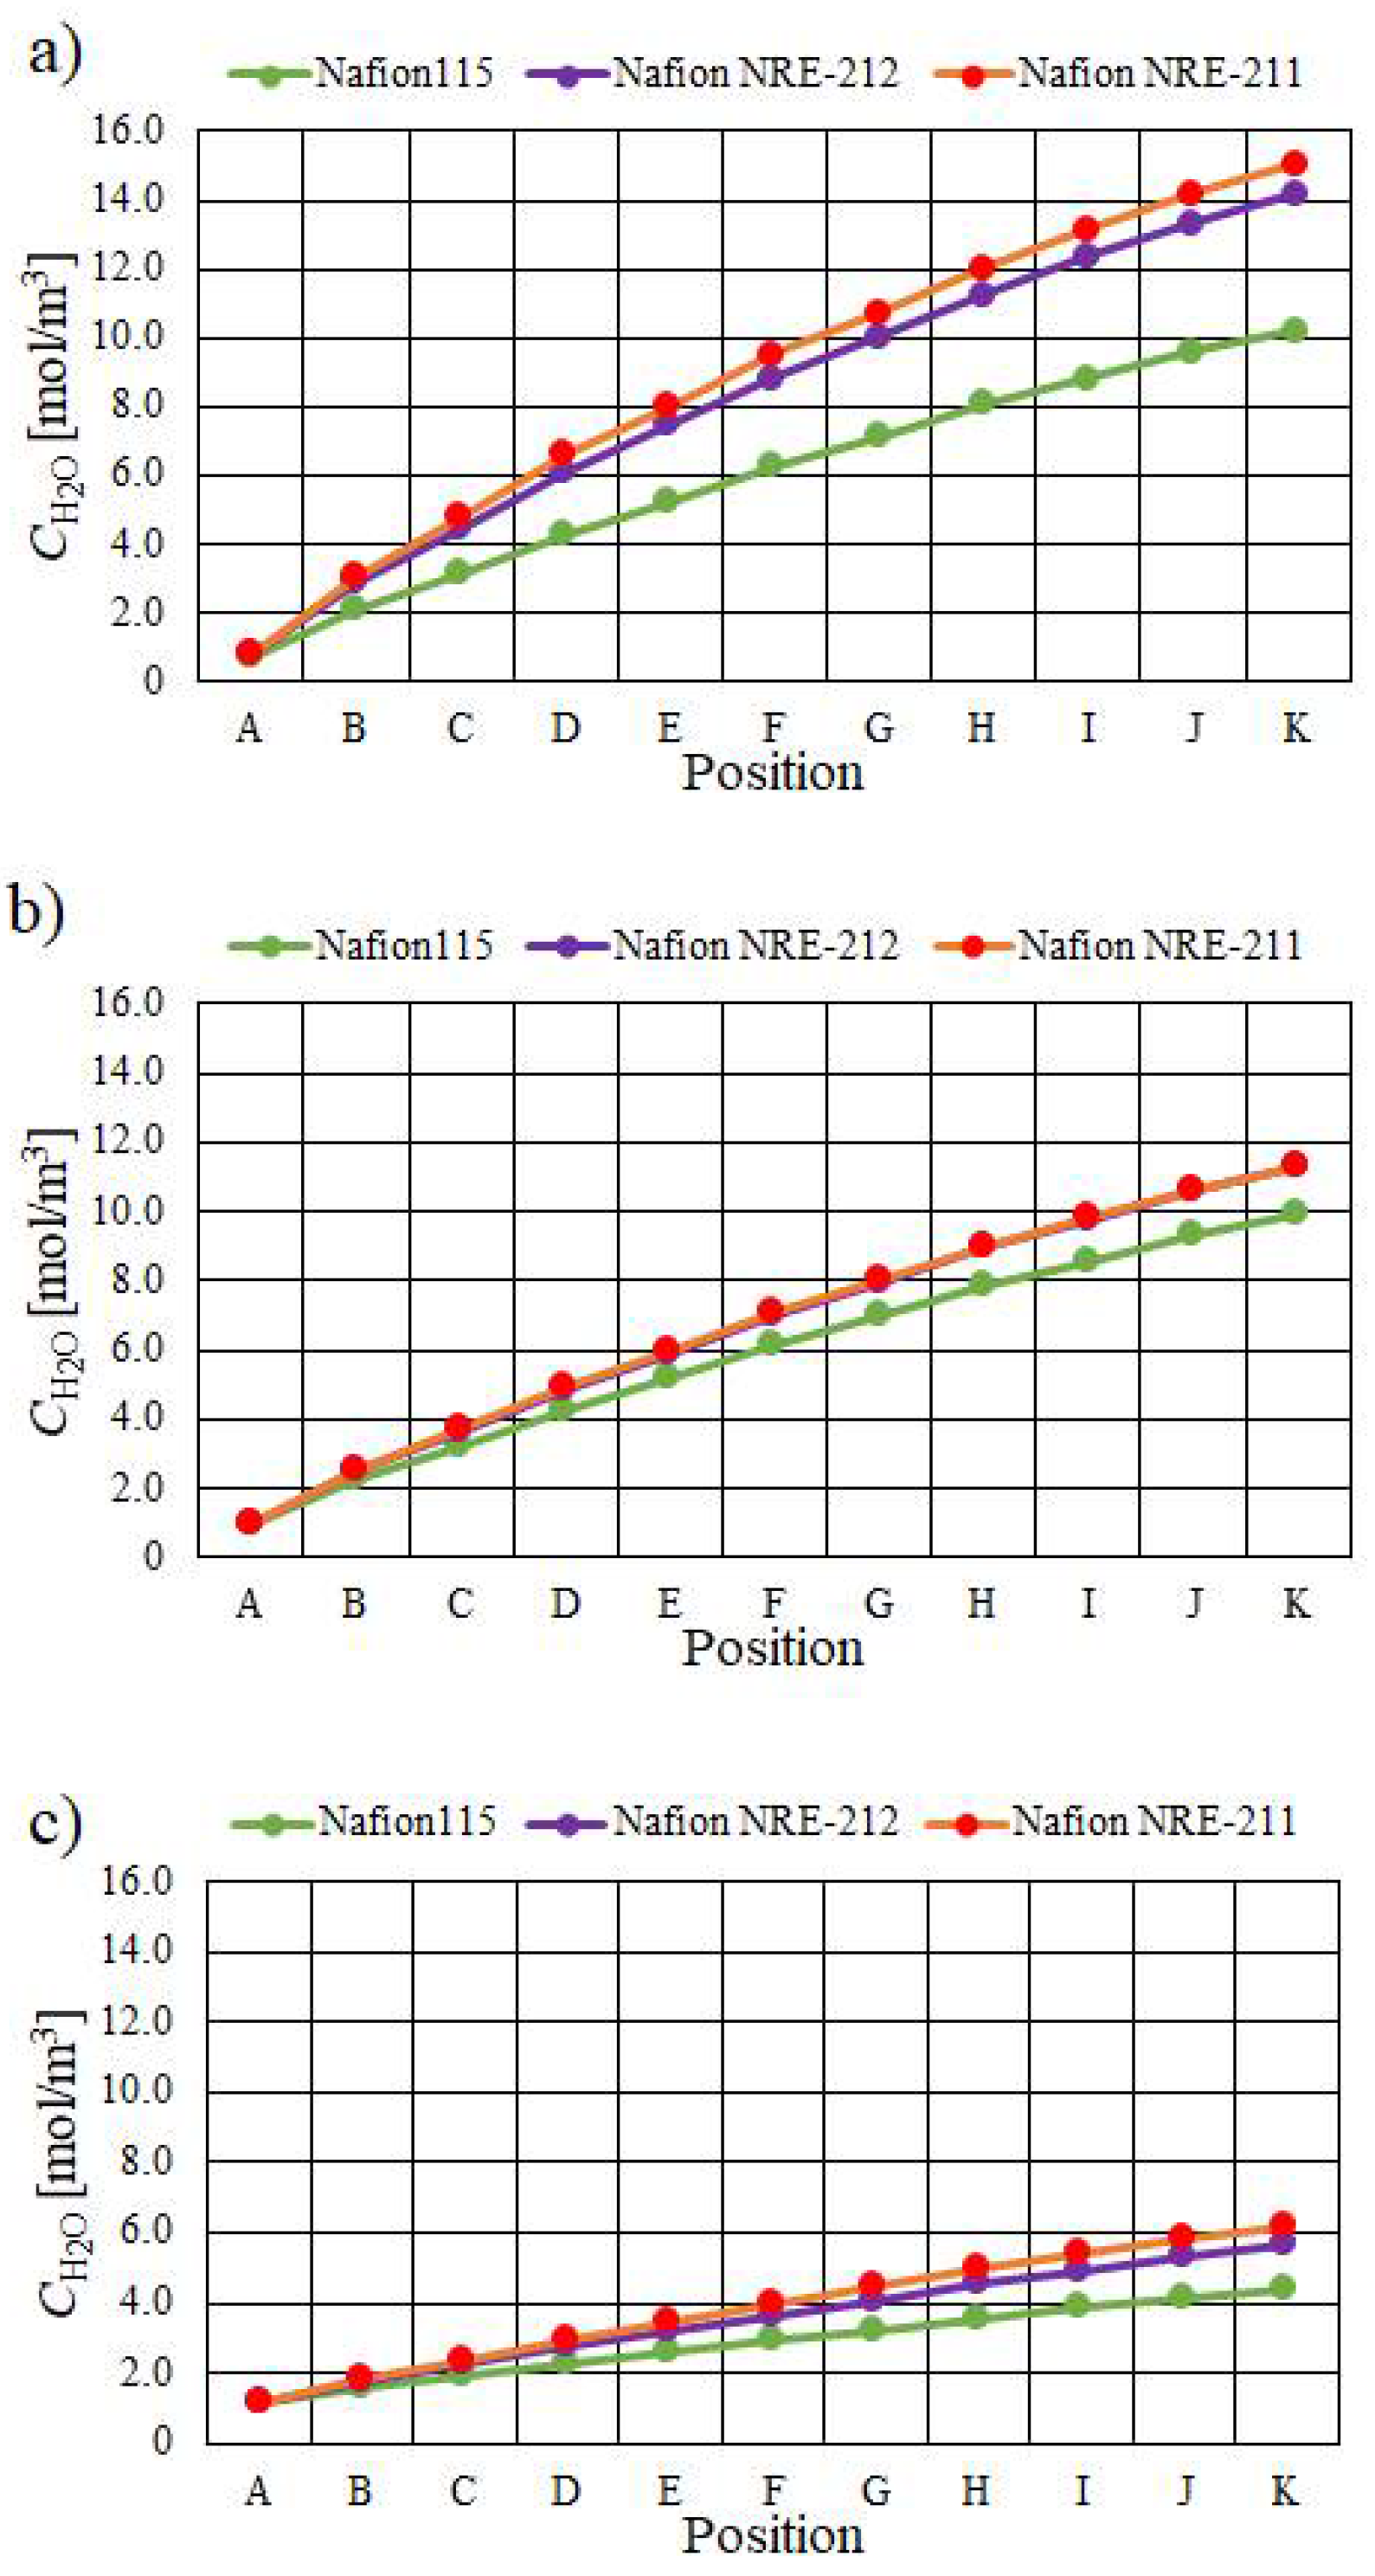
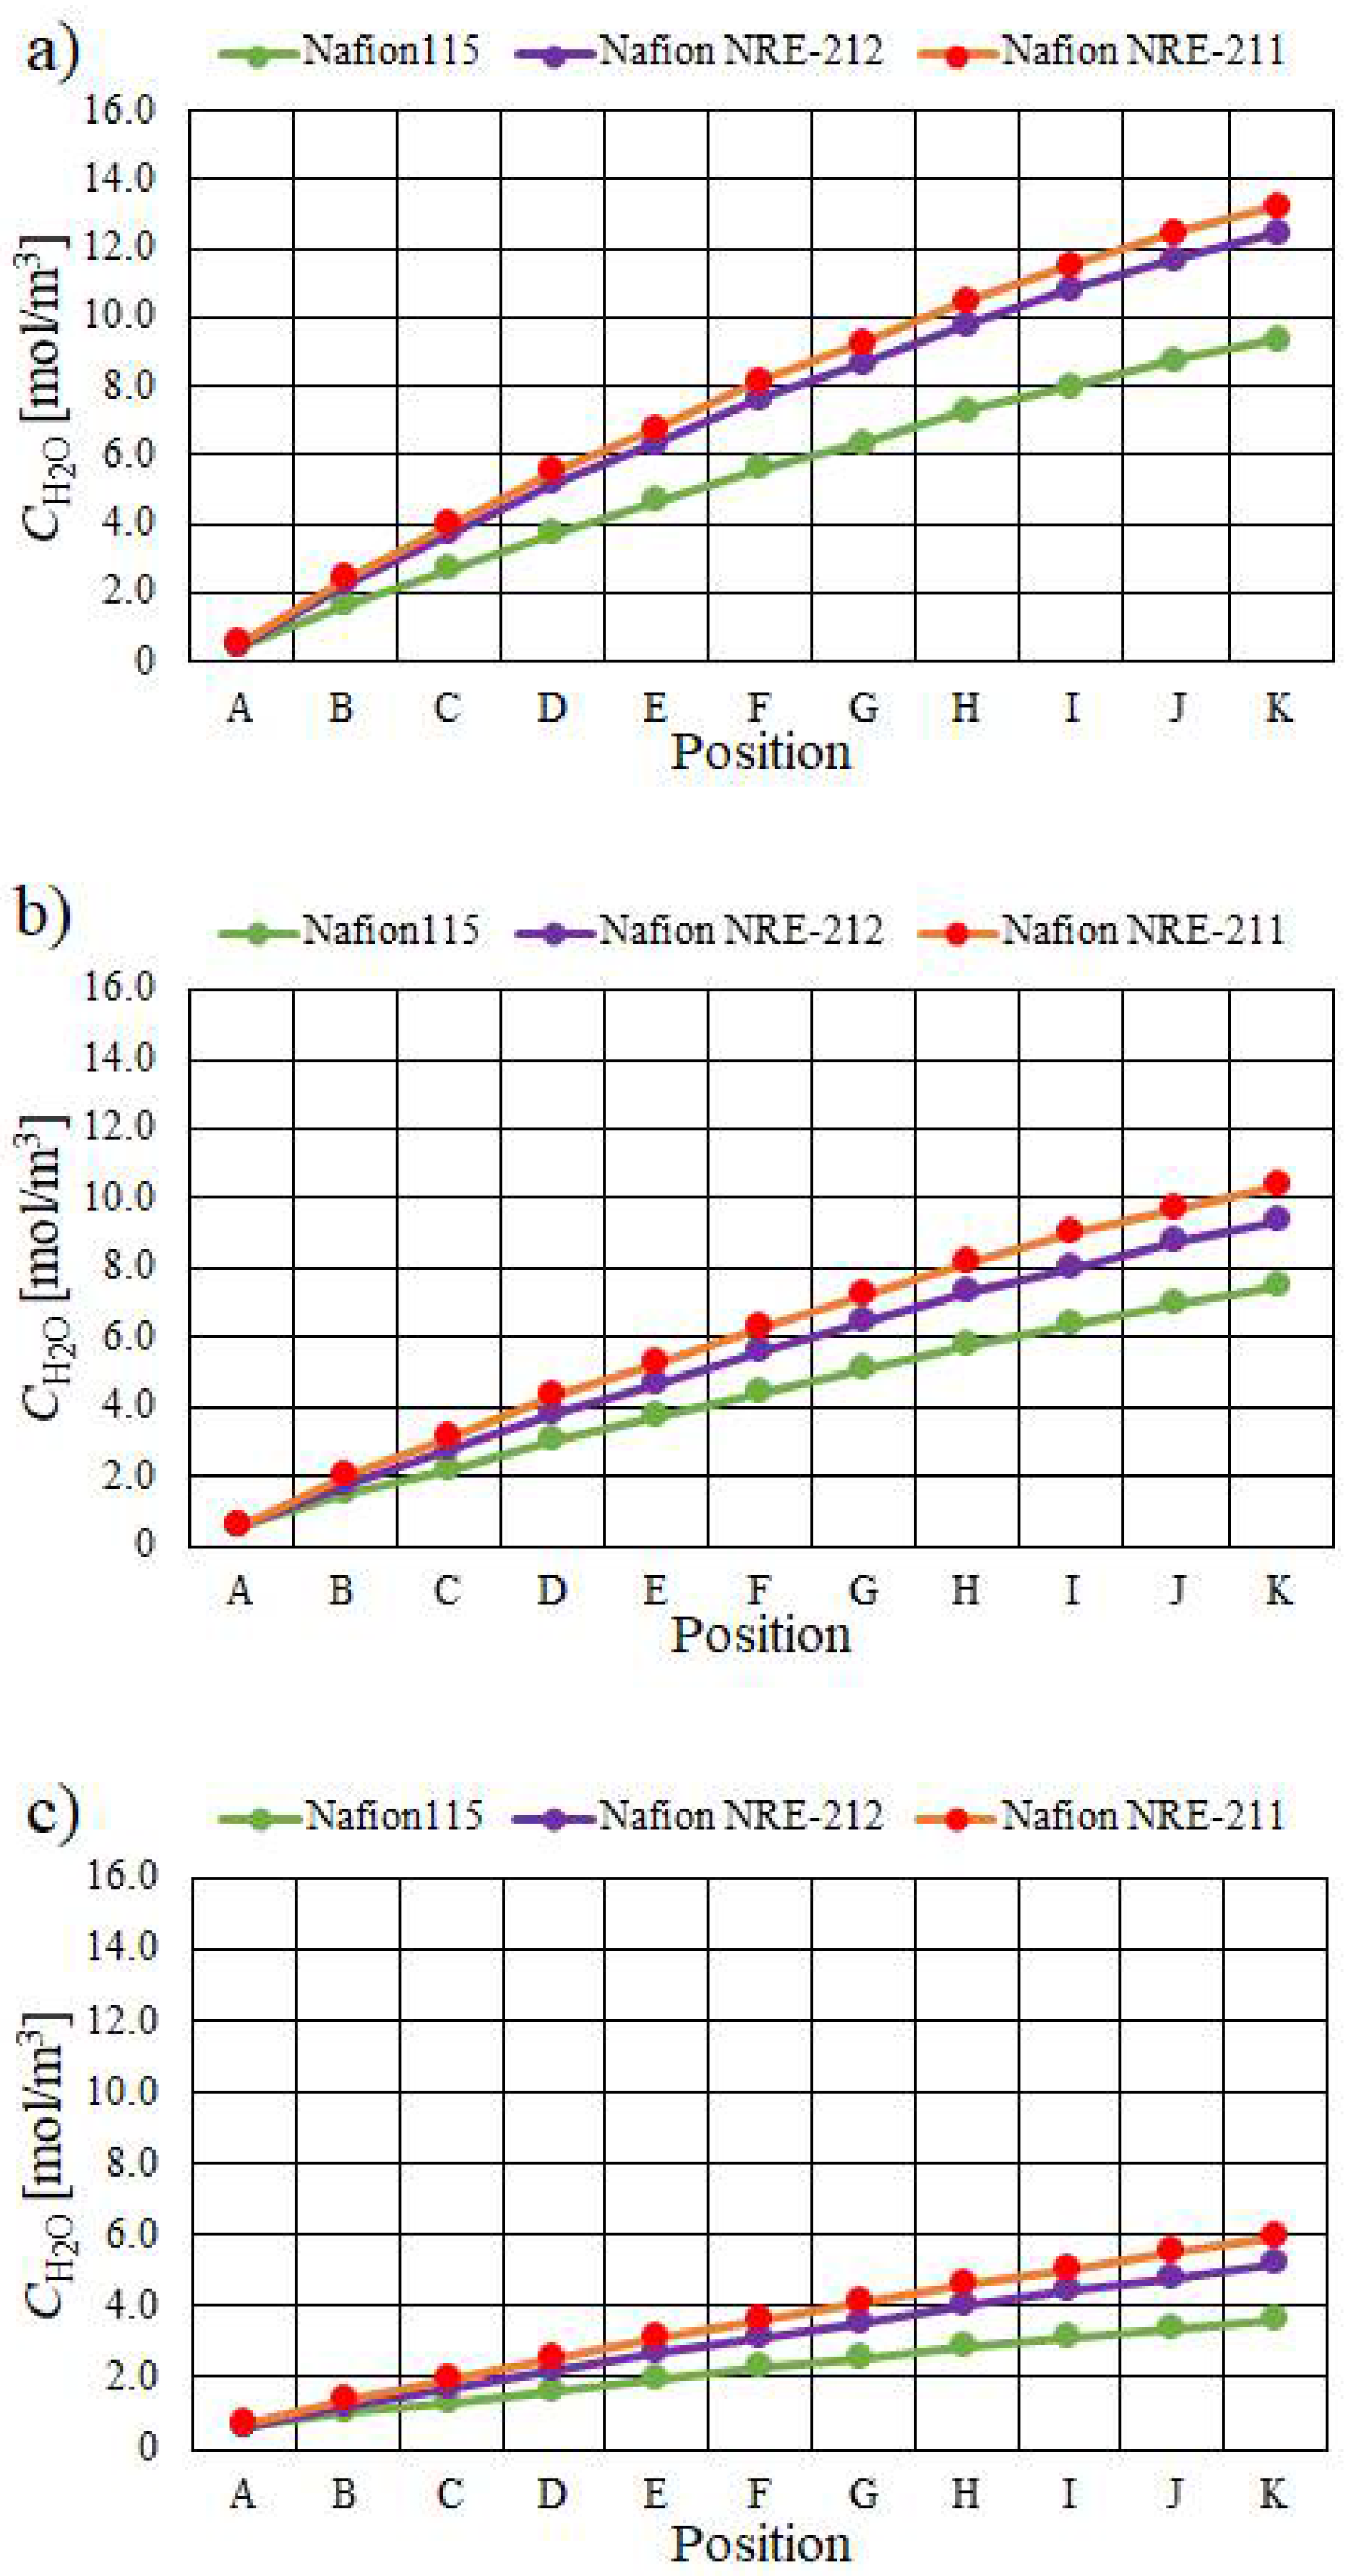
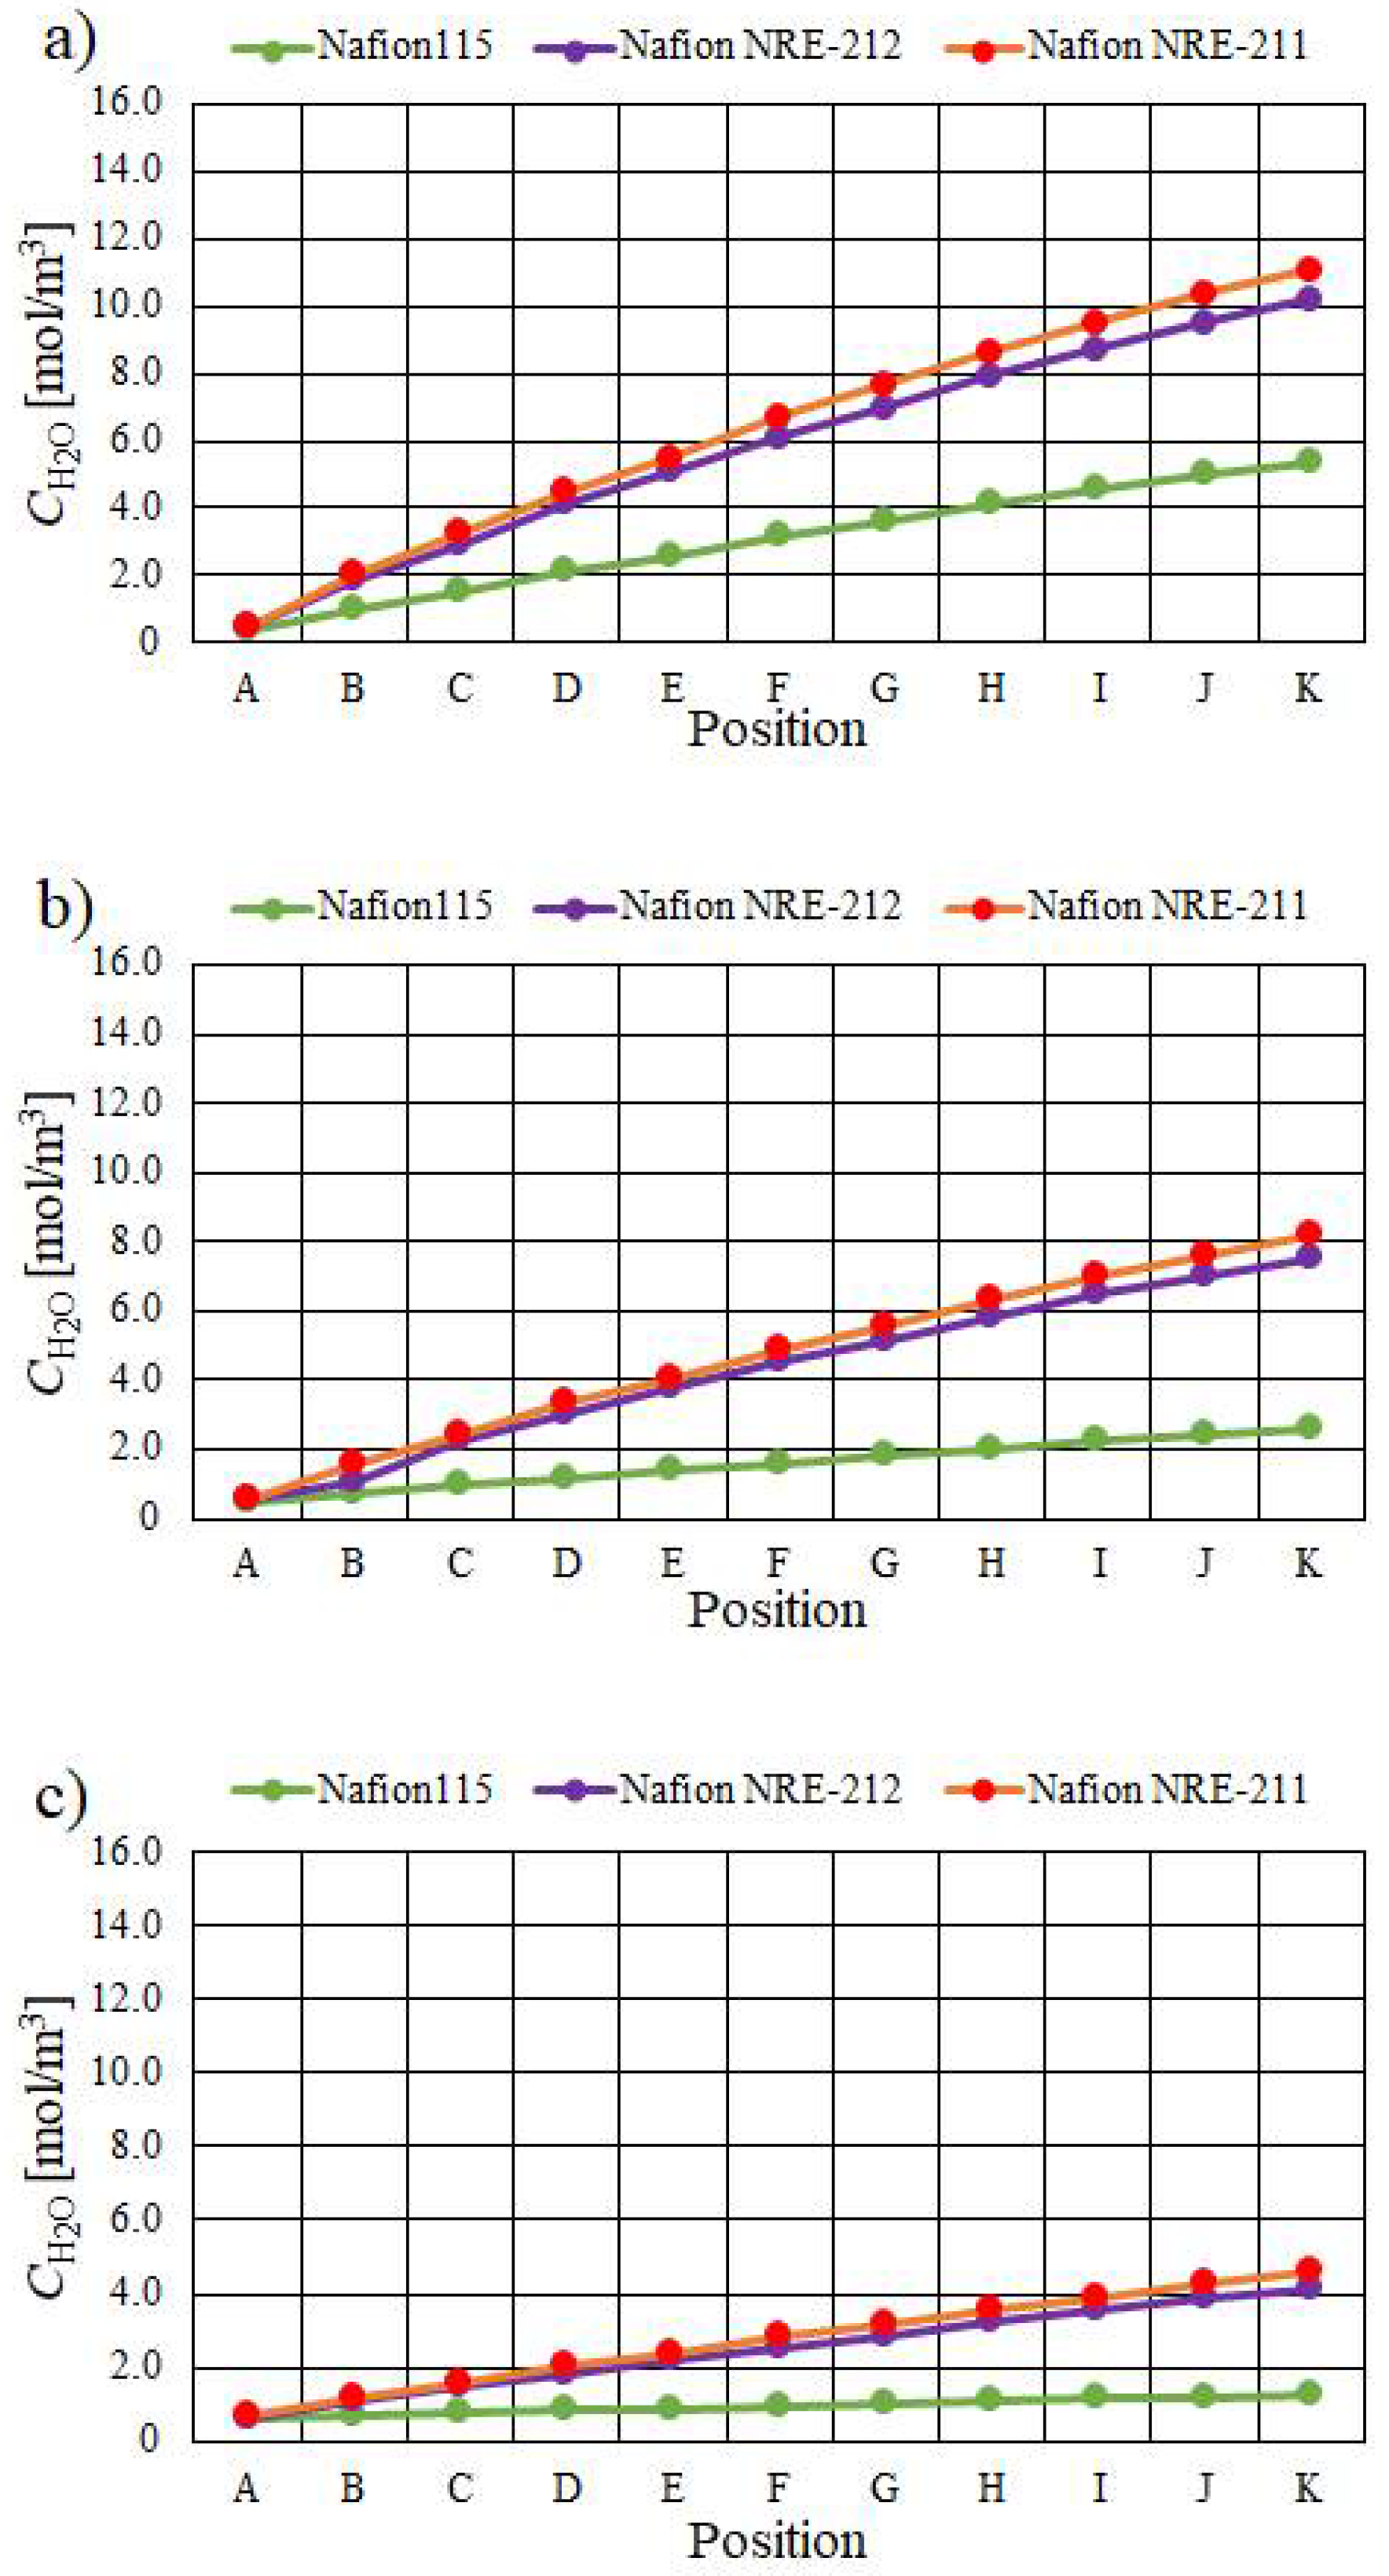
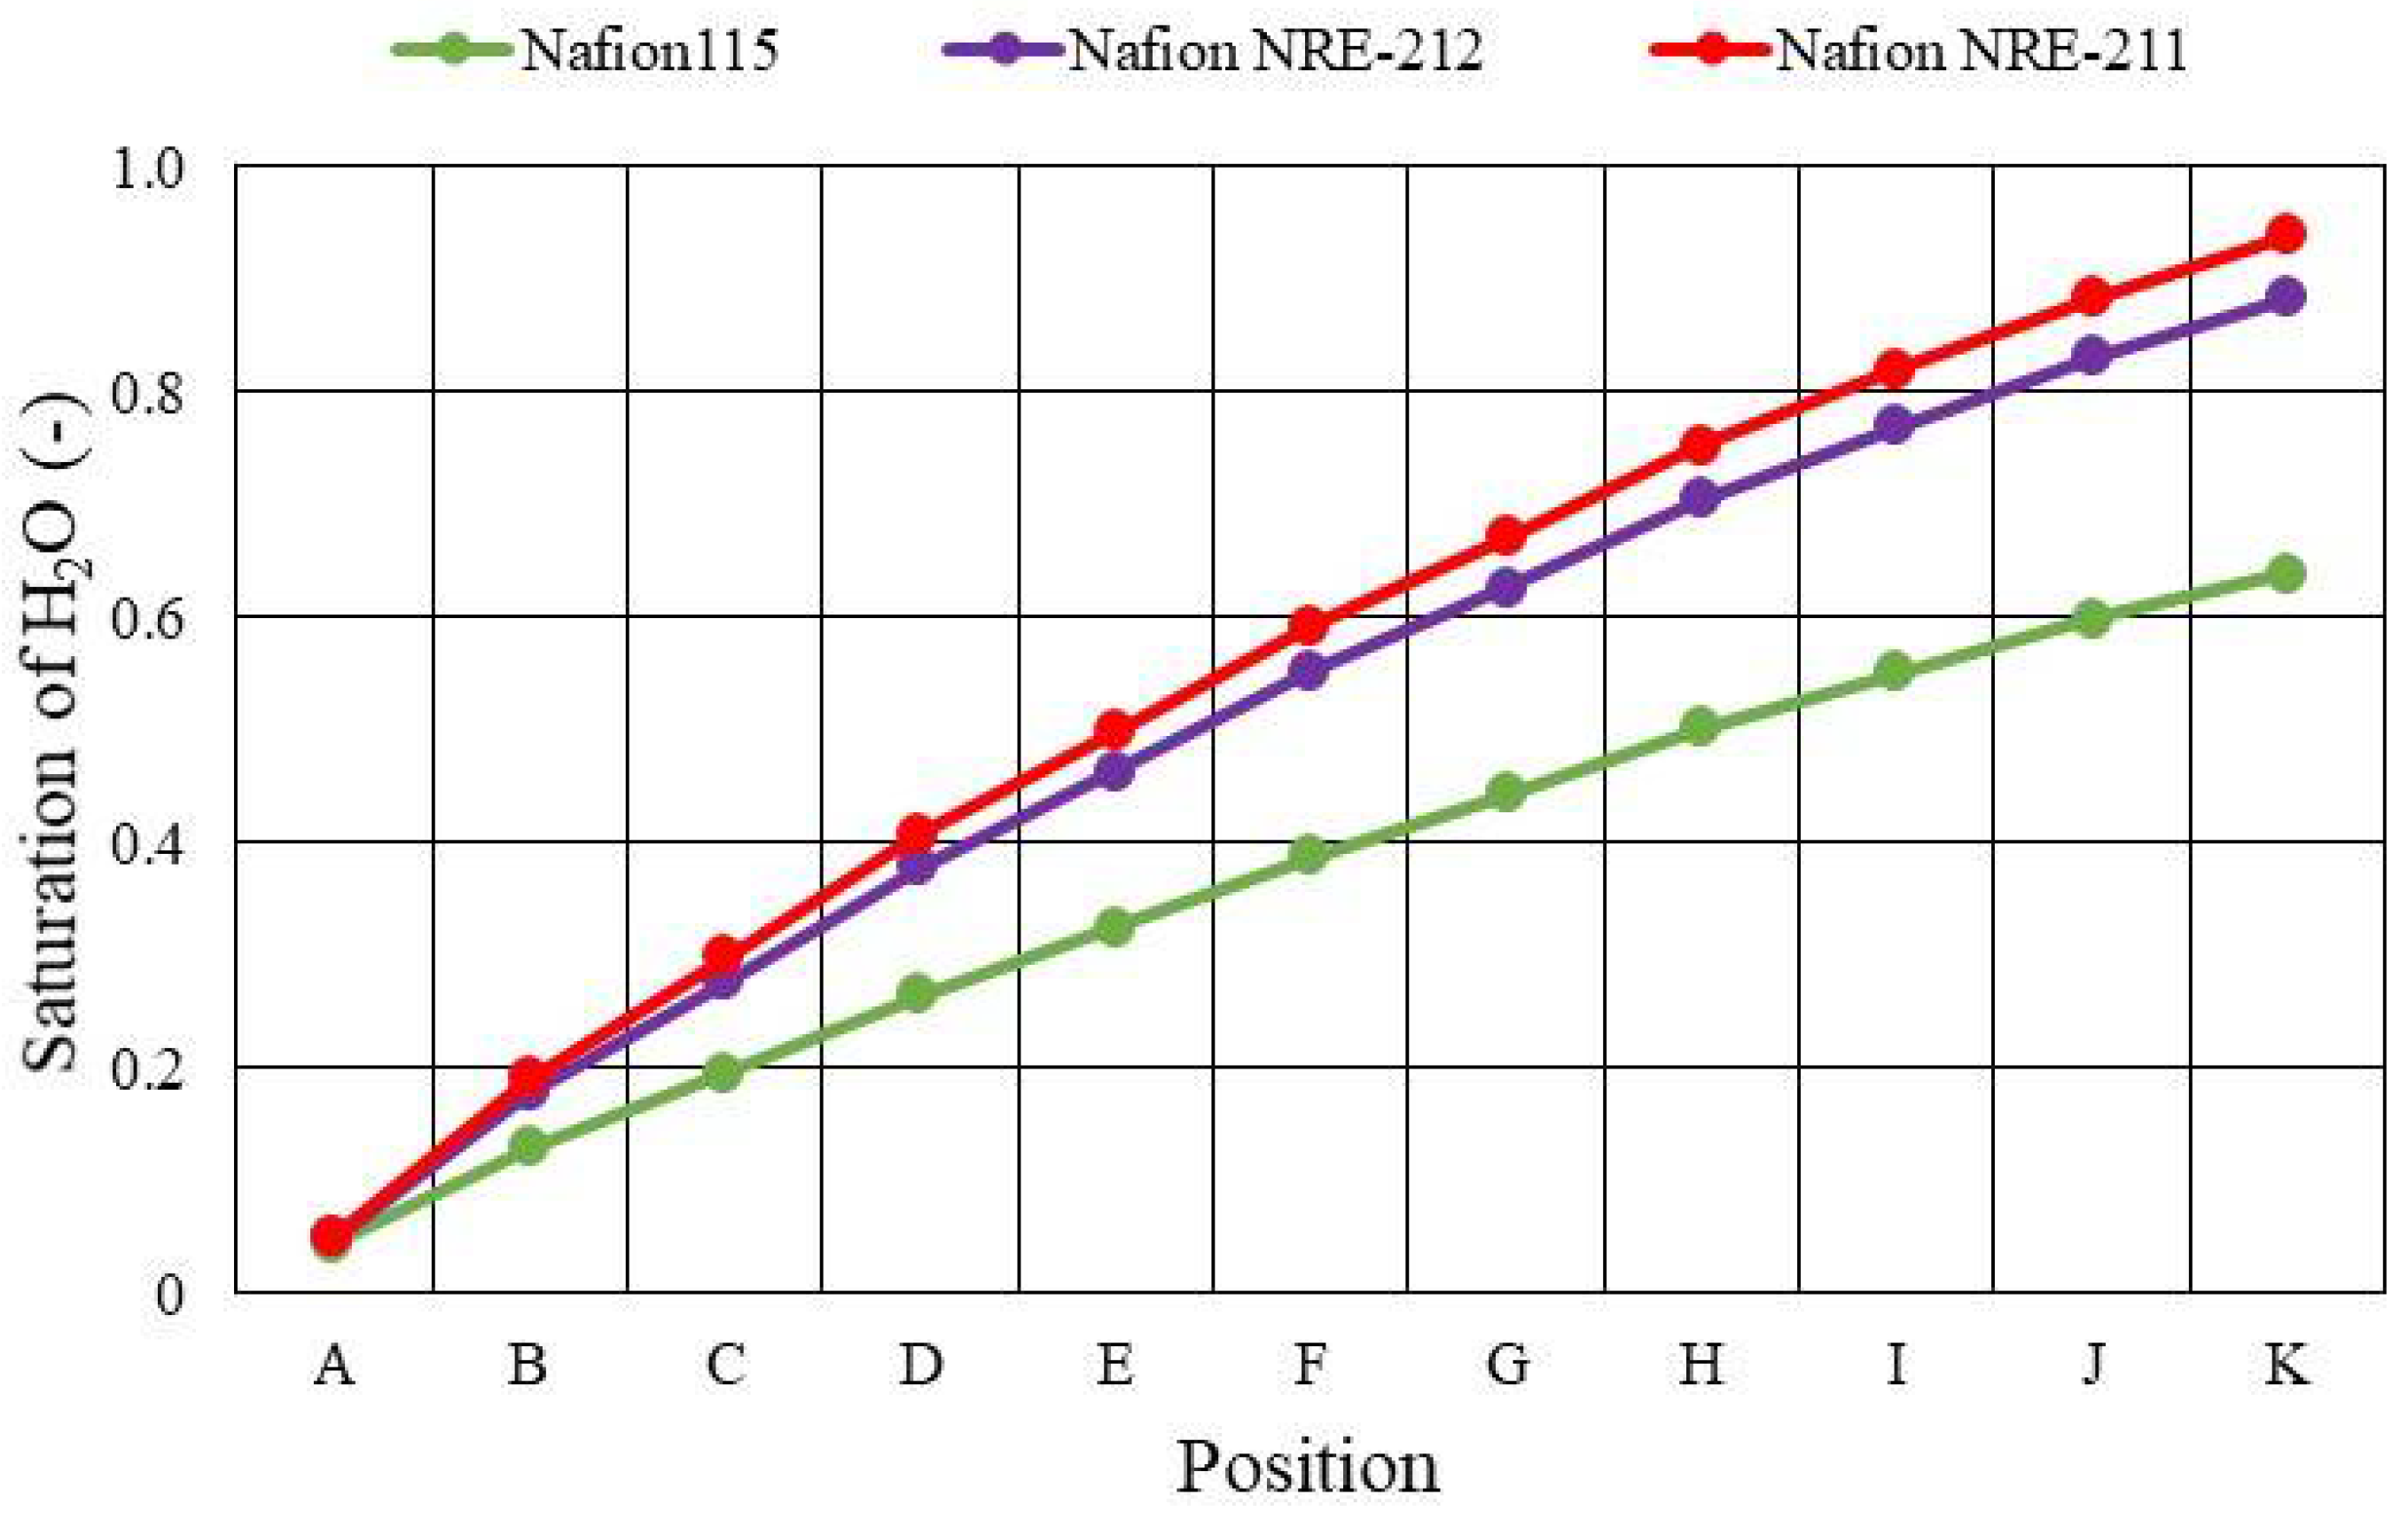
Figure 7, Figure 8, Figure 9 and Figure 10 show comparisons of molar concentration of H2O along with the gas flow through the gas channel with different relative humidities of supply gas among different Nafion membranes and Tini, respectively. Table 4, Table 5, Table 6, Table 7 and Table 8 list the values shown in Figure 7, Figure 8, Figure 9 and Figure 10 to compare quantitatively, respectively. According to Figure 7, Figure 8, Figure 9 and Figure 10, the molar concentration of H2O increases along with the gas flow through the gas channel, irrespective of the Nafion membrane thickness, Tini, and relative humidity of the supply gas. Since the O2 reduction reaction progresses along with the gas flow through the gas channel, H2O, which is a product of the O2 reduction reaction, increases as expected. In addition, the molar concentration of H2O is the highest at Tini = 353 K among different Tini, irrespective of the Nafion membrane thickness and relative humidity of the supply gas. As described above, Tini = 353 K is the most humidified condition among different Tini, irrespective of the Nafion membrane thickness and relative humidity of the supply gas, resulting in the proton conductivity of the Nafion membrane and the performance of O2 reduction reaction at cathode being the best. Consequently, the molar concentration of H2O is the highest at Tini = 353 K among the investigated Tini. Regarding the impact of the relative humidity of the supply gas, the molar concentration of H2O increases when the relative humidity of the supply gas increases, irrespective of the Nafion membrane thickness and Tini. The largest molar concentration of H2O is confirmed with A80%RH&C80%RH, while the smallest molar concentration of H2O is confirmed with an anode of 40%RH and cathode of 40%RH (A40%RH&C40%RH). Generally speaking, the increase in humidification enhances the performance of PEMFC, which promotes the proton conductivity of the Nafion membrane, while the decrease in proton conductivity of Nafion membrane causes higher ohmic losses [22,46]. As discussed above, with the low relative humidity, the ionomer in the cathode catalyst layer is hard to be saturated by the H2O migrated through the Nafion membrane from the anode to the cathode, deciding the performance of the O2 reduction reaction at the cathode, which produces H2O [40]. Consequently, it is obtained that the molar concentration of H2O is the largest with A80%RH&C80%RH, while it is the smallest with A40%RH&C40%RH. Comparing the thickness of the Nafion membrane, the molar concentration of H2O decreases when the thickness of the Nafion membrane increases, irrespective of Tini and the relative humidity of the supply gas. In particular, the molar concentration of H2O for Nafion 115 is much smaller than that for the other Nafion membranes. H2O flux of PEM as well as the conductivity of the Nafion membrane is promoted when the thickness of the Nafion membrane decreases, particularly below 50 μm [21,47,48], which corresponds to Nafion NRE-212 and Nafion NRE-211 in this study. In addition, the ohmic loss due to proton conductivity of Nafion membrane decreases when the thickness of Nafion membrane [49] decreases. Since the proton conductivity and H2O flux of Nafion membrane are low for a thick Nafion membrane, the performance of O2 reduction reaction, which produces H2O at the cathode, declines. Consequently, it is thought that the molar concentration of H2O decreases when the thickness of the Nafion membrane increases, especially for Nafion 115. Summarizing the above discussion, the largest molar concentration of H2O, which is 15.1 mol/m3, is obtained at the position K in the case of using Nafion NRE-211 at Tini = 353 K with A80%RH&C80%RH according to Table 4, Table 5, Table 6, Table 7 and Table 8. In this study, it is assumed that H2O is treated as a vapor. To validate this assumption, the saturation of H2O calculated by the numerical simulation of this study is confirmed. The saturation of H2O is defined by dividing a partial pressure of H2O vapor by a saturation H2O vapor pressure. Figure 11 shows a comparison of the saturation of H2O along with the gas flow through the gas channel among different Nafion membranes at Tini = 353 K with A80%RH&C80%RH. It is seen from Figure 11 that the saturation of H2O is lower than 1.0 even the case of Nafion NRE-211 near the outlet. When the saturation of H2O is lower than 1.0, it means that H2O exists as a vapor. The molar concentration of H2O is the largest in the case of Nafion NRE-211 under the condition that Tini = 353 K with A80%RH&C80%RH among conditions investigated in this study. Therefore, it can be argued that H2O can be treated as a vapor under the conditions investigated in this study.
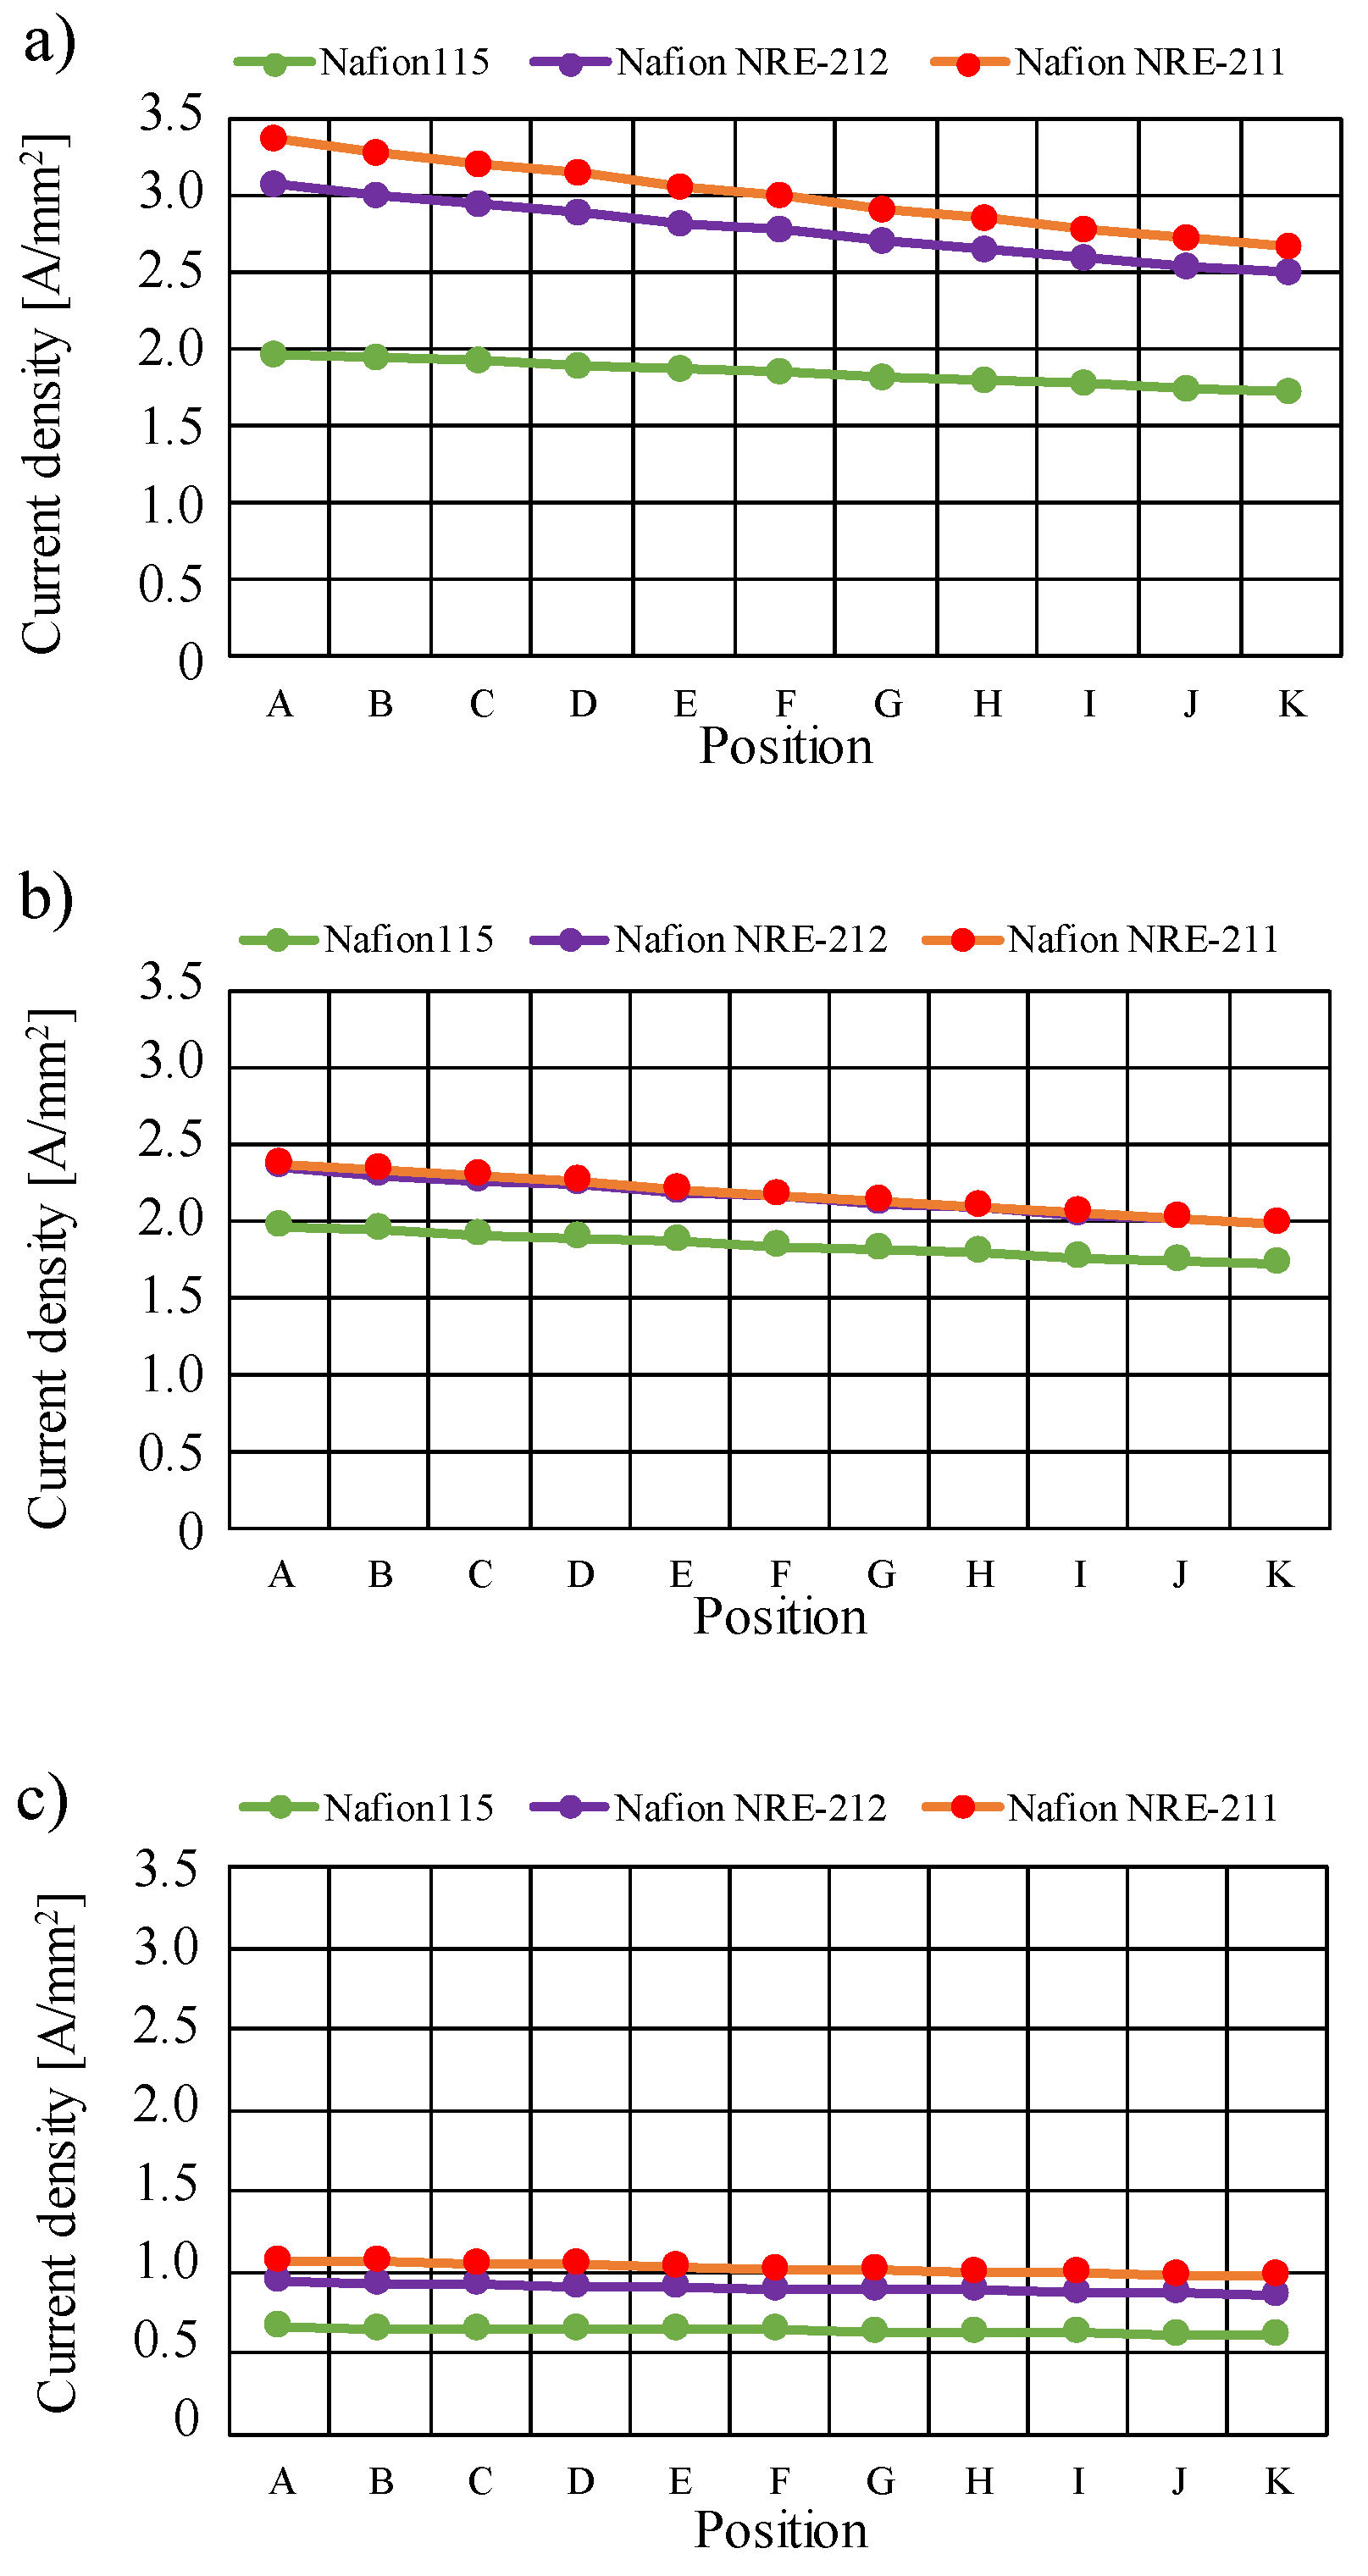
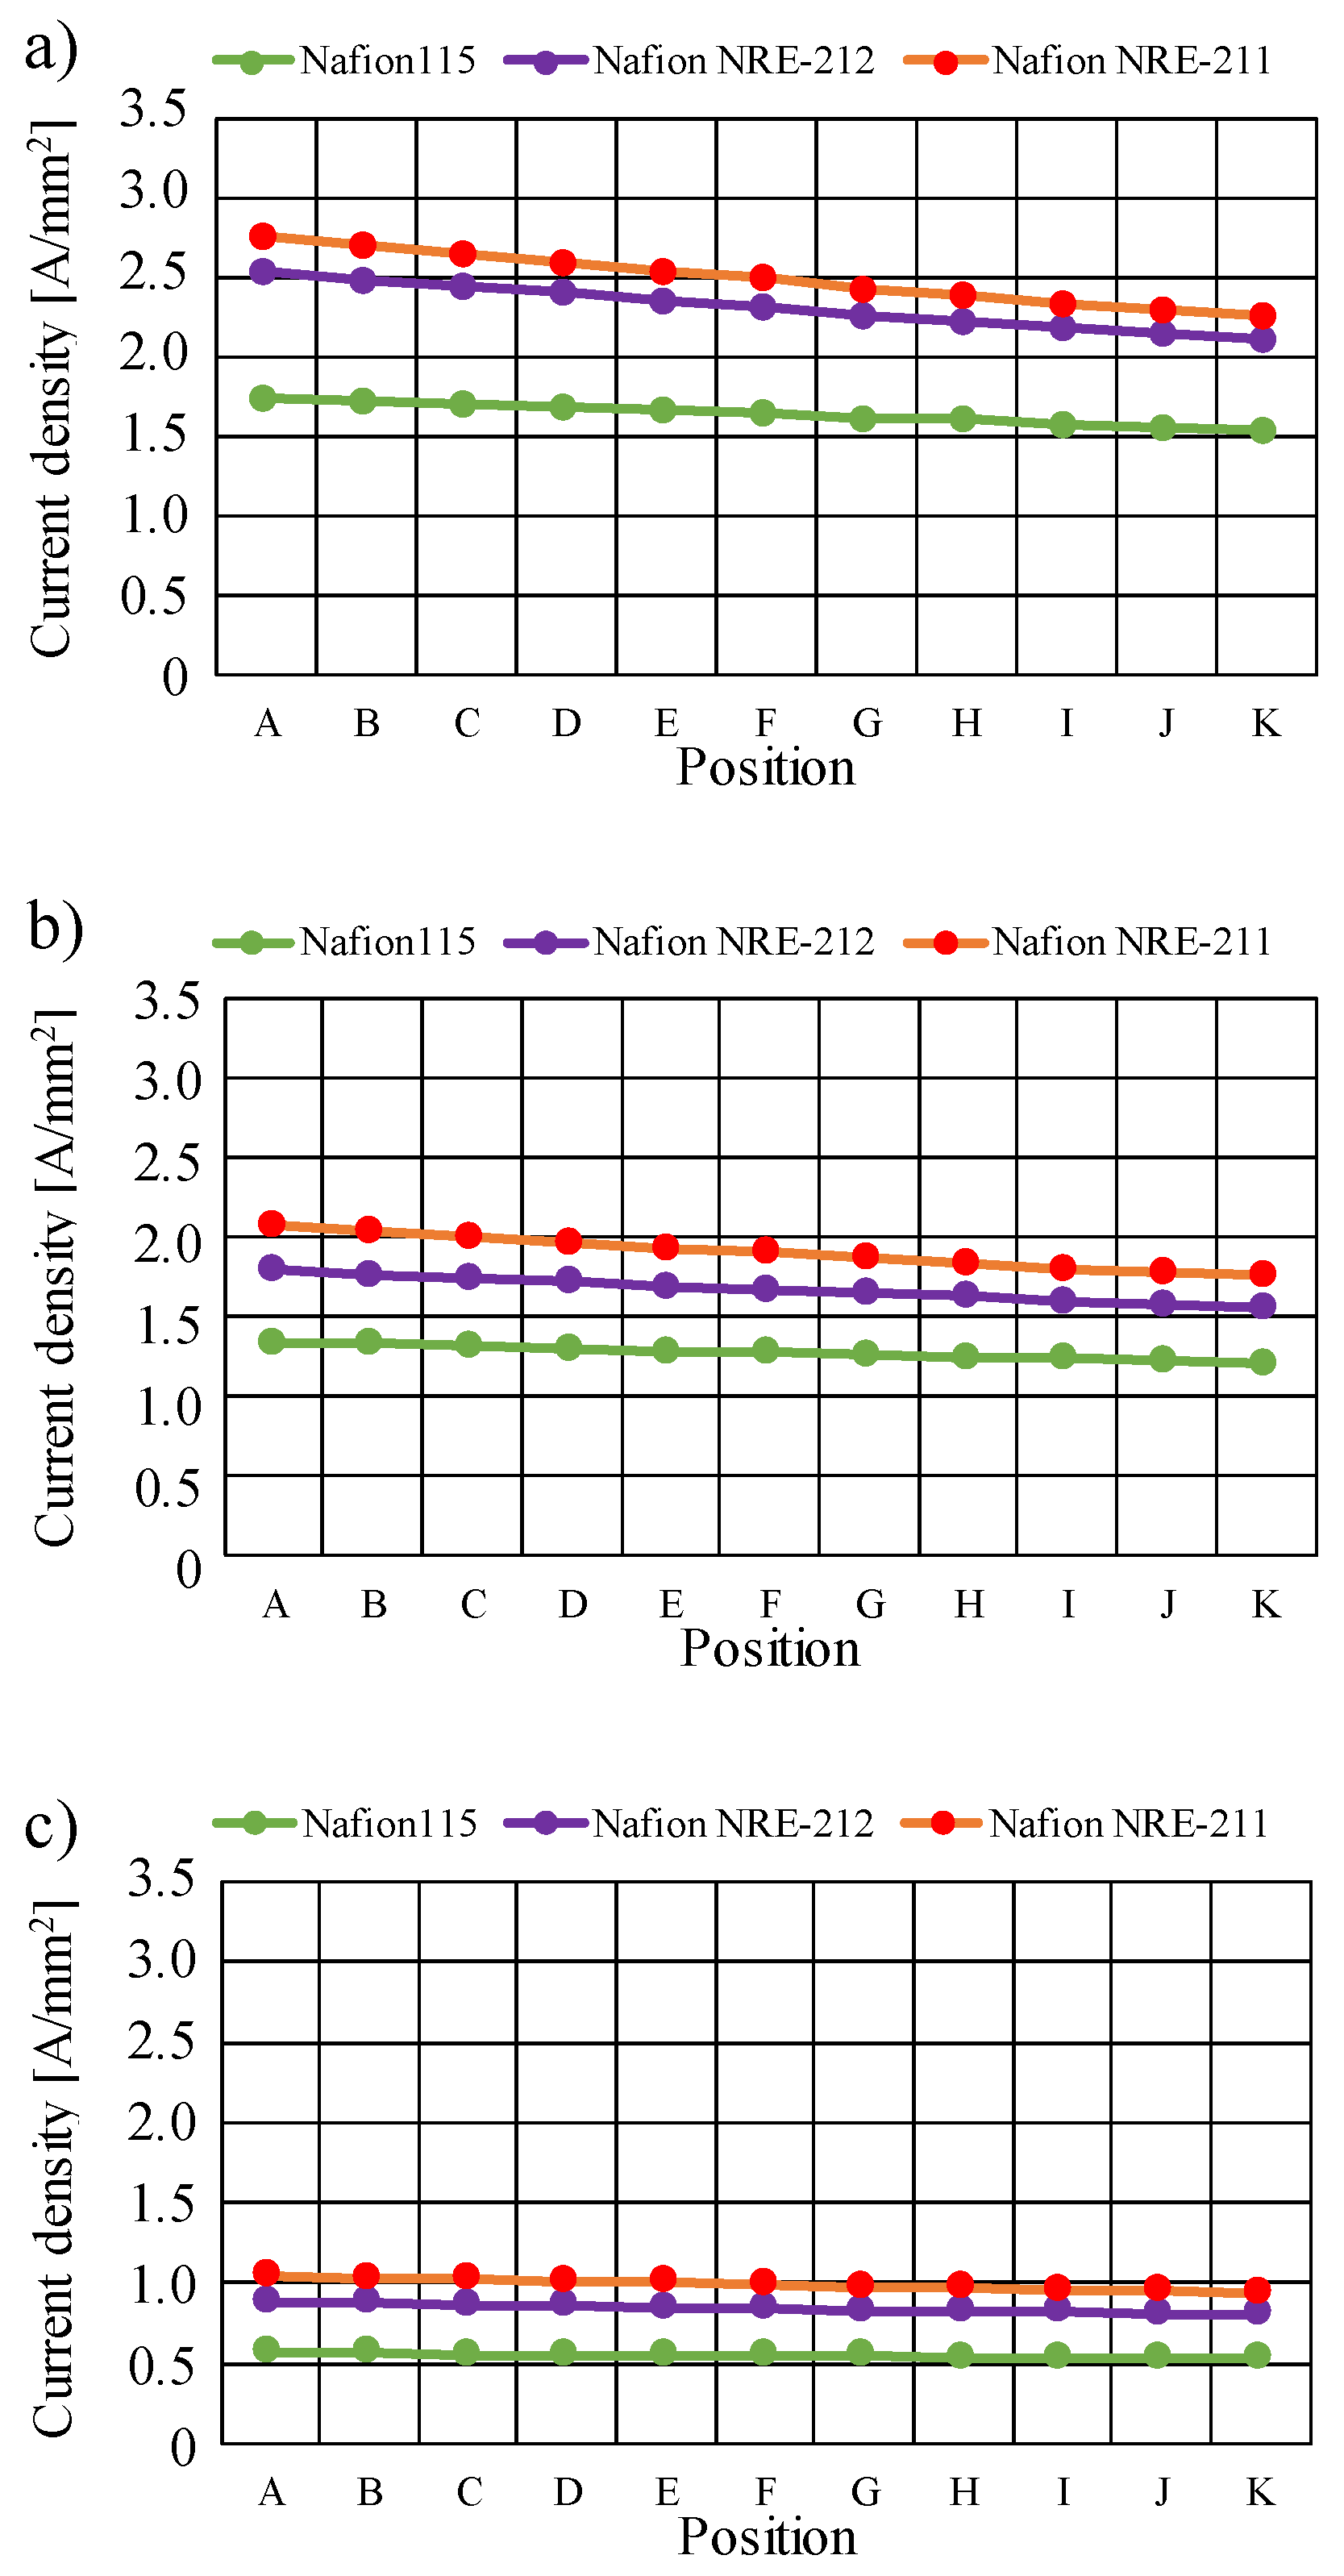
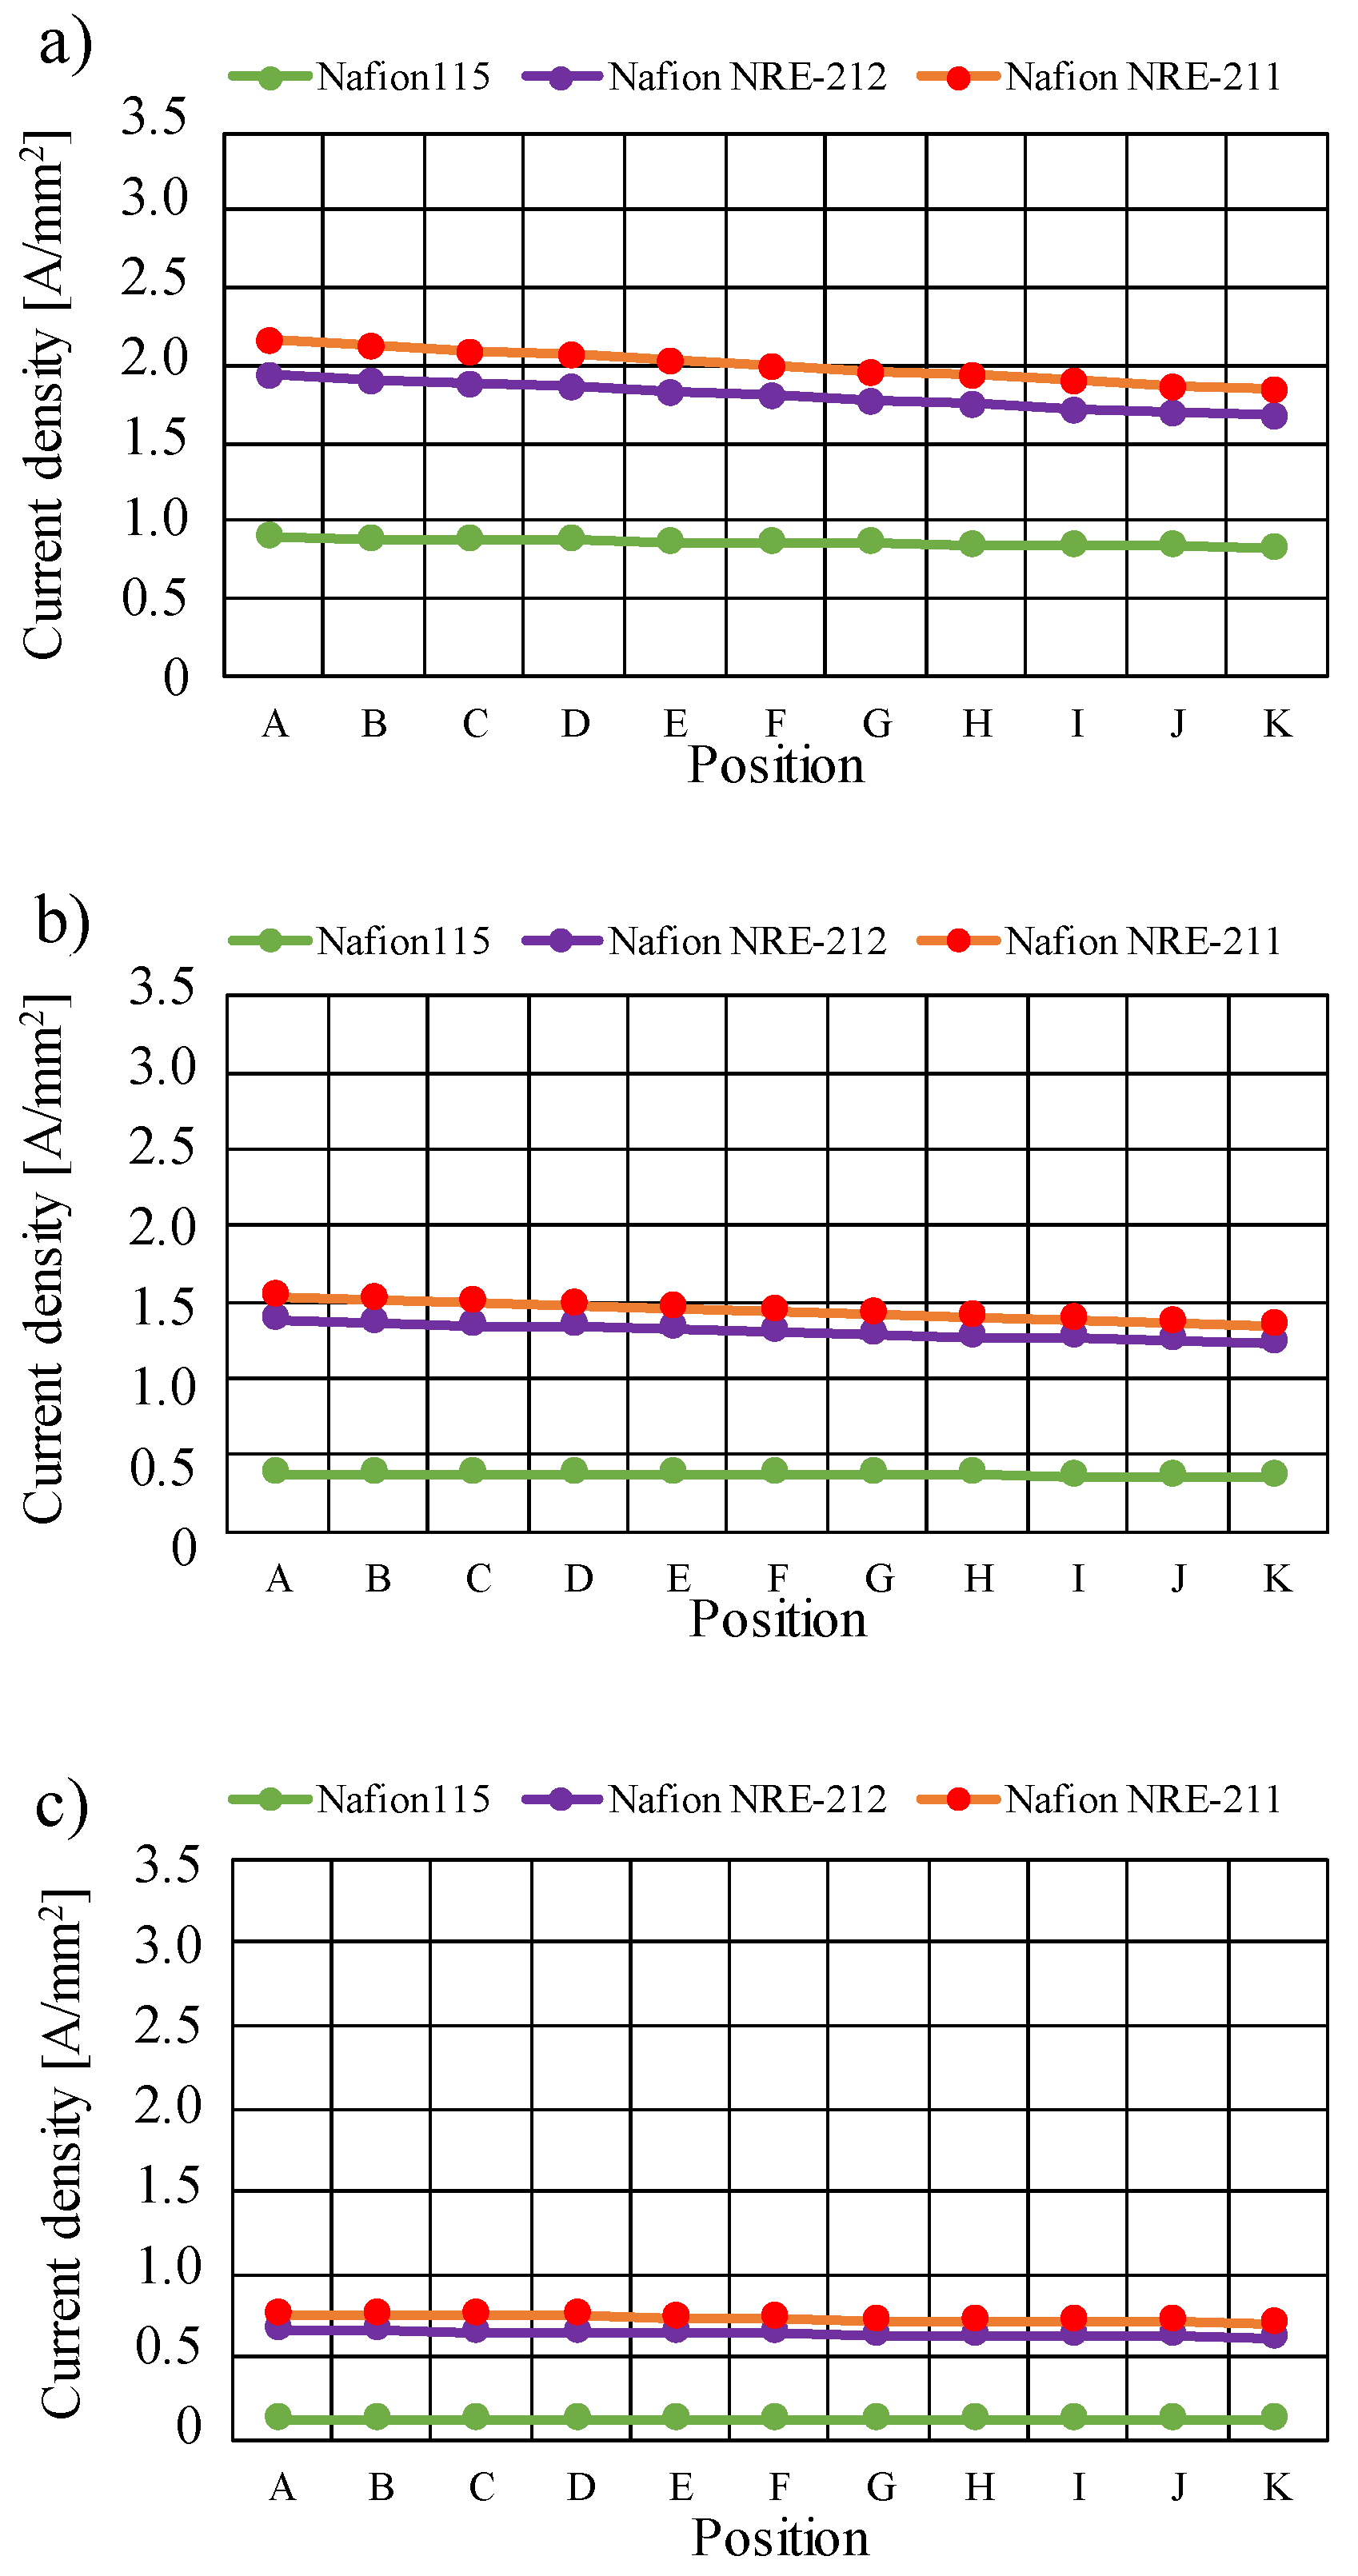
Figure 12, Figure 13, Figure 14 and Figure 15 show comparisons of current density along with the gas flow through the gas channel on the interface between the Nafion membrane and cathode catalyst layer changing the relative humidity of the supply gas among different Nafion membranes and Tini, respectively. Table 8, Table 9, Table 10, Table 11 and Table 12 list the values shown in Figure 12, Figure 13, Figure 14 and Figure 15 to compare quantitatively, respectively. In addition, Table 12 summarizes the relationship between the current and voltage to compare the cell performance under the conditions investigated in this study. In this study, the data of the voltage, which were obtained at the constant current of 20 A under all conditions investigated in this study by the power generation experiment, were used as the initial condition for numerical simulation. Table 12 lists these data, which follow the tendencies shown in Figure 12, Figure 13, Figure 14 and Figure 15. It is seen from Figure 12, Figure 13, Figure 14 and Figure 15, since H2 and O2 are consumed along with the gas flow through the gas channel, the current density decreases along with the gas flow through the gas channel. With the decrease in the molar concentration of H2 and O2, i.e., the partial pressure of H2 and O2, the gas diffusion from gas channel to the interface between Nafion membrane and cathode catalyst layer declines, resulting in the increase in the concentration over-potential [50]. In addition, it is seen from these figures that the current density is higher with the decrease in Tini. As discussed above, a higher relative humidity increases the current density [40]. Since the actual relative humidity of gas in the cell is the highest at Tini = 353 K among the investigated Tini, resulting in the current density being the highest at Tini = 353 K. As to the impact of the relative humidity of the supply gas, the current density increases when the relative humidity of the supply gas increases, irrespective of the Nafion membrane thickness and Tini. The largest current density is confirmed with A80%RH&C80%RH, while the smallest current density is confirmed with A40%RH&C40%RH. The performance of PEMFC is enhanced with the increase in humidification by the promotion of proton conductivity of Nafion membrane, resulting in lower ohmic losses [22,46]. Therefore, it was revealed that the current density is the largest with A80%RH&C80%RH, while it is the smallest with A40%RH&C40%RH. According to Figure 12, Figure 13, Figure 14 and Figure 15, it is known that the current density increases when the thickness of the Nafion membrane decreases. The thinner Nafion membrane provides lower ohmic losses, indicating that the proton transfers with a shorter distance to reach the cathode and the H2O produced in the cathode catalyst layer reaches the anode faster [49]. In addition, H2O flux of Nafion membrane as well as the conductivity of the Nafion membrane is promoted when the thickness of the Nafion membrane decreases, especially below 50 μm [21,47,48], which corresponds to Nafion NRE-212 and Nafion NRE-211 in this study. Therefore, it is revealed that the current density increases when the thickness of Nafion membrane decreases, especially for Nafion NRE-212 and Nafion NRE-211. Summarizing the above discussion, the largest current density of 0.336 A/mm2 is obtained at the position A in the case of using Nafion NRE-211 at Tini = 353 K with A80%RH&C80%RH according to Table 8, Table 9, Table 10, Table 11 and Table 12.
Considering the above results and discussion, this study can suggest that the thinner Nafion membrane under well-humidified conditions is desirable in order to obtain a higher power generation performance operated at higher temperatures such as 363 K and 373 K. In addition, the uniform distribution of the current density along with the gas flow through the gas channel is obtained by using the thinner Nafion membrane according to Figure 12, Figure 13, Figure 14 and Figure 15. However, the value of current density is still low at high temperatures such as 363 K and 373 K, even using a thinner Nafion membrane. According to Table 8, Table 9, Table 10, Table 11 and Table 12, the current density is 0.237 A/mm2 and 0.107 A/mm2 at the position A in the case of using Nafion NRE- 211 at Tini = 363 K and 373 K with A80%RH&C80%RH, respectively. To increase the current density in the case of a thinner Nafion membrane, this study suggests the optimization of the catalyst layer [9], MPL [45], and gas channel flow of the gas separator [10], not only in order to control the mass and heat transfer phenomena but also to improve the electrochemical reaction. We have to consider the degradation of the Nafion membrane if we operate PEMFC at a higher temperature than usual. This study conducted the experimental investigation using a thin Nafion membrane at higher temperatures such as 363 K and 373 K [16]. In this experiment, it was confirmed that the thin Nafion membrane kept the performance over the power generation operation of 200 h. However, it is necessary to investigate the characteristics of a thin Nafion membrane by operating for a longer time, e.g., 90,000 h (≒10 years), which is the target time according to the NEDO road map 2010 in Japan for the practical application of a PEMFC system.

4. Conclusions

The numerical simulation using a 3D model by multi-physics simulation software COMSOL Multiphysics has been conducted in order to investigate distributions of H2, O2, and H2O concentration and current density on the interface between Nafion the membrane and anode catalyst layer, and the interface between the Nafion membrane and cathode catalyst layer when operated at higher temperatures. The impacts of the Nafion membrane thickness, Tini, and relative humidity of the supply gas on these distributions have been investigated. The conclusions have been drawn as follows:
(i).
The molar concentration of H2 and O2 decreases along with the gas flow through the gas channel, irrespective of the Nafion membrane thickness and Tini.
(ii).
The O2 consumption in the fuel cell is the largest at Tini = 353 K, irrespective of Nafion membrane thickness.
(iii).
The molar concentration of H2O increases along with the gas flow through the gas channel, irrespective of the Nafion membrane thickness and Tini, which can be explained by the O2 reduction reaction at cathode.
(iv).
The current density decreases along with the gas flow through the gas channel, irrespective of Nafion membrane thickness and Tini. The current density is the largest at Tini = 353 K, irrespective of the Nafion membrane thickness.
(v).
The molar concentration of H2O increases when the relative humidity of the supply gas increases, irrespective of the Nafion membrane thickness and Tini. The molar concentration of H2O is the largest with A80%RH&C80% RH, while it is the smallest with A40%RH&C40%RH.
(vi).
The molar concentration of H2O generally decreases when the thickness of the Nafion membrane increases. The molar concentration of H2O for Nafion 115, whose thickness is 127 μm, is much smaller than that for the other thin Nafion membranes.
(vii).
It is revealed that the largest molar concentration of H2O is 15.1 mol/m3 near the outlet in the case of using Nafion NRE-211 at Tini = 353 K with A80%RH&C80%RH among the conditions investigated in this study.
(viii).
The current density is the highest at Tini = 353 K.
(ix).
The current density increases when the relative humidity of the supply gas increases, irrespective of the Nafion membrane thickness and Tini, which indicates that the power generation performance is enhanced with the increase in relative humidity due to the promotion of proton conductivity of the Nafion membrane.
(x).
The current density increases with the decrease in the Nafion membrane thickness since the H2O flux of the Nafion membrane as well as the conductivity of the Nafion membrane is promoted with the thinner Nafion membrane.
(xi).
It is revealed that the largest current density is 0.336 A/mm2 near the inlet in the case of using Nafion NRE-211 at Tini = 353 K with A80%RH&C80%RH among the conditions investigated in this study.
(xii).
This study reveals that the thinner Nafion membrane under well-humidified conditions is more desirable to obtain a higher power generation performance at higher temperatures, i.e., 363 K and 373 K. Thinner Nafion membranes can provide a uniform distribution of current density as well.
(xiii).
Since the current density at high temperatures of 363 K and 373 K, which are 0.237 A/mm2 and 0.107 A/mm2, respectively, is still low, even using Nafion NRE-211 with A80%RH&C80%RH, this study suggests the optimization of catalyst layer, MPL, and gas channel flow of gas separator in order to control the mass and heat transfer phenomena as well as to improve the electrochemical reaction.

Author Contributions

Conceptualization and writing—original draft preparation; A.N.; numerical analysis and investigation; K.T.; data curation; Y.K. and S.I.; writing—review and editing; E.H. All authors have read and agreed to the published version of the manuscript.

Funding

This research received no external funding.

Institutional Review Board Statement

Not applicable.

Informed Consent Statement

Not applicable.

Data Availability Statement

Not applicable.

Conflicts of Interest

The authors declare no conflict of interest.

References

  1. NEDO (New Energy and Industry Technology Development Organization). Available online: http://www.nedo.go.jp/cotent/100871973 (accessed on 1 November 2021). (In Japanese).
  2. Zhang, G.; Kandlikar, S.G.A. Critical Review of Cooling Technique in Proton Exchange Membrane Fuel Cell Stacks. Int. J. Hydrog. Energy 2012, 37, 2412–2429. [Google Scholar] [CrossRef]
  3. Agbossou, K.; Kolhe, M.; Hamelin, J.; Bose, T.K. Performance of a Stand-Alone Renewable Energy System Based on Energy Storage as Hydrogen. IEEE Trans. Energy Convers. 2004, 19, 633–640. [Google Scholar] [CrossRef]
  4. Li, Q.; He, R.; Jensen, J.O.; Bjerrum, N.J. Approaches and Recent Development Polymer Electrolyte Membrane for Fuel Cells Operating above 100 °C. Chem. Mater. 2003, 15, 4896–4915. [Google Scholar] [CrossRef] [Green Version]
  5. Lee, C.Y.; Wng, F.; Kuo, Y.W.; Tsai, C.H.; Cheng, Y.T.; Cheng, C.K.; Lin, J.T. In-situ Measurement of High-temperature Proton Exchange Membrane Fuel Cell Stack Using Flexible Five-in-one Micro Sensor. Sensors 2016, 16, 1731. [Google Scholar] [CrossRef] [PubMed] [Green Version]
  6. Budak, Y.; Devrim, Y. Micro-cogeneration Application of a High-temperature PEM Fuel Cell Stack Operated with Polybenzimidazole Based Membranes. Int. J. Hydrog. Energy 2020, 45, 35198–35207. [Google Scholar] [CrossRef]
  7. Jin, Y.; Wang, T.; Che, X.; Dong, J.; Liu, R.; Yang, J. New High-performance Bulky N-heterocyclic Group Functionalized Poly (Terphenyl Piperidinium) Membrane for HT-PEMFC Applications. J. Mem. Sci. 2022, 641, 119884. [Google Scholar] [CrossRef]
  8. Lee, W.J.; Lee, J.S.; Park, H.Y.; Park, H.S.; Lee, S.Y.; Song, K.H.; Kim, H.J. Improvement of Fuel Cell Performances through the Enhanced Dispersion of the PTFE Binder in Electrodes for Use in High Temperature Polymer Electrolyte Membrane Fuel Cells. Int. J. Hydrog. Energy 2020, 45, 32825–32833. [Google Scholar] [CrossRef]
  9. Xia, L.; Ni, M.; Xu, Q.; Xu, H.; Zheng, K. Optimization of Catalyst Layer Thickness for Achieving High Performance and Low Cost of High Temperature Proton Exchange Membrane Fuel Cell. Appl. Energy 2021, 291, 117012. [Google Scholar] [CrossRef]
  10. Huang, T.; Wang, W.; Yuan, Y.; Huang, J.; Chen, X.; Zhang, J.; Kong, X.; Zhang, Y.; Wan, Z. Optimization of High-temperature Proton Exchange Membrane Fuel Cell Flow Channel Based on Genetic Algorithm. Energy Rep. 2021, 7, 1374–1384. [Google Scholar] [CrossRef]
  11. Ghasabehi, M.; Shams, M.; Kanani, H. Multi-objective Optimization of Operating Conditions of an Enhanced Parallel Flow Filed Proton Exchange Membrane Fuel Cell. Energy Convers. Manag. 2021, 230, 113798. [Google Scholar] [CrossRef]
  12. Das, S.K.; Gibson, H.A. Three Dimensional Multi-Physics Modeling and Simulation for Assessment of Mass Transport Impact on the Performance of a High Temperature Polymer Electrolyte Membrane Fuel Cell. J. Power Sources 2021, 499, 161–188. [Google Scholar] [CrossRef]
  13. Xia, L.; Xu, Q.; He, Q.; Ni, M.; Seng, M. Numerical Study of High Temperature Proton Exchange Membrane Fuel Cell (HT-PEMFC) with a Focus on Rib Design. Int. J. Hydrog. Energy 2021, 46, 21098–21111. [Google Scholar] [CrossRef]
  14. Kanchan, B.K.; Randive, P.; Pati, S. Implications of Non-uniform Porosity Distribution in Gas Diffusion Layer on the Performance of a High Temperature PEM Fuel Cell. Int. J. Hydrog. Energy 2021, 46, 18571–18588. [Google Scholar] [CrossRef]
  15. Nishimura, A.; Kamiya, S.; Okado, T.; Sato, Y.; Hirota, M.; Kolhe, M.L. Heat and Mass Transfer Analysis in Single Cell of PEFC Using Different PEM and GDL at Higher Temperature. Int. J. Hydrog. Energy 2019, 44, 29631–29640. [Google Scholar] [CrossRef]
  16. Nishimura, A.; Okado, T.; Kojima, Y.; Hu, E. Impact of Microporous Layer on Heat and Mass Transfer in a Single Cell of Polymer Electrolyte Fuel Cell Using a Thin Polymer Electrolyte Membrane and a Thin Gas Diffusion Layer Operated at a High-temperature Range. ACS Omega 2021, 6, 14575–14584. [Google Scholar] [CrossRef] [PubMed]
  17. Nishimura, A.; Kono, N.; Toyoda, K.; Kojima, Y.; Kolhe, M.L. Impact Analysis of MPL on a PEFC Cell’s Temperature Distribution with Thin PEM and GDL for Operating at Higher Temperature than Usual. J. Energy Power Eng. 2021, 15, 39–51. [Google Scholar] [CrossRef]
  18. Nishimura, A.; Fukuoka, H.; Yamamoto, K.; Okado, T.; Kojima, Y.; Hirota, M.; Kolhe, M.L. Numerical Analysis of Temperature Distributions in Single Cell of PEFC by Heat Transfer Model Considering Vapor Transfer. J. Energy Power Eng. 2020, 14, 1–15. [Google Scholar] [CrossRef]
  19. Miao, T.; Tongsh, C.; Wang, J.; Cheng, P.; Liang, J.; Wang, Z.; Chen, W.; Zhang, C.; Xi, F.; Du, Q. Current Density and Temperature Distribution Measurement and Homogeneity Analysis for a Large-area Proton Exchange Membrane Fuel Cell. Energy 2022, 239, 121922. [Google Scholar] [CrossRef]
  20. Han, C.; Jiang, T.; Shang, K.; Xu, B.; Chen, Z. Heat and Mass Transfer Performance of Proton Exchange Membrane Fuel Cells with Electrode of Anisotropic Thermal Conductivity. Int. J. Heat Mass Transf. 2022, 182, 121957. [Google Scholar] [CrossRef]
  21. Springer, T.E.; Zawodzinski, T.A.; Gottsfeld, S. Polymer Electrolyte Fuel Cell Models. J. Electrochem. Soc. 1991, 138, 2334–2342. [Google Scholar] [CrossRef]
  22. Penga, Z.; Tolj, I.; Barbir, F. Computational Fluid Dynamics Study of PEM Fuel Cell Performance. Int. J. Hydrog. Energy 2016, 41, 17585–17594. [Google Scholar] [CrossRef]
  23. Yablecki, J.; Bazylak, A. Determining the Effective Thermal Conductivity of Composed PEMFC GDLs through Thermal Resistance Modeling. J. Power Sources 2012, 217, 470–478. [Google Scholar] [CrossRef]
  24. Zhang, S.Y.; Qu, Z.G.; Xu, H.T.; Talkhoncheh, F.K.; Liu, S.; Gao, Q. A Numerical Study on the Performance of PEMFC with Wedge-shaped Fins in the Cathode Channel. Int. J. Hydrog. Energy 2021, 46, 27700–27708. [Google Scholar] [CrossRef]
  25. Chen, H.; Guo, H.; Ye, F.; Ma, C.F. Improving Two-phase Mass Transportation under Non-Darcy Flow Effect in Orientated-type Flow Channels of Proton Exchange Membrane Fuel Cells. Int. J. Hydrog. Energy 2021, 46, 21600–21618. [Google Scholar] [CrossRef]
  26. Chen, H.; Guo, H.; Ye, F.; Ma, C.F. A Numerical Study of Oriented-type Flow Channels with Porous-blocked Baffles of Proton Exchange Membrane Fuel Cells. Int. J. Hydrog. Energy 2021, 46, 29443–29458. [Google Scholar] [CrossRef]
  27. Xia, L.; Ni, M.; He, Q.; Xu, Q.; Cheng, C. Optimization of Gas Diffusion Layer in High Temperature PEMFC with the Focuses on Thickness and Porosity. Appl. Energy 2021, 300, 117357. [Google Scholar] [CrossRef]
  28. Freunberger, S.A.; Reum, M.; Evertz, J.; Wokaun, A.; Buchi, F.M. Measuring the Current Distribution in PEFCs with Sub-Millimeter Resolution. J. Electrochem. Soc. 2006, 153, A2158–A2165. [Google Scholar] [CrossRef]
  29. Nishimura, A.; Sato, A.; Yoshimura, M.; Kamiya, S.; Hirota, M. Impact of Thickness of Polymer Electrolyte Membrane on Temperature Distribution in Single Cell of Polymer Electrolyte Fuel Cell Operated at High Temperature. J. Energy Power Eng. 2018, 12, 80–92. [Google Scholar] [CrossRef] [Green Version]
  30. Nishimura, A.; Shibuya, K.; Morimoto, A.; Tanaka, S.; Hirota, M.; Nakamura, M.; Kojima, Y.; Narita, M.; Hu, E. Dominant Factor and Mechanism of Coupling Phenomena in Single Cell of Polymer Electrolyte Fuel Cell. Appl. Energy 2012, 1, 73–79. [Google Scholar] [CrossRef]
  31. Cooper, N.J.; Santamaria, A.D.; Becton, M.K.; Park, J.W. Neutron Radiography Measurements of In-situ PEMFC Liquid Water Saturation in 2 D & 3 D Morphology Gas Diffusion Layers. Int. J. Hydrog. Energy 2017, 42, 16269–16278. [Google Scholar]
  32. The Japan Society of Mechanical Engineers. JSME Heat Transfer Handbook, 1st ed.; The Japan Society of Mechanical Engineers, Maruzen: Tokyo, Japan, 1993; p. 387. [Google Scholar]
  33. Reid, R.C.; Prausnitz, J.M.; Poling, B.E. The Properties of Gases and Liquids, 1st ed.; McGraw-Hill: New York, USA, 1987; p. 591. [Google Scholar]
  34. Merck. Available online: http://www.sigmaaldrich.com/japan/materialscience/alternative/nafion.html (accessed on 5 November 2021).
  35. Senn, S.M.; Poulikakos, D. Polymer Electrolyte Fuel Cells with Porous Materials as Fluid Distributors and Comparisons with Traditional Channeled Systems. Trans. ASME 2004, 126, 410–418. [Google Scholar] [CrossRef]
  36. Kang, K.; Ju, H. Numerical Modeling and Analysis of Micro-porous Layer Effects in Polymer Electrolyte Fuel Cells. J. Power Sources 2006, 194, 763–773. [Google Scholar] [CrossRef]
  37. TORAY. Available online: http://www.torayca.com/en/lineup/composites/com_009_01.html (accessed on 5 November 2021).
  38. Takayama, T. Numerical Simulation of Transient Internal States of PEFC Cell and Stack Considering Control of Anode System. Res. Rep. Mizuho Res. Technol. 2018, 9, 1–14. [Google Scholar]
  39. Rostami, L.; Nejad, P.M.G.; Vatani, A. A Numerical Investigation of Serpentine Flow Channel with Different Bend Sizes in Polymer Electrolyte Membrane Fuel Cells. Energy 2016, 97, 400–410. [Google Scholar] [CrossRef]
  40. Xing, L.; Das, P.K.; Song, X.; Mamlouk, M.; Scott, K. Numerical Analysis of the Optimum Membrane/Ionomer Water Content of PEMFCs: The Interface of Nafion Ionomer Content and Cathode Relative Humidity. Appl. Energy 2015, 138, 242–257. [Google Scholar] [CrossRef]
  41. Jia, T.; Shen, S.; Zhao, J.; Jin, J.; Pan, B.; Duan, X.; Meng, C.; Che, Q. Ultrathin Membranes Formation via the Layer by Layer Self-assembly of Carbon Nanotubes-based Inorganics as High Temperature Proton Exchange Membranes. Int. J. Hydrog. Energy 2020, 45, 14517–14527. [Google Scholar] [CrossRef]
  42. Wong, C.Y.; Wong, W.Y.; Ramya, K.; Khalid, M.; Loh, K.S.; Daud, W.R.W.; Lim, K.L.; Walvekar, R.; Kadhum, A.A.H. Additives in Proton Exchange Membranes for Low- and High-temperature Fuel Cell Applications: A Review. Int. J. Hydrog. Energy 2019, 44, 6116–6135. [Google Scholar] [CrossRef]
  43. Akitomo, F.; Sasabe, T.; Yoshida, T.; Naito, H.; Kawamura, K.; Hirai, S. Investigation of Effects of High Temperature and Pressure on a Polymer Electrolyte Fuel Cell with Polarization Analysis and X-ray Imaging of Liquid Water. J. Power Sources 2019, 431, 205–209. [Google Scholar] [CrossRef]
  44. Kim, D.H.; Min, C.M.; Lee, E.; Lee, J.S.; Pal, C. Effect of Vinylphosphonic Acid and Polymer Binders with Phosphate Groups on Performance of High-temperature Polymer Electrolyte Membrane Fuel Cell. Catal. Today 2020, 358, 333–337. [Google Scholar] [CrossRef]
  45. Fu, X.; Li, T.; Tang, L.; Deng, X.; Zhang, R.; Hu, S.; Zhao, F.; Li, X.; Liu, Q. Reticulated Polyaniline Nanowires as a Cathode Microporous Layer for High-temperature PEMFCs. Int. J. Hydrog. Energy 2021, 46, 8802–8809. [Google Scholar] [CrossRef]
  46. Abdin, Z.; Webb, C.J.; Gray, E.M. PEM Fuel Cell Model and Simulation in Matlab-Simulink Based on Physical Parameters. Energy 2016, 116, 1131–1144. [Google Scholar] [CrossRef]
  47. Mohanta, P.K.; Ripa, M.S.; Regnet, F.; Jorissen, L. Impact of Membrane Types and Catalyst Layers Composition on Performance of Polymer Electrolyte Membrane Fuel Cells. Chem. Open 2020, 9, 607–615. [Google Scholar] [CrossRef] [PubMed]
  48. Rakhshanpouri, S.; Rowshanzamir, S. Water Transport through a PEM (Proton Exchange Membrane) Fuel Cell in a Seven-layer Model. Energy 2013, 50, 220–231. [Google Scholar] [CrossRef]
  49. Ferreira, R.B.; Falcao, D.S.; Oliveira, V.B.; Pinto, A.M.F.R. Experimental Study on the Membrane Electrode Assembly of a Proton Exchange Membrane Fuel Cell: Effects of Microporous Layer, Membrane Thickness and Gas Diffusion Layer Hydrophobic Treatment. Electrochim. Acta 2017, 224, 337–345. [Google Scholar] [CrossRef]
  50. Xu, B.; Li, D.; Ma, Z.; Zheng, M.; Li, Y. Thermodynamic Optimization of a High Temperature Proton Exchange Membrane Fuel Cell for Fuel Cell Vehicle Applications. Mathematics 2021, 9, 1792. [Google Scholar] [CrossRef]
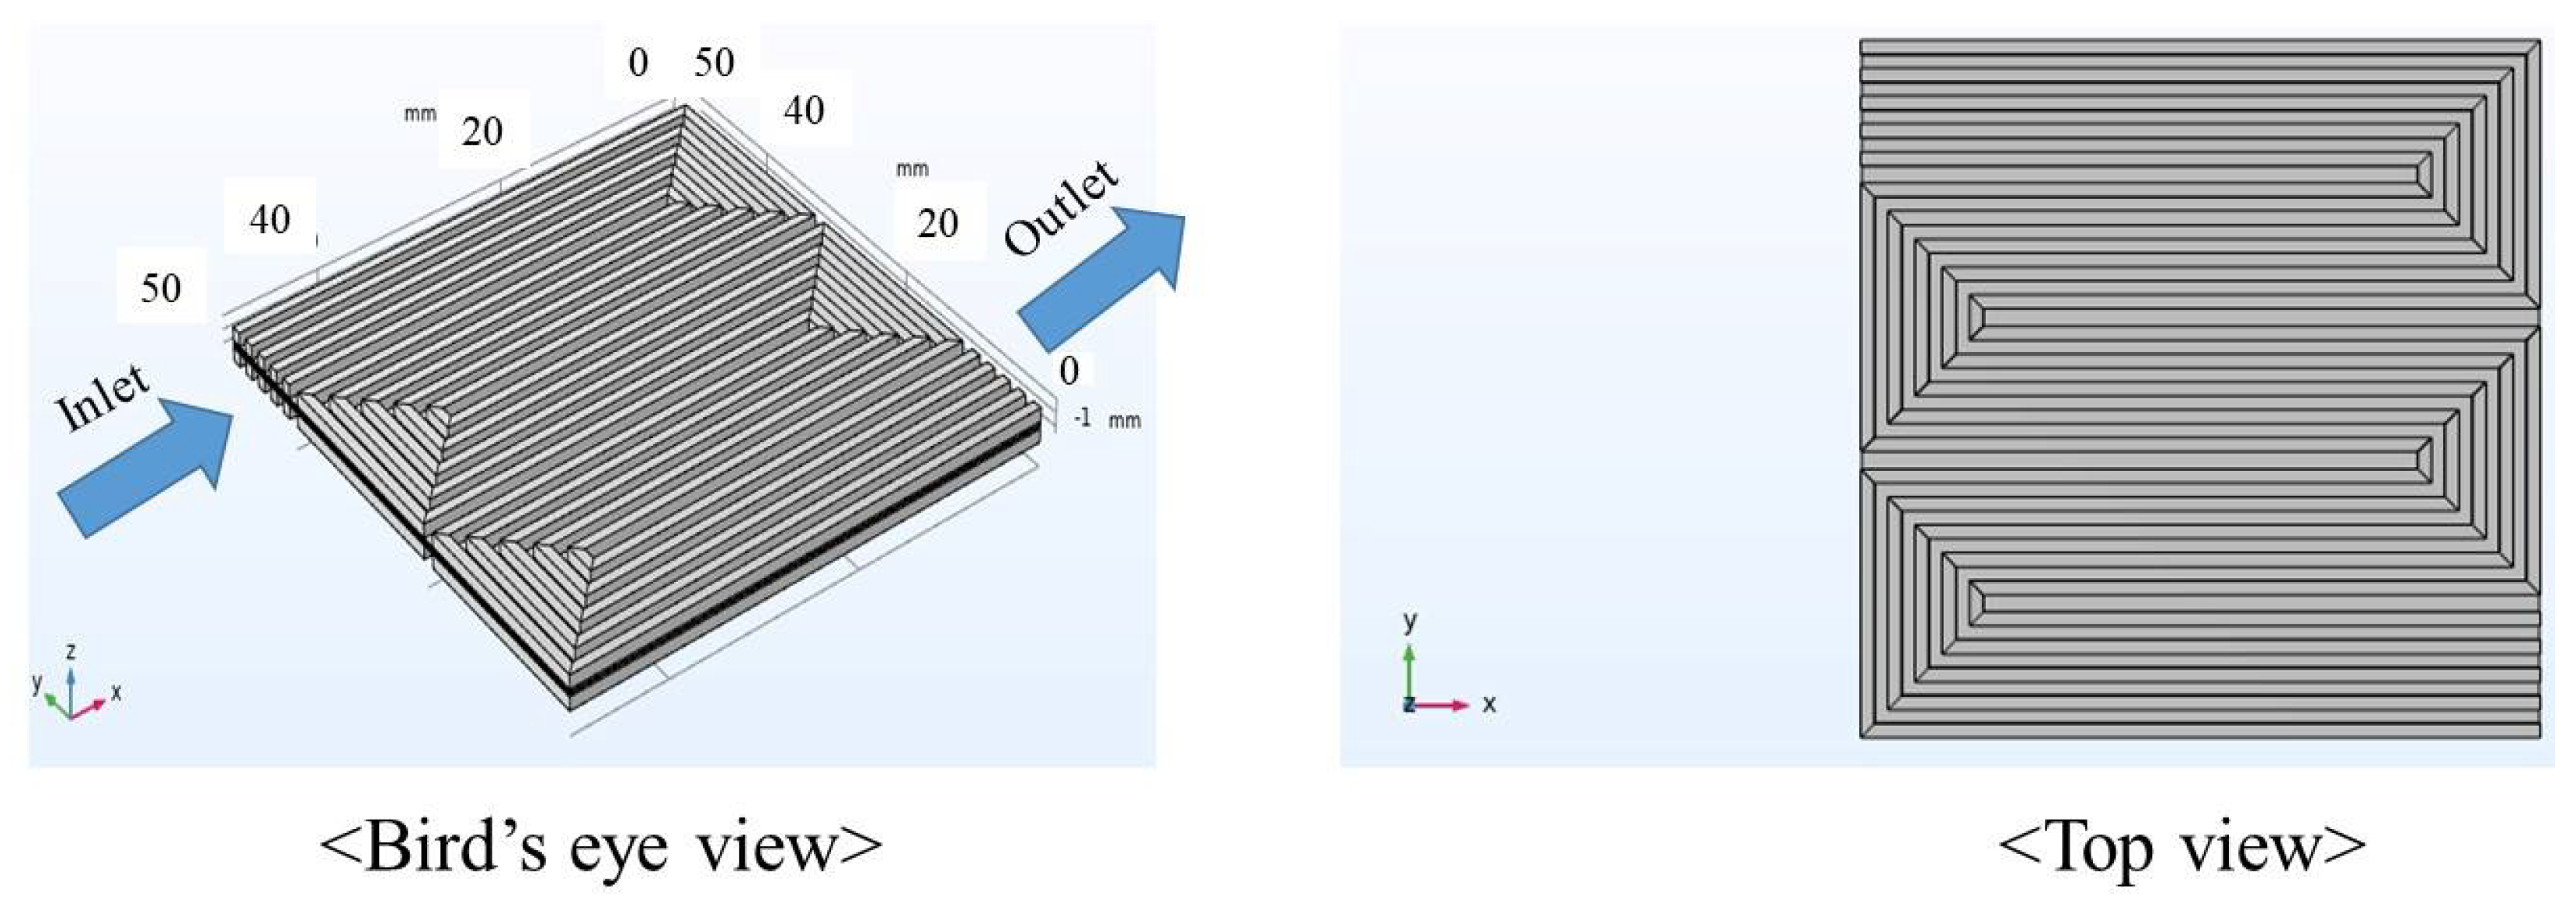
Figure 1. Three-dimensional model for numerical simulation.
Energies 14 08256 g001
Figure 2. Comparison of in-plane molar concentration distribution of H2 on the interface between Nafion membrane and anode catalyst layer among different Nafion membranes and Tini (A80%RH&C80%RH; left: 353 K, center: 363 K, right: 373 K).
Energies 14 08256 g002
Figure 3. Comparison of in-plane molar concentration distribution of O2 on the interface between Nafion membrane and cathode catalyst layer among different Nafion membranes and Tini (A80%RH&C80%RH; left: 353 K, center: 363 K, right: 373 K).
Energies 14 08256 g003
Figure 4. Comparison of in-plane molar concentration distribution of H2O on the interface between Nafion membrane and cathode catalyst layer among different Nafion membranes and Tini (A80%RH&C80%RH; left: 353 K, center: 363 K, right: 373 K).
Energies 14 08256 g004
Figure 5. Comparison of in-plane distribution of current density on the interface between Nafion membrane and cathode catalyst layer among different Nafion membranes and Tini (A80%RH&C80%RH; left: 353 K, center: 363 K, right: 373 K).
Energies 14 08256 g005
Figure 6. Analysis points for the quantitative evaluation along with the gas flow through the gas channel.
Energies 14 08256 g006
Figure 7. Comparison of molar concentration of H2O along with the gas flow through the gas channel on the interface between Nafion membranes and cathode catalyst layer among different Nafion membranes and Tini (A80%RH&C80%RH; (a): 353 K, (b): 363 K, (c): 373 K).
Energies 14 08256 g007
Figure 8. Comparison of molar concentration of H2O along with the gas flow through the gas channel on the interface between Nafion membranes and cathode catalyst layer among different Nafion membranes and Tini (A80%RH&C40%RH; (a): 353 K, (b): 363 K, (c): 373 K).
Energies 14 08256 g008
Figure 9. Comparison of molar concentration of H2O along with the gas flow through the gas channel on the interface between Nafion membrane and cathode catalyst layer among different Nafion membranes and Tini (A40%RH&C80%RH; (a): 353 K, (b): 363 K, (c): 373 K).
Energies 14 08256 g009
Figure 10. Comparison of molar concentration of H2O along with the gas flow through the gas channel on the interface between Nafion membrane and cathode catalyst layer among different Nafion membranes and Tini (A40%RH&C40%RH; (a): 353 K, (b): 363 K, (c): 373 K).
Energies 14 08256 g010
Figure 11. Comparison of saturation of H2O along with the gas flow through the gas channel among different Nafion membranes at Tini = 353 K with A80%RH&C80%RH.
Energies 14 08256 g011
Figure 12. Comparison of current density along with the gas flow through the gas channel on the interface between Nafion membrane and cathode catalyst layer among different Nafion membranes and Tini (A80%RH&C80%RH; (a): 353 K, (b): 363 K, (c): 373 K).
Energies 14 08256 g012
Figure 13. Comparison of current density along with the gas flow through the gas channel on the interface between Nafion membrane and cathode catalyst layer among different Nafion membranes and Tini (A80%RH&C40%RH; (a): 353 K, (b): 363 K, (c): 373 K).
Energies 14 08256 g013
Figure 14. Comparison of current density along with the gas flow through the gas channel on the interface between Nafion membrane and cathode catalyst layer among different Nafion membranes and Tini (A40%H&C80%RH; (a): 353 K, (b): 363 K, (c): 373 K).
Energies 14 08256 g014
Figure 15. Comparison of current density along with the gas flow through the gas channel on the interface between Nafion membrane and cathode catalyst layer among different Nafion membranes and Tini (A40%RH&C40%RH; (a): 353 K, (b): 363 K, (c): 373 K).
Energies 14 08256 g015
Table 1. Geometrical parameters of 3D model for numerical simulation [22,28,29,30,31].
ComponentsSizeCharacteristics
PEM50.0 mm × 50.0 mm × 0.127 mm (for Nafion 115), 0.051 mm (for Nafion NRE-212) and 0.025 mm (for Nafion NRE-211)Nafion 115, Nafion NRE-212, Nafion NRE-211 (manufactured by Du Pont Corp.)
Catalyst layer50.0 mm × 50.0 mm × 0.01 mmPt/C (Pt: 20 wt%)
MPL50.0 mm × 50.0 mm × 0.003 mmPTFE + carbon black
GDL50.0 mm × 50.0 mm × 0.19 mmTGP-H-060 (manufactured by Toray Corp.)
Gas separator50.0 mm × 50.0 mm × 2.00 mm (thickness of rib: 1.00 mm) (width of gas channel and rib: 1.0 mm, thickness of gas channel: 1.0 mm)Carbon graphite, serpentine
Table 2. Physical parameters for numerical simulation in this study.
Parameter NameValue
Density of H2 (kg/m3)7.10 × 10−2 (353 K), 6.89 × 10⁻² (363 K), 6.69 × 10⁻² (373 K) [32]
Density of O2 (kg/m3)1.11 (353 K), 1.08 (363 K), 1.05 (373 K) [32]
Density of H2O (kg/m3)2.95 × 10−1 (353 K), 4.26 × 10⁻¹ (363 K), 6.01 × 10⁻¹ (373 K) [32]
Viscosity of H2 (Pa s)9.96 × 10⁻⁶ (353 K), 1.02 × 10⁻⁵ (363 K), 1.03 × 10⁻⁵ (373 K) [32]
Viscosity of O2 (Pa s)2.35 × 10⁻⁵ (353 K), 2.40 × 10⁻⁵ (363 K), 2.45 × 10⁻⁵ (373 K) [32]
Viscosity of H2O (Pa s)1.16 × 10⁻⁵ (353 K), 1.19 × 10⁻⁵ (363 K), 1.23 × 10⁻⁵ (373 K) [32]
Binary diffusion coefficient between H2 and H2O (m2/s)9.27 × 10−5 [33]
Binary diffusion coefficient between O2 and H2O (m2/s)3.57 × 10−5 [33]
Porosity of catalyst layer ( )0.78 [17,22,29,30,31]
Permeability of catalyst layer (m2)8.69 × 10⁻¹² [17,22,29,30,31]
Porosity of MPL ( )0.60 [17,22,29,30,31]
Permeability of MPL (m2)1.00 × 10⁻¹³ [17,22,29,30,31]
Porosity of GDL ( )0.78 [17,22,29,30,31]
Permeability of GDL (m2)8.69 × 10⁻¹² [17,22,29,30,31]
Conductivity of Nafion series membrane (S/m)10 [34]
Conductivity of catalyst layer (S/m)53 [35]
Conductivity of MPL (S/m)1000 [36]
Conductivity of GDL (S/m)1250 [37]
Anode reference equilibrium potential (V)0
Cathode reference equilibrium potential (V)1.229
Anode reference exchange current density (A/m2)1000 [38]
Cathode reference exchange current density (A/m2)1 [38]
Anode charge transfer coefficient ( )0.5 [39]
Cathode charge transfer coefficient ( )0.5 [40]
Table 3. Operation conditions for numerical simulation in this study.
Each ConditionValue
The initial temperature of cell (Tini) (K)353, 363, 373
Cell voltage (V)Experimental data are used [16,17]
Supply gas condition
AnodeCathode
Gas typeH2O2
Temperature of supply gas at inlet (K)353, 363, 373353, 363, 373
Relative humidity of supply gas (%RH)40, 8040, 80
Pressure of supply gas at inlet (absolute) (MPa)0.40.4
Flow rate of supply gas at inlet [NL/min] (Stoichiometric ratio ( ))0.210 (1.5)0.105 (1.5)
Table 4. Comparison of molar concentration of H2O along with the gas flow through the gas channel on the interface between Nafion membranes and cathode catalyst layer among different Nafion membranes and Tini (unit: mol/m3; A80%RH&C80%RH).
ABCDEFGHIJK
353 K
1150.7212.073.144.275.226.257.128.058.859.6110.3
2120.7932.874.466.107.468.8810.111.312.413.314.2
2110.8133.084.816.578.029.5310.812.113.214.215.1
363 K
1150.9552.233.234.285.186.136.967.848.599.319.93
2120.9792.493.674.895.927.027.968.949.7810.611.3
2110.9812.513.704.935.977.088.029.019.8510.611.3
373 K
1151.171.581.912.272.582.933.233.563.854.134.38
2121.191.772.242.743.173.654.064.524.915.295.63
2111.201.862.392.953.453.984.454.955.405.826.20
Table 5. Comparison of molar concentration of H2O along with the gas flow through the. gas channel on the interface between Nafion membranes and cathode catalyst layer among different Nafion membranes and Tini (unit: mol/m3; A80%RH&C40%RH).
ABCDEFGHIJK
353 K
1150.4251.682.683.734.625.596.417.308.058.779.40
2120.4772.283.685.136.357.638.719.8510.811.712.5
2110.4922.443.965.526.818.179.3110.511.512.513.3
363 K
1150.5271.462.213.013.694.445.075.776.366.947.44
2120.5571.802.783.814.685.636.437.298.028.729.33
2110.5752.003.124.285.276.327.218.168.979.7310.4
373 K
1150.6441.021.331.661.952.282.562.873.143.403.64
2120.6641.251.722.232.673.163.574.034.434.825.16
2110.6751.371.922.523.153.604.084.615.075.515.91
Table 6. Comparison of molar concentration of H2O along with the gas flow through the gas channel on the interface between Nafion membranes and cathode catalyst layer among different Nafion membranes and Tini (unit: mol/m3; A40%RH&C80%RH).
ABCDEFGHIJK
353 K
1150.7061.912.863.874.735.676.467.318.058.749.36
2120.7582.493.835.236.407.648.699.7910.711.612.4
2110.7732.654.105.606.858.179.2710.411.412.313.1
363 K
1150.9151.802.513.263.914.625.235.896.467.017.49
2120.9452.123.054.034.865.766.537.358.068.739.32
2110.9542.213.214.255.136.086.897.768.509.209.82
373 K
1151.161.411.621.852.052.272.462.682.873.053.22
2121.181.702.112.552.943.373.744.154.504.855.15
2111.191.802.282.813.263.764.194.665.075.465.82
Table 7. Comparison of molar concentration of H2O along with the gas flow through the gas channel on the interface between Nafion membranes and cathode catalyst layer among different Nafion membranes and Tini (unit: mol/m3; A40%RH&C40%RH).
ABCDEFGHIJK
353 K
1150.3681.011.542.112.593.133.604.114.564.995.37
2120.4381.832.934.095.066.127.007.968.779.5310.2
2110.4532.003.224.505.566.717.678.709.5710.411.1
363 K
1150.4640.7270.9441.181.391.621.822.042.242.432.60
2120.5291.092.253.063.754.515.165.866.477.057.55
2110.5391.592.433.324.084.905.616.377.027.648.18
373 K
1150.6150.6930.7570.8280.8900.9601.021.091.151.211.26
2120.6501.091.451.842.182.562.883.243.553.864.13
2110.6571.161.572.012.402.823.193.603.904.294.59
Table 8. Comparison of current density along with the gas flow through the gas channel on the interface between Nafion membranes and cathode catalyst layer among different Nafion membranes and Tini (unit: A/mm2; A80%H&C80%RH).
ABCDEFGHIJK
353 K
1150.1970.1940.1920.1900.1870.1850.1820.1800.1780.1750.173
2120.3070.3000.2930.2890.2810.2770.2700.2650.2590.2540.250
2110.3360.3280.3200.3140.3050.2990.2910.2860.2770.2720.266
363 K
1150.1970.1930.1910.1890.1860.1840.1810.1790.1760.1740.172
2120.2340.2300.2260.2230.2180.2150.2110.2080.2040.2000.198
2110.2370.2320.2280.2250.2200.2170.2120.2090.2050.2010.198
373 K
1150.0660.0650.0650.0650.0640.0640.0630.0630.0620.0620.062
2120.0940.0930.0920.0920.0910.0900.0890.0880.0880.0870.086
2110.1070.1060.1050.1040.1030.1020.1010.1000.0990.0980.097
Table 9. Comparison of current density along with the gas flow through the gas channel. on the interface between Nafion membranes and cathode catalyst layer among different Nafion membranes and Tini (unit: A/mm2; A80%H&C40%RH).
ABCDEFGHIJK
353 K
1150.1750.1720.1700.1680.1660.1640.1620.1600.1580.1560.154
2120.2530.2480.2440.2400.2350.2310.2260.2230.2180.2140.211
2110.2760.2700.2460.2600.2530.2490.2430.2390.2330.2290.225
363 K
1150.1350.1330.1320.1310.1290.1280.1270.1250.1240.1230.122
2120.1800.1780.1750.1730.1700.1680.1650.1630.1600.1580.156
2110.2080.2040.2010.1980.1940.1910.1870.1850.1810.1780.176
373 K
1150.0570.0560.0560.0550.0550.0550.0540.0540.0540.0530.053
2120.0880.0870.0860.0860.0850.0840.0830.0830.0820.0810.081
2110.1040.1030.1020.1010.1000.0990.0980.0970.0960.0950.094
Table 10. Comparison of current density along with the gas flow through the gas channel on the interface between Nafion membranes and cathode catalyst layer among different Nafion membranes and Tini (unit: A/mm2; A40%RH&C80%RH).
ABCDEFGHIJK
353 K
1150.1750.1730.1710.1690.1670.1650.1630.1610.1590.1570.155
2120.2540.2490.2450.2410.2360.2330.2280.2250.2200.2160.213
2110.2770.2700.2650.2610.2550.2510.2450.2410.2350.2310.227
363 K
1150.1360.1340.1330.1320.1300.1320.1280.1270.1250.1240.123
2120.1810.1780.1760.1740.1710.1700.1670.1650.1620.1600.159
2110.1950.1920.1890.1870.1830.1810.1780.1760.1730.1700.168
373 K
1150.0410.0410.0410.0410.0400.0400.0400.0400.0390.0390.039
2120.0830.0820.0820.0810.0800.0800.0790.0790.0780.0770.077
2110.0980.0970.0960.0960.0950.0940.0930.0920.0910.0910.090
Table 11. Comparison of current density along with the gas flow through the gas channel on the interface between Nafion membrane and cathode catalyst layer among different Nafion membranes and Tini (unit: A/mm2; A40%RH&C40%RH).
ABCDEFGHIJK
353 K
1150.0890.0880.0880.0870.0860.0860.0850.0850.0840.0830.083
2120.1950.1910.1890.1860.1830.1810.1780.1760.1730.1700.168
2110.2180.2140.2100.2070.2030.2000.1960.1940.1900.1900.184
363 K
1150.0380.0370.0370.0370.0370.0370.0370.0360.0360.0360.036
2120.1380.1360.1350.1330.1320.1300.1290.1280.1260.1250.123
2110.1530.1510.1490.1470.1450.1430.1410.1400.1380.1360.135
373 K
1150.0120.0120.0120.0110.0110.0110.0110.0110.0110.0110.011
2120.0660.0660.0650.0650.0640.0640.0640.0630.0620.0620.062
2110.0760.0750.0750.0740.0740.0730.0720.0720.0720.0710.070
Table 12. Comparison of relationship between current of 20 A and voltage among investigated conditions in this study).
A80%RH&C80%RH
Tini [K]353363373
Nafion type115212211115212211115212211
Voltage [V]0.5810.6310.6360.6010.6110.6060.4610.5010.516
A80%RH&C40%RH
Tini [K]353363373
Nafion type115212211115212211115212211
Voltage [V]0.5610.6010.6060.5410.5710.5860.4410.4810.511
A40%RH&C80%RH
Tini [K]353363373
Nafion type115212211115212211115212211
Voltage [V]0.5610.6010.6060.5410.5710.5760.4010.4810.501
A40%RH&C40%RH
Tini [K]353363373
Nafion type115212211115212211115212211
Voltage [V]0.4610.5610.5710.3710.5310.5410.2910.4510.466
Publisher’s Note: MDPI stays neutral with regard to jurisdictional claims in published maps and institutional affiliations.