1. Introduction
This article presents the research results on a prediction, navigation and asset management system for smart building. Its task is to detect and determine the location of users and then optimize the environmental parameters of users depending on their learned preferences and the nature of the building’s daily life cycle. The most important two elements providing these features are radio tomography and computational intelligence.
Radio tomographic imaging (RTI) is a field of knowledge dealing with the creation of non-invasive cross-sections of areas (less frequently objects) subjected to electromagnetic waves at a specific frequency [
1,
2,
3]. It is due to the increased tendency of some ranges of radio waves to be scattered and reflected. This phenomenon is especially noticeable in the example of water, the high percentage of which in living organisms makes them perfect for detecting people and animals in closed rooms [
4,
5]. The strength of radio signals measured between transmitters and receivers with the line of sight of the devices intact compared to the strength of the signal resulting from the introduction of an obstacle or interference is a measure that allows determining the presence of a human despite the absence of any electronic device transmitting a signal (e.g., as in the case of traditional triangulation) [
6]. With a certain tolerance, they also allow the detection of inanimate elements of the environment, but it is strongly dependent on the material they are made of. This phenomenon is fundamental due to the detection capabilities of radio tomography [
7].
In its simplest form, the radio wave imaging technique involves measuring the amplitude of the signal carrier and converting it into useful information using an analog-to-digital converter. Constant comparison of the newly obtained measurement with the previous sample is the basis for the analysis and determination of whether the examined area has been disturbed or not [
8,
9]. This system presents a more comprehensive solution based on a communication protocol operating in the 2.4 GHz band, i.e., part of the ISM band (industrial, scientific, medical). Examples include Bluetooth LE 5th generation or IEEE 802.11 b/g/n [
10]. The use of the communication protocol not only allows for the exchange of information between a pair of devices with mutual signal quality but also enables wireless transport of the obtained measurement data to the central unit, which is a storage device and realizes image reconstruction using appropriate algorithms [
11,
12].
The same data also serve as samples for teaching computational intelligence. The artificial intelligence obtained in this way, against the background of the comparison of the positions of individual users and logs containing environmental data, can manage energy resources in such a way as to maximize the economic and environmental values of the building [
13,
14]. It is done while maintaining maximum comfort for users. For the system to relate to individual users and remember their preferences, the radio tomography system coexists with a navigation system using wireless ID tags. This mechanism, in turn, is correlated with the control of access to the rooms of individual employees who, using the Bluetooth identifiers located next to them, can touch-free open rooms to which the administrator has granted them access. It is an alternative to commonly known RFID systems based on pulling out and applying the tag to the reader.
Another subsystem is the control system on the comfort controllers, corrected using tracking and navigation systems. It consists of specialized units, each of which is dedicated to one of the comfort systems. In the case of the presented system, it is a lighting, air conditioning, ventilation and heating controller [
15,
16]. They all communicate via Bluetooth and Wi-Fi. In this case, Bluetooth is responsible for the mutual communication between actuators and drivers, while Wi-Fi provides a connection with the server and allows remote control of devices [
10]. It is done using a dedicated web service. The implementation of the system using identifiers allowed, in turn, adding a network module that allows recording the working time of individual employees. Signals from door tags received by phone with a dedicated application that works in the background can simultaneously determine the user’s approximate location [
17,
18,
19]. Combined with radio tomographic imaging technology, targeting errors due to personal transmitter/ID user retention can be eliminated.
Data on parameters are provided by another element of the PAN network, i.e., a set of sensors located in various characteristic places of the building. These collections include sensors of physical quantities such as temperature, humidity, carbon dioxide content in the air and light intensity [
14]. As can be easily seen, the collections only contain sensors that can provide valuable data for controlling the comfort modules. It is also worth emphasizing that all sensors operating within one room or its part are located on a standard laminate within one PCB (printed circuit board). These are the only elements of the system that work on a battery. Therefore, they have implemented energy-saving mechanisms (standby and sleep) [
18]. As these are modules with low hardware and energy resources, they use one of the comfort modules as an access gateway to the network and provide measurement data via Bluetooth 5 technology [
10].
The last elements are energy consumption monitoring subsystems and equipment inventory. The preview of energy consumption is to help in demonstrating the energy efficiency of the presented solution, which should be increasing along with the learning process by artificial intelligence energy [
20,
21,
22]. Observation is made possible by modules with a relay and Wi-Fi connectivity plugged into plug sockets. The principle of the equipment inventory resembles Bluetooth identifiers, but their task is to make it easier for users to find characteristic devices such as a photocopier or an express machine. Otherwise, it may act as a control function in checking the presence of stored material goods.
All the outlined subsystems complement each other and affect the overall functionality of the learned computational intelligence [
23,
24,
25]. With the help of radio tomography, the system can precisely determine users’ location, regardless of whether it has an electronic identification device with it or whether it has been left in another place of the cattle or lost [
26,
27,
28]. The RSSI (received signal strength indication) indicator obtained in this way is more stable than traditional tracking methods using distance scaling using the TX Power parameter and estimating the distance from the individual transmission/scanning points [
10,
18]. As an example of such an application, systems may use beacons as a reference signal source for the user’s telephone. It is even worse in the case of systems based on determining the position based on the signal from a single transmitter, where in the case of technologies such as Bluetooth or Wi-Fi, despite correctly performed calibration, the distance assessment may vary even within the range of individual meters [
29,
30]. Such solutions, unlike radio tomography, do not offer too many possibilities for the implementation of algorithms correcting random errors. Using a tight measurement grid consisting of sixteen measurement probes, it becomes possible to use specialized algorithms and statistical models to extract valuable signals from noise [
31,
32,
33]. The general structure of the smart building network is shown in
Figure 1. The box between the dotted lines represents the Home Assistant master server and the Apache Kafka software that works with it, allowing it to communicate with every other component in the system [
34,
35]. To its left is the software supporting the service. For example, it enables the service to record readings, create statistics and present data in a form more convenient for the user (e.g., Grafana software version 7.0.4). On the right side, the system is distributed to the individual customers using the service, of which the terminal devices/actuators/sensors visible on the far right side of the figure are connected to the control panel via PANs of various types [
36,
37].
There are several main motivations for developing such systems depending on the component under discussion. For RTI, it is about continuously improving the accuracy of indoor navigation [
38]. This is done primarily when confronted with already well-known systems based on beacons. On the other hand, RTI systems can be a response to the constantly tightening legislation in relation to the conditions and places of use of CCTV systems (e.g., due to EU-wide data protection regulations) [
39,
40,
41].
As regards the control and centralization itself, the aim is to unify individual components of the system as much as possible without the need to divide them according to the technology in which they are made and, then, by means of computational intelligence controlling actuators, to successively achieve energy and financial savings [
34]. It should be emphasized that this is done without detriment to the comfort of users. From the perspective of the entire project, we are talking about an innovative, easily scalable and multi-protocol platform with adaptive capabilities [
42,
43].
2. Materials and Methods
This section presents the individual components of the system, its physical structure, topology, measurement models and computational algorithms related to the functioning of the radio tomograph and the implemented computational intelligence. In addition, it includes descriptions of the hardware values of individual subsystems mentioned in the introduction, dependencies between the individual components of the system, methods of their communication both with each other and the primary computing and service server, the structure of the control panel and its functions, the measurement method for RTI and the algorithm processing the obtained measurement matrices into helpful information, as well as methodologies for teaching computational intelligence to build control [
44,
45,
46,
47].
This section presents the hardware and software layer used to create a 5th generation Bluetooth-powered radio tomograph, individual communication paths between transmitters, receivers and the central unit and the entire path of the obtained information and what processes it undergoes until the heat map is obtained [
48].
2.1. Radio Tomography Imaging—Hardware
The basic unit of the presented radio tomograph is a radio probe, which is two interconnected radio systems based on nRF52832 wireless microcontrollers. They can support many communication protocols, but in the case of this software implementation, the built-in technology includes Bluetooth 5th generation (2.4 GHz band) [
10,
18]. One of the microcontrollers has only a one-to-many transmitting function, while the other performs a continuous scanning of the environment in search of transmitting units. Each of the modules (both the transmitter and the scanner) has been equipped with an independent antenna (two extreme edges of the PCB with the copper removed), thanks to which it is not necessary to share resources between the radio SoCs (systems on chip) [
49]. As a result, it becomes possible to achieve the maximum speed of measurement data acquisition, which later translates into the number of reconstruction frames per second obtained. Furthermore, the risk of competition for priority by the software parts responsible for transmitting and reading data has been removed in this way. For a better explanation, PCB constructions are presented in
Figure 2, while the detailed electrical structure is presented in
Figure 3.
In the case of microcontroller peripherals, a full-size standard programmer connector was led out, using a pin strip with a pitch of 1.27 mm and 10 pins divided into two equal rows. Both modules are equipped with independent LED signaling devices to observe the correct sequence of measurements and the proper triggering of individual functions of the radio probe, which are described in more detail in the following subsections. Furthermore, in order to facilitate the observation of the probe operation, several optional jumpers and connectors were added, such as two-pin strips with a pitch of 1.27 mm used as serial port line breaks and test points, breaks and measurement points for power lines of individual modules and additional elements, battery breaks and a voltage measurement point, a CR2477 battery basket adequate for the application, an antenna connector for communication via NFC and a docking port connector, which is an extension of the test platform and is embedded in the plate cutout. The last-mentioned port is for additional optional elements and at the same time constitutes a separation for two radio modules, the positive influence of which can be additionally limited by the use of mounting points for shielding. Furthermore, they are used to cooperate with memorable hooks, in which a copper ribbon can be embedded, which can limit the probe from receiving its signals, which from the point of view of algorithms, have no value (these are presented further in the article). As the primary power source, one can treat the micro USB port, which can be used with a standard cable to supply a voltage of 5 V, which then, due to the electrical parameters of the nRF52832 microcontroller, must be lowered to 3.3 V. It was achieved with a voltage stabilizer, which also provides additional separation from disturbances from the power system.
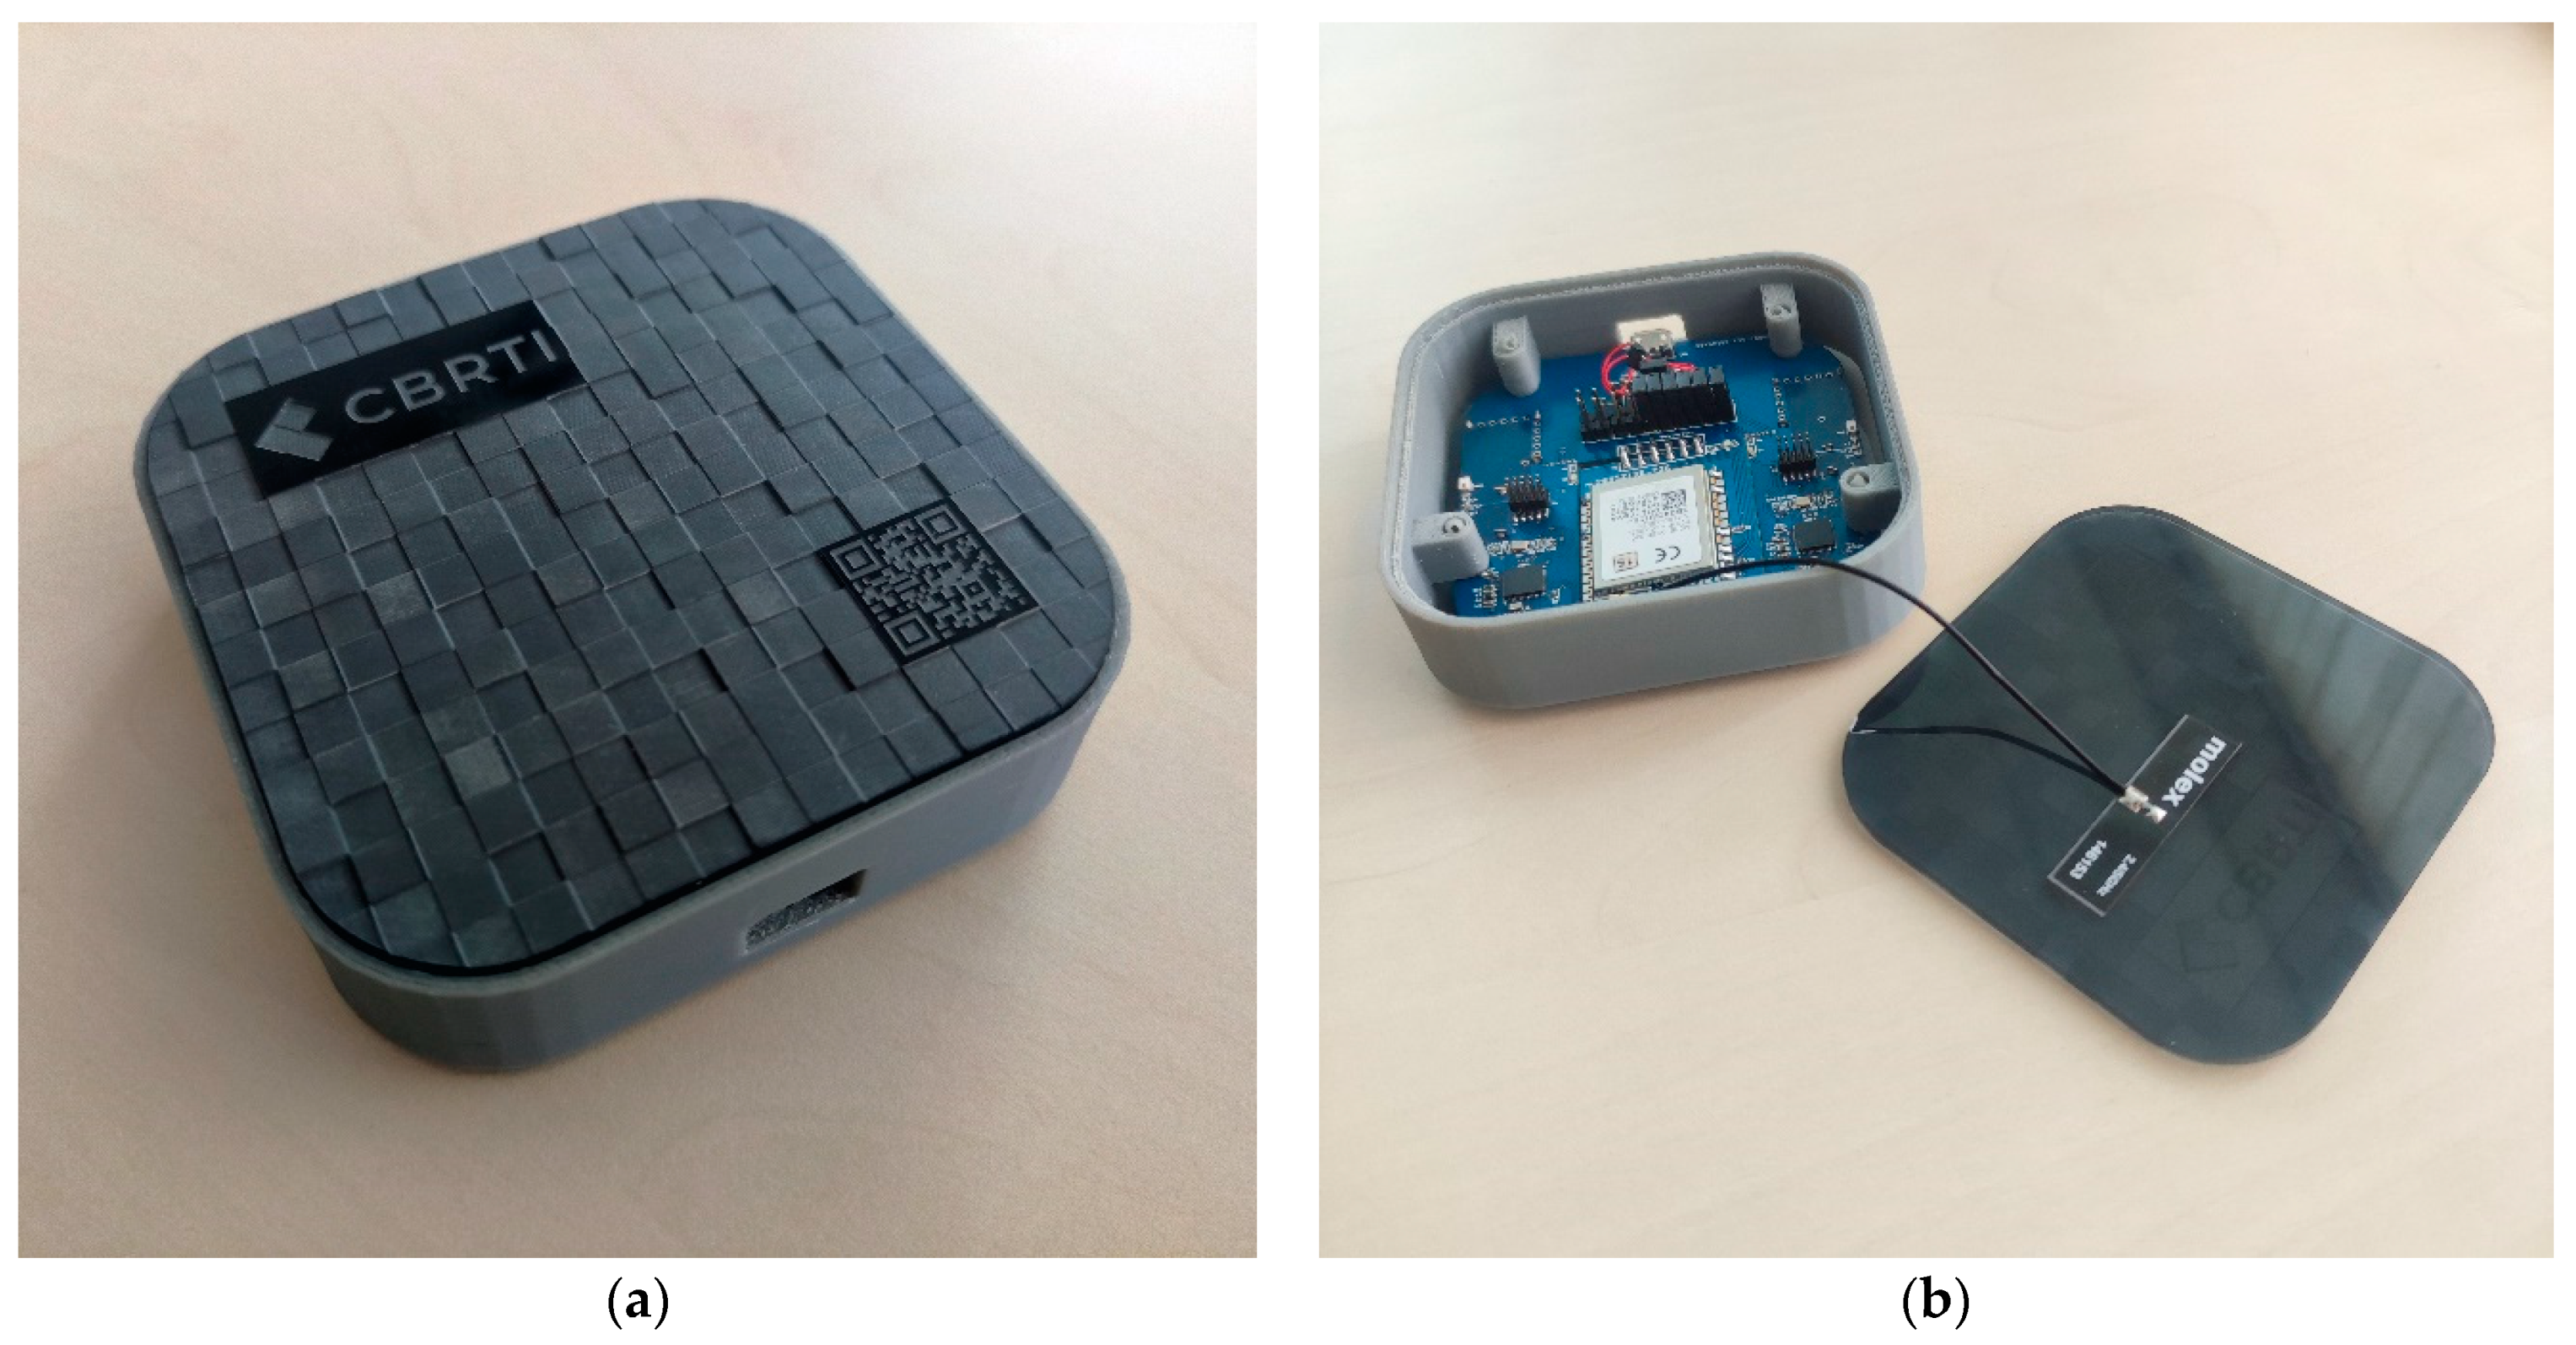
The hole is enclosed in a housing made of plastics (trim made of sinters on a powder printer + front and back made of acrylic glass on a laser plotter). The external and internal view of the complete device is shown in
Figure 4. For mounting the PCB, four mounting holes located on the edges of the board are used. Since the antennas used have a directional radiation pattern, the electronics must be mounted so that they are facing the front of the housing.
Since the presented probes are only a signal source to maintain a uniform load of nRF52832 microcontrollers, the function of data acquisition and preprocessing and the connection to the network were transferred to a unit with much larger computing resources. It is a miniature single PCB computer Jetson Nano with a quad-core ARM Cortex A57 processor, a Maxwell graphics chip with 128 CUDA cores and 4 GB of DDR4 RAM. Such resources allowed the use of the Ubuntu Linux operating system and Qt Designer software to create high-performance C ++ code for handling requests and a simple graphical interface to present the results from the measuring portion of the radio tomograph. All operations can be performed remotely via the command line or in cooperation with the 7-inch touch display, which is also an additional communication interface between the system and the operator (additional to the traditional mouse and keyboard).
Based on tests carried out with the built-in Bluetooth/Wi-Fi network card, unstable cooperation of the mentioned component with the Qt application was found; thus, it was decided to leave the Internet communication support card, and the Bluetooth communication was transferred to the proprietary expansion card that was attached to the platform Jetson Nano using a serial port. It consists of a single nRF52832 microcontroller and components necessary for operation, such as processor clocking sources, signaling the presence of power supply of processor activity (RGB), programmer connector, U.FL connector to enable the installation of an omnidirectional antenna (the need to ensure a good level of communication, regardless of the direction of message arrival) and a serial port on the edges of the PCB. The resulting central unit of the tomograph is presented in
Figure 5.
The radio probe and the central unit make up the radio tomograph, but to ensure long-term failure-free operation, the data collected and stored for a specific time inside the CU must be formatted and sent to a service server with appropriate computing power and disk space due to the generation of heat maps. These computational algorithms require appropriate hardware resources and indicate the need to store vast amounts of data necessary to train computational intelligence. In addition, cyclical data transfer to the server enables faster image reconstruction and its presentation on any multimedia device equipped with a web browser. In addition, such a connection enables easy and quick reconfiguration of reconstruction settings, such as a model of a planar area under observation. It can be changed remotely by uploading the model to the server.
2.2. Radio Tomography Imaging—Measurement Models
The measurement model used in the presented tomograph mainly uses one-to-many transmission without sending confirmations or the possibility of using the scan response (specific to Bluetooth) function, which allows them to obtain additional portions at the request of interested recipients of data. The characteristic of this type of connection is that they do not maintain permanent connections (they do not exchange security keys, do not refer to each other using addresses and do not encrypt data using AES keys).
To measure the signal and communicate with each other, the probes and the central unit use the previously mentioned 2.4 GHz band, which, in the case of Bluetooth LE, is divided into 40 channels starting at 2402 MHz with 2 MHz intervals up to 2480 MHz [
10]. Their distribution and, at the same time, the force with which the radio tomograph affects them are presented in
Figure 6.
The channels in Bluetooth 5 are divided into two main groups: channels intended for communication when establishing a connection and channels intended for the initial search for devices ready for pairing (channels 1 to 36) or devices providing services such as those similar to beacons (channels 37, 38 and 39). In the case of the radio tomography system shown, the latter type is used. All channels used for one-to-one communication are numbered next, while the channels used for the so-called advertising (specific to Bluetooth) are misplaced at the beginning, end and near the center of the band [
10,
18].
It takes into account the presence of both the carrier and the modulated wave. It should be emphasized that the most common type of modulation used in this type of commercial solution is GFSK, i.e., phase modulation with wave approximation using the Gaussian curve.
The principle of operation of a tomograph using Bluetooth 5 is based on the alternate exchange of data using the so-called advertising. It consists in sending an unaddressed message containing the TX Power parameter, based on which all other probes can calculate (using an algorithm characteristic for a given protocol/technology) the signal strength [
50]. The TX Power parameter is a user preset that contains the power with which the transmitter radiates waves from the antenna [
49]. It is appended to the end of each Bluetooth LE protocol communication packet, regardless of type.
The TX Power parameter is expressed in decibels down to one milliwatt, where the overall formula is expressed as [
18]:
where
P0 is the reference power value, and
P1 is the power of the radiated wave.
Thus, the unit for measuring the signal quality, referred to as the Bluetooth LE correspondence unit, is:
In addition to the source signal, the said communication packet also has a container dedicated to user data with a maximum capacity of 31 bytes, in which the results obtained by the scanner module are simultaneously transferred during the same transmission [
10]. They are arranged one after the other so that the central control unit, after scanning the frame size, is able to determine (based on their position) how to place them in the target measurement array. For example, a system consisting of 16 devices will result in 16 rows, 16 items each, which provides a 256-element data array. Each of the probes provides one such row, while the mother of each of them removes the field with the same positional index, which in practice means zeroing the diagonal matrix (which, as mentioned above, is irrelevant for the measurement) [
51,
52,
53]. Ultimately, this provides 240 essential elements. To better understand the measurement principle, see
Figure 7.
Each probe transmitting module transmits a packet containing information about its transmit power (TX Power). Then, each successive device (in this case, the 15 remaining probes) receives the same signal and receives the same TX Power parameter while measuring the signal level induced in the antenna path and then subjects it to the quantization process. Therefore, each connection of the transmitter and receiver in
Figure 7 (dashed lines) is called the projection angle, and based on its analysis at rest, i.e., without interrupting the field of view of a given pair of devices, it is possible to determine whether something interrupts the “eye contact” of the transmitters or not [
54,
55,
56]. Breaking the “eye contact” of the transmitters results in the weakening of the signal induced in the receiver’s antenna. Based on this difference and a comparison with the previous state of the area, it becomes possible to estimate the obstacle’s type and size and follow it further [
57,
58]. The described situation, symbolically presented in
Figure 7, is repeated for each subsequent transmitter and so on. The Bluetooth protocol, based on its built-in algorithms, returns information about the RSSI to the system from the TX Power information and information from the ADC converter, the value extracted by the application operating the probe from the appropriate register. It is an unsigned 8-bit variable converted to the same number for later transmission but with the information about the sign (U2). Then, the assigned identifier number is retrieved from the data container and compared with its database, which lists the identifiers of all transmitters. As a result, the probe receiver knows exactly which byte of the data packet to overwrite before transmitting. All this is shown symbolically in
Figure 8. The figure shows the location of the data container storing data on the RSSI of the measured radio probe transmitting modules and their identification numbers necessary for data parsing by the probe receiving module. The key operations related to acquiring and overwriting information contained in the created communication frame (extracting the RSSI value from the structure and comparing the identifier) are presented in the white rectangle [
59,
60,
61].
The transmitter is configured to cyclically broadcast a signal containing data on its power and the powers of other transmitters as measured by its receiving portion. It can be imagined as some kind of feedback where some of the data from the end of the packet are carried over to its beginning [
62].
Since the central unit scans the probes in the same way as they do each other and does not require a different syntax of messages, it becomes possible to simultaneously update the measurement results between the probes and transfer them to the expansion card built into the CU (which, like the probe modules, periodically scans the environment). The data received by the CU are arranged in a 16 × 16 matrix based on the same ID data as for the radio probes. The Qt application periodically converts the matrix into a form that can be saved in JSON format and then sends it over a dedicated data bus to the server [
63]. This data bus is Apache Kafka. With its help, the data go to the appropriate place in the server’s memory, separated in the form of the so-called topic on which the CU publishes data. In this case, the server can be treated as a subscriber. The following section describes what happens to the data after it arrives at the RTI service [
3,
6].
2.3. Radio Tomography Imaging—Reconstruction Algorithms
After reaching the server service, the measurement matrix is given the operation of the transmission model that was used in the research. However, to make it possible, it is necessary to pre-parameterize. It includes a room model containing the Cartesian coordinates of all active transmitters (the models used with the heat maps with a resolution of 102 × 102 are shown in
Figure 9a–c), as well as their height (140 cm measured at the height of the antenna), which greatly facilitates the interpretation of the behavior of the RTI system [
63,
64,
65]. The knowledge of the characteristics of the searched disorder also greatly facilitates the analysis (in the presented application, they are constantly living organisms). The height of the transmitters was selected to be within the height range from the waist to the neck of an average person. It makes the radio waves radiated from the directional antennas cross the densest parts of the body, making the system’s response more visible [
66].
An influence matrix was used in the reconstruction, which was built based on the so-called Fresnel zone. In the case of measurements performed in research rooms, the Tikhonov regularization was used to solve the inverse problem with the arbitrarily adopted parameter λ equal to 19,000. The next step was to create an image vector using the previously determined inverse matrix. Each model used (including the circular ones) was enriched with a convolution filter based on the Marr wavelet. The image matrix obtained in this way was configured for 60% of the maximum value it achieved [
67].
The studies were carried out with one to two people in various configurations. In the case of observation of a single object, it could be concluded that it was well specified. The ambiguity possibilities were: the farther the edges of the test area, the better the source of the disturbance was. Too-close proximity to the transmitter antennas increased the imperfection level of the recruited image. It is also worth emphasizing that the system has its limited resolution, and when two sources of disturbances are too close, the system may interpret them as one (on the reconstruction of the image, it appears as a sudden merging of spots). It can be counteracted by successively increasing the number of measurement points (transmitters). Covering the room with a system with too-low mesh density and too many deadlines results in low spatial resolution [
68,
69,
70]. A necessity in order to obtain an image reconstruction is to solve a simple equation:
where
J is the sensitivity matrix,
m is the measurement vector, and
e is the vector containing all finite elements of the computational mesh. Each row of the
J sensitivity matrix consists of elements whose value corresponds to the sensitivity of the selected image pixel to the measurement for a given pair of two radio probes. Thus, each row of the sensitivity matrix is indexed from each possible combination of the probe pairs making up the system [
71].
Almost all analyzed cases concerned the non-squareness of the
J matrix, which is a significant computational problem. It follows that the reason is terrible conditioning of regularization (Tikhonov 1998). For example, the vector size m for a system with 16 transmitters is 256 (16 × 16). Meanwhile, the result value of the vector e can be much larger than 1000. Tikhonov regularizations are still used to find the inverse of the matrix here. The sensitivity matrix is calculated assuming that the significant area between the two transmitters in which the RSSI drops can occur is ellipsoid in shape as stated in the Fresnel zone theorem [
7,
69,
70].
It should be emphasized that, on the one hand, the calculations related to determining the inverse of the
J matrix consume many computing resources of the processor, but on the other hand, it is reusable information that should be stored in the event of a resumption of calculations. Furthermore, the described reconstruction method allows obtaining a speed of 1–2 milliseconds per process [
72].
2.4. Functional Systems of the Building Related to the Tracking System
The radio tomography system is coupled with a series of other systems that guarantee the comfort and safety of users and property inside. Their form and network of connections are described to the location system and computational intelligence in the following subsections. While describing them, the front-end form of the service that allows for the observation and control over individual components of the system is also presented [
72,
73,
74].
2.4.1. Comfort Systems
The designed comfort systems allow the user to adjust the environmental parameters of the environment to their own needs. To a large extent, the human factor is to do this by the aforementioned computational intelligence. To ensure maximum accuracy, a building’s behavior is determined by information provided by a network of sensors, whose returned values reflect the users’ preferences who regularly use its spaces [
75]. All other data beyond the cognitive abilities of the measurement system inside the building are taken from the Internet [
76]. Therefore, it is mainly about the weather conditions outside. It should also be emphasized that the system was designed to cooperate with both ready-made/existing and original solutions. The designed comfort system consists of four proprietary subsystems: lighting, ventilation, heating and air conditioning. The appearance of all four is presented in
Figure 10. As in the case of radio probes, the comfort controllers use the same wireless microcontroller (nRF52832).
Depending on the type of driver, it may consist of more parts than those shown in
Figure 10. Each structure has a 40-pin strip for integrating the Bluetooth LE wireless controller with a miniature Raspberry Pi Zero W computer. It provides an Internet connection using the built-in network card and guarantees the necessary computing power needed for initial data processing and cooperation with the Apache Kafka data bus [
77,
78,
79].
The lighting controller on the actuator side has a compatible PCB equipped with a high-voltage part of 230 VAC and a dimmer implemented by a TRIAC. At the same time, the lighting actuator module can be used to control ventilation using simple single-phase AC motors. In addition, a wireless actuator module based on an H-bridge is provided if the rotor blade drive is a DC motor. Otherwise, a stepper motor was used. In the case of the designed system, the actuator motor is based on a DC motor combined with the detection of the extreme positions of the valve spindle. Thanks to this, the engine can recalibrate itself after each power failure or sleep. When reaching the extreme positions, the current spike is detected with a measuring resistor [
80].
Contrary to the designed lighting and ventilation control system, the heating controller can be powered by batteries. The only exception is the air conditioning controller, which was connected to the actuator without any additional components (except for the Raspberry computer). The controller PCB presented in
Figure 10d was equipped with an infrared diode with the power and wavelength adapted to commonly used air conditioners communicating via IrDa ports. Adjusting the driver requires updating the list of commands stored in the memory of the microcontroller.
The control of the other comfort modules is based on the percentage setting of the lighting, airflow or heating value. To improve the intuitiveness of use of the panel, the setting values were modeled on those that are used in the case of physical manipulators, e.g., 5-step scale knobs used on radiators. The appearance of the service providing control of the comfort modules is presented in
Figure 11.
All graphical interfaces presented in the article were implemented with the Grafana software and the analytical models behind the GUI layer in Node-RED [
73]. It allows a straightforward and quick adaptation of the user’s control panel to any existing or author’s control device [
81,
82,
83].
2.4.2. Network of Sensors
The network of sensors cooperating with artificial intelligence and the rest of the subsystems allows maintaining optimal conditions for the functioning of the building. From an application point of view, sensors monitor as many values that directly impact environmental conditions [
84]. It should be emphasized that they are located only inside the building. Data on the conditions prevailing outside the building are obtained from a weather station via the Internet [
76,
85].
The hardware layer of the sensor network is represented by the device shown in
Figure 12. It is a PCB with dimensions not exceeding 42 mm × 32 mm and on one side covered with sensor assemblies; the nRF52832 wireless microcontroller system has accompanying external elements and an alternative, wired power supply system. On the other hand, there is a lithium battery socket and, at the same time, the default power source of the device [
86,
87].
A single building sensor consists of a set of sensors consisting of a thermometer (temperature expressed in Celsius degrees) and a hygrometer (percentage relative air humidity) enclosed in a standard housing of the SI7006-A20-IM system, a light intensity sensor (number of lumens per square meter) APDS-9006-020 and the CCS811B-JOPR5K air quality sensor consisting of a part responsible for measuring the content of CO2 (parts per million) and a part responsible for measuring the content of organic particles VOC (number of parts per billion) [
86,
87,
88]. In
Figure 13, the observation panel of one of the sensor assemblies presenting the current conditions in a given area is presented. Thanks to the connection of the statistical module, it became possible to catalog and compile parameters and present the results from a selected period in the form of graphs. The precise location of all sensor measurement modules is shown in
Figure 14.
2.4.3. Access Control
The access control system uses active scanners of Bluetooth signals associated with a specific user. It happens via an application installed on the phone (an example of access logs is shown in
Figure 14), which cyclically transmits a Bluetooth signal/packet containing the user ID and TX Power parameter.
If the RSSI value calculated based on the TX Power parameter exceeds the threshold value set for a given room, the application sends an HTTP request to the API servicing electromagnetic locks in the building’s rooms [
89,
90]. This solution releases the user from the need to undertake mechanical interaction with the reader (for example, this is how it looks in the case of RFID technology). For example, a scanner assigned to a specific door is at the average height at which a phone is usually carried in clothing or hand luggage. The directional antenna reads the RSSI of the user’s signal, tries to assess whether the user is authorized to the room or is close enough to assume the room’s opening and then connects to the battery-powered wireless electric lock and releases the lock for a specified period [
91,
92].
After entering the room, the system still receives information about the user’s presence. In addition to the telephone’s RSSI signal, system responses may be additionally conditioned by radio tomography (provided that it is present). For example, if at least one authorized employee is present, the system may not lock the lock until all employees have left the zone [
81,
82,
83].
The appearance of the access control system from the point of view of the server service is shown in
Figure 15. It displays all rooms equipped with smart locks and allows opening or closing them remotely. The door’s current state is symbolized by green (open) and red (closed) underlines visible on the room plan. Additionally, each zone violation is reflected in the logs, just like in the case of a mobile application.
2.4.4. Energy Saving
One of the essential elements of controlling and optimizing electricity consumption in rooms is monitoring and replacing devices with energy-saving ones. The platform allows monitoring the consumption of total electricity and the current control of the power consumption parameters in individual rooms. It is instrumental in diagnosing and identifying devices that contribute to increased energy consumption [
93,
94].
In order to enable control of energy consumption, it seems ideal to count energy consumption broken down into the most minor supported areas, preferably grouping them according to the type of devices (heating, lighting, air conditioning). Such data allow deciding which devices (the view from
Figure 16) or areas (the view from
Figure 17) require attention to high energy consumption. This project uses the monitoring of the current power consumption at the level of individual rooms or the connection of any device or group of devices for monitoring [
81,
82,
83].
The energy measurement was carried out using intelligent sockets equipped with an electricity meter. Data on the current consumption over the air are uploaded onto the Internet and then analyzed and presented in the service [
95,
96,
97].
3. Computational Intelligence
Nowadays, most building automation elements are controlled using simple automation rules based on data provided by cooperating sensors. The dependencies of device control most often consist of assessing one of the parameters and activation of the device, which will result in the correction of the environmental parameter to the assumed setting. Such an approach causes the proper operation of the automation, adjusting the parameters of the environment to the predetermined conditions, while having the appropriate sensory infrastructure and actuators, it is possible to predict settings, on the one hand, personalized to the users and, on the other, optimizing the use of electricity and heat in the serviced building.
The project attempts to predict settings based on current and historical data and machine learning methods to more precisely and personally adjust the working conditions of users, taking into account energy optimization along with the appropriate visualization of the operating status of devices and the entire building. The project integrates several proprietary solutions with solutions existing on the market. The best and most current standards of IoT device communication were used. The software used allows high scalability of the platform in the future and easy adaptation to various types of supported facilities while remaining open to new integrations with more and more commonly emerging solutions to support the smart home/building market [
98,
99].
The project uses proprietary algorithms to support the management of the building, including machine learning (ML) methods. ML models are trained on previously collected data on the use of individual rooms. Communication of the organizational system with the analytical system takes place through the service created for this purpose, which accepts environmental data both outside the building and in the room as input parameters. In response, it provides messages specifying the status of individual devices influencing the conditions in the monitored room. They will be, among others, the air above conditioning, ventilation, heating and lighting systems [
100]. In a simplified way, the general scheme of the algorithm can be presented as shown in
Figure 18. As an example,
Figure 19 shows the control of comfort modules in the designed intelligent building (taking into account the applied computational intelligence elements).
In this project, three machine learning models were used: linear regression, logistic regression and SVC (classifier based on the support vector machine).
Linear regression is one of the simplest ML models and is especially popular and friendly to interpretation. Suppose we have a feature set
, from which we want to predict some continuous value
. If there is proportionality between the variable features
and the goals
, we can approximate them with an expression [
101]:
or more succinctly
where
are the model coefficients. In this case, we assume that the modeled value
is a linear combination of individual features
. In the next step, we determine the objective function, which we calculate for the points
from the data set; in this case, it is the mean square error:
The defined objective function is then minimized, thanks to which we can calculate the optimal values of the parameters for which the error of fit is minimal.
Logistic regression is somewhat of a derivative model of linear regression. However, it assumes that the distribution of the explained variable
is two-point and not continuous. Thanks to this, the model is perfect for modeling phenomena, where we expect a binary response: yes/no, on/off. Therefore, our goal is to model the probability expressed by the function taking values in the interval
. It is the conditional probability for
the given
[
102,
103].
where
is the linear combination of independent variables (features).
the same as for linear regression.
The probability of the opposite event is, of course, complementary:
After defining the model, the objective function should be determined, thanks to which we can find the coefficients , which are the parameters of the model.
In the case of a two-point distribution, we do not use the squared error but the likelihood function:
The final objective function is the logarithm of the above function. It is called log-likelihood, which we maximize to find a set of optimal parameters. Optimization is performed by standard techniques such as, e.g., simple gradients.
Support vector classifier (SVC) is a model also used to describe data divided into binary classes. It is a particular type of model and belongs to support vector machines (SVMs). However, unlike logistic regression, it can make accurate predictions when classes do not show proportionality to changes in features, i.e., nonlinear phenomena occur.
The principle of the model is based on finding a hypersurface that separates two classes of points and is as far away as possible from both. Each record of our input data
can be imagined as a point in a multidimensional space. Each of these points can be assigned a label from the set:
In the optimization process, SVC finds a surface in this space that separates the two sets.
Typically, the SVC uses (hyper) planes to separate the data. If it is ineffective in a given space, the model extends it into additional dimensions where the classification is more optimal. In other cases, nonlinear nuclei are used that generate not hyperplanes but hypersurfaces with more complex shapes.
Mathematically, finding the optimal parameters for the SVC model is done by minimizing the expression [
104]:
where
is the number of points in the data set and
the matrix of coefficients; the second word with the parameter
plays a regularization role (there are algorithms for its determination, but they are usually selected manually). Without the lambda part, it is impossible to find a solution or a minimum of the objective function.
Ultimately, we obtain a model that needs to be tested in terms of the quality of its predictions. Then, after successful completion of the tests, it is ready to work in the provided solutions.
When training the SVC model, we set the initial regularization parameter as 0.0001 and the radial basis function as a kernel.
Traning and Validation Data
The used database consisted of three years of data for each IoT device. The data are collected when the state of sensor changes, i.e., when the data are transmitted when the temperature changes by 0.05 degrees. The total amount of measurements for the described measurement method is around 710,000 records per year for a system installed in a building that contains 18 monitored rooms. This translates to around 3 GB of sensor data every year [
105].
Historical data come from a database where every change in the state of the device is saved. The database had the information about:
Outside temperature;
Temperature inside rooms;
Humidity outside and inside rooms;
Pressure;
Wind;
Light intensity inside rooms;
The state of the devices including;
On/Off state;
In case of heaters and A/C—set temperature;
In case of lamps—set brightness.
On this basis, appropriate algorithms predict the current settings, which is essential for optimizing energy consumption by adequately selecting the devices’ time and operation to achieve the intended conditions at the lowest energy cost.
To validate the models, we tested the models on the artificial data generated from the real measurements. The predictions of models were checked with algorithms that calculate the energy consumption to see if the model achieved low power usage. Based on this we picked the models that achieved the best power efficiency and the most comfortable settings for users. The train to split was set to 80% and 20% [
106,
107].
4. Results
This section presents the results of the work on the project of a smart building supported by the radio tomographic imaging technique and computational intelligence.
Figure 20 is a symbolic representation of the implemented technologies.
The result of the described work is a system capable of automatic control by artificial intelligence and, alternatively, remotely by a human. We connected all user comfort devices with proprietary Bluetooth 5 drivers and then ran tests, which resulted in the device’s response time oscillating around one second. Compared to the off-the-shelf solutions that were tested, which were designs such as light dimmers, heat regulators or air handling controllers based on Z-Wave and Thread technologies, no differences were found in the response times of the designed devices. In both cases, the times did not differ significantly, and their length was determined mainly by the condition of the Internet network. The only exception was the heating controller, in which the reaction speed reached a value of a few seconds, but due to the very high inertia of the heating system, this phenomenon was practically imperceptible.
The implementation of RTI techniques improved tracking accuracy and reduced uncertainty about the target’s current position due to RSSI fluctuations. As an example, see
Figure 21, which shows a circular reference measurement zone with a radius of 5 m with a human inside. The mounting height of the transmitter antennas was set at 140 cm. Based on the proportions, it can be concluded that the proper level of tracking accuracy was maintained. The visible reconstructions are the result of a developed algorithm whose operation is reduced to differential operations performed on two matrices: background and measurement. The background matrix represents the RSSI values in the room at rest. Confronting it with the measurement matrix (i.e., after the introduction of a disturbance), the so-called differential matrix is obtained, on which the detected object can be observed for the first time. The matrix is then combined with a model of the investigated room being a set of radio probe coordinates and boundary conditions. After combining all the factors, the target image reconstruction is obtained, which can be additionally passed through a filter stage to get rid of irrelevant elements of the environment. The next step is to determine the coordinates of the detected user and to apply its model/marker on the three-dimensional and partially transparent virtual space of the building.
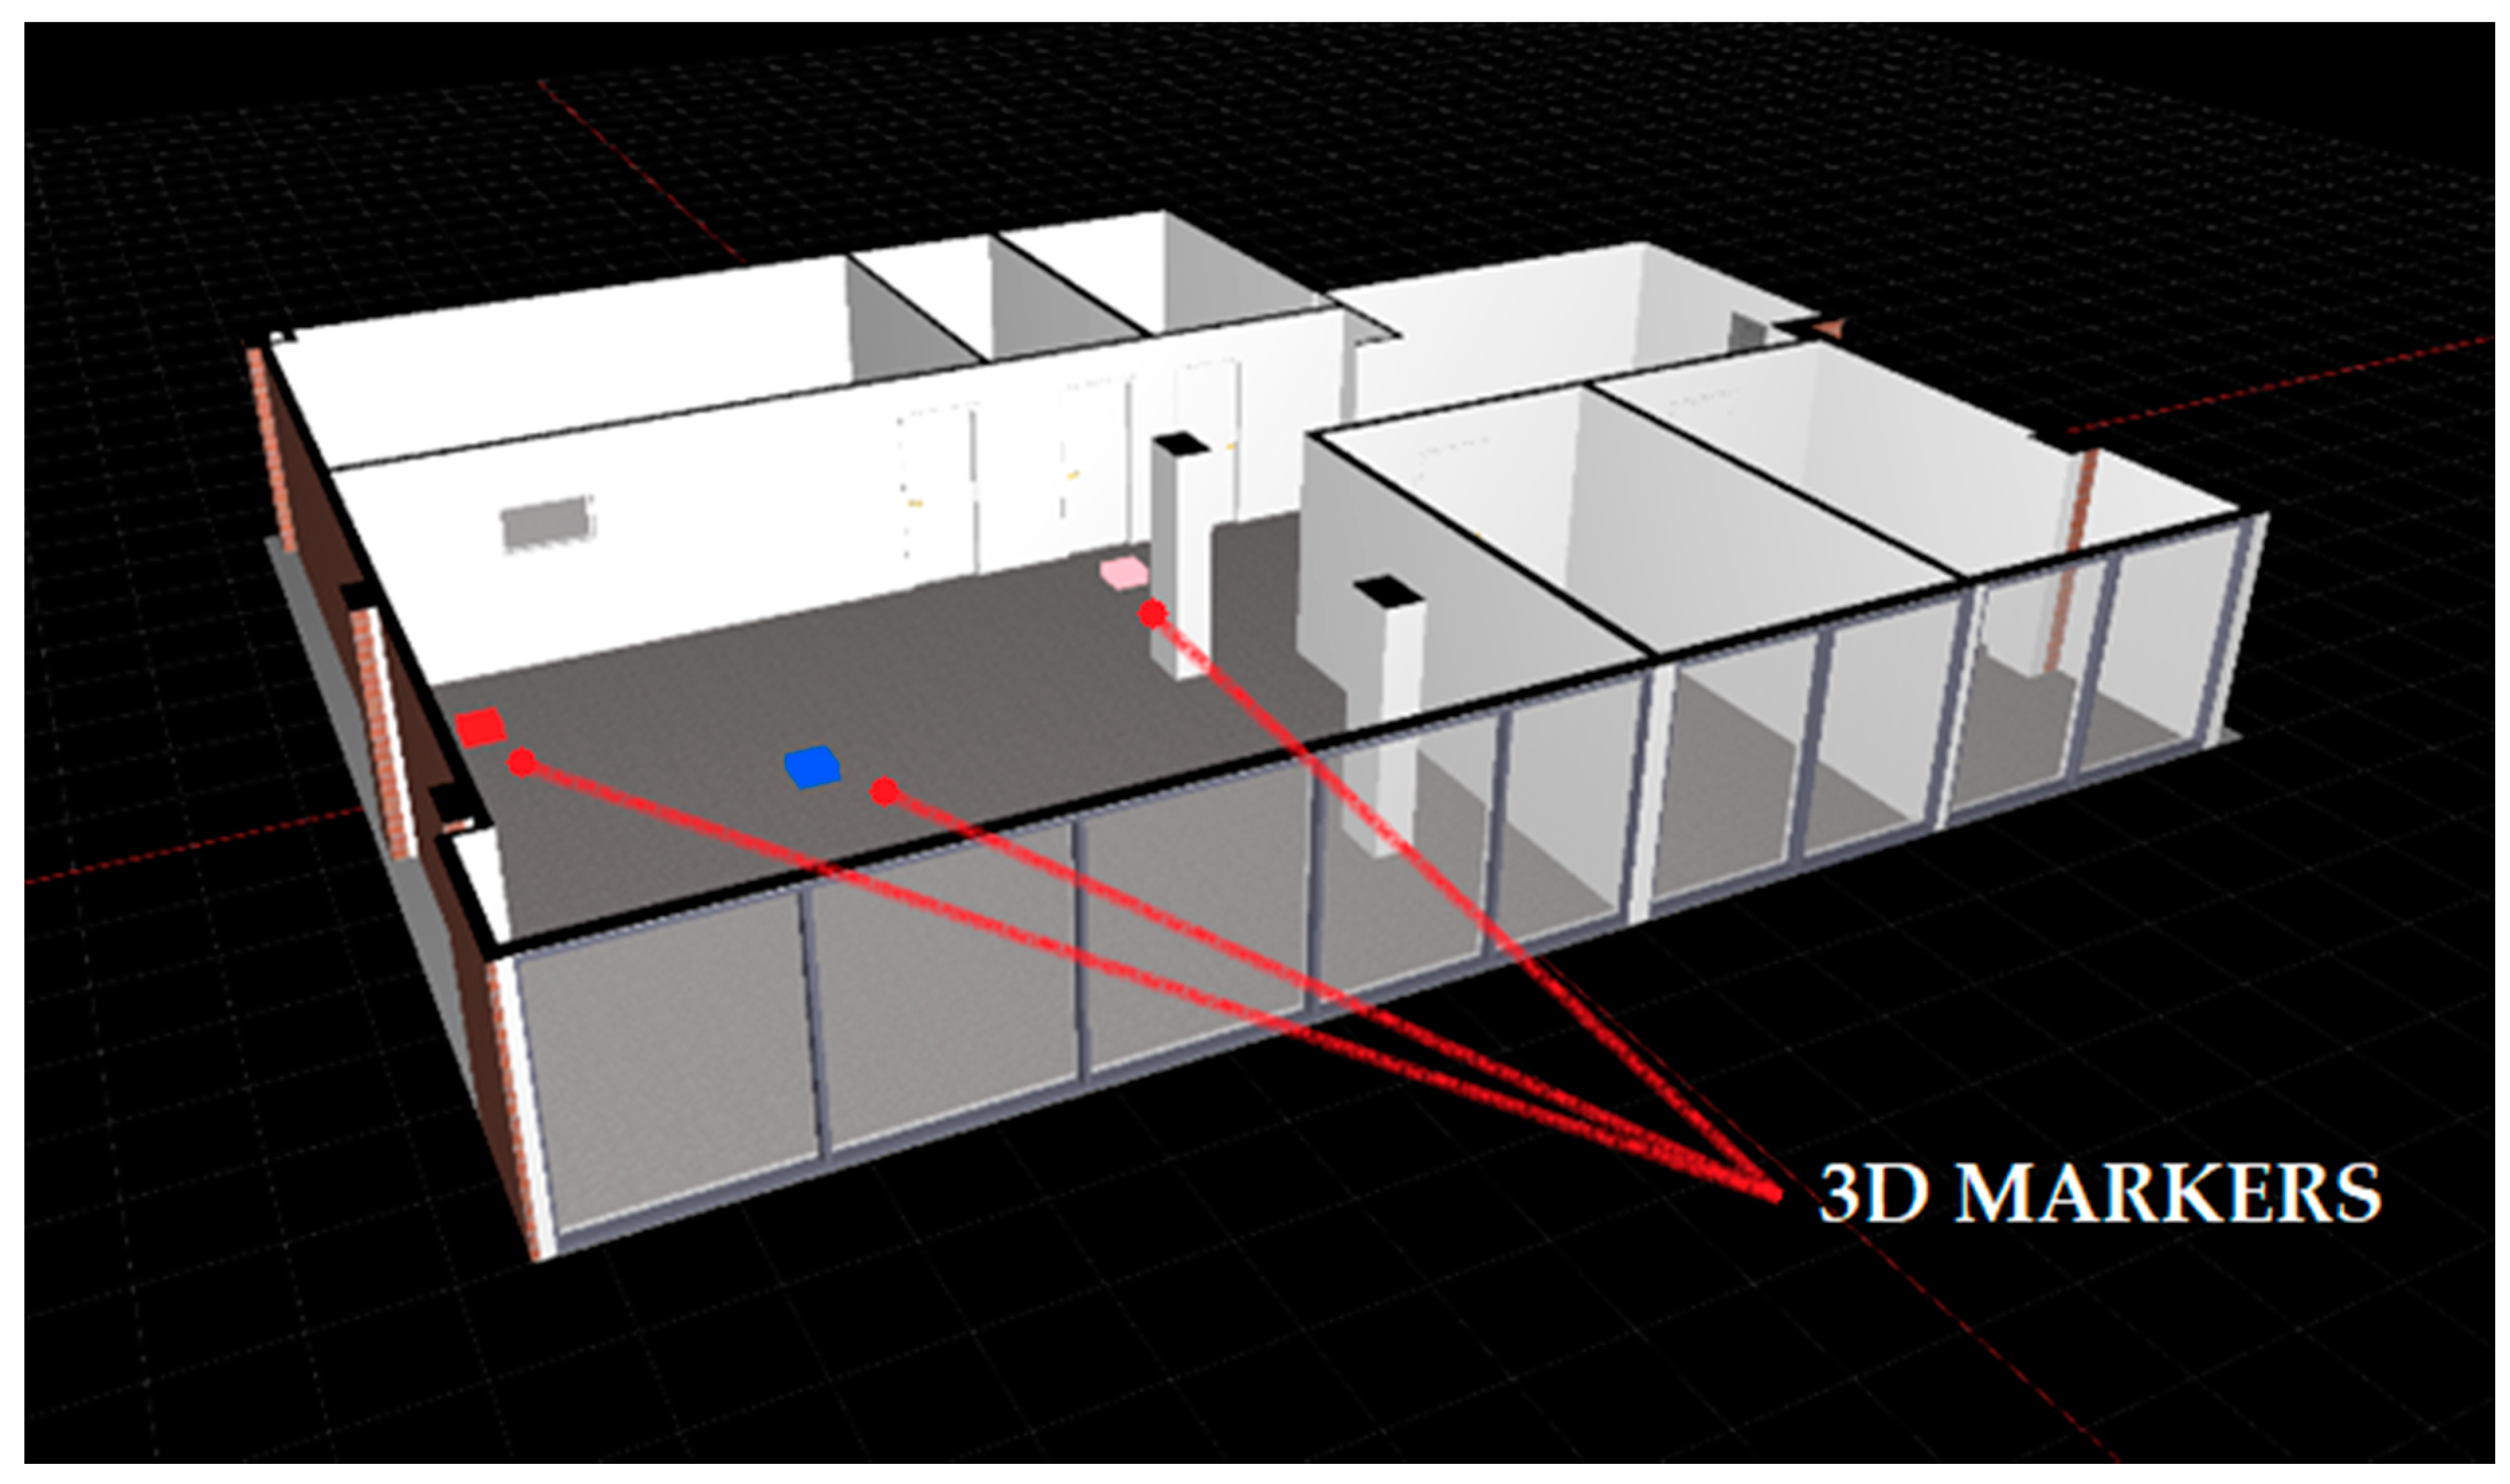
Based on the data obtained thanks to radio tomography, it was possible to create a system that can determine the coordinate of the interference source in the measurement matrix by performing a comparative analysis (differential method) with the background matrix and then, based on the introduced model of the studied area, apply a symbolic model of the object on a three-dimensional map building. The effect of such action is presented in
Figure 22. It shows a 3D visualization of the building zone covered by the navigation module tests. After detecting the user and extracting his planar coordinates from the RTI matrix, the system places colorful 3D markers at the places of disturbance sources. Based on data about users’ presence in a zone, time of stay and mode of movement, the computational intelligence was able to cut off unnecessary comfort modules and generate savings. The tests were performed on a real building during normal office work.
Two control methods were tested to confirm the building’s energy efficiency maximization: traditional (manual) and control by computational intelligence. Both were used under the most similar conditions described below. They cool down the conference room (to 23 °C) and prepare it for the meeting at 4 p.m. Current time 12:00, hot day, room temperature 30 °C, air conditioner power equal to 2.5 kW, room volume equal to 60 m
3. The surface of the outer wall through which the heat exchange takes place is equal to 15 m
2, of which 10 m
2 is a glazed area. The technical conditions of WT 2017 constructed the building. Cooling the room from 30 °C to 23 °C with a cooling unit requires an energy expenditure of:
Manual control brought:
In addition to cooling the room
, one should incur energy expenditure in maintaining the temperature for 4 h:
Intelligent control brought:
Based on external data, the algorithm calculates the optimal time to start the air conditioner so that the temperature at 4:00 p.m. is 23 °C—no temperature maintenance costs.
Ultimately, we obtain savings:
5. Discussion
Based on the conducted research, the theory of the ability of Bluetooth 5 technology to be used in the RTI field was confirmed. However, the level of the obtained parameters was not met in every field. Achieving high results in one application of the device resulted in the necessity of making concessions on another. Regarding the accuracy of the obtained measurement data (matrix), it can be stated that they initially showed a very high noise due to the nature of the transmitters’ work (independent). This means that at a given moment in time, several miniature radio stations were operating simultaneously in a relatively small space, which intensified the phenomenon of mutual attenuation and reflection of waves. Sudden spikes in RSSI had to be reduced using statistical methods and research on system scalability to the room. Additional tests were carried out, and the standard deviations of the results were compared for a massive combination of transmitter power ranges, transmission frequency and scanning frequency by individual components. It was only by reducing power and introducing algorithms for averaging and eliminating defective matrices that continuous detection of organisms was possible. The adversities above were balanced with the most significant advantage and strength of the applied solution, i.e., the speed of acquisition and reliability resulting from the lack of interdependence of the transmitters and the central unit. Regardless of the transmission frequency used, which in the presented solution was set to 40 milliseconds and the scanning frequency, which was 50 milliseconds, one should be aware of the uneven refreshment of the matrix lines reaching the service. It is partly due to the probe scanners and the CPU scanner, whose buffer areas are occupied randomly/uncontrollably. Despite using various types of filters in the scanners to minimize the additional load with packets outside the tomograph, it did not bring significant results.
The data collected allowed us to determine which of the reconstruction parameters obtained could be improved. Due to the high reconstruction speeds of up to seven frames per second, future efforts will focus on increasing the localization accuracy in such a way as to exceed the 1 m barrier, even if it is necessary to give way to the acquisition speed.
The use of advertising and the abandonment of permanent wireless connections between devices has led to a system that, in addition to high measurement data acquisition rates, is also highly fault-tolerant. This manifests itself in the fact that we have moved away from a sequential measurement model to one with greater freedom of data exchange. For example, the failure of one of the probes has never caused the whole system to block or slow down, and the missing image line could be completed on the basis of the previous measurement from a short time ago. It should also be emphasized that, in this case, the rows of the matrix are not generated sequentially but randomly, which means that individual image lines could refresh with a different frequency but not so high as to make the reconstruction unreliable. In the case of sequences, the sequence of operations would require retransmission and braking of the entire system. Thanks to the common data package for probe scanners and the central unit, the total number of packages circulating in the air has decreased, hence the filling of advertising channels.
On the basis of the conducted research, a significant influence of antenna radiation characteristics on the sensitivity matrix created was found. The use of general assumptions for directional antennas became the source of measurement errors and loss of detection capabilities of the tomograph. Only experimental determination of the effects of the designed antenna in the target device allowed appropriately modifying the algorithm responsible for the sensitivity matrix. As a target device, we treated a set consisting of a complete PCB and complete housing and mounted it in a strictly specified place and manner. The changes mainly boiled down to changes in the values of individual significance coefficients of the RSSI result in a given transmitter–receiver connection. In the modified form, the significance of the results coming from pairs of devices located opposite each other was increased, and the significance of devices located on the sides was decreased.
6. Conclusions
The model created with the collected data allowed us to create an intelligent system that controls efficiently IoT devices such as A/C and lights. The models were validated against the historical data. Additionally, we used sensors, a system and trained models in our building to see how they work in real life, and we found that they are fast and decrease the use of power by the building.
The complexity of the measurement model, as well as the very nature of the electromagnetic wave, means that many tests must be carried out based on experimental methods, which in the case of radio tomography, are extremely difficult to simulate, all the more so because the transceiver systems used do not have internal synchronization, timestamp or even mutual liberation. On the one hand, the lack of these mechanisms makes the system more flexible and accelerated, but on the other hand, the user has to do it at the expense of the level of control over the system and increasing difficulties in identifying potential sources of problems.
Future plans are to increase the density of the measurement grid while maintaining the current structure of the RTI system, i.e., the same technology, type of communication and structure of communication packets. While the basic packet no longer allows for a doubling of the number of transmitters, the use of the so-called mode by design would allow for a doubling of the amount of data sent, a clear separation of packets and their subsequent easy identification. Testing this capability could significantly increase the accuracy of the navigation data received. In the long term, it would allow an increase in the quality of data shaping the computational intelligence being created.
The use of extended Bluetooth 5 data packets increasing user data space from 32 bytes to 255 bytes also proved to be some form of alternative. However, given the proportions of the two packets, there could be too great a drop in data rate relative to the added number of devices (32 and 64 element systems). The rest of the remaining space would then have to remain unused and would unnecessarily burden the entire transmission.
The data obtained by radio tomography managed to improve the ability of computational intelligence, which was reflected by the applied linear and logistic regression and SVC in each part of the system implemented in the discussed building.
The intelligent system presented in the paper is responsible for the collection, monitoring and decisions that make the building more energy-efficient. The algorithm constantly relearns new data that is coming from the events created by the users, e.g., by setting A/C temperature. These data with the additional information about the location of people in the building allows predictions and corrections of settings to achieve a comfortable environment (by means of the amount of light, correct temperature and humidity) for the people inside.
The system composed of many small modules and machine learning along with the described algorithms plays an important role in the current modern design of energy-efficient and zero-energy buildings. With the intelligent and automatic management of energy usage inside the building along with renewable sources of energy, it is possible to convert some current buildings into energy-plus buildings. This, on the other hand, will lead to a decrease in CO2 emissions. The excess of produced energy can be stored or sold to the network. Furthermore, the system decreases the time needed to achieve a return on investment in such a system.
The other goal that can be with the use of the described system is that a lower number of solar panels can be installed on such buildings. With the right energy storage size and the lower the energy consumption, the size of the installed photovoltaic system can be decreased.
In summary, the paper shows how human detection with the use of radio tomography along with smart sensors and machine learning algorithms can improve the idea of transforming smart energy-efficient buildings into zero or even energy-plus buildings. We hope to further develop the described system in order to achieve more accurate user setting predictions and a higher-resolution radio tomography which will decrease the overall cost of the system and improve return on investment (ROI) in the system.


 ,
, 