1. Introduction
Today’s technologies are developing very fast and hence many of the newly developed solutions minimize or even exclude human intervention, especially in IoT infrastructures. Devices do not require initial configuration or time-consuming setup, and the user only needs to start them up, which is almost immediately ready for operation. Such solutions include the Internet of Things, which has been intensively developed since the late 1990s. The balance between network lifetime optimization and load distribution among sensor nodes is crucial for the development of energy-efficient routing solutions. The purpose of the simulations and analysis presented here is to model the operation and fault tolerance capabilities of an IoT network based on one of the most popular communication protocols, which is the ZigBee protocol. The ZigBee network topology was created and different configurations were implemented in which various node failure scenarios were simulated to show its robustness to node and adjacent links failures.
The problem of ensuring continuous and secure operation is a challenge in the age of cyber threats, constantly evolving new services and hardware. Dozens, hundreds, or even thousands of devices within a single IoT infrastructure are constantly vulnerable to attack. Today, IoT solutions are used in many areas of life, including those relevant to protecting human health and life. This paper addresses the topic of modeling and fault tolerance analysis of selected IoT network protocol, in order to evaluate the protocol for different failure scenarios assuming the failure of various IoT network nodes. In wireless sensor networks (WSNs), resource constraints are a key factor influencing the choice of a routing protocol as well as the design of the network management application. The routing algorithm used in WSN has a direct impact on the energy consumption of the sensors. Failure to match the routing algorithm will increase the packet traffic, not only limiting the network performance but more importantly will increase the energy consumption of the nodes, which will then translate into a reduction in their operating time, consequently shutting them down.
Many academics have tried to emphasize different aspects of the IoT, such as security, communication, or providing energy and reducing energy consumption. Using traditional programming methods to effectively coordinate devices can be inefficient. This is due to a large number of nodes and their connections. In [
1], the authors present a framework for collective programming based on field calculus and APIs based on building blocks. In field calculus, each expression, variable, or value is represented as a field, for example, a collection of temperature sensors forms an ambient temperature field. Using such a solution significantly simplifies the programming and device coordination process. By analyzing the work of [
2], we can in turn identify a method to provide a stable, open, and evolving infrastructure that can form the basis for IoT development. The authors built a test environment in which they implemented several important features such as service discovery, human interactivity user location, and security. The authors of the paper [
3] present a new approach to using web analytics to advance the Internet of Things. They describe in detail a cloud-based mapping service that can interpret IoT events into matching web analytics events. The authors also provide concrete examples showing how to use the service.
Cloud computing can be widely used in IoT providing support for computation, a place to store collected data, and also as middleware to integrate multiple devices. In order to protect the cloud from intruders, a virtualized network intrusion detection system (also known as the Networked Intrusion Detection System-Virtual Appliance, NIDS-VA) can be used to protect cloud environments such as IaaS infrastructure when sharing resources with other cloud applications [
4], and in [
5], an analysis of threats and their impact on IoT infrastructure performance and security development prospects for the near future was performed. In [
6], the authors presented the concepts of Fog of Things (FoT), an on-demand IoT paradigm. Using such a solution, heterogeneous connected devices can be accessed and managed through a unified platform based on real-time requirements. The FoT paradigm includes the incorporation of fog computing power that enhances not only IoT applications but, more importantly, scalable and efficient management of the system itself.
The aspect of power supply, its reliability, and especially energy-efficient protocols is equally important in ensuring the security of IoT networks. Hence, one of the essential concerns of the IoT is the energy requirements for devices. In [
7], a framework is presented to provide adequate security and privacy while supporting efficient power management. The proposed framework utilizes an identity-based protection methodology (I-ICAAAN), secure communication protocols, and an Intelligent Security System for Energy Management (ISSEM) to certify security and privacy in the EI (Energy Internet).
Fault tolerance is an important point in the field of ensuring uninterrupted and failure-free operation of the entire IoT system. Fault tolerance may be implemented at various levels of the IoT architecture since an error can occur at any layer. Naturally, the level of network connectivity, as well as root nodes, is critical. Infrastructure, application, and secure Internet of Things (IoT) solutions are creating new efficiencies and enabling more efficient operations based on data collected at the intelligent network edge. Production downtime and operational risk is reduced. Industrial IoT solutions enable the collection and analysis of data captured from networked assets, people, and places, resulting in meaningful analytical insights in an industrial environment and beyond. The significant cost and complexity of the infrastructure cause that there is often a lack of redundancy during deployment which makes fault tolerance in IoT an important issue. Therefore, providing fault tolerance using a limited set of devices is a major challenge for IoT system design. In [
8], the authors have prepared a very comprehensive and up-to-date literature review on faults that can arise at all levels of the architecture of IoT applications, such as sensor nodes, actuators, network links, as also processing and data storage components. The presented examples clearly show that fault-tolerance (FT) has become an important concern for IoT systems. Significantly, this work provides a basis for classifying existing and future approaches to fault-tolerant IoT, by classifying a set of methodologies, techniques, and architectures that are able of reducing failures in IoT systems.
A kind of evolution of IoT architectures is Edge computing. In [
9], the authors proposed a new mobile agent (MA) based, reliable, and fault-tolerant hierarchical IoT cloud architecture that can cope with edge server failures. In the proposed architecture, the cloud is distributed in four tiers (cloud-fog-mist-dew) based on the computational power and distance from the end IoT device. The process of replication of the data at the network edge makes the whole system reliable. The analyzed system is fault-tolerant as it redirects the application to an optional server.
The enormous increase in the amount of data transmitted by various devices makes these systems a target for various types of attacks by hackers. Monitoring network traffic is a key task for the security and reliability of communication networks and Internet of Things infrastructure. In the works [
10,
11], the authors focus on developing methods to detect anomalies that can eventually lead to the failure of different layers of the IoT architecture. The basis of the proposed solutions is the possibility of using fractal and multifractal analysis in discovering the structure of the communication system, in particular the pattern and characteristics of the traffic, in order to better understand the threats and detect anomalies in the network operation.
To better understand the IoT protocols options, a practical look at the advantages and limitations of the Zigbee protocol is necessary. This paper helps to explain the trade-offs and show use cases so one can choose the optimal protocol for IoT applications. There is a noticeable lack of studies addressing the issues of fault tolerance analysis at the ZigBee protocol layer, focusing more on the higher layers. Our article aims to propose a comprehensive and practical introduction to fault tolerance assurance in IoT architectures, especially in the case of communication traffic in the IoT network. The theoretical basis is defined. The article also proposes the IoT network model as implementation of selected protocols and some test scenarios for the fault tolerance IoT network effectiveness validation were carried out.
2. Previous Works
The Internet of Things (IoT) or the broader term Internet of Everything (IoE) has gained prominence in recent times. The multitude of technological solutions, hardware and software manufacturers means that we are dealing with environments with a high degree of heterogeneity. This aspect can be considered both at the layer of device resources, in terms of memory, processor, and bandwidth, as well as communication resources using bandwidth bands susceptible to errors and loss of quality of radio signals and often deployed in hostile, high interference environment. Moreover, IoT/WSNs experience various network performance issues, e.g., excessive energy consumption due to network device failures and the need to reconfigure the existing structure at the logical layer using energy-expensive routing or self-reconfiguration algorithms. These issues are highlighted by the authors of the paper [
12], stating that, in this context, effective management of IoT/WSNs is needed to ensure good network performance. This drives the development of various protocols and frameworks for managing IoT/WSN networks.
A major challenge for network designers is scalability. This process generally incurs additional costs related to routing and network latency. Moreover, sensor data is sent to application users on an insecure medium, which leads to data security and integrity violation. In [
13], a lightweight, secure and energy-efficient fog-based routing protocol (SEFR) is proposed to minimize data latency and enhance power management.
Similar to classical computer networks, IoT/WSNs also have a wide range of communication standards, protocols, or management protocols. The most important technologies such as Bluetooth, ZigBee, MQTT, LoraWAN LWM2M, 6LowPAN are worth mentioning. However, due to resource unification limitations, IoT networks connect many problems to solve which affect their performance such as worsening of the link quality, network overloading, and device failures. Each of these factors contribute to considerably minimizing the performance of IoT/WSNs. Therefore, it is important to effectively and proactively manage IoT networks to ensure satisfactory network performance, low latency, or good energy efficiency [
14,
15,
16].
In WSNs, resource constraints are the main factor in protocols and application design. The appropriately applied routing algorithm has a direct impact on the energy consumption of the sensors. It is sometimes the most important factor in protocol decisions such as routing metrics. In Software-Defined Networking (SDN) based networks, the central node is responsible for all decisions regarding steering and routing.
Taking energy as a traffic metric involves this information from the nodes, which increases packet traffic, affecting network performance [
17]. The work [
18] proposed an energy model for wireless sensor networks by obtaining the energy utilization at each node. This model calculates the energy at each node by evaluating the energy consumption of the core features that are involved in the detection and transfer of data during the operation of the routing protocol. This problem is considered by many researchers from the point of view of both energy and network performance metrics.
As such, fault tolerance is realized as an integrated part of the IoT system design and should be built into the system. This is an essential assumption in order to find and identify different strategies that can be adapted to provide a very high level of fault tolerance to the IoT-based system. In the paper [
19], the authors present an IoT/WSN implemented by the ICMC at the University of São Paulo (USP), called REDE, which aims to monitor, analyze data, detect flash floods, and present actual information about rivers in urban areas. The REDE system collects data about rivers and precipitation in an area and uses ZigBee and 3G to communicate. As the authors note, a drawback of the REDE system is that it does not have any fault-tolerance mechanism, which is essential in unsafe environments where connectivity and node failure is widespread.
In [
20], the authors investigated a fault-tolerant IoT and ML-based natural disaster detection and forecasting system called SENDI (system for detecting and forecasting natural disasters). The system was modeled and tested to be fault-tolerant and to maintain its ability to continue performing its planned functionality. The implementation was based on 6LoWPAN standard modules and many classical routing mechanisms. However, there is a significant lack of analysis of another important protocol often indicated as the first choice protocol which is the ZigBee protocol. Zigbee is a wireless communication standard designed as an open global standard to satisfy the inimitable demands of low-cost, low-power wireless IoT networks. This standard is also based on the IEEE 802.15.4 physical radio definition and supports use in unlicensed frequency ranges, including 2.4 GHz, 900 MHz, and 868 MHz. The 802.15.4 standard underlying the Zigbee specification was approved by the IEEE in 2003. This standard provides a packet-based wireless protocol for cost-effective, battery-powered equipment. Thus, it enables nodes to be capable of transmitting over a wide diversity of network topologies, the protocol enables devices to communicate over a wide range of network topologies, and the battery life can last for several years [
21]. The authors of [
22] have shown that in WSN, limited energy resources for communication are a critical element. In order to achieve better WSN communication, appropriate schemes must be selected to describe the energy level and reliability of the system. In real-time low-latency industrial applications, one way to improve network reliability is scheduling. Next to routing, it is one of the most important problems to be solved. The authors of [
23] proposed centralized scheduling algorithms for time slot channel hopping (TSCH) networks for real-time industrial applications, but they have some drawbacks such as schedulability and large data traffic.
In work [
24], the author shows that a resource-limited, single centralized ZigBee network cannot be deployed in very large-scale applications. To solve this problem, he presents a design strategy for a ZigBee network that can be centralized and decentralized, and distributed over a wide area. The author defines two types of network structure: independent mobile network and multi-scale multipoint network.
Authors in [
25] present a new real-time monitoring system for photovoltaic (PV) generation. This system allows remote monitoring of photovoltaic systems based on multi-node network communication based on the ZigBee protocol. Furthermore, in [
26,
27], for intelligent remote control of maximum power point tracking and low power consumption, ZigBee modules were integrated into the PV inverter side. The experiments conducted confirmed the high usability and excellent real-time performance through the communication module and cloud server.
In contrast, the work in [
28] presents a wireless monitoring system by using Bluetooth to measure and collect data of the generated power. As the authors stated, Bluetooth is an open short-range wireless standard, but it has high latency and power consumption in large-scale networks.
The IoT environment is highly heterogeneous in terms of hardware, software, functionality, observability, administrability, network, and communication models. As pointed out in the paper [
29], network protocols are different from wired, Wi-Fi, Blue-tooth, Z-wave, or Zigbee and have their own characteristics. This involves extended capabilities in terms of means of observation, but also variability in the uncertainty of error detection. There may be many communication models implemented within the same application, such as message passing, publish-subscribe, or synchronous function calls. This emphasizes the need for the coexistence of different techniques to implement a fault tolerance solution.
Fault tolerance is the ability of a system to deliver a desired level of functionality in the presence of faults [
30]. Effective fault tolerance mechanisms generate fewer control messages, thus limiting the generated traffic, requiring computing power of the node, which directly impacts its energy longevity and at the same time the reliability of the entire solution, the entire IoT structure.
As the authors assure in [
31], ZigBee technology provides more effective support compared to WiFi, Bluetooth, and Ultra Wide Band (UWB) standards in terms of transmission range. To confirm their thesis, they present the results of their research on the example of a medium-sized WSN. However, many works analyze specific routing algorithms for WSN structures. In [
32,
33], the performance of a network running on ZigBee using the IEEE 802.15.4 protocol stack was evaluated using the parameters: throughput, delay, lost data, and received and sent data traffic. The obtained data show that it is possible to get a satisfactory reply by using a blend of star and tree topologies as well as mesh and hybrid topologies. It is observed that hybrid topology reaches maximum capacity while tree topology reaches minimum capacity and for mesh topology, the capacity is almost equal in all instances. It is also observed that the MAC latency of hybrid topology is maximized while the MAC latency of tree topology is steady.
The Zigbee protocol is used extensively in domestic networks. According to the Ambient Intelligence model, heterogeneous devices can act collectively by exploiting contextual information and reconnaissance that is usually covert in such networks. As shown in [
34], ZigBee device networks play an important role and require an easier interaction model with IP-based networks. The authors of this paper presented an open-source platform that integrates ZigBee devices with applications running on smartphones and other devices available in the home network. This makes it easier to manage such a network. With this platform, it can be placed on low-cost devices, such as Plug-PCs, using the OSGi execution environment to detect devices and notify the smart home of newly available services.
The basis of the communication stack of most WSNs is the ZigBee protocol, and therefore it is important to know its properties in this area. The majority of network protocols rely on the idea of layers to divide various elements and features into autonomous units. The layers of the ZigBee protocol are based on the ISO/OSI basic reference model. There are seven layers in the ISO/OSI model, but ZigBee has implemented just the layers necessary for low power, low data rate wireless networks. Zigbee is built on the physical layer (PHY) and medium access control (MAC) sublayer defined in IEEE 802.15.4. The NWK (Network) and APL (Application) layers are defined by the ZigBee standard. This standard provides a user-friendly framework for component-based software that supports client applications from multiple sources. The ZigBee network layer creates a mesh network that is able to route data around defective nodes. In our research, a two-tier ZigBee network is tested in different scenarios, simulating different failures triggered at the sensor and router nodes, simulating realistic failure conditions.
3. The Reference Scenario
The IoT is a system of interconnected devices equipped with unique identifiers, capable of transmitting data over a network without human intervention. These devices are constantly connected to a virtual world which allows them to be controlled remotely. A critical requirement of the Internet of Things is the need for constant connectivity between objects. The architecture of an Internet of Things system must guarantee an operation that creates a gateway between the physical and virtual worlds. Designing such an architecture is based on many aspects, such as creating communication networks, business models, and ensuring security. The scalability, interoperability, and extensibility of selected devices must also be considered at the design stage. In the Internet of Things, objects do not have an assigned place, they are in constant motion, often interacting with other objects in real-time. Therefore, the architecture ought to be adjusted to dynamic interactions while maintaining a decentralized and heterogeneous nature [
35,
36].
In the Internet of Things, service-oriented architecture (SoA) may be necessary for both service providers and users. SoA is able to provide interoperability between disparate devices in many ways.
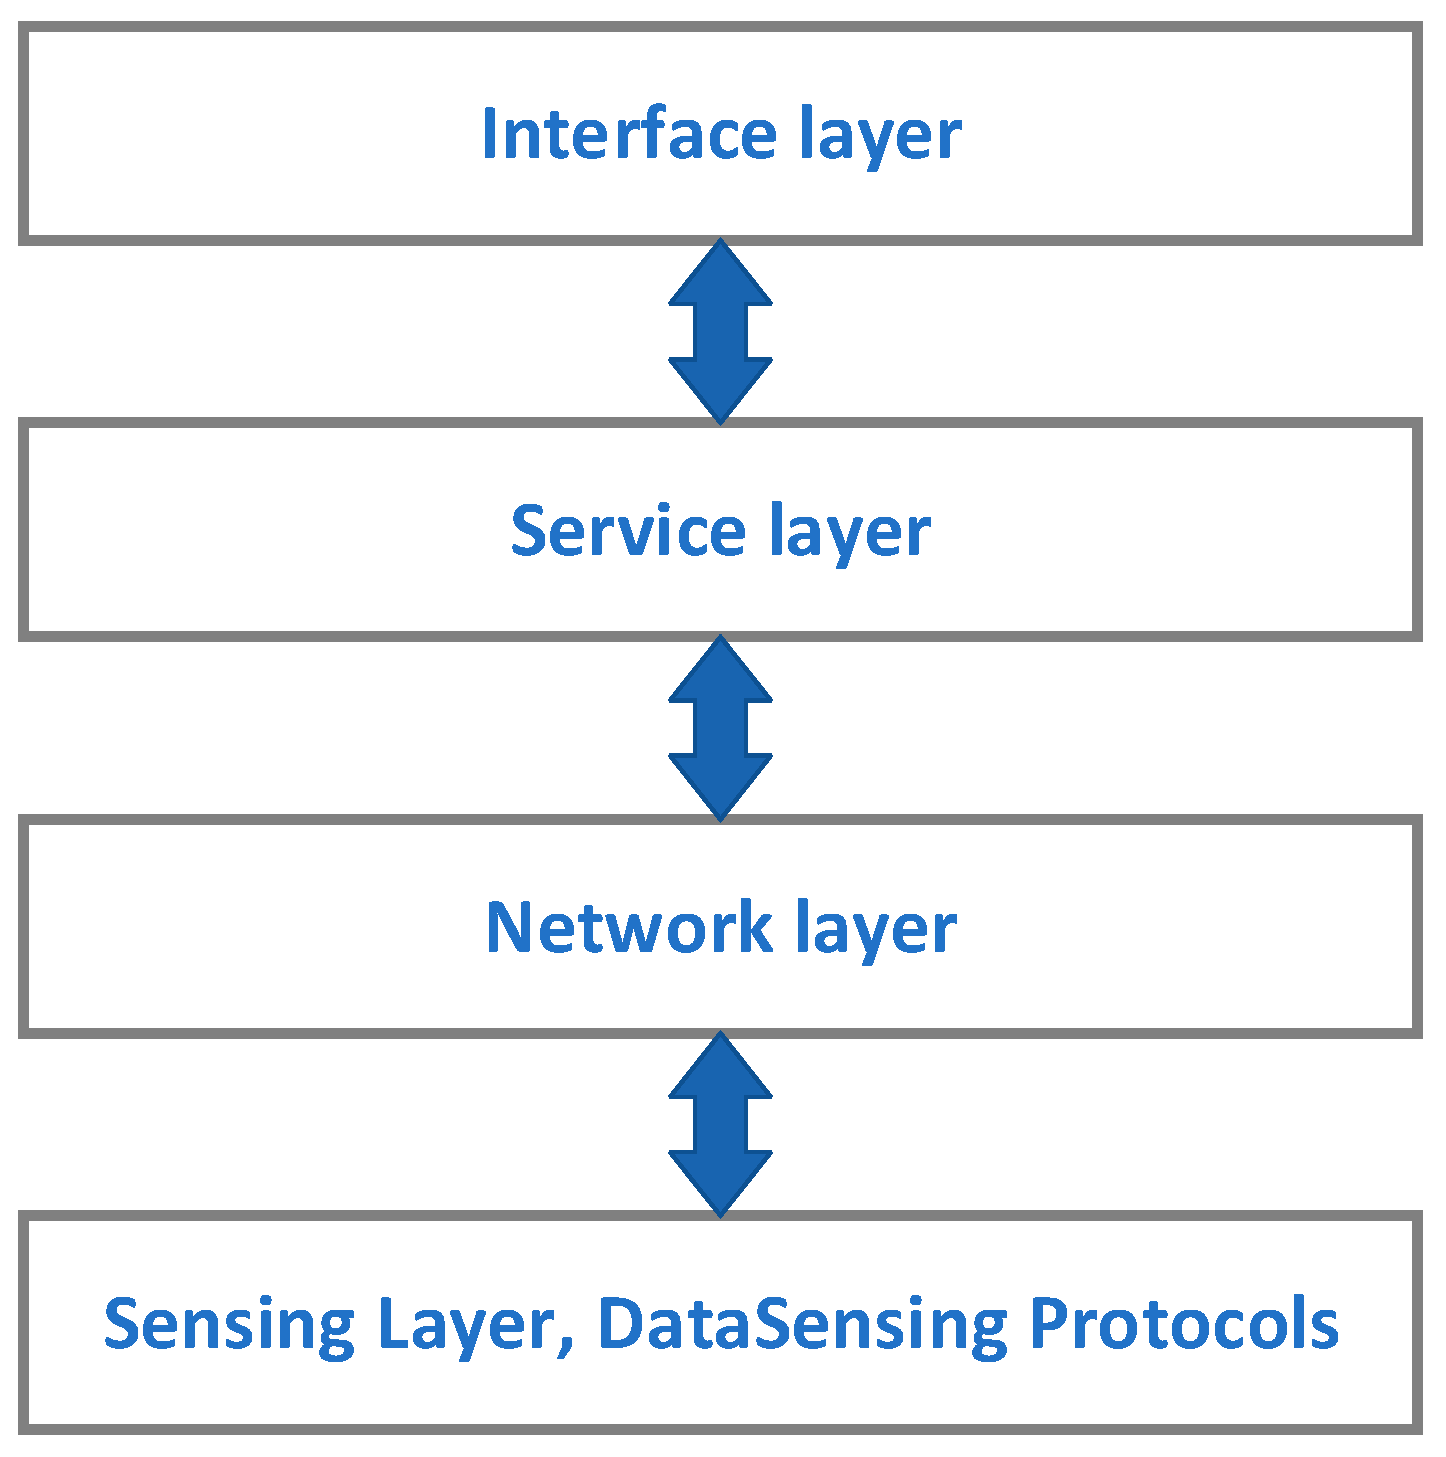
Figure 1 shows the service-oriented architecture of the Internet of Things composed of four layers [
37]:
The sensing layer is integrated with existing hardware entities to detect states and conditions (e.g., RFID Tags, Intelligent Sensors, RFID Readers, WSNs, Bluetooth Devices);
The network layer is the infrastructure to relief over wireless or wired connections between objects (e.g., WSNs, WLAN, Social Network, Mobile Network);
The service layer is responsible for creating and managing services required by users or applications (e.g., Business logic, Service Division, Service Integration, Service Composition, Service Implementation). Service platforms must reflect rules and policies governing the interactions and service exchange. Protocols are normative and guide actors/customers on how they can make use of available resources and value offerings.
The interface layer consists of the interaction methods with users or applications (e.g., Application Frontend, Contract, Interfaces, Application API).
SoA treats a complex system as a set of defined subsystems or simple objects. Subsystems or objects can be reused and maintained individually—software and hardware components can be reused and updated. Because of these advantages, the service-oriented architecture has found wide application in wireless sensor networks [
37,
38].
Devices vary widely in terms of communication, the computation performed, memory and capacity for stored data, and transmission capability. An Internet of Things application consists of various devices. Therefore, all devices should be properly organized by the network and should be accessible. The Internet of Things can be an aggregation of heterogeneous networks such as wireless sensor networks, mobile networks, and Wireless Local Area Network (WLAN). By using these networks, many complex activities such as data exchange, computation, and decision-making can be performed. Reliable communication between the gateway and the objects is essential for the management process in the Internet of Things. The gateway can locally run an optimization algorithm. It does this by leveraging its knowledge of the network. The computational complexity is transferred from the object to the gateway. A global optimal route and parameter values for the gateway can be derived in this way. Currently, the following protocols and standards are most often used [
37,
39]:
WSNs can be defined as infrastructure-less and self-configured WSN designed to monitor physical or environmental conditions, collect data, and transmit it over the network for analysis. Sensor nodes may communicate with each other using radio signals. A node is equipped with sensors and computing devices, radio transmitters and receivers, and power modules. Individual nodes in the network have limited resources: data processing speed, memory capacity, or communication bandwidth. Once sensor nodes are deployed, they are responsible for the organization of the network infrastructure, often multi-hop. Sensors collect information and can also respond to requests sent from the control side to execute specific instructions. Sensor nodes can operate continuously or can be controlled remotely. Local positioning algorithms and Global Positioning System (GPS) can be used to obtain location and positioning information. Sensors can also be equipped with servos that activate when certain conditions are met [
38,
39].
Figure 1 is a general scenario showing the service-oriented architecture of the IoT for which the research is being carried out in the WSN subsystem, which is a common component of the network and sensing layers. A schematic of a typical WSN structure along with a sensor node diagram is shown in
Figure 2. In our research, the IEEE 802.15.4/Zigbee protocol with routing based on AODV (Ad-hoc On-demand Distance Vector) algorithm is analyzed.
4. Analysis of the Simulation Results Concerning the Fault Tolerance Issues in ZigBee Protocol
An appropriate communication protocol, as well as routing algorithm, is required to ensure continuity. The main task of routing protocols in WSN is to find the best route between sensor nodes and receiver nodes and forward from the source node to the object node. Due to the constraints involved, several factors influence the design of routing protocols: node distribution strategy, data reporting method, network dynamics, node locations, fault tolerance, or a node’s type [
39,
40,
41,
42].
This research aimed to analyze selected routing protocols. The protocols used can be divided into three categories: network organization, routing method, and protocols based on which it operates. The first group includes flat, hierarchical, and location-based routing. The second group includes reactive, proactive, and hybrid protocols. The last group includes negotiation-based, multipath, queue-based, Quality of Service (QoS), and coherent protocols. Reactive routing protocols do not store overall network topology knowledge in routing tables. Routes are created on-demand when a node wants to connect to another node. Proactive protocols maintain knowledge of the entire network topology in the routing tables. All routes are predefined before transmission begins. Hybrid protocols combine the advantages of reactive and proactive protocols while negating their disadvantages.
In routing protocols with flat topology, all nodes are treated equally. This is mainly applicable to homogeneous networks where all nodes have the same features and functionalities. Hierarchical routing protocols are mainly used in heterogeneous networks. Often, clusters of nodes are formed in which there is a master aggregating node that forwards data. In location-based routing protocols, nodes can locate each other using location protocols. The location information helps to improve route finding by also allowing nodes to provide additional services.
Multipath routing protocols provide multiple routes to a destination, thereby balancing loads, reducing latency, and improving network performance. In query-based routing protocols, sensor nodes send data only after receiving a specific request from the destination node. In negotiation-based routing protocols, in order to avoid unnecessary redundancy, nodes negotiate among themselves what data will be transmitted by the nodes.
The vast majority of actual fault tolerance protocols introduce redundancy. The most common technique for tolerating a wireless link is retransmission, which generates additional network traffic and causes additional energy consumption. Receivers must acknowledge the receipts of messages, which requires additional energy compared to a method without retransmissions. When the amount of retransmissions is significant, the latency is higher and provides the information to become obsolete. IEEE 802.15.4/Zigbee is a specification used in WSN with low power consumption. The ZigBee standard is considered to be one of the most relevant technology for LLNs (Low-power and Lossy Networks). At the beginning of its evolution, it was described by the Cluster-Tree protocol as a hierarchical routing protocol that uses link-state packets to create a two-level cluster-based network, in which every cluster is managed by a single cluster head (CH). Such a network is self-organizing and supports fault-tolerance and self-healing mechanisms. A cluster tree is created by several parent-child adjacencies across ZigBee routers up to a specified level of deployment. The clusters are expected to work in exclusive time slots to prevent interference among them. With the appearance of the modified ZigBee protocol, cluster-tree routing discontinued support due to the complicated maintenance problems, and the standard instead embraced flat and mesh routing using AODV [
43,
44,
45]. This fault tolerance mechanism in IEEE 802.15.4/Zigbee is also called orphaned device realignment. This recovery/repair routine is triggered whenever there are recurring traffic errors in data requests (e.g., data frames sent without receiving the requested acknowledgment that occur either when a device and its parent or when a device drops out of sync with its parent). Once a unit is deemed orphaned, a resignment or channel rescan process is triggered [
43].
Devices in IoT are very diverse in terms of communication, the computation performed, memory and capacity for stored data, and transmission capability. An Internet of Things application consists of various devices, but typically there is a main coordinating node (gateway), a few intermediate nodes (routers), and most end nodes. The number of nodes in the network can take values from a few to several hundred, but in order to visualize the different processes occurring in the network, the research was limited to 17 nodes, which were assigned in proportion to the number used in IoT systems. It was assumed that in the ideal case all devices should be properly organized by the network and should be accessible. The Internet of Things can be an aggregation of heterogeneous networks such as wireless sensor networks, mobile networks, and Wireless Local Area Networks (WLANs). By using these networks, many complex activities, such as data exchange, computation, and decision-making, can be performed. Reliable communication between the gateway and the objects is essential for the management process in the Internet of Things. The gateway is able to locally run an optimization algorithm. It does this by leveraging its knowledge of the network. The computational complexity is transferred from the object to the gateway. A global optimal route and parameter values for the gateway can be obtained in this way.
The deployment of nodes allows for a more accurate location of events. Many WSN implementations use battery-powered sensors because charging or replacing them may not be practical. Disposable sensors are used. Improving the lifetime and performance of disposable nodes should reduce potential failure, which is the primary concern.
The values obtained in the simulations represent averaged numbers from several runs of experiments. For the initial state, tests were performed 10 times, while for the post-failure states, the number decreased proportionally as the results were reproducible. The IoT network was assumed to have full coverage in a given area. To this end, end nodes were randomly “scattered”, but so in each case, the number of nodes was the same. Due to the nature of the network operation, each end node must be connected to the coordinating node through an intermediate node (router). The number of routers depends on the distance from the coordinating node. This condition has been satisfied for each node. Additionally, in order to demonstrate the changes in the network and traffic statistics (management traffic, control traffic, rejected data, etc.), both the case of nodes that connect through a single router and the case where the farthest node is connected to the coordinator through several routers have been selected for failure.
4.1. Riverbed Modeler
The research was conducted in the Riverbed Modeler Academic Edition 17.5 simulator. Riverbed Modeler previously known as OPNET Modeler is a simulation platform designed for commercial use. However, it has an academic version that includes all the tools needed for model design, simulation, data collection, and data analysis. Riverbed Modeler models the behavior of an entire network containing routers, switches, servers, protocols, and individual applications. The purpose of the simulator is to optimize cost, availability, and performance.
The Riverbed Modeler has many libraries of standard models that are added before the developers. The simulator has a very user-friendly IDE that makes work easier. Riverbed Modeler can be used to plan the network, i.e., create the whole topology, check how it works, run different scenarios like breaking one of the connections, and optimize network performance. Riverbed Modeler also allows the creation of custom components: protocols, algorithms, and applications based on simulation. The system-in-the-loop interface allows extending the testbed with simulated hardware. Real hardware, applications, and users can interact with virtual devices in the simulation model. This avoids creating an expensive test lab. Riverbed Modeler has a graphical environment that allows you to build networks in a three-tier hierarchy:
Network model: composed of nodes, links, and subnetworks,
Node model: composed of building blocks of nodes—processors, queues, transceivers, and interfaces connecting them,
Process model: composed of a finite state machine diagram, C/C++ code blocks, kernel routines.
4.2. The Model and Topology of the Analyzed Network
The research carried out here was based on ZigBee technology based on IEEE 802.15.4 specification. ZigBee is a wireless ad-hoc network with low power consumption, low data rate (250 kbps), and short-range. For this reason, it is well suited for use in wireless sensor networks and more broadly in the Internet of Things. A ZigBee device can be divided into three categories: coordinator, router, and terminal device. ZigBee device symbols in the Riverbed Modeler simulator are demonstrated in
Figure 3.
The coordinator serves as the starting node to which other devices can connect. There can be only one coordinator in a given network. It usually also plays the role of a data collector. A router is responsible for forwarding packets, allowing multiple hops. The terminal device is the last element of the network, which is responsible for collecting data and forwarding it to the router. Because the distance between two nodes in end-to-end communication is restricted, the type of unit and the route node is required to transmit the information. The above-mentioned three kinds of nodes are the idea of the network layer, and their arrangement determines the topology of the ZigBee network.
This research aimed to test the resilience of the network against data communication threats such as node failures. For this purpose, a network topology was created that included one coordinator, several routers, and end devices. Several scenarios were then simulated in which different devices were intentionally damaged. The first scenario with all devices working served as a baseline for the other three. The devices have a limited range, so they were deployed in such a way that they could communicate with each other without hindrance. The second scenario assumes the failure of a few devices, which should not disrupt the network to a significant degree. The failed nodes are marked with a green X. In the third scenario, more devices fail, which should translate into less efficient network operation. The failed nodes were marked with a blue X. The fourth scenario assumes that many devices fail, paralyzing the network operation. Both end devices and routers fail. This should prevent communication between devices, especially with the coordinator, and consequently paralyze the network. The failed nodes are marked with a red X. The topology of the analyzed network and scenarios along with the designation of the damaged nodes is shown in
Figure 4 and described in
Table 1.
The devices have a limited range, so they were placed in such a way that they could communicate with each other without interference. A few devices were selected and their statistics were checked after each simulation, as well as the global network statistics.
4.3. Results of the Research
ZigBee is a communication protocol used for low-power devices. Frequently used on wireless monitoring and control systems. The 802.15.4 MAC layer is used for basic message handling and congestion control. The MAC layer includes mechanisms for forming and attachment to the network, a CSMA mechanism for pure channel listening devices, as well as a link-layer to handle retry and message acknowledgment for reliable communication between neighboring devices. The Zigbee network layer builds on these basic mechanisms to provide reliable end-to-end communication over the network.
The efficiency of ZigBee and IEEE 802.15.4 may be evaluated with the use of relevant parameters. The most important parameters which were evaluated in this paper are:
- -
Data Traffic Send—This measure contains all traffic sent by the MAC over CSMA-CA. It excludes any management, control, or ACK traffic.
- -
Data Traffic Received—Consists of the total traffic that was successfully transmitted by the MAC from the physical layer in bits/sec. Includes retransmissions.
- -
Throughput—it refers to the rate at which data is successfully transmitted from a source node to a destination node.
- -
Rejected data—it refers to the rate at which data sent by the node ware rejected by the destination node
In each of the designed test scenarios, several devices were selected after simulation and their statistics were analyzed. The baseline values for the optimal operation scenario (basic configuration—all connections active) are shown in
Table 2.
The overall statistics of the network operation in the first scenario are shown in
Table 3.
At the peak of the simulation, the number of received as well as sent data are 109 Kb/s and 143 Kb/s, respectively. Also of special note is the high throughput of 24 Kb/s and the low number of rejected packets of 8640. The number of exchanged network management data is not high, and the network operates stably. The data of the network coordinator statistics in the scenario I are shown in
Table 4.
OPNET environment tool was used to run real-time scenarios to affirm our simulation results. Because of the random deployment, we ran more than 10 simulation replications for each scenario. Each simulation was run under the same conditions with the same input parameters. The benchmark state was assumed to be the state in which the standard deviation does not exceed 1 to 4% depending on the parameter. The result of the test series as multiple measurements of the same parameter, under the same conditions, was considered the arithmetic mean of the individual results, and their uncertainty (standard deviation of the mean value Sx) was verified. Each of the 10 tests performed gave similar results, so the number of 10 tests was assumed to be sufficient. The averaged values were taken as baseline parameters.
The values of the maximum deviations are shown in the column “Deviation”. We show the top results of all scenarios below followed by OPNET test results.
The data collected for all scenarios are significantly different from those collected in the normal network operation control sample, as shown in the summary
Table 5.
The first observation is lower levels of received and transmitted data, while the second observation is about the simulation traffic for individual network parameters. The fluctuations in the traffic occur more frequently than in the previous scenario and are larger. During the simulation, a lot of packets were rejected during transmission. There is a significant difference between each of the tested network parameters in the first and second scenarios. The details are illustrated in the graphs. In
Figure 5a the received control traffic expressed in bits per second can be seen.
Figure 5b shows the sent control traffic expressed in bits per second.
Figure 6a shows the amount of data that was received over the network expressed in bits per second. In
Figure 6b the one can see the amount of data that has been sent over the network expressed in bits per second.
Figure 7a shows the amount of management data received in the network expressed in bits per second.
Figure 7b shows the amount of sent management data expressed in bits per second.
Figure 8a shows the network throughput expressed in bits per second and
Figure 8b shows the number of packets rejected during transmission.
Table 6 shows the behavior of the network in the full state with the network with two failed nodes (Router2, Router4). As can be seen, the differences between the corresponding values are up to four thousand percent. The failure of two nodes drastically degrades the transmission parameters, but the network still works properly. The traffic is taken over by the functioning nodes.
During the analysis of the third scenario results, two more nodes were removed (EndDevice9, EndDevice10). The analysis of the network with a total of four disconnected devices shows that the fluctuations are even greater and more noticeable than in the case of the second scenario test results. The amount of data sent is only 66 Kbps at the peak of the simulation. 25,920 packets were rejected. The results obtained are shown in
Table 7.
In the third scenario, there are larger differences between the values achieved during the simulation. In the fourth scenario, in addition to the devices that were damaged in the previous scenarios, two routers failed. This caused complete paralysis of the network so that it stopped functioning, as shown in
Figure 9.
Figure 9a shows the network throughput expressed in bits per second while
Figure 9b shows the number of packets rejected during transmission.
In the fourth scenario, the amount of network management data is huge, several times higher than the previous scenarios. Also, the number of discarded packets is very large and is as high as 60,500 packets. The detailed traffic comparison is shown in
Table 8. The differences between the results of the first scenario and the results of the fourth scenario are huge. The failure of several devices caused practical network malfunction.
ZigBee transmissions can repeat up to two times (three times in total) and every node in the network or in the radius of that transmission repeats it. Transmissions can consume a lot of bandwidth. Most networks of reasonable size (more than 100 nodes) can only handle about four to five transmissions at a time. It is therefore recommended where possible to unicast transmissions instead of broadcasting. Unicasts consume much fewer resources in the form of bandwidth and RAM. It should be taken into account that ZigBee uses unicasts to transmit data along a route, but any node near any hop can hear such a unicast. It is discarded by all the nodes except the destination node, but the transmission still consumes bandwidth, which also unicasts directly affects the lifetime of the nodes.
A detailed analysis of all four scenarios shows that as the number of removed nodes increases, the control traffic obviously decreases, as shown in
Figure 10. The value of control traffic decreased from 8570 b/s to 2 b/s for received traffic, and 1810 b/s, to 1 b/s for sent control traffic in scenario 4.
The situation is similar to the number of sent/received data. The throughput of the nodes is limited, which directly affects the number of transmitted/received packets.
Figure 11 shows that as the number of disconnected nodes increases, the values also decrease until the network is completely disabled. It can be seen that the number of received data decreases systematically with the number of disconnected nodes (from 190,200 b/s—Scenario I, to 7 b/s—Scenario IV). The situation is similar for the number of packets sent. The number of data sent decreases from 143,400 b/s—Scenario I, to 4–5 b/s—Scenario IV).
Figure 12 shows the dependence of throughput on the number of failed nodes. The decrease in the maximum throughput can be clearly seen. This has to do with the previously mentioned limitations of the nodes themselves. An interesting phenomenon is the increasing number of rejected packets in this case. It is evident that the network is not able to handle the incoming traffic which translates into an increase in the number of lost packets. As shown in
Table 6, the throughput dropped from 24,025 b/s to nearly 2 b/s, and the number of rejected packets dropped from 8640 to 60,500, which is nearly 700% degradation.
Interesting conclusions can be drawn after analyzing the values of management traffic and control traffic (
Figure 13). It can be seen that as the control traffic decreases (both received and sent), the number of management packets increases. The dependence of throughput on the number of failed nodes is shown. It can be clearly seen that the maximum throughput decreases. This is related to the number of packets lost. The network consumes its resources for management due to the need to redirect traffic associated with the increasing number of unavailable nodes.
5. Conclusions
The evolution of the Internet of Things brings with it many opportunities for its use on many levels, while causing many problems and posing many design challenges for engineers. One of the biggest challenges is to ensure business continuity and resilience to failures. The Internet of Things infrastructure must have an appropriate level of scalability because it is much more dynamic and mobile than the Internet of PC’s, with contexts changing rapidly and in unexpected ways. Creating a system that is robust and resilient may require redundancy at several levels and the ability to self-adapt to changing conditions.
Designing routing protocols for wireless sensor networks is quite a challenging task due to the many characteristics that distinguish them from wired networks. Assigning a universal identification scheme to a large number of sensor nodes is extremely difficult. Consequently, it becomes impossible to use classical IP-based routing protocols. A lot of data from many sources flows to a specific base station, and the created data traffic on significant redundancy is caused by the fact that many nodes can detect the same event. Therefore, it is necessary for the protocols to take advantage of this redundancy and to make the most efficient use of the available bandwidth, and consume as little power as possible.
Designing a routing protocol in wireless sensor networks is a major challenge due to resource constraints such as bandwidth, available memory, and power supply. The protocol complexity can affect the performance of the overall wireless network. This is obviously due to hardware limitations. The challenge becomes ensuring scalability. Sensor prices are falling while demand is growing. The protocol must be prepared to handle up to many thousands of sensors. Additionally, the protocol must provide minimal latency and fault tolerance. Sensor nodes are very sensitive and often deployed in hazardous environments. Node failures can occur much more frequently than in other types of networks. Routing protocols should quickly detect and locate the failure, then reroute the traffic otherwise. Studies have shown that routes with a high number of hops used despite obtaining the lowest latency are not always optimal due to the high energy consumption associated with a higher number of hops. To support our findings, a real-time model was constructed in OPNET. Different scenarios were implemented, and results have confirmed our thesis about the impact of the routing algorithm on network throughput and delay. Therefore, unicast transmission is recommended where possible instead of broadcasting. Due to the lack of time synchronization in ZigBee technology, routing nodes need to be radio-enabled at all times, to be ready to receive data packets at any time. This has a direct impact on IoT system implementations and their lifetime. The performed research has shown that it is very important to protect the infrastructure against damage because the interruption of even one device can mean the loss of some data. On the other hand, damage to appropriately selected nodes may result in the discontinuation of the operation of the entire network. Internet interruption in functioning or loss of a part of collected data can have catastrophic results. Protecting IT and IoT infrastructure should always be a priority, especially now that technologies such as the Internet of Things are becoming more and more important in everyone’s life. The balance between network lifetime optimization and load distribution among sensor nodes is critical to the development of energy-efficient routing solutions.


