Article

Cost–Benefit Analysis of Pumped Hydroelectricity Storage Investment in China

by
Paolo Sospiro
1,2,3,4,*,
Leonardo Nibbi
1,
Marco Ciro Liscio
2,4,* and
Maurizio De Lucia
1,*
1
CREAR/Dipartimento di Ingegneria Industriale, Università di Firenze, 50139 Firenze, Italy
2
DII Dipartimento di Ingegneria dell’Informazione, Università Politecnica delle Marche, 60121 Ancona, Italy
3
Uniecampus, 22060 Novedrate, CO, Italy
4
EUAbout, 1000 Brusselles, Belgium
*
Authors to whom correspondence should be addressed.
Energies 2021, 14(24), 8322; https://doi.org/10.3390/en14248322
Submission received: 21 September 2021 / Revised: 12 November 2021 / Accepted: 24 November 2021 / Published: 10 December 2021

Abstract

:
In this study, the energy scenario in China was analyzed by retracing the trend of exponential population growth, gross domestic product (GDP), and electricity production and consumption. A forecast up to 2050 was made based on the history and forecasts of other field studies. It was possible to deduce data on pollutants in terms of CO2 equivalent (CO2-eq) emitted over time if there were no changes in the way energy was produced. Moreover, different scenarios were hypothesized for the use of pumped hydroelectricity storage plants, namely 4.5%, 6%, 8%, 11%, and 14% (percentage of electricity compared to requirements in 2050), to balance variable renewable energy sources and avoid curtailment, thereby reducing the use of energy produced by coal-fired plants. For this implementation, direct and indirect costs and benefits were considered, with interesting results obtained from an economic standpoint and very positive results from environmental, social, and territorial perspectives.

1. Introduction

With a population of over 1.4 billion inhabitants, China is the most populous country in the world. It currently has one of the highest annual GDP growth rates owing to the industrial momentum that has characterized the country in recent decades. All this justifies the parallel trend in terms of electricity production and consumption in the country. The main Chinese energy source by far is coal due to its abundant presence in the country and its relatively low cost.
Pumped hydro storage (PHS) plants are electric energy storage systems based on hydropower operation that connect to two or more reservoirs (upper and lower) with a hydraulic head. They are usually also referred to as pumped hydro energy storage (PHES) plants, pumped storage hydropower (PSH) plants, or pumped storage plants (PSP) and operate from the exchange of water between two reservoirs.
In production mode, also known as turbine mode, the water released from the upper reservoir passes through the turbines to generate electricity. In pumping mode, electrical power from the grid is used to pump water from the lower reservoir to the upper one. This is a very efficient way (round-trip efficiency in the range of 75–85%) to store excess electric energy during periods where there is no demand in the form of potential energy for later on-demand generation.
The objective of this study was to conduct a cost–benefit analysis (CBA) on the possibility of implementing PHS plants to reduce curtailment of variable renewable energy sources (VRES) and stabilize energy production in China by reducing the use of coal in existing plants. The environmental impact and long-term costs were also analyzed. The installation of a series of PHS plants, along with the implementation of smart grids [1], smart metering, energy efficiency policies and action, liberalization of the electricity market, and better integration of RES, will be part of the solution to balance electricity supply and demand in China. This study took into account the costs and benefits of the installation of PHS in terms of coal and CO2 emission reduction. However, in the future, we will add other modules that will take into consideration the effects of other policies on PHS in China. Furthermore, another interesting aspect that the next step should take into consideration is the best available technology (BAT) for PHS, which will improve the results of the PHS plants installed in the future in China.
Flexibility is the capability of a power system to cope with the variability and uncertainty that VRES, mainly wind and solar, introduce at different time scales. Among the three basic types of flexibility provisions related to residual load smoothening (downward, shifting, and upward flexibility), the role of PHS is shifting flexibility. PHS can shift surplus feed-in of renewable energy to periods with positive residual load and vice versa. This is one of the main tools to cope with VRES curtailment, which plays the role of upward flexibility by dissipating VRES energy that is surplus to system demand [2].
Several key drivers for the development of China’s PHS can be summarized as follows:
  • Governmental and regional targets for carbon reduction have been stimulating the integration of renewable energy sources (RES) for years. The rapid development of wind energy in the north and west of China can be considered as the prime driver for increased PHS development. In 2020, China reached record wind capacity of 288 GW (278 GW on-shore and 10 GW off-shore), accounting for 39% of the global installed capacity, while solar PV capacity reached 254 GW, accounting for 36% of the global capacity.
  • In October 2020, more than 400 companies in the Chinese wind industry adopted the Beijing Declaration, which aims for 50 GW of annual installations from 2021 to 2025 and 60 GW from 2026 onwards. This would bring China’s cumulative wind capacity to 800 GW by 2030 and 3000 GW by 2060. Storage strategies are necessary to cope with this new amount of variable renewable energy sources to avoid curtailment [3].
  • Variable renewable energy curtailment in China is mainly due to the rapid growth of wind and PV installations in the remote northwestern areas of China, while most of the electricity demand is located in the populated and industrialized urban areas of the southeastern coast of China. Wind energy curtailment reached a global average of around 17% in 2016, while around 11% of solar energy was curtailed in 2015. Regarding economic impact, as an example, the cost of curtailment was evaluated at around $1 billion in the period 2011–2017. The situation is getting better, with wind energy curtailment in 2019 coming down to 4%, although this still accounted for 17 TWh lost [4].
  • Electricity consumption has been growing due to China’s rapid industrial development, so PHS is urgently needed to bridge the valley-to-peak gap.
  • Because the security of the electric power supply has been emphasized by regulators, PHS needs to be widely used to contribute to the reliability of the power grid as it can provide ancillary services [5].
This article presents parts of the results of an ongoing research project supported by the China Europe Water Platform (CEWP) aimed at studying the potential of PHS in reducing the climate impact of Chinese electricity production. The rest of the article is organized as follows. A literature review on CBA, PHS, and China is given in Section 2. Section 3 presents a case study on the CBA of PHS. Section 4 explains the different scenarios considered in this work. The application of the model on the CBA of PHS is discussed in Section 5. Section 6 provides the data gathered for study of the CBA of PHS. Finally, Section 7 discusses the main findings and conclusions.

2. Literature Review

In recent decades, many authors and scholars have studied PHS and energy storage in general and their contribution to stabilizing energy production and distribution as well as their role in transitioning from fossil fuel to RES for electricity production.
The current national plans in China for RES can reduce 35.8 billion tons of CO2 by 2050. The average CO2 abatement cost of promoting RES power is $9.98/tCO2 during 2015–2050. Every 1% increase in the capacity factors of RES would decrease the average CO2 abatement cost by $0.86/tCO2 [6].
The global effort to decarbonize electricity systems has led to widespread deployments of variable renewable energy generation technologies. PHS is the overwhelmingly established bulk electrical energy storage (EES) technology (with a global installed capacity of around 158 GW) and has been an integral part of many markets since the 1960s [7] An effort was made by the EU JRC to implement PHS in France by assessing the potential of high-energy sites. This analysis found PHS ranging from 14 GWh when only existing lakes were considered to 33 GWh [8].
At the global level, more than 350 PHS stations are operating with a total capacity of 158 GW. In China, PHS has also enjoyed booming development in the last 10 years, although a lot of problems have occurred in the aspects of management mode and electricity pricing mechanism. Currently, PHS in China accounts for installed capacity of 30.3 GW [9]. The State Grid Corporation of China (SGCC) is considered a role model in its effort to develop PHS in China.
A number of authors have analyzed the role of PHS on RES price mechanisms and economic aspects of electricity markets [7,10,11,12,13,14,15,16,17,18,19], while others have studied the technical aspects of implementation and energy contribution of PHS systems [8,20,21,22,23,24,25,26]. In addition, many authors have developed CBA on the subject of RES [27,28,29,30,31,32,33,34,35,36,37,38,39,40,41,42].
In the present study, we used a different approach to highlight the costs and benefits of PHS installation and found significant social and economic benefits for China. The installation of additional PHS to balance the needs of the electricity system represents an additional shifting flexibility for the grid, thereby reducing the need for VRES curtailment. Shifting flexibility capacity in the system fosters VRES penetration that, combined with GHG savings targets, can facilitate the phase-out of fossil-based capacity. In China, this means reducing the footprint of coal power in the system.
Regarding this last aspect, a number of authors have studied this in the Chinese context [6,43,44,45,46,47,48,49] and in the European context [50,51,52,53,54,55,56].

3. Zhanghewan Case Study Model

This study took into consideration the model applied by the Asian Development Bank to assess the Hebei Zhanghewan PHS and Rural Electrification Project in 2002. The model analyzed the benefits, adverse effects, recommended mitigation, and monitoring measures related to the construction and operation of the abovementioned project [57].
From a general operational point of view, the project provides 1000 megawatts (MW) of new peak load generating capacity that can be operated with high flexibility. It also includes a new 500 kV transmission line extending 63 kilometers (km) that was installed to expand rural electrification. Indeed, the installation of this PHS station in Hubei province (Figure 1) made it possible to close inefficient coal-fired power plants and expand irrigation capacity in the surrounding area, with positive effects on emissions, grid stability, and water availability for agriculture.
The project’s general objective is to provide capability for “peak shaving” and “valley filling”, thereby reducing the frequency and duration of power supply interruptions.
The cost of installing a plant with 1 GW capacity includes capital costs for equipment and pump turbines to produce electric power and participate in balancing VRES production (Table 1).
The total cost of the project has been reported as about $775 million. Therefore, using the average change from 1 April 2017 to 12 June 2019 and ECB euro reference exchange rate of 1 USD = 0.8617 EUR, more than half a billion euros would be needed to install a system with capacity of 1 GW.

4. Scenario Development

Although it is very difficult to generalize costs for this kind of installation, due to the different situations in which it needs to operate, it has recently been confirmed that the average cost per MW for PHS implementation in China and India is in general considerably lower than in the rest of the world.
The average cost of a PHS in China can be preliminarily assumed at $794 million per/GW [58], a value that is aligned with the Zhanghewan case.
Statistics on installed PHS capacity at the global level are available from the “International Hydropower Association (IHA)’s Hydropower Status Report 2020” [9], as in Table 2.
The total installed power capacity in China in 2019 was about 1900 GW according to the China Energy Portal based on China Electricity Council data [59].
China Pumped storage installed capacity  2019 Total installed China power capacity  2019 = 30.3 GW 1900 GW 1.6 % = R 0
The 1.6% obtained by Equation (1) represents the portion of PHS capacity compared to the total power capacity in China in 2019; therefore, R0 represents the starting ratio.
R0 agrees with the research paper “Overall Review of Pumped Hydro Energy Storage in China: Status Quo, Operation Mechanism and Policy Barrier” [15], which explains that the capacity of PHS and the number of PHS have been increasing for years but that PHS as a proportion of total installed capacity has nowadays stayed near 1.6%. Scholars in Japan have studied the reasonable proportion of PHS by utilizing mathematical programming methods, and their research showed that the optimal proportion of PHS in the power grid in China is between 8% and 14% [60]. Therefore, three different starting ratio scenarios, each one characterized by a representative index (Ri), were used, namely R8% = 8%, R11% = 11%, and R14% = 14%.
The following formula indicates the level of PHS capacity that should be installed today in order to achieve the target for each scenario:
Target level per scenario = China Pumped storage installed capacity 2019 Ri Ro
In particular, according to Equation (2), R8% target = 152 GW—R11% target = 209 GW—R14% target = 266 GW.
The needed capacity was calculated by the difference between each scenario target and China’s PHS installed capacity in 2019.
Needed additional capacity to achieve R8% scenario = 121.7 GW
Needed additional capacity to achieve R11% scenario = 178.7 GW
Needed additional capacity to achieve R14% scenario = 235.7 GW
Two other scenarios were also considered, namely 4.5% and 6%, representing the lowest scenario and a European-like scenario, where the average level of PHS is about 6.2% according to IHA [61] and ENTSO-E transparency tool [62]. The results of the new scenarios were as follows:
R4.5% target = 85.5 GW → Needed additional capacity for R4.5% = 55.2 GW
R6% target = 114 GW → Needed additional capacity for R6% = 83.8 GW

5. Application of the Model on PHS in China

In this study, an analysis of the general situation in China from the point of view of economic and demographic growth was first carried out.
GDP i = GDP i 1 + GDP i 1 Expected Growth Rate _ i
This preliminary analysis was fundamental for the rest of the work because GDP is closely correlated to electricity production and consumption, both for residential consumption, which is related to the population, and for the use of energy in industry and services, which is related to economic growth.
Energy production (EP) is the pivotal data on which the study was carried out:
EP i = FORECAST . ETS ( YEAR i ; EP 2000 : EP i 1 ; YEAR 2000 : YEAR i 1 ) EP i 1 0.3 %
Capacity data up to 2040 was taken from the IEA forecast [63], while capacity between 2040 and 2050 was forecast according to the linear regression model previously applied for electricity production:
CAPACITY i = FORECAST . ETS ( YEAR i ; CAPACITY 2000 : CAPACITY i 1 ; YEAR 2000 : YEAR i 1 ) CAPACITY i 1 0.3 %
Based on the study conducted by Zhang Diansheng, Chen Tao, and Yongxing Li [60], which identified 8%–14% as the optimal range for PHS implementation in Japan, these percentages were applied to the values of the total Chinese energy capacity forecast for each year from 2018 to 2050 to obtain the average value of PHS plants in terms of GW required to be implemented annually to reach the target for each scenario by 2050 following this model:
ANNUAL GROWTH REQUIRED = CAPACITY 2050 % SCENARIO CAPACITY 2018 2050 2019
On this basis, it was possible to estimate two important data points.
The first was the average PHS plant implementation cost considering the inflation rate and the discount rate:
ANNUAL IMPLEMENTATION COST = [ ( COST per GW ANNUAL GROWTH % SCENARIO ) ( 1 + IR ) year 2020 ] ( 1 + DR ) year 2020
The second was the PHS plant implementation cost with O&M cost after the fifth year, when the first plants will be operative:
ANNUAL IMPLEMENTATION COST WITH O & M COSTS = [ ( [ 7 ] ) + ( O & M per GW ANNUAL GROWTH % SCENARIO 5 years ) ( 1 + IR ) year 2020 ] ( 1 + DR ) year 2020
The second was the PHS plant implementation cost with O&M cost after the fifth year, when the first plants will be operative:
The equivalent value of coal and CO2 avoided through the use of PHS installations and the closure of the corresponding coal-fired power plants in terms of power generated was calculated by taking into account the fact that the first environmental benefits will be found after five years, the expected time for a PHS plant to come into operation.
MASS OF COAL AVOIDED = ( 6 ) / ( Coal plant efficiency Heat value for coal )
MASS OF  CO 2 eq  AVOIDED = ( 6 ) Mass of  CO 2 eq  per kWh
ANNUAL AVOIDED COST COAL = COAL COST MTon Coal per year
ANNUAL AVOIDED COST CO 2 eq = EU ETS PRICE MTon CO 2 eq per year
Once the economic costs and benefits of this implementation were obtained, a comparison was made between them.

6. Data

As mentioned in the previous section, a comparison was first carried out on the trend between energy production and GDP growth in the country. These data were derived and processed using the World Bank’s historical data on China’s historical percentage GDP growth [64]. The OECD long-term forecast reported on the Knoema portal was used to forecast the GDP trend from 2018 to 2050 [65].
The electricity production data was forecast using the AAA version of the exponential smoothing (ETS) algorithm adjusted with 0.3% reduction over the previous year to match long-term forecasts based on the World Bank’s historian [64] and integrated with studies on the sector and data regarding installed capacity in the country until 2040 from agencies such as the IEA [63] and EIA [66]. The results indicated a total capacity of all energy plants in China as 3314 GW by 2040. According to this forecast, it is expected that electricity production (EP) will reach about 13.17 million GWh/y and the total capacity in the country will be 3633 GW in 2050.
Historical data up to 2018 on the use of coal in power generation was considered, which showed a very high value in percentage terms, reaching 81% in 2007. This value dropped to 70.3% in 2015 [67], equal to about 4.03 million GWh/y with estimated use of over 1575 Mton.
To quantify the mass of coal and CO2-eq, the following values were considered:
  • Heat value for hard black coal: 23.9 MJ/kg [68];
  • Coal-fired power plant average efficiency in China: 38.6% [69];
  • Mass of CO2-eq per kWh: 1.018 kg/kWh [70].
Therefore, to produce 1 GWh of electricity, given the Chinese average efficiency, it is necessary to burn around 390 tons of hard black coal.
The World Bank forecast [71] was used as the reference to forecast the coal price and calculate the benefits of avoiding coal usage for the next 30 years, while the “EU Energy, Transport and GHG emissions: Trends to 2050” publication [72] was used as the reference to calculate the value of CO2-eq emissions avoided according to EU ETS terms. The proposed forecast was disregarded due to the actual trend, so we considered a forecast based on the European data shifted 10 years in the future with a consequent increase in the price forecast for 2050, as shown in the following graphs (Figure 2 and Figure 3).
The EU ETS system was used as China is still developing its own system and because this is the most advanced system globally for calculating the price of CO2, assuming that a Chinese index is in line with the proposed one.
To estimate the annual implementation cost of PHS plant, the following were considered:
  • The discount rate (DR) as 8.5% according to EPPA assumption [73];
  • The inflation rate (IR) as 2.81%, the average value between 1995 and 2019, according to World Bank data [74].
Both applied to the implementation cost per GW reported in the Zhanghewan case study [57].

7. Results and Discussion

First of all, historical data on GDP and population were considered, and this data was compared with the historical production and consumption of electricity in China. This analysis showed a very similar trend between the curves, even during the economic upsurge observed in the last 20 years, which saw the GDP climb to $13,608 billion in 2018 and the amount of energy produced increase to 6.99 million GWh/y, corresponding to about 1818 GW of plant capacity. With the trend and historical data, it was possible to apply a linear regression model to obtain forecasts up to 2050. Starting from the long-term forecasts on the OECD’s GDP percentage trend and the IEA and EIA’s energy production forecasts, a figure of 13.49 million GWh/y was obtained for 2050.
The projection in Figure 4, based on real data until 2018, does not consider the effects of the COVID-19 pandemic. This is because it is expected that the 2020 loss of GDP due to the pandemic will be recovered, as has already been happening, in the next few years, and its influence in 2050 can be considered negligible.
Based on this and the IEA and EIA forecasts on capacity by energy source, the total energy capacity per year in China was calculated, with the figure expected to increase from 1818 GW in 2018 to 3314 GW in 2040 and up to 3721 GW in 2050 (Figure 5).
In 2018, about 67.5% of the total capacity was represented by coal-fired plants, meaning the amount of coal necessary was about 1842 Mton according to the model used. This value is expected to grow slightly and then decrease again to around 1983 Mton in 2050 as the percentage of coal used decreases according to sources such as the EIA, which expects coal-fired power to account for 47% of the capacity in 2040 [66] owing to the development of energy from alternative and renewable sources (Figure 6 and Figure 7).
In September 2020, speaking at the UN General Assembly, China’s President Xi Jinping pledged that the country would become net-zero GHG emission by 2060 and that China’s GHG emissions would peak before 2030.
Both targets will be achieved mainly by reducing the activities and technologies responsible for polluting emissions and implementing decarbonization technologies, including carbon capture and storage (CCS).
Even after the issue of the 14th Five-Year Plan in early 2021, it is presently still not fully clear through which scenarios the targets will be reached. Once the future energy scenarios will at least be roughly given by the Chinese administration, it would be possible to update the present study by applying the developed methodology to the new forecasted scenario.
This study uses the EIA forecasted context, although it would be a depressing scenario to think that energy production from coal will only see a slight decline until 2040 in absolute terms, to try and predict the effect of further reducing this percentage by increasing the PSPs able to foster the VRES penetration into the grid, thus accelerating the phase-out of coal plants.
Based on these values, the target PHS percentage was calculated, which corresponded to about 167, 223, 297, 409, and 520 GW in scenarios 4.5%, 6%, 8%, 11%, and 14%, respectively. Of these, 30.3 GW has already been achieved by 2019 [9].
These target scenarios would be reached annually with the creation of 4.4 GW in the 4.5% scenario, 6.2 GW in the 6% scenario, 8.6 GW in the 8% scenario, 12.2 GW in the 11% scenario, and 15.8 GW in the 14% scenario (Table 3).
Turning to the economic aspect, the implementation costs were calculated based on the Bloomberg NEF data, according to which a 1 GW plant would cost approximately $794 million [58].
Applying this unit cost to the entire forecast and discounting the costs year by year with an estimated discount rate of 8.5% according to EPPA assumptions [73] and an inflation rate in China assumed as the average value from 1995 to 2019 according to the World Bank data [74], we reached an average implementation cost per year for 30 years (from 2020 to 2050) ranging from about $2 billion in the 4.5% scenario to $7.16 billion in the 14% scenario (Table 4).
The social, environmental, and economic benefits of such an implementation were analyzed considering the phase-out of coal-fired power plants for the equivalent GWh/y produced.
The first environmental benefits would start five years after starting the implementation of the first PHS plants due to the time necessary for installation and commissioning. The main benefits would be related to the savings made on purchasing coal and especially CO2-eq emissions produced by coal-fired power plants. These data see a reduction of coal quantities ranging from 5.5 to 10.1 Mt and CO2-eq quantities ranging from 14.4 to 26.5 Mt in relation to the 8% and 14% scenarios, respectively, for each annual target set. These values are cumulative as the plants installed in the new year will add to those of previous years by decreasing the quantities of coal and CO2-eq otherwise produced by coal-fired plants.
All this was then monetized using the forecasted cost of coal per year and the forecasted EU ETS price for CO2-eq, with results showing savings of $355.48 million to $652.29 million for coal and $953.76 million to $1.75 billion for CO2-eq from 2025 in the 8% and 14% scenarios, respectively. The avoided coal and CO2-eq was found to double in 2026, triple in 2027, and so on, with an increasing trend in the forecasted EU ETS price and a decreasing trend in the coal cost. By 2050, this will lead to savings of $6.14 billion to about $11.26 billion for coal and $53.01 billion to $97.42 billion for CO2-eq for the 8% and 14% scenarios, respectively (Table 5 and Table 6).
After summarizing the average terms of these values, the results showed an average saving over 25 years (from 2025 (when the first PHS plants go into operation) to 2050) of $3.72 billion for coal and $23.4 billion for CO2-eq for the 8% scenario and up to $6.83 billion for coal and $42.9 billion for CO2-eq for the 14% PHS implementation scenario.
Because the forecast showed very high figures, it is necessary to also highlight scenarios that are less appealing in terms of implementation but which nevertheless allow considerable benefits from both economic and environmental points of view.
The percentages considered for less appealing scenarios were 4.5% and 6%. The 4.5% scenario showed an average saving over 25 years of $1.91 billion for coal and $12 billion for CO2-eq, while the 6% scenario showed an average saving over 25 years of $2.70 billion for coal and $16.9 billion for CO2-eq.
Table 7 presents an assessment of the total costs and benefits.
EU ETS prices, as well as coal prices, are variable for very obvious financial reasons. Moreover, the implementation costs of PHS installations are subject to variations ranging from geographical and orographic reasons to legislative reasons in various regions of the country as well as the considered discount rate and inflation rate.
The graphs in Figure 8, Figure 9, Figure 10, Figure 11 and Figure 12 show that the sum of the savings obtained from CO2 avoidance in terms of EU ETS and purchased coal owing to progressive implementation of PHS plants by far exceeds the implementation costs of the necessary installations for each of the scenarios considered. It has to be taken into account that the average implementation costs were obtained by forecasting a constant increase in PHS installations each year to reach the 2050 scenario target. The benefits are commensurate to this constant increase. There will be values far below the average for the first years of implementation, but this will then balance and exceed the implementation costs after 2033.

8. Conclusions

This study aimed to highlight how pumped hydroelectricity storage (PHS) implementation could support the penetration of variable renewable energy sources, therefore facilitating the phase-out of coal plants. This action considerably improves on the present scenario, not only regarding pollutants and economics but also providing significant social and functional benefits:
  • The “peak shaving” and “valley filling” of PHS help coal-based stations save fuel, avoid restart, smooth the output, and improve load efficiency. This is one of the system-wide effects of PHS, and it is known as levelling the load curve (LLC). While adjusting the demand–supply balance, PHS reduces the gap between the peak and off-peak demand. This provides thermal/nuclear power plants an “apparent” load curve (improved load curve), which allows them to operate continuously for a long time at stable output, thereby increasing fuel efficiency and decreasing operational stresses.
  • PHS can adapt quickly to load changes and modulate frequency as well as maintain voltage. Therefore, it can just be used as an emergency backup to prevent system collapse.
  • PHS is complementary in balancing the disequilibrium of renewable power generation and regulating the frequency of the grid [75].
We drew on various scientific sources on the subject as well as data from the World Bank to make forecasts on China’s energy needs in the years to come, proposed a development plan, and analyzed already operational situations such as the Zhanghewan Pumped Storage Power Station in Hubei province. The aim was to highlight the results of increased implementation of these systems in an area where hydroelectricity is already widely used.
Renewable power may reduce the security and stability of the power system. Therefore, an effective and economic energy storage method is needed in China [75].
Several plans have been proposed for implementation between now and 2050 to predict long-term costs and benefits, with an estimated economic return around 2035. Implementing scenarios from 8% to 14% of the total capacity in China would be ideal according to a study reported by Zhang Diansheng, Chen Tao, and Yongxing Li [60]. However, it has also emerged that 4.5% and 6% scenarios would result in considerable reduction in CO2-eq and coal emissions in addition to economic return.
In conclusion, as highlighted in the introduction, this article aimed to present the costs and benefits of the installation of a series of PHS plants in China in order to reduce use of coal for electricity as well as CO2 emissions, taking into account the current situation and the IEA and EIA forecasts already mentioned. However, further work should be carried out to analyze the effects of BAT, implementation of smart grids [1], smart metering, energy efficiency policies and action, liberalization of the electricity market, and better integration of RES. The authors will be highly engaged in working on the next steps.
The results of the CBA are based on the electricity scenario in Figure 6, where Chinese coal power production would stay more or less stable in absolute terms until 2050. In fact, the model basically takes into account the business-as-usual scenario in other contexts, such as smart grid and smart metering deployment, RES development, etc., as mentioned above. Therefore, it is important to note that the results may lead China to leave the Paris Agreement. For this reason, we believe that it is necessary to add other modules to this CBA analysis and scenario in order to take into account the deployment of PHS with other policies. Indeed, the deployment of the PHS alone will bring results that can enable China to meet its contribution to the Paris Agreement.

Author Contributions

Conceptualization: P.S. and M.C.L.; methodology: P.S. and M.C.L.; validation: P.S., M.C.L., L.N. and M.D.L.; formal analysis: P.S. and M.C.L.; investigation: P.S., M.C.L., L.N. and M.D.L.; resources: P.S., M.C.L., L.N. and M.D.L.; data curation: P.S., M.C.L., L.N. and M.D.L.; writing—original draft preparation: P.S. and M.C.L.; writing—review and editing, P.S., M.C.L., L.N., and M.D.L.; visualization: P.S., M.C.L., L.N. and M.D.L.; supervision: P.S.; project administration: P.S., L.N. and M.D.L.; funding acquisition: P.S., L.N. and M.D.L. All authors have read and agreed to the published version of the manuscript.

Funding

The work is part of the activities of the “Sustainable Hydropower Use and Integration in China and Europe” (SHUI-ChE) project funded by the European Commission through the Partnership Instrument (PI) under the “Water and Energy Nexus” focus area of the China Europe Water Platform (CEWP), grant number: PI/2017/382-117. The European Commission’s support for the production of this paper does not constitute an endorsement of the contents, which reflects the views of the authors alone, and the Commission cannot be held responsible for any use of the information contained therein.

Institutional Review Board Statement

Not applicable.

Informed Consent Statement

Not applicable.

Data Availability Statement

The data presented in this study are available on request.

Acknowledgments

The authors would like to acknowledge Lohith Amarnath, Alvaro Tabares, Sergio Quintero, Mauro Maltagliati, and Weibin Lin, Director of the Center for the Energy and Industry Economic Research at Beijing Normal University (China). The authors also wish to thank the Solargrid Project for sharing part of the data and information from their supported research.

Conflicts of Interest

The authors declare no conflict of interest.

References

  1. Sospiro, P.; Amarnath, L.; di Nardo, V.; Talluri, G.; Gandoman, F.H. Smart Grid in China, EU, and the US: State of Implementation. Energies 2021, 14, 5637. [Google Scholar] [CrossRef]
  2. Dotzauer, M.; Pfeiffer, D.; Lauer, M.; Pohl, M.; Mauky, E.; Bär, K.; Sonnleitner, M.; Zörner, W.; Hudde, J.; Schwarz, B.; et al. How to measure flexibility—Performance indicators for demand driven power generation from biogas plants. Renew. Energy 2019, 134, 135–146. [Google Scholar] [CrossRef]
  3. Global Wind Report|GWEC. Wind Energy Global Status. Available online: http://www.gwec.net/global-figures/wind-energy-global-status/ (accessed on 2 December 2021).
  4. Statista. Wind Power Curtailment in China 2013–2020. Available online: https://www.statista.com/statistics/973688/china-wind-power-curtailment (accessed on 15 June 2021).
  5. Zhou, Y.; Lu, S. China’s Renewables Curtailment and Coal Assets Risk Map: Research Findings and Map User Guide. Available online: https://data.bloomberglp.com/bnef/sites/14/2017/10/Chinas-Renewable-Curtailment-and-Coal-Assets-Risk-Map-FINAL_2.pdf (accessed on 30 October 2020).
  6. Liang, Y.; Yu, B.; Wang, L. Costs and benefits of renewable energy development in China’s power industry. Renew. Energy 2019, 131, 700–712. [Google Scholar] [CrossRef]
  7. Barbour, E.; Wilson, I.G.; Radcliffe, J.; Ding, Y.; Li, Y. A review of pumped hydro energy storage development in significant international electricity markets. Renew. Sustain. Energy Rev. 2016, 61, 421–432. [Google Scholar] [CrossRef] [Green Version]
  8. Rogeau, A.; Girard, R.; Kariniotakis, G. A generic GIS-based method for small Pumped Hydro Energy Storage (PHES) potential evaluation at large scale. Appl. Energy 2017, 197, 241–253. [Google Scholar] [CrossRef] [Green Version]
  9. IHA: International Hydropower Association. Available online: https://hydropower-assets.s3.eu-west-2.amazonaws.com/publications-docs/2020_hydropower_status_report.pdf (accessed on 2 July 2021).
  10. Cook, O.; Leschke, M. Accelerating Corporate Renewable Energy Engagement in China. Available online: https://resource-solutions.org/wp-content/uploads/2019/11/Accelerating-Corporate-RE-Engagement-in-China.pdf (accessed on 26 April 2021).
  11. Anuta, O.H.; Taylor, P.; Jones, D.; McEntee, T.; Wade, N. An international review of the implications of regulatory and electricity market structures on the emergence of grid scale electricity storage. Renew. Sustain. Energy Rev. 2014, 38, 489–508. [Google Scholar] [CrossRef] [Green Version]
  12. Masiello, R.D.; Roberts, B.; Sloan, T. Business Models for Deploying and Operating Energy Storage and Risk Mitigation Aspects. Proc. IEEE. 2014, 102, 1052–1064. [Google Scholar] [CrossRef]
  13. Kapsali, M.; Kaldellis, J. Combining hydro and variable wind power generation by means of pumped-storage under economically viable terms. Appl. Energy 2010, 87, 3475–3485. [Google Scholar] [CrossRef]
  14. Nikolaidis, P.; Poullikkas, A. Cost metrics of electrical energy storage technologies in potential power system operations. Sustain. Energy Technol. Assess. 2018, 25, 43–59. [Google Scholar] [CrossRef]
  15. Ming, Z.; Kun, Z.; Daoxin, L. Overall review of pumped-hydro energy storage in China: Status quo, operation mechanism and policy barriers. Renew. Sustain. Energy Rev. 2013, 17, 35–43. [Google Scholar] [CrossRef]
  16. Welisch, M.; Ortner, A.; Resch, G. Assessment of RES technology market values and the merit-order effect—an econometric multi-country analysis. Energy Environ. 2016, 27, 105–121. [Google Scholar] [CrossRef] [Green Version]
  17. Connolly, D.; Lund, H.; Finn, P.; Mathiesen, B.; Leahy, M. Practical operation strategies for pumped hydroelectric energy storage (PHES) utilising electricity price arbitrage. Energy Policy 2011, 39, 4189–4196. [Google Scholar] [CrossRef] [Green Version]
  18. Zhang, F.; Xu, Z.; Jiao, B.; Feng, J. Study on Pricing Mechanism of Pumped Hydro Energy Storage (PHES) under China’s Electricity Tariff Reform. Available online: https://www.e3s-conferences.org/articles/e3sconf/abs/2018/13/e3sconf_icemee2018_04016/e3sconf_icemee2018_04016.html (accessed on 18 November 2020).
  19. Gaudard, L.; Romerio, F. The future of hydropower in Europe: Interconnecting climate, markets and policies. Environ. Sci. Policy 2014, 37, 172–181. [Google Scholar] [CrossRef]
  20. eStorage. Overview of Potential Locations for New Pumped Storage Plants in EU 15, Switzerland and Norway. Available online: https://www.estorage-project.eu/wp-content/uploads/2013/06/eStorage_D4.2-Overview-of-potential-locations-for-new-variable-PSP-in-Europe.pdf (accessed on 15 September 2020).
  21. eStorage. eStorage Study Shows Huge Potential Capacity of Exploitable Pumped Hydro Energy Storage Sites in Europe. Available online: https://www.prnewswire.com/news-releases/estorage-study-shows-huge-potential-capacity-of-exploitable-pumped-hydro-energy-storage-sites-in-europe-577386191.html (accessed on 15 September 2020).
  22. Margeta, J.; Glasnovic, Z. Feasibility of the green energy production by hybrid solar + hydro power system in Europe and similar climate areas. Renew. Sustain. Energy Rev. 2010, 14, 1580–1590. [Google Scholar] [CrossRef]
  23. Rehman, S.; Al-Hadhrami, L.M.; Alam, M. Pumped hydro energy storage system: A technological review. Renew. Sustain. Energy Rev. 2015, 44, 586–598. [Google Scholar] [CrossRef]
  24. Anagnostopoulos, J.S.; Papantonis, D.E. Pumping station design for a pumped-storage wind-hydro power plant. Energy Convers. Manag. 2007, 48, 3009–3017. [Google Scholar] [CrossRef]
  25. Javanbakht, P.; Mohagheghi, S.; Simoes, M.G. Transient performance analysis of a small-scale PV-PHS power plant fed by a SVPWM drive applied for a distribution system. In Proceedings of the 2013 IEEE Energy Conversion Congress and Exposition, Denver, CO, USA, 15–19 September 2013; pp. 4532–4539. [Google Scholar] [CrossRef]
  26. De Negri, J.F.; Pezzutto, S.; Gantioler, S.; Moser, D.; Sparber, W. A Comprehensive Analysis of Public and Private Funding for Photovoltaics Research and Development in the European Union, Norway, and Turkey. Energies 2020, 13, 2743. [Google Scholar] [CrossRef]
  27. Carolus, J.F.; Hanley, N.; Olsen, S.; Pedersen, S.M. A Bottom-up Approach to Environmental Cost-Benefit Analysis. Ecol. Econ. 2018, 152, 282–295. [Google Scholar] [CrossRef] [Green Version]
  28. Snyder, B.; Kaiser, M.J. Ecological and economic cost-benefit analysis of offshore wind energy. Renew. Energy 2009, 34, 1567–1578. [Google Scholar] [CrossRef]
  29. Krarti, M.; Dubey, K. Review analysis of economic and environmental benefits of improving energy efficiency for UAE building stock. Renew. Sustain. Energy Rev. 2018, 82, 14–24. [Google Scholar] [CrossRef]
  30. Nurmi, V.; Ahtiainen, H. Distributional Weights in Environmental Valuation and Cost-benefit Analysis: Theory and Practice. Ecol. Econ. 2018, 150, 217–228. [Google Scholar] [CrossRef]
  31. Pikas, E.; Kurnitski, J.; Thalfeldt, M.; Koskela, L. Cost-benefit analysis of nZEB energy efficiency strategies with on-site photovoltaic generation. Energy 2017, 128, 291–301. [Google Scholar] [CrossRef]
  32. Sardi, J.; Mithulananthan, N.; Gallagher, M.; Hung, D.Q. Multiple community energy storage planning in distribution networks using a cost-benefit analysis. Appl. Energy 2017, 190, 453–463. [Google Scholar] [CrossRef]
  33. Judd, S.; Al Momani, F.; Znad, H.; Al Ketife, A. The cost benefit of algal technology for combined CO2 mitigation and nutrient abatement. Renew. Sustain. Energy Rev. 2017, 71, 379–387. [Google Scholar] [CrossRef] [Green Version]
  34. Dobraja, K.; Barisa, A.; Rosa, M. Cost-benefit Analysis of Integrated Approach of Waste and Energy Management. Energy Procedia 2016, 95, 104–111. [Google Scholar] [CrossRef] [Green Version]
  35. Johansson, P.-O. On lessons from energy and environmental cost–benefit analysis. Technol. Forecast. Soc. Chang. 2016, 112, 20–25. [Google Scholar] [CrossRef]
  36. Reinoso, C.S.; de Paula, M.; Buitrago, R. Cost–benefit analysis of a photovoltaic power plant. Int. J. Hydrogen Energy 2014, 39, 8708–8711. [Google Scholar] [CrossRef]
  37. Azevedo, I.; Glachant, J.M.; He, X.; Olmos, L. Cost Benefit Analysis in the Context of the Energy Infrastructure Package; 2013. Available online: https://op.europa.eu/it/publication-detail/-/publication/b5d3ecd3-4da4-42d6-b79d-f177c631d9d6/language-en (accessed on 23 November 2021).
  38. Hanley, N.; Spash, C. Cost-Benefit Analysis and the Environment. Environ. Values 1996, 5, 182–183. [Google Scholar]
  39. Bollen, J.; van der Zwaan, B.; Brink, C.; Eerens, H. Local air pollution and global climate change: A combined cost-benefit analysis. Resour. Energy Econ. 2009, 31, 161–181. [Google Scholar] [CrossRef] [Green Version]
  40. Pickin, J. Representations of environmental concerns in cost–benefit analyses of solid waste recycling. Resour. Conserv. Recycl. 2008, 53, 79–85. [Google Scholar] [CrossRef]
  41. Clinch, J. Cost–Benefit Analysis Applied to Energy. Encycl. Energy 2004, 715–725. [Google Scholar] [CrossRef]
  42. Clinch, J.; Healy, J.D. Cost-benefit analysis of domestic energy efficiency. Energy Policy 2001, 29, 113–124. [Google Scholar] [CrossRef]
  43. Liu, Y.; Liu, T.; Ye, S.; Liu, Y. Cost-benefit analysis for Energy Efficiency Retrofit of existing buildings: A case study in China. J. Clean. Prod. 2018, 177, 493–506. [Google Scholar] [CrossRef]
  44. Liu, Y.-H.; Liao, W.-Y.; Li, L.; Huang, Y.-T.; Xu, W.-J.; Zeng, X.-L. Reduction measures for air pollutants and greenhouse gas in the transportation sector: A cost-benefit analysis. J. Clean. Prod. 2019, 207, 1023–1032. [Google Scholar] [CrossRef]
  45. Wang, Y.; Geng, S.; Zhao, P.; Du, H.; He, Y.; Crittenden, J. Cost–benefit analysis of GHG emission reduction in waste to energy projects of China under clean development mechanism. Resour. Conserv. Recycl. 2016, 109, 90–95. [Google Scholar] [CrossRef]
  46. Gao, J.; Yuan, Z.; Liu, X.; Xia, X.; Huang, X.; Dong, Z. Improving air pollution control policy in China—A perspective based on cost–benefit analysis. Sci. Total. Environ. 2016, 543, 307–314. [Google Scholar] [CrossRef] [PubMed]
  47. Wang, X.; Lu, M.; Mao, W.; Ouyang, J.; Zhou, B.; Yang, Y. Improving benefit-cost analysis to overcome financing difficulties in promoting energy-efficient renovation of existing residential buildings in China. Appl. Energy 2015, 141, 119–130. [Google Scholar] [CrossRef]
  48. Shih, Y.-H.; Tseng, C.-H. Cost-benefit analysis of sustainable energy development using life-cycle co-benefits assessment and the system dynamics approach. Appl. Energy 2014, 119, 57–66. [Google Scholar] [CrossRef]
  49. Liu, Y.; Guo, X.; Hu, F. Cost-benefit analysis on green building energy efficiency technology application: A case in China. Energy Build. 2014, 82, 37–46. [Google Scholar] [CrossRef]
  50. Rosenow, J.; Bayer, E. Costs and benefits of Energy Efficiency Obligations: A review of European programmes. Energy Policy 2017, 107, 53–62. [Google Scholar] [CrossRef]
  51. Beria, P.; Munari, F. “I metodi di valutazione dei costi ambientali del trasporto all’interno delle analisi costi-benefici” from Cambiamenti climatici e trasporti. Un approccio interdisciplinare. Aracne 2017, 1, 39–47. [Google Scholar]
  52. Barbieri, C.; Bruno, F.; Mussaif, N. Analisi Costi-Benefici del Modello di Gestione Ambientale ECOCluster. Available online: https://pdc.minambiente.it/sites/default/files/progetti/azione22_analisi.costi.benefici.pdf (accessed on 29 November 2020).
  53. European Association for Storage of Energy. EASE Input to the Methodology Defining a Cost-Benefit Analysis for Energy Storage. Available online: https://ease-storage.eu/wp-content/uploads/2015/08/EASE-input-to-the-methodology-defining-a-CBAnalysis-ES_2013.04.26-final1.pdf (accessed on 18 March 2021).
  54. Brocco, M.; Calò, E.; Lucci, A.; Pasquali, M. Analisi Costi e Benefici Sull’introduzione di Sistemi di Accumulo ad Idrogeno e Flow Battery Nella Rete Elettrica Italiana. Available online: https://www.enea.it/it/Ricerca_sviluppo/documenti/ricerca-di-sistema-elettrico/accumulo/2012/rds-2013-255.pdf (accessed on 4 May 2021).
  55. Diakoulaki, D.; Karangelis, F. Multi-criteria decision analysis and cost–benefit analysis of alternative scenarios for the power generation sector in Greece. Renew. Sustain. Energy Rev. 2007, 11, 716–727. [Google Scholar] [CrossRef]
  56. Alberini, A.; Longo, A.; Rosato, P.; Zanatta, V. II valore di non uso nell’analisi costi benefici della salvaguardia ambientale. Aestimum 2009, 43, 1–24. [Google Scholar] [CrossRef]
  57. Asian Development Bank. Hebei Zhanghewan Pumped Storage Project. Available online: https://www.adb.org/projects/documents/hebei-zhanghewan-pumped-storage-project-seia (accessed on 16 August 2021).
  58. L’Ecluse, C.; Frith, J.; Pumped Hydro: A Primer. BloombergNEF 2021. Available online: https://genexpower.com.au/wp-content/uploads/2021/10/pumped_hydro_a_primer.pdf (accessed on 11 October 2021).
  59. China Energy Portal. Available online: https://chinaenergyportal.org/en/2018-electricity-other-energy-statistics/ (accessed on 16 August 2020).
  60. Zhang, D.; Chen, T.; Li, Y. Survey on Pumped Storage Power Stations in Japan. Available online: https://caod.oriprobe.com/articles/23590926/Survey_on_Pumped_Storage_Power_Stations_in_Japan.htm (accessed on 15 November 2019).
  61. Rogner, M.; Law, S. Pumped Storage Tracking Tool. Available online: https://www.hydropower.org/hydropower-pumped-storage-tool (accessed on 24 June 2019).
  62. ENTSO-E Transparency Platform. Available online: https://transparency.entsoe.eu/ (accessed on 18 August 2021).
  63. IEA: International Energy Agency. Available online: https://www.iea.org/reports/world-energy-outlook-2017-china (accessed on 25 October 2020).
  64. The World Bank. Available online: https://data.worldbank.org/country/china (accessed on 19 April 2020).
  65. OECD Organisation for Economic Co-operation and Development. China GDP Growth Forecast 2019–2024 and up to 2060, Data and Charts. Available online: https://knoema.com/loqqwx/china-gdp-growth-forecast-2019-2024-and-up-to-2060-data-and-charts (accessed on 12 September 2020).
  66. U.S. Energy Information Administration. Chinese Coal-Fired Electricity Generation Expected to Flatten as Mix Shifts to Renewables. Available online: https://www.eia.gov/todayinenergy/detail.php?id=33092 (accessed on 25 September 2020).
  67. IEA International Energy Agency/OECD Organisation for Economic Co-operation and Development. Electricity Production from Coal Sources (% of Total)—China. Available online: https://data.worldbank.org/indicator/EG.ELC.COAL.ZS?locations=CN (accessed on 19 September 2020).
  68. World Nuclear Association. Heat Values of Various Fuels. Available online: https://www.world-nuclear.org/information-library/facts-and-figures/heat-values-of-various-fuels.aspx (accessed on 7 March 2021).
  69. Power. Who Has the World’s Most Efficient Coal Power Plant Fleet? Available online: https://www.powermag.com/who-has-the-worlds-most-efficient-coal-power-plant-fleet/ (accessed on 10 April 2021).
  70. Jingjing, J.; Bin, Y.; Xiaoming, M. The Impact of International Greenhouse Gas Emission Constraints on Coal-Fired Power Plant in China-Based on LCAModel. In Proceedings of the 2013 Fourth International Conference on Digital Manufacturing & Automation, Shinan, China, 29–30 June 2013; pp. 1468–1472. [Google Scholar] [CrossRef]
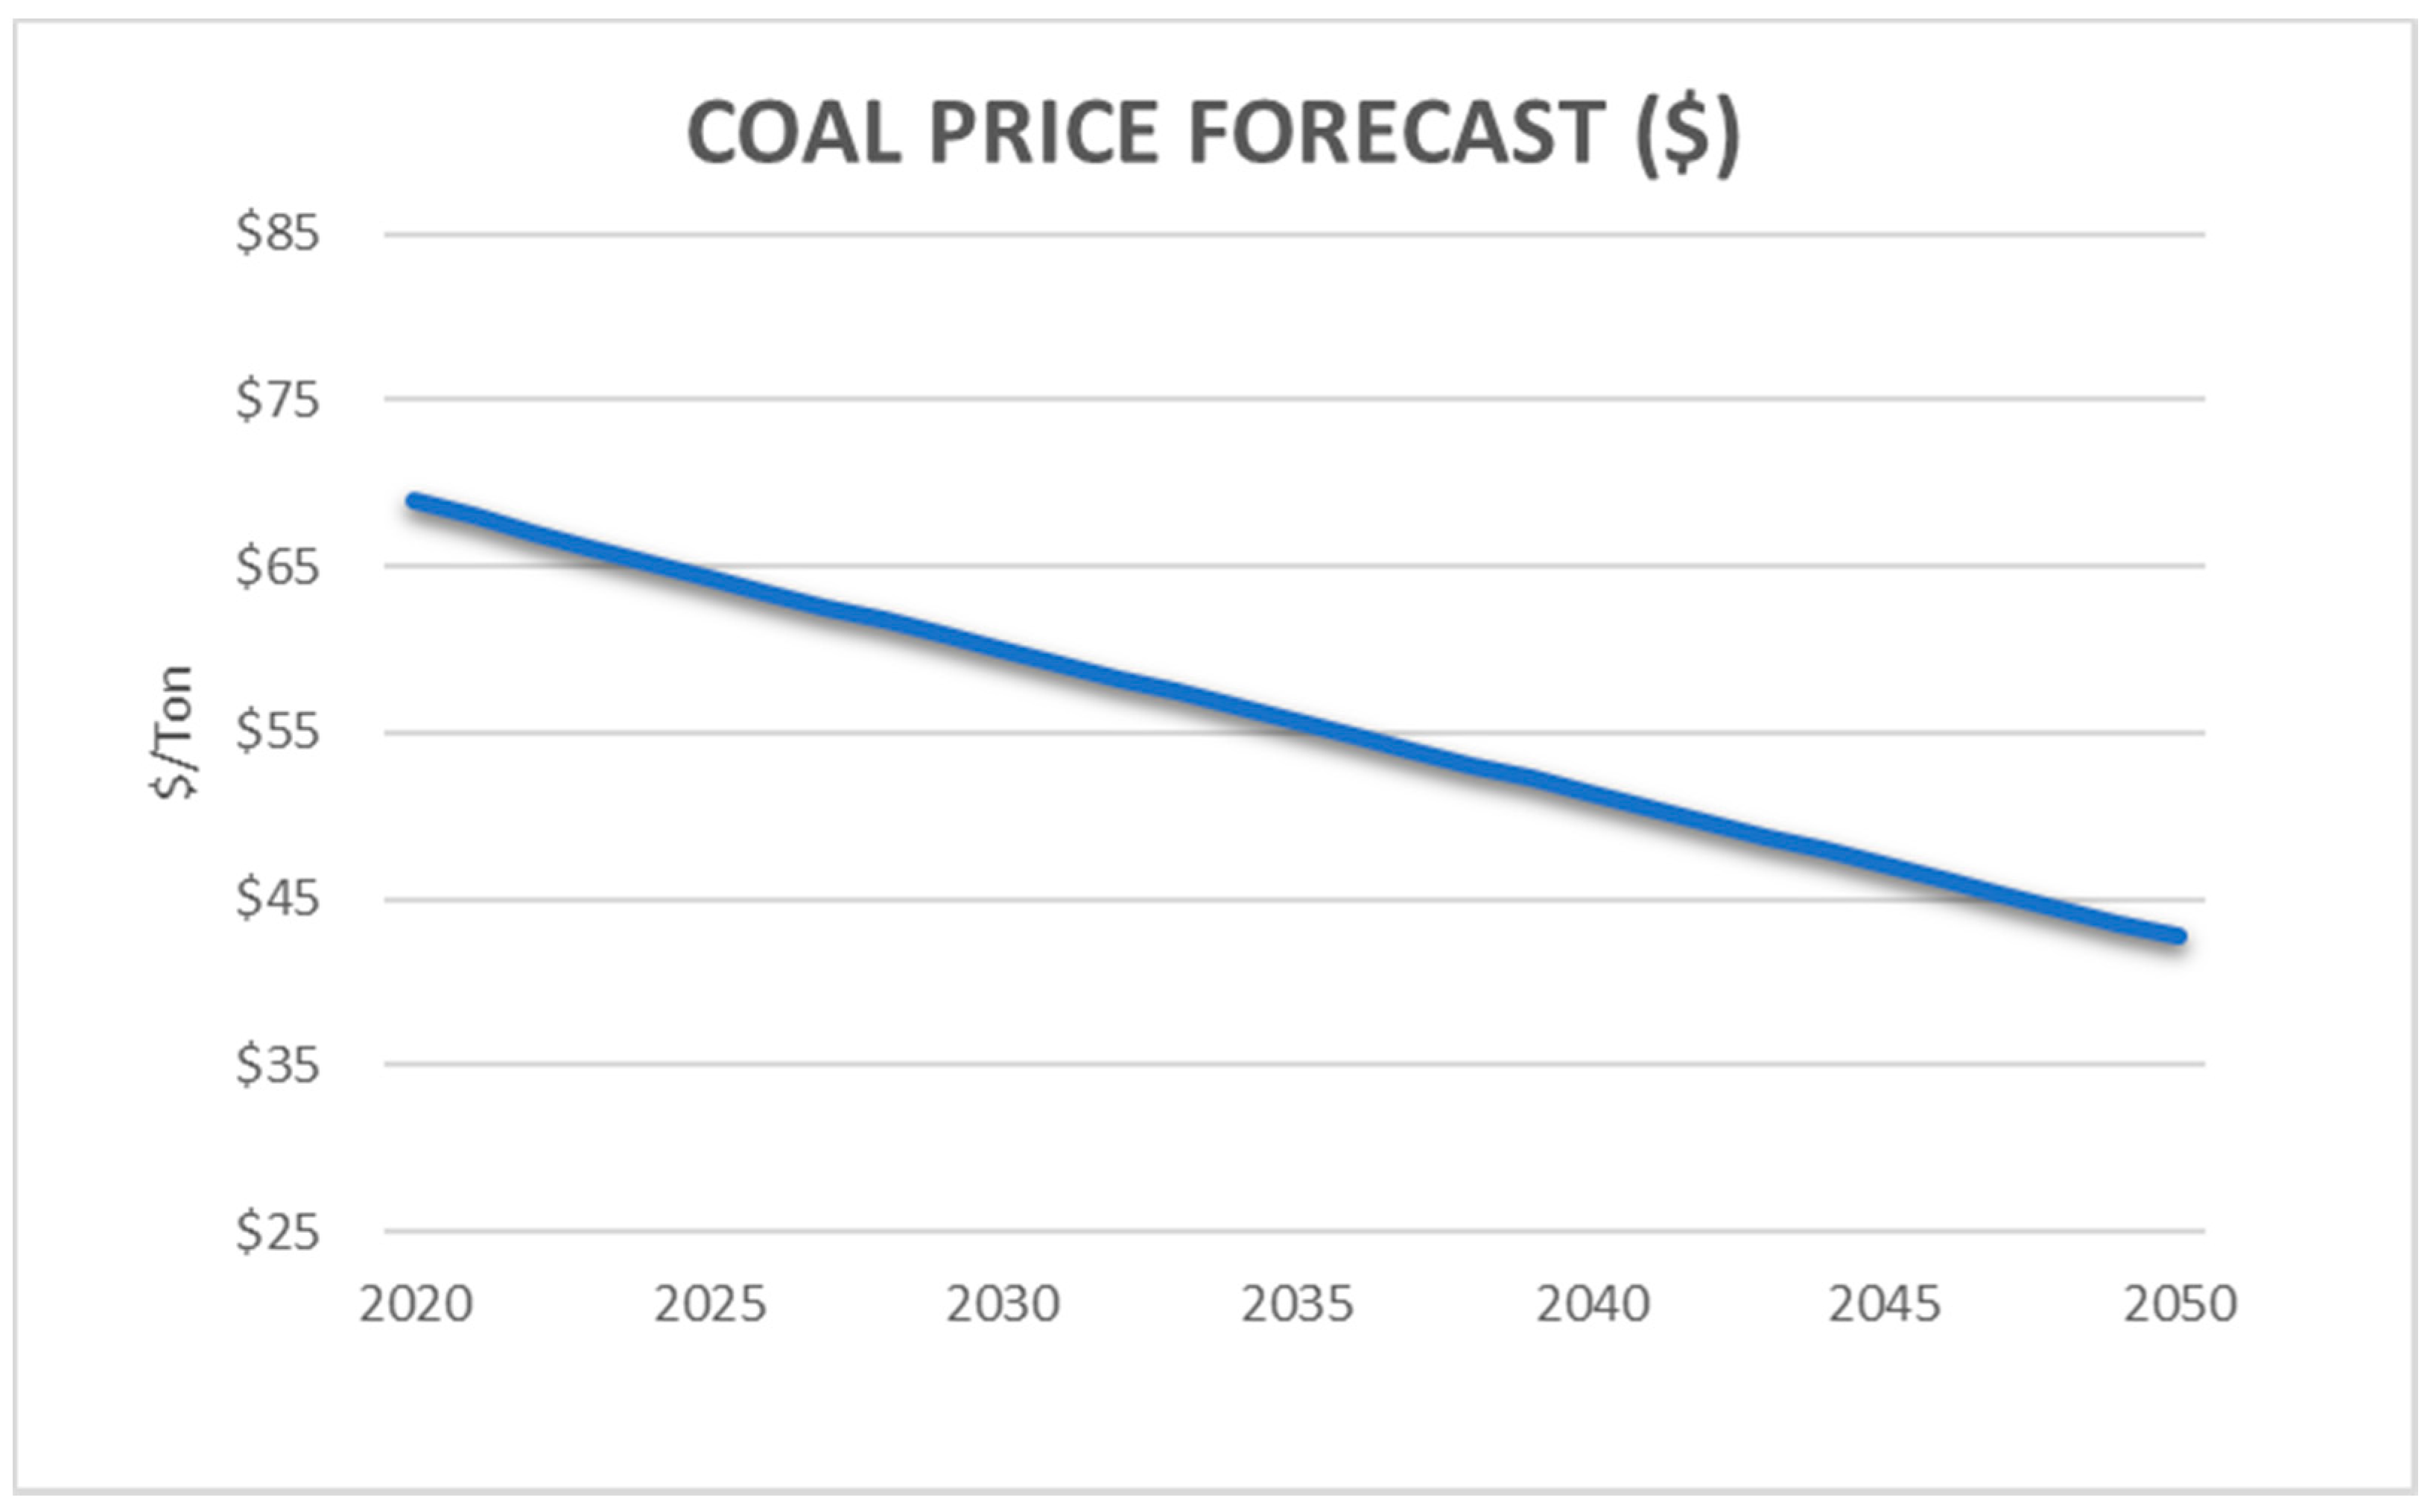
  71. The World Bank. World Bank Commodities Price Forecast (Nominal US Dollars). Available online: http://pubdocs.worldbank.org/en/633541587395091108/CMO-April-2020-Forecasts.pdf (accessed on 5 September 2021).
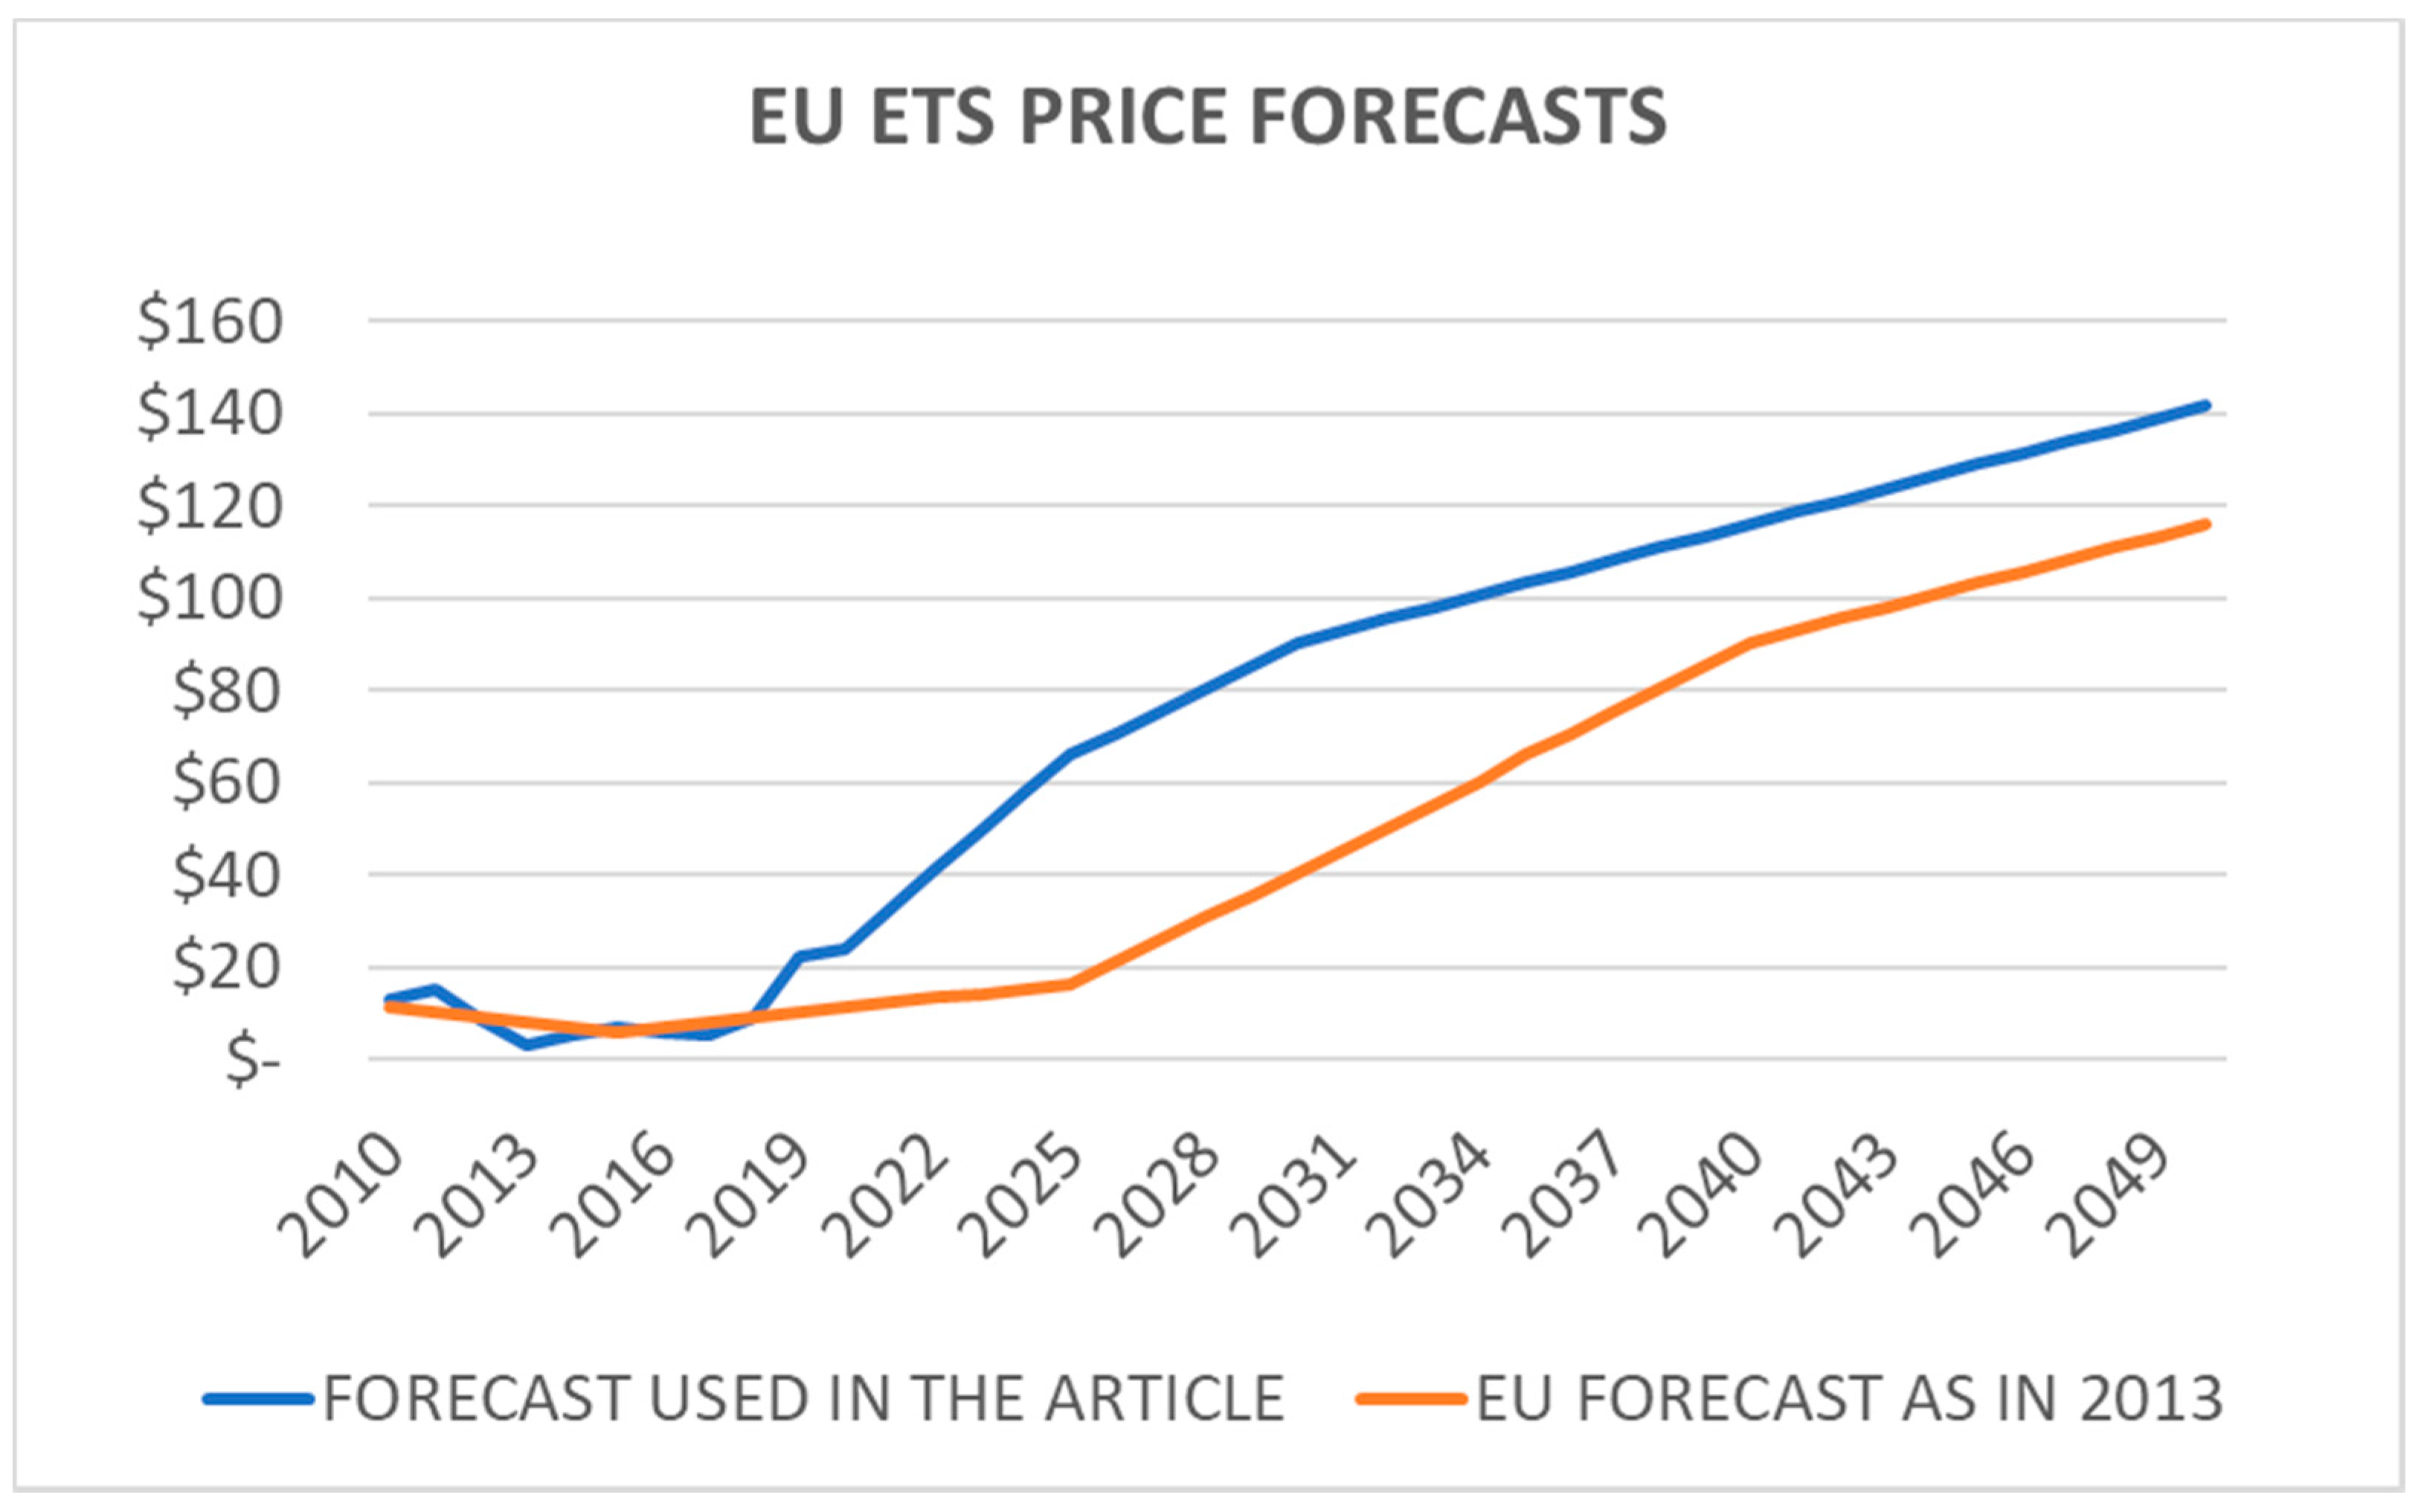
  72. European Commission. Trends to 2050. Available online: https://ec.europa.eu/energy/sites/ener/files/documents/trends_to_2050_update_2013.pdf (accessed on 30 September 2021).
  73. Zhang, D.; Paltsev, S. The Future of Natural Gas in China: Effects of Pricing Reform and Climate Policy. MIT Joint Program on the Science and Policy of Global Change 2016. Available online: https://dspace.mit.edu/bitstream/handle/1721.1/103778/MITJPSPGC_Rpt294.pdf?sequence=1&isAllowed=y (accessed on 18 August 2021).
  74. The World Bank. Inflation, Consumer Prices (Annual %). Available online: https://data.worldbank.org/indicator/FP.CPI.TOTL.ZG (accessed on 22 May 2021).
  75. Zhu, B.S.; Ma, Z. Development and Prospect of the Pumped Hydro Energy Stations in China. J. Physics Conf. Ser. 2019, 1369, 012018. [Google Scholar] [CrossRef]
Figure 1. Project map. The main components and the installation area of the Zhanghewan PHS Project [57].
Energies 14 08322 g001
Figure 2. Coal price forecast 2020–2050.
Energies 14 08322 g002
Figure 3. Projection of the ETS price from “EU Energy, Transport and GHG emissions: Trends to 2050” publication compared with the new forecast.
Energies 14 08322 g003
Figure 4. GDP and electricity production from 1971 to 2050 (historical data and forecast) in China.
Energies 14 08322 g004
Figure 5. Total capacity in China from 2000 to 2050 (historical data and forecast).
Energies 14 08322 g005
Figure 6. Annual electricity generation in China. Source: U.S. Energy Information Administration, International Energy Outlook (Sept 2017) [66].
Energies 14 08322 g006
Figure 7. Coal usage according to EIA forecast.
Energies 14 08322 g007
Figure 8. Payback period in the 4.5% scenario.
Energies 14 08322 g008
Figure 9. Payback period in the 6% scenario.
Energies 14 08322 g009
Figure 10. Payback period in the 8% scenario.
Energies 14 08322 g010
Figure 11. Payback period in the 11% scenario.
Energies 14 08322 g011
Figure 12. Payback period in the 14% scenario.
Energies 14 08322 g012
Table 1. Total cost for 1 GW capacity installed in a PHS plant (assuming Zhanghewan costs), assuming the average from 1 April 2017 to 12 June 2019 as the change value.
Installed Capacity 1 GW Zhanghewan PHS Plant
CostsValue
Pumped storage powerplantsTransmission line$422,100,000.00
$16,500,000.00
Rural electrification$135,500,000.00
Closure of coal-fired power plants$1,600,000.00
Afforestation$10,600,000.00
Institutional strengthening$1,400,000.00
Irrigation$12,900,000.00
Subtotal$600,600,000.00
Contingencies$117,100,000.00
Interest and other charges during construction$57,100,000.00
TOTAL$774,800,000.00
TOTAL (€)€667,645,160.00
Table 2. Pumped storage installed capacity at global and Chinese levels.
DataGW
Global pumped storage installed capacity 2019158
China’s pumped storage installed capacity 201930.3
Table 3. Main assumption per scenario. PHS capacity needed in order to reach the goals by 2050.
ScenarioActual
Capacity
Forecasted Capacity in 2050Annual Capacity to Be Installed
4.5% 30.3 GW167 GW4.4 GW/y
6% 30.3 GW223 GW6.2 GW/y
8% 30.3 GW297 GW8.6 GW/y
11% 30.3 GW409 GW12.2 GW/y
14% 30.3 GW520 GW15.8 GW/y
Table 4. Annual implementation costs, including O&M costs, for years 2020, 2030, 2040, and 2050.
Scheme 4.4.5%6%8%11%14%
2020$3.51 bn$4.94 bn$6.85 bn$9.71 bn$12.56 bn
2030$2.28 bn$3.21 bn$4.45 bn$6.31 bn$8.16 bn
2040$1.56 bn$2.19 bn$3.04 bn$4.30 bn$5.57 bn
2050$1.04 bn$1.46 bn$2.03 bn$2.88 bn$3.72 bn
Avg. Cost Per Year$2.00 bn$2.82 bn$3.90 bn$5.53 bn$7.16 bn
Table 5. Avoided coal cost per year based on coal price forecast and quantity expected to be avoided according to each scenario for 2025, 2035, 2045, and 2050.
Scenario4.5%6%8%11%14%
2025$0.18 bn$0.26 bn$0.36 bn$0.50 bn$0.65 bn
2035$1.74 bn$2.44 bn$3.38 bn$4.80 bn$6.21 bn
2045$2.80 bn$3.94 bn$5.46 bn$7.74 bn$10.02 bn
2050$3.09 bn$4.43 bn$6.14 bn$8.70 bn$11.26 bn
Avg. Cost Per Year$1.91 bn$2.70 bn$3.72 bn$5.28 bn$6.83 bn
Table 6. CO2-eq avoided per year based on EU ETS price forecast and quantity expected to be avoided according to each scenario for 2025, 2035, 2045, and 2050.
Scenario4.5%6%8%11%14%
2025$0.49 B$0.69 B$0.95 B$1.35 B$1.75 B
2035$8.4 B$11.82 B$16.38 B$23.22 B$30.06 B
2045$20.02 B$28.16 B$39.02 B$55.32 B$71.61 B
2050$27.23 B$38.31 B$53.09 B$75.26 B$97.42 B
Avg. Cost Per Year$11.99 B$16.87 B$23.37 B$33.13 B$42.89 B
Table 7. Implementation cost of PHS plants compared with coal avoided and EU ETS benefits.
ScenarioCoal Benefit
(Avg per Year)
CO2-Eq Benefit
(Avg per Year)
Implementation Cost (Avg per Year)
4.5%$1.91 B$11.99 B$2.00 B
6%$2.69 B$16.87 B$2.82 B
8%$3.72 B$23.37 B$3.9 B
11%$5.28 B$33.13 B$5.53 B
14%$6.83 B$42.89 B$7.16 B
Publisher’s Note: MDPI stays neutral with regard to jurisdictional claims in published maps and institutional affiliations.

