Article

Characteristics of Viscoelastic-Surfactant-Induced Wettability Alteration in Porous Media

1
State Key Laboratory of Oil and Gas Reservoir Geology and Exploitation (SWPU), Chengdu 610500, China
2
School of Petroleum and Natural Gas Engineering, Southwest Petroleum University, Chengdu 610500, China
3
Department of Petroleum Engineering, Kazan Federal University, 420008 Kazan, Russia
4
Petroleum Exploration and Production Research Institute, Sinopec Southwest Branch Company, Chengdu 610041, China
*
Authors to whom correspondence should be addressed.
Energies 2021, 14(24), 8454; https://doi.org/10.3390/en14248454
Submission received: 31 October 2021 / Revised: 3 December 2021 / Accepted: 9 December 2021 / Published: 14 December 2021

Abstract

:
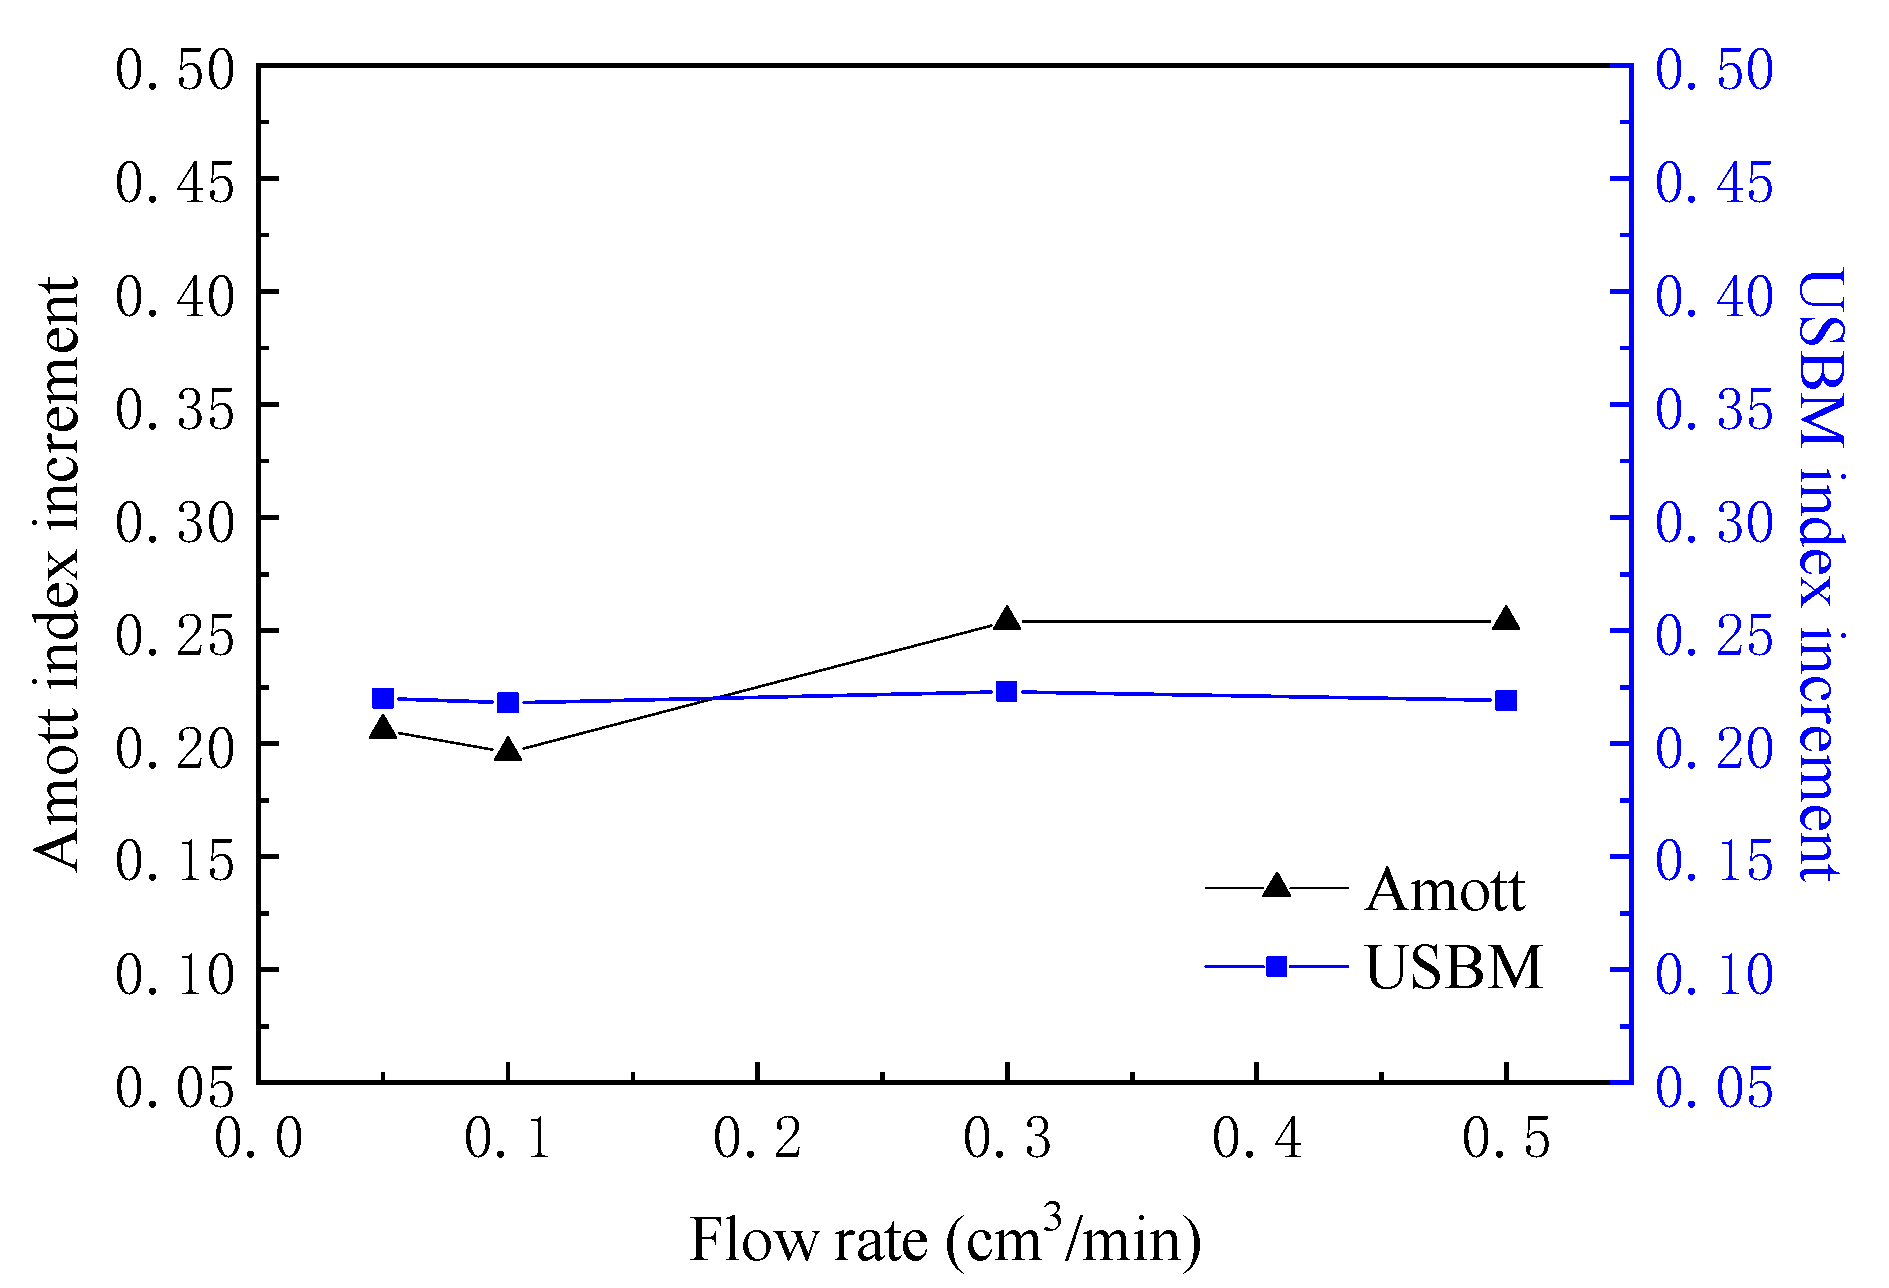
Wettability alteration is one of the most important mechanisms of surfactant flooding. In this work, the combined Amott/USBM (United States Bureau of Mines) method was applied to study the average wettability alteration of initially neutral cores after viscoelastic-surfactant (VES) filtration. The effects of static aging, dynamic aging, VES concentration, filtration flow rate, and pore radius on the alteration of a core’s average wettability were studied. The wettability-alteration trends measured by Amott and USBM were consistent, demonstrating that the overall hydrophilicity of the core was enhanced after VES filtration. The wettability alterations of the core brought about by dynamic aging were more significant than by static aging. The viscoelastic properties of the VES played an important role in altering the wettability. In addition, the ability of the VES to affect the core’s wettability was significantly enhanced when the VES concentration was increased, which was beneficial in increasing VES adsorption on the pore-wall surface, thus altering the overall wettability of the core. Increasing filtration flow rates can destroy those high-viscosity VES aggregates via the higher shear rate. A higher retention of VES makes the core more hydrophilic. The difference in the wettability of cores with different pore radius after VES filtration was not significant. The alteration of average wettability caused by VES in porous media provides a new vision for studying the EOR mechanism of VES.

1. Introduction

The wettability of rock is considered to be one of the most important parameters affecting the efficiency of surfactant flooding [1]. Enhanced oil recovery (EOR) can be achieved by filtrating a low-concentration surfactant solution to alter the reservoir wettability to be more hydrophilic [2], which can affect residual oil saturation and distribution in pores [3]. Wettability alteration of rock is affected by rock minerals, reservoir fluid properties, and saturation history [4].
The wettability of rock can be determined qualitatively and quantitatively [3,5,6,7,8]. Methods for qualitatively measuring wettability include the visual, imbibition, relative-permeability, capillary-pressure, and flotation methods; and logging (resistivity). Methods for quantitatively measuring wettability include the wetting-angle, Amott, Amott-Harvey, and USBM methods. The contact-angle test has a relatively high uncertainty on a quartz plate, and the results of multiple measurements on the same plate may vary greatly [9]. The contact angle measured in pores varies greatly from values measured on a flat surface [10], therefore, it is not suitable for studying the average wettability of a whole porous-media-like core. Although the imbibition test is a qualitative method for determining wettability, it is often used for quantitative testing of wettability. In a water-wet oil/water/rock system, during the spontaneous-imbibition process, water is the displacement fluid and oil is the displaced fluid [11]. Capillary pressure is the most important factor that affects imbibition rate [11]. Bobek used the imbibition method to measure core wettability, and results showed that core-treatment techniques could cause significant alterations in core wettability [12].
The Amott and USBM methods, as well as their improved methods, are based on the imbibition test, which is mainly used to determine the average wettability of core samples [5]. The Amott method must measure the amount of both spontaneous and forced imbibition, and Julius proposed a quantitative formula of the Amott method for calculation of the wettability index [13]. The results obtained by the Amott-Harvey method show that static-aging wettability alteration of a finite volume of crude oil is not as significant as for the dynamic-aging method. For a short period of aging (72 h or less), static aging and dynamic aging have a similar wettability alteration, while dynamic aging has a greater alteration in wettability over long-term aging (over 12 days) [14]. Aspenes combined the NMR and the Amott method to test the longitudinal and radial wettability distributions of long cores, and evaluated wettability stability by measuring the wettability of the core before, and after, immersion [15]. In addition, a small-scale wettability distribution within the core could be obtained based on information from the in situ saturation distribution in the Amott test [16]. A limitation of the Amott method is that it is insensitive when wettability is near-neutral [5]. Compared with the Amott method, the USBM method is more sensitive to near-neutral wettability [3].
Recently, more attention has been paid on wettability alteration and its effect on oil recovery using surfactants. Wu studied the effect of wettability on the flow of nano-water in pores and established a mathematical model to characterize the flow of nano-water in tight reservoirs [17]. Karimi showed that the application of nanofluid can significantly alter the rock wettability from strongly oleophilic to strongly hydrophilic using the contact-angle method [18]. Among three types of surfactants (cationic, anionic, and nonionic), cationic surfactant CTAB had the best effect on the wettability alteration of oil-wet sandstone surfaces [15]. The aggregates formed by TX-100 and CTAB increased their adsorption on the oil-wet sandstone surface [19]. Das proposed a model which included “coating” and “sweeping” effects to explain the wettability-alteration mechanism between a fluid–rock interface [20]. The flooding experiments indicated that water-flooding-recovery efficiency could be the highest under the condition of neutral wetting [21]. It was also shown that heavy oil recovery by surfactant flooding under hydrophilic conditions was higher than that under oil-wet conditions [1].
Viscoelastic surfactants (VES) have been widely applied in drilling, acidification, fracturing, and other fields [22]. Some VES for EOR have been recently developed [23,24]. Previous laboratory studies showed that VES flooding has, simultaneously, washing-oil and mobility-control abilities. It can yield additional oil recovery of 20–25% after water flooding [24,25,26]. It was also demonstrated that a VES solution can alter the wettability of rock [27]. VES has different adsorption characteristics in different rock mineral components [28], but the effect on rock wettability is not clear. The filtration experiments of VES solutions in sandstone and carbonate rock show that oil-displacement efficiency varies significantly depending on wettability [25].
Alteration of average reservoir wettabilities during surfactant flooding should be emphasized in research. The effect of VES on the overall average wettability of porous media will provide a new perspective for EOR (Enhanced Oil Recovery). In this work, the core-saturation-aging method was used to simulate the adsorption of a VES in pore-wall surfaces, and its wettability-alteration ability. The combined Amott/USBM method was used to quantitatively characterize the average wettability of the whole porous media, before and after VES filtration in cores, and study the effect of different factors on the trend of wettability alteration.

2. Theory

From the oil-displacement point of view, it is important to understand the alterations in the average wettability of reservoir rock after surfactant injection. Donaldson proposed the USBM method to measure average wettability [29]. Sharma and Wunderlich proposed an improved, combined Amott/USBM method [30], which could simultaneously measure the Amott and USBM indexes in one experiment. Torsaeter used the combined Amott/USBM method to measure core wettability, and the results showed that this combined method was better than either the single Amott or USBM method [31]. The measurements using the combined Amott/USBM method include six steps [30], which are as follows:
  • Step 1. Core sample 100% saturated (aged) with brine (or aqueous phase);
  • Step 2. Centrifugal oil displacing brine (or aqueous phase);
  • Step 3. Spontaneous imbibition of brine (or aqueous phase) in water imbibition meter;
  • Step 4. Centrifugal brine (or aqueous phase) displacing oil;
  • Step 5. Spontaneous imbibition of oil in oil imbibition meter;
  • Step 6. Centrifugal oil displacing brine (or aqueous phase).
When measuring initial wettability, simulated reservoir brine is used to age the core. When measuring the effect of the VES, the aqueous phase is the VES solution. All the measurement steps mentioned above are shown in Figure 1.
In Figure 1, the corresponding area (dotted line area A 1 and A 2 ) of oil and brine (or aqueous-phase) displacing curves were applied to calculate the USBM value, while the spontaneous-imbibition volume, and the total volumes of brine (or aqueous-phase) and oil displacing, were used to calculate the Amott index. The advantage of this method is that it takes the alteration of saturation into account when zero capillary pressure occurs. Additionally, the system can be determined to be unevenly wetted. The relevant calculation formulas are as follows [3,30,31]:
I w = Q w 1 Q w 1 + Q w 2
where I w is the water displacement ratio;   Q w 1 is the volume of oil displaced by spontaneous imbibition of water; Q w 2 is the volume of oil displaced in the centrifuge.
I o = Q o 1 Q o 1 + Q o 2
where I o the is the oil-displacement ratio; Q o 1 the is volume of water displaced by spontaneous imbibition of oil; Q o 2 is the volume of water displaced in the centrifuge.
I = I w I o
W = log ( A 1 / A 2 )
where I is the Amott-Harvey wettability index; W is USBM wettability index; A 1 is the area under the oil drive curve in the USBM method; A 2 is the area under brine drive curve in the USBM method. In subsequent calculations, I B is Amott-Harvey wettability index from brine saturation; W B is USBM wettability index from brine saturation; I V is Amott-Harvey wettability index from VES filtration; W V is USBM wettability index from VES filtration.
The criteria of applying the combined Amott/USBM method to evaluate wettability are shown in Table 1. The higher the absolute value of I or W, the greater the wetting preference. As shown in Table 1, the range of the Amott index value can be subdivided into seven wetting levels, while the USBM index can only divide the wettability into three different types: oil-wet, neutral-wet, and water-wet.

3. Experimental Section

3.1. Original Oil–Water Distribution

The oil was from Karamay oilfield, and its density and viscosity were 0.82 g/cm3 and 6.1 mPa·s, respectively, at a reservoir temperature of 73 °C. Simulated reservoir water (salinity 25,000 mg/L) was prepared with pure water and NaCl (Na+ 9839 mg/L and Cl 15,161 mg/L). An anionic VES sample was provided by Shanghai Research Institute of Petrochemical Technology. The VES was composed of amido betaine and sodium mesoporous acid (with a molar ratio of 3:7), the molecular structures of which are shown in Figure 2:
The properties of the VES solution are introduced in [24,28].
In this work, a series of homogeneous artificial slug cores were used, which were mainly made from quartz. The artificial cores had a diameter of 3.8 cm and a length of 7.0 cm, with a porosity range of 15.99–22.16%, and air permeability of 95–2350 mD.

3.2. Experimental Procedure and Equipment

3.2.1. Effect of Injection Flow Rate

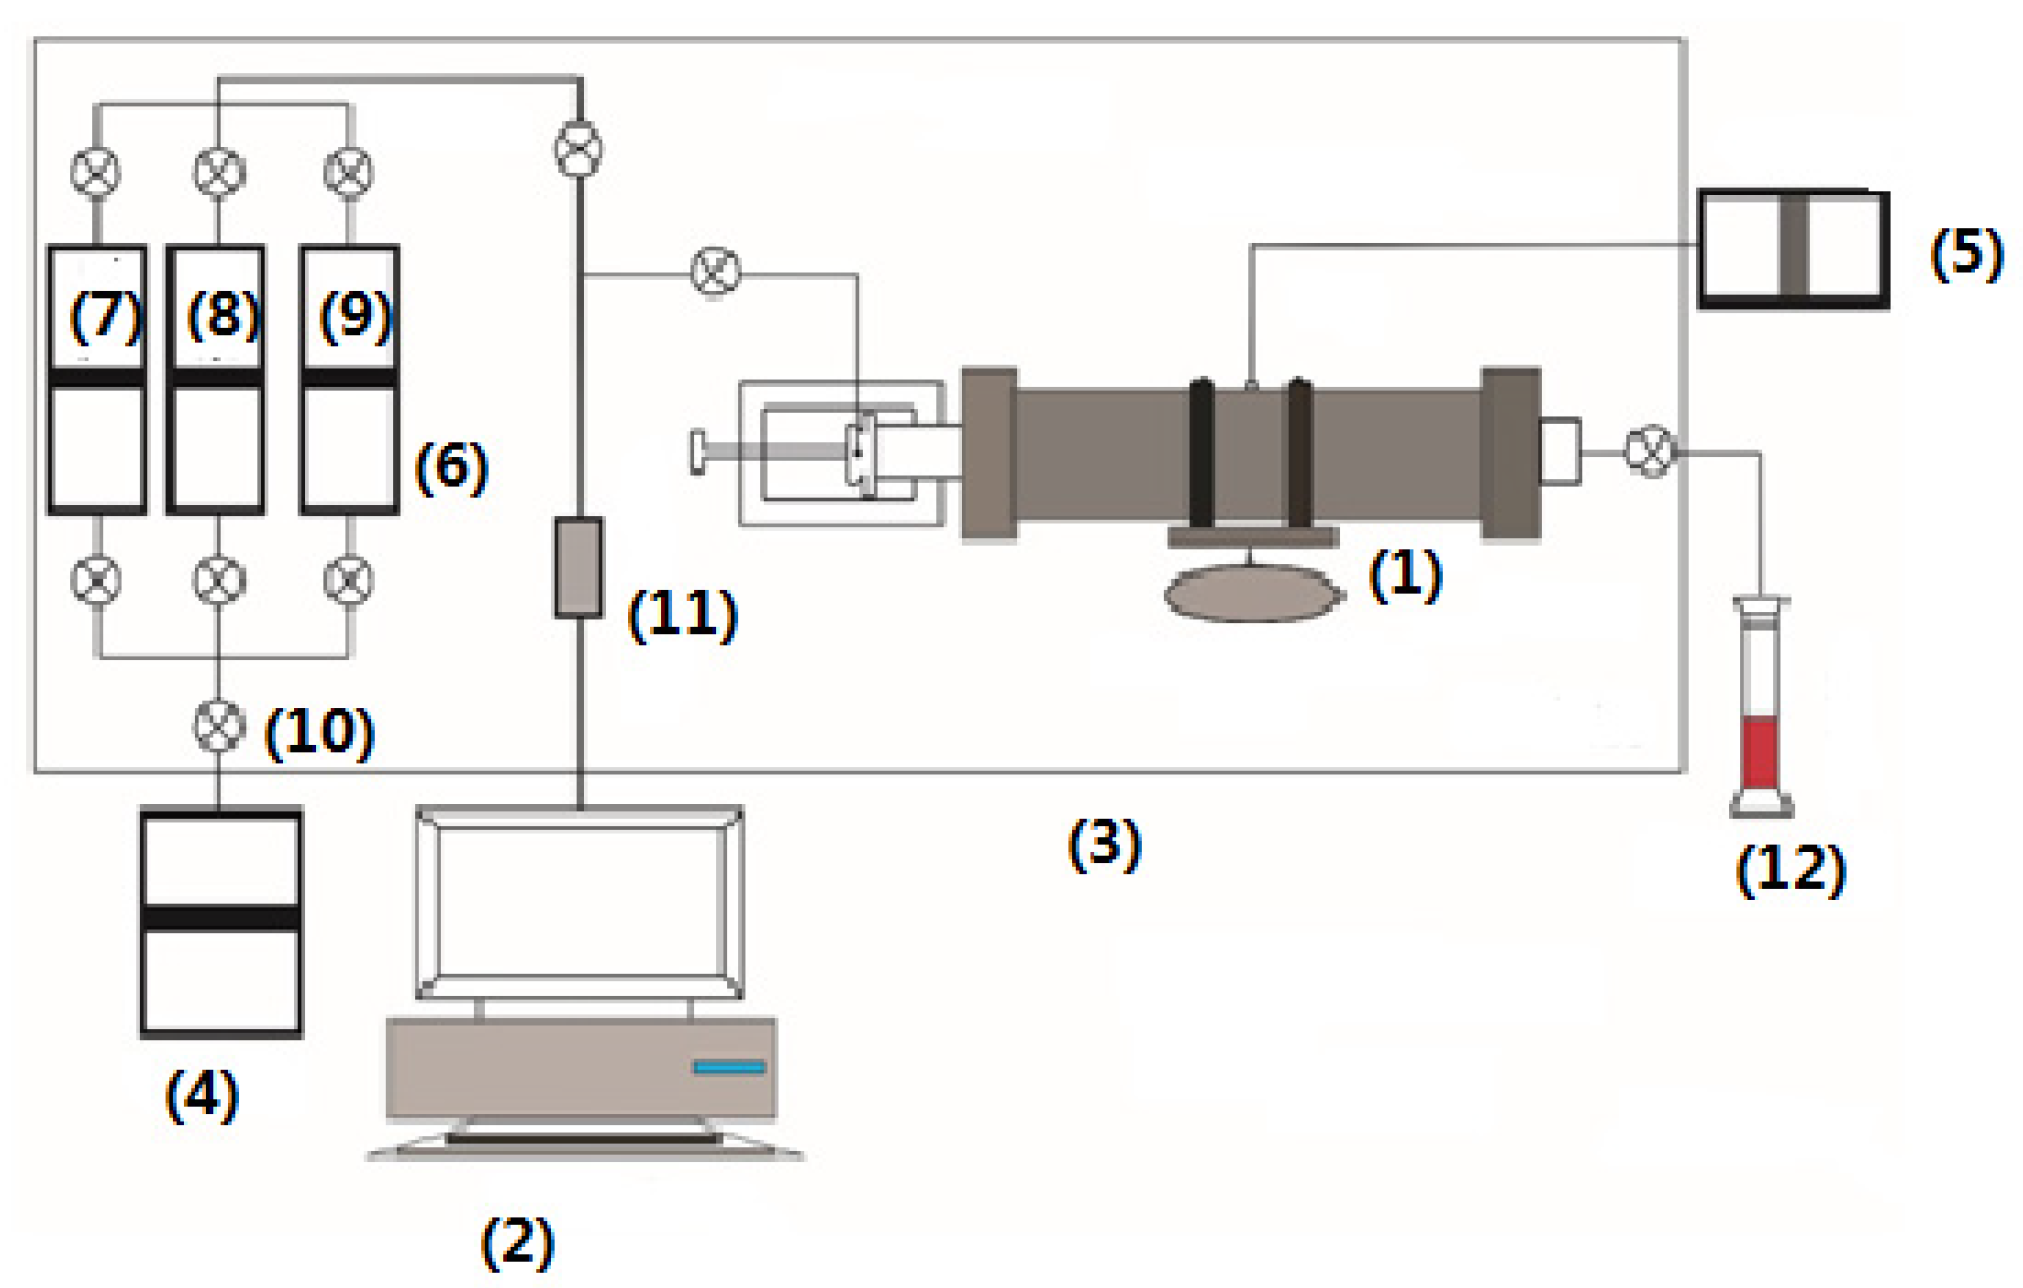
VES filtration and aging processes were performed in the core flooding system as shown in Figure 3.

3.2.2. Imbibition Meters

Water and oil imbibition meters were used in imbibition experiments, as shown in Figure 4.

3.2.3. Equipment for Forced Displacing

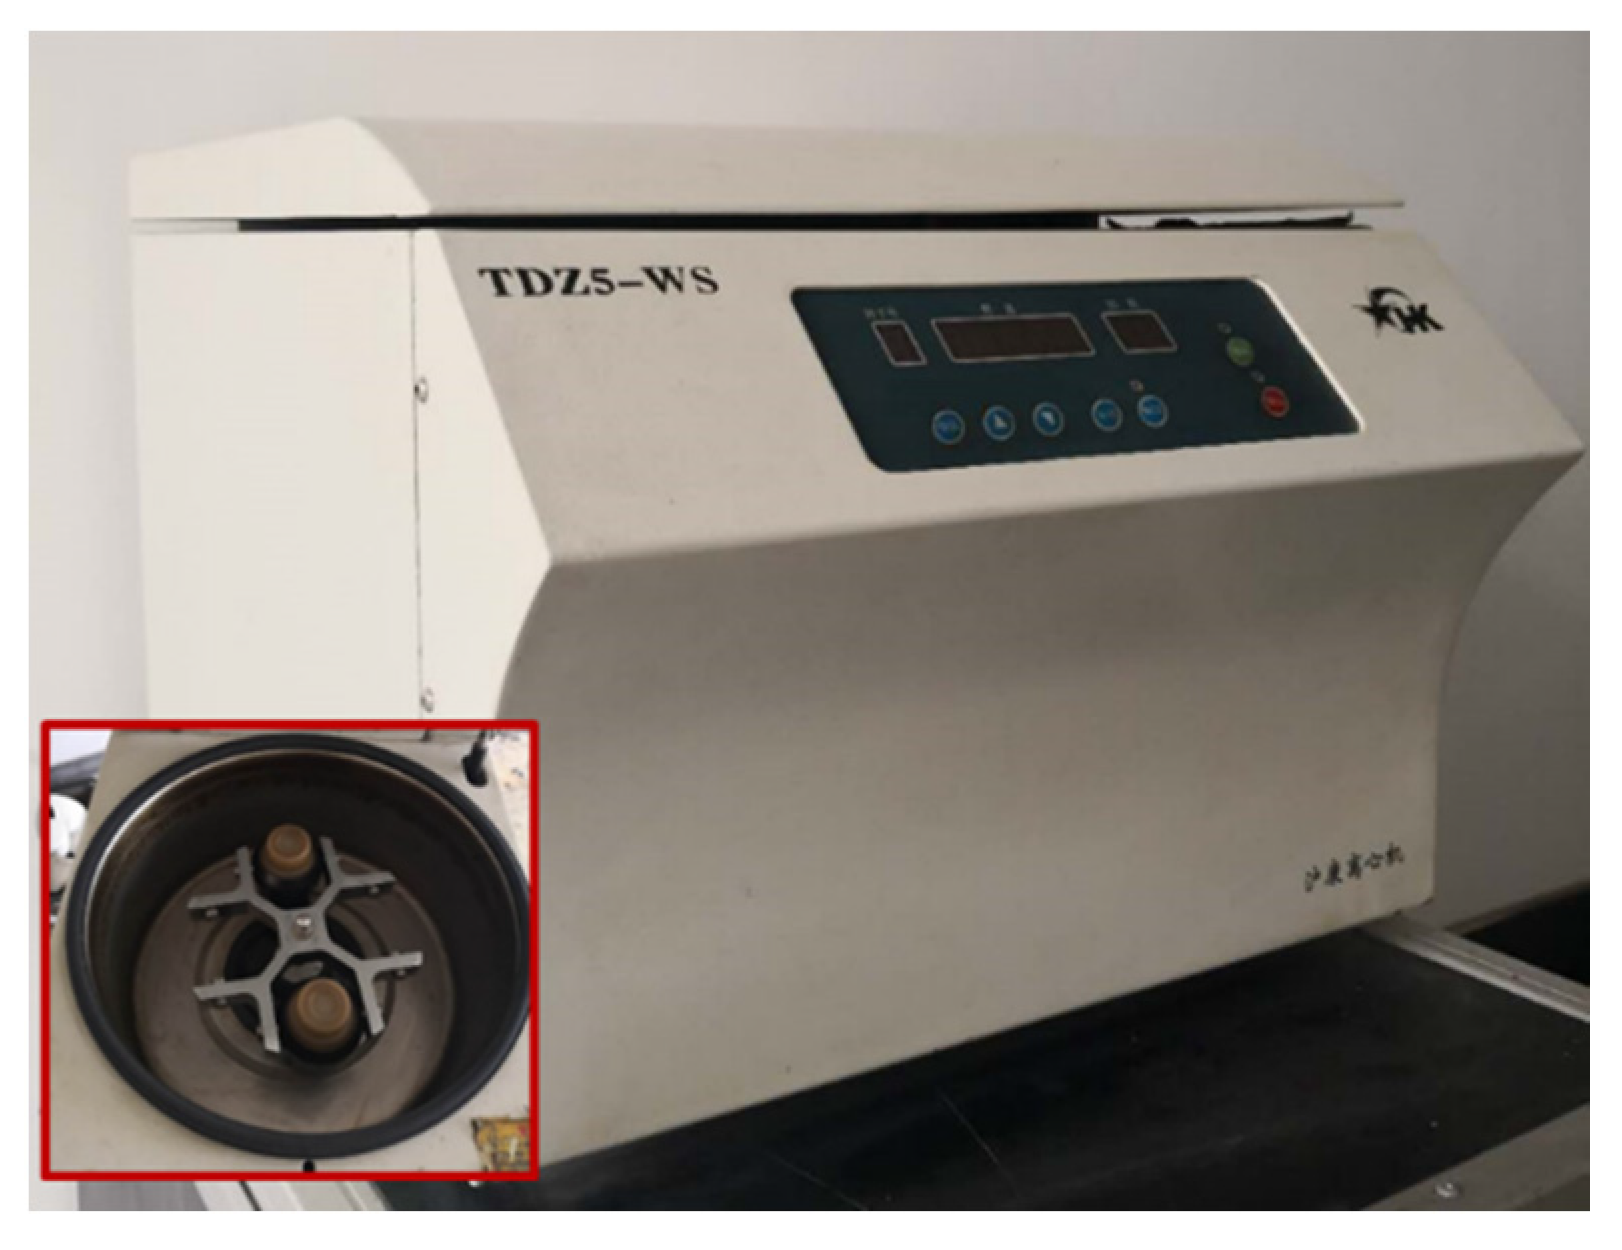
In the combined Amott/USBM test, forced displacing experiments were performed in the centrifuge. The centrifuge used in this work was manufactured by Hukang Centrifuge Company in Hunan, China (Figure 5), and had the maximum rotational speed of 5500 rpm. In this work all tests were finished under the constant rotational speed of 4000 rpm.

3.3. Combined Amott/USBM Test

3.3.1. Neutral Wetting Core Preparation

The preparation process of neutral wetting cores is as follows: (1) placing the cores in a 73 °C oven and aging for 24 h, followed by saturation of core samples with dimethyl silicone oil by the core filtration system; (2) aging the cores at 73 °C for 72 h with dimethyl silicone oil; (3) flushing the aged cores with toluene for 12 h to remove dimethyl silicone oil; (4) flushing the core with methanol for 4 h to remove toluene; (5) aging the core again for 72 h at 73 °C to fully evaporate methanol in the core.

3.3.2. Initial Wettability-Index Measurement before VES Filtration

The initial wettability index of each core before VES filtration was tested using oil and brine (25,000 mg/L), according to the Amott/USBM experimental procedure mentioned in Section 2. In this work, the initial wettability indexes of all the cores are presented in Table 2.

3.3.3. Core Aging Procedures after VES Filtration

In this section, VES solution was the aqueous phase in the combined Amott/USBM test. Before measuring the wettability index, two types of core aging procedures were applied after the VES filtration process, which are as follows:
  • Static aging
After measuring the wettability of the core samples with brine, a VES solution with a concentration of 5000 mg/L was injected into the core samples (Figure 2) at an equivalent flow rate of 0.1 cm3/min, as in initial wettability measurements. After 3 PV (porous volume) of VES solution filtration, the adsorption in the core approached a balance [28], followed by static aging of the core slug in the core holder at 73 °C. The effect of different static-aging times (12 h, 24 h, 48 h, 72 h, and 168 h) on the wettability of core plugs was investigated. After static aging, the slug core was taken out from the core holder to measure the wettability alteration. Besides the static-aging time, the effects of VES concentration, filtration flow rate, and pore radius were also investigated at the static-aging time of 72 h.
  • Dynamic aging
In order to investigate the difference between static aging and dynamic aging, dynamic-aging experiments were also performed. After measuring the initial wettability of the core samples, a VES solution with a concentration of 5000 mg/L was continuously injected into the core samples at a flow rate of 0.1 cm3/min, for different total dynamic-aging times (12 h, 24 h, 48 h, 72 h, and 168 h). After that, the core was taken out from the core holder to measure the wettability alteration.

3.3.4. Wettability-Index Measurements after VES Filtration

The wettability index of each core after VES filtration was tested by the combined Amott/USBM method as mentioned in Section 2.

4. Results and Discussion

4.1. Effect of Aging Mode and Aging Time

4.1.1. Static Aging

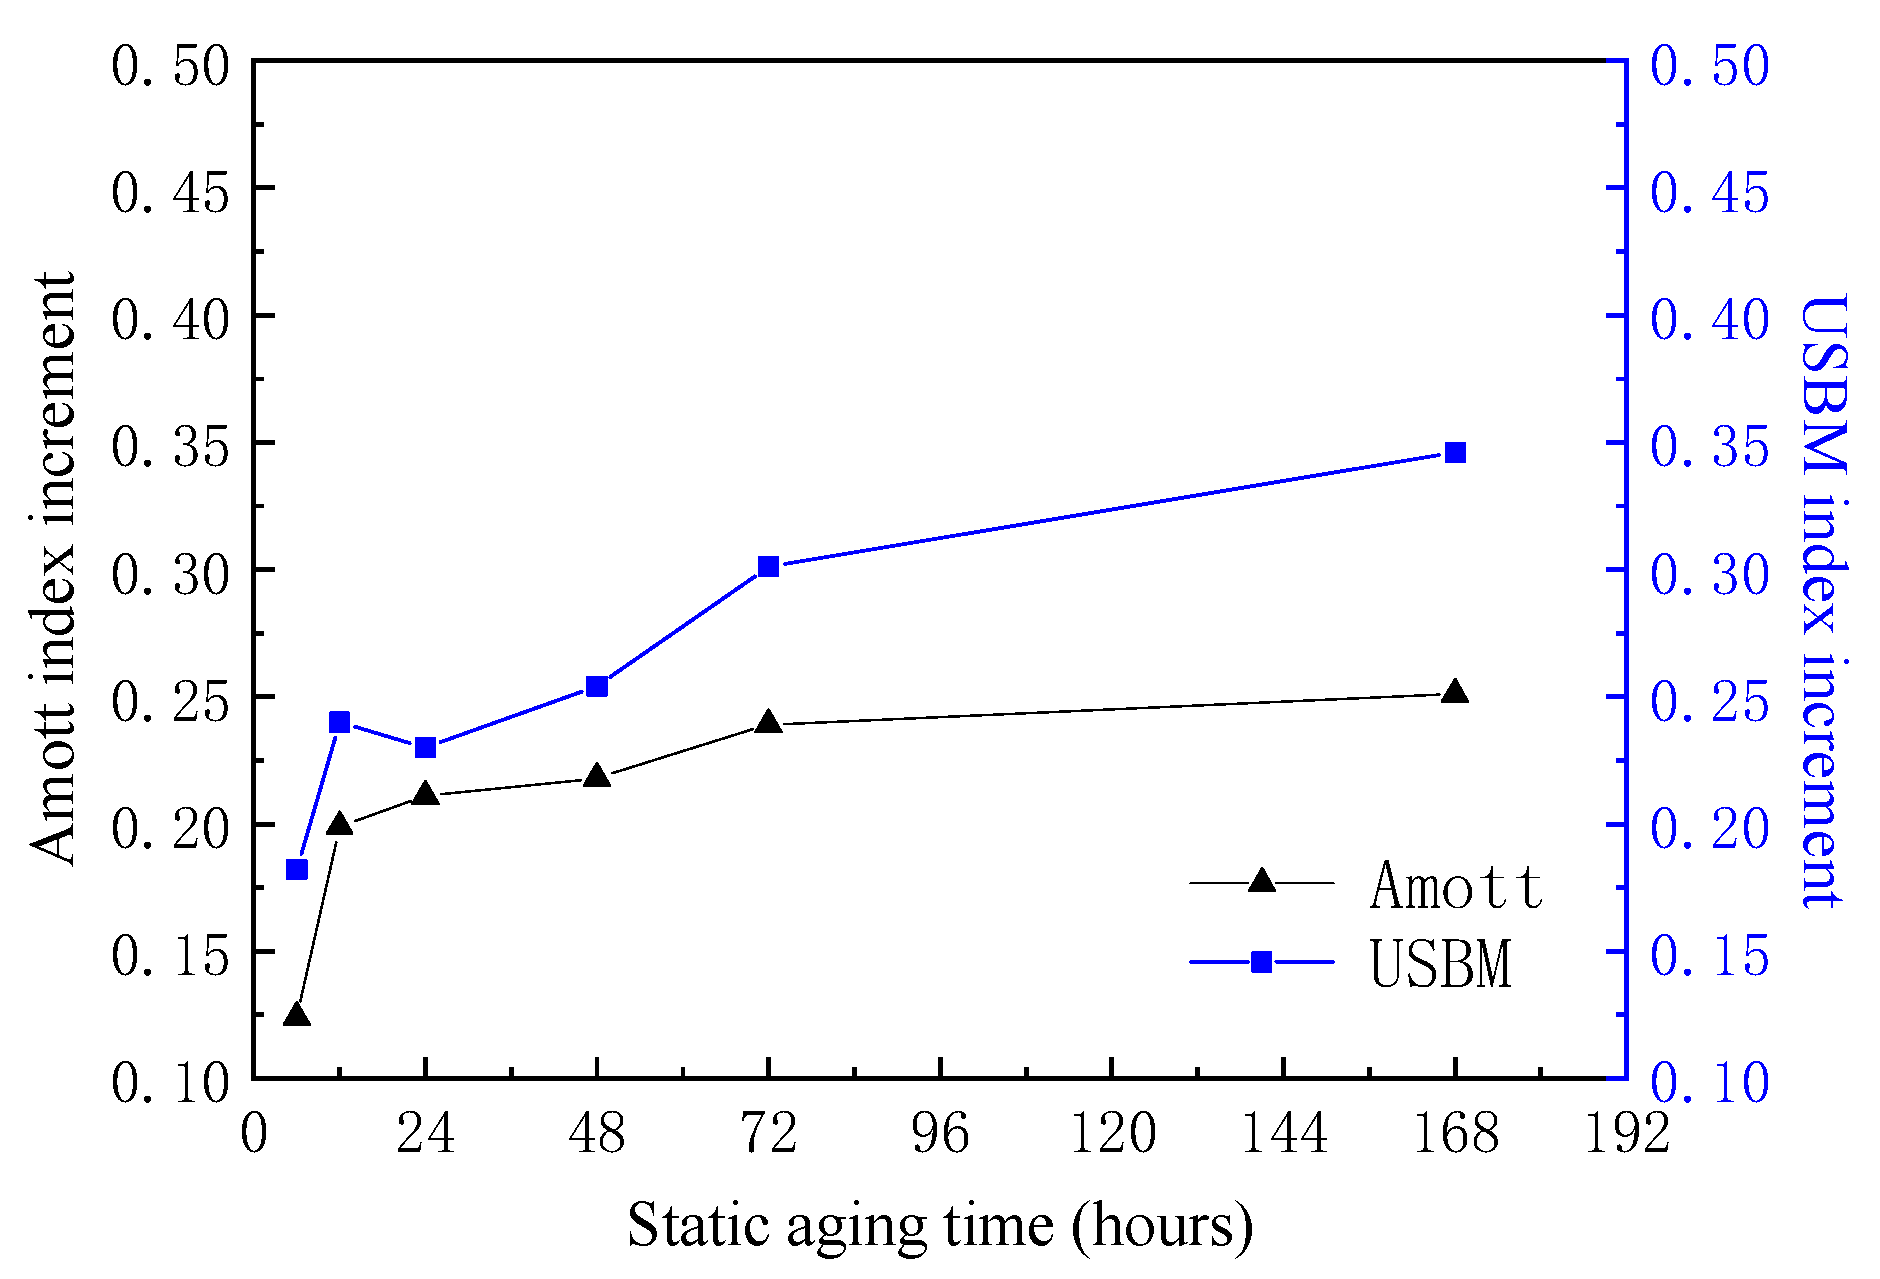
Table 2 shows the parameters of core samples, and their wettability index values before and after the VES filtration process. The static-aging time was from 6 h to 168 h. The cores were initially neutral-wet, and the initial average wettability indexes of the cores were IB = 0.036 and WB = −0.013. The difference in the initial maximum and minimum indexes of the cores was low. After VES filtration and aging, the average wettability index values increased to: IV = 0.243 and WV = 0.251. The Amott index and the USBM index were significantly increased after VES filtration and aging. According to the criterion in Table 1, the wettability of all cores was altered from neutral to weakly hydrophilic. Static-aging time had an effect on wettability alteration. The longer the aging time after VES filtration, the higher the hydrophilic wettability index. This was because with increasing time, more VES had adsorbed on the surface of pore wall, which resulted in a more hydrophilic pore surface. A more hydrophilic pore surface means a lower aqueous phase–solid interfacial tension and a higher oil–solid surface interfacial tension [24], and so the mobility of the aqueous phase is weaker, while oil mobility is enhanced. Figure 6 shows the increment of the wettability index (Amott and USBM) at different static-aging times. Both curves show trend to increase. The increment of the wettability index (IV-IB and WV-WB) changed significantly within static-aging time of 72 h, and the increment over 72 h became slower. This may be because the adsorption of the VES on the core surface was saturated, and the adsorption efficiency became weaker [14] with the increase in static-aging time. The results show that the increase in the wetness index tends to be stable after the static-aging time increases to a certain extent (>72 h), which is consistent with the VES adsorption test results [28].

4.1.2. Dynamic Aging

For comparison, core No. 65–69 were dynamically aged by continuously filtrating VES solution. Table 3 shows the parameters of the core samples and their wettability indexes before and after VES filtration, with different dynamic-aging times. The initial average wettability indexes of the cores were IB = −0.003 and WB = −0.020. The Amott and USBM indexes increased significantly after VES dynamic aging, and the core wettability was altered from neutral to weakly hydrophilic, or hydrophilic. After VES dynamic aging, the average wettability index values increased to: IV = 0.367 and WV = 0.319. The longer the VES dynamic aging time was, the stronger the hydrophilicity of the core, and the Amott index reached up to 0.701 (hydrophilic level). Compared with Table 2, the maximum wettability index was much higher than that obtained by static aging.
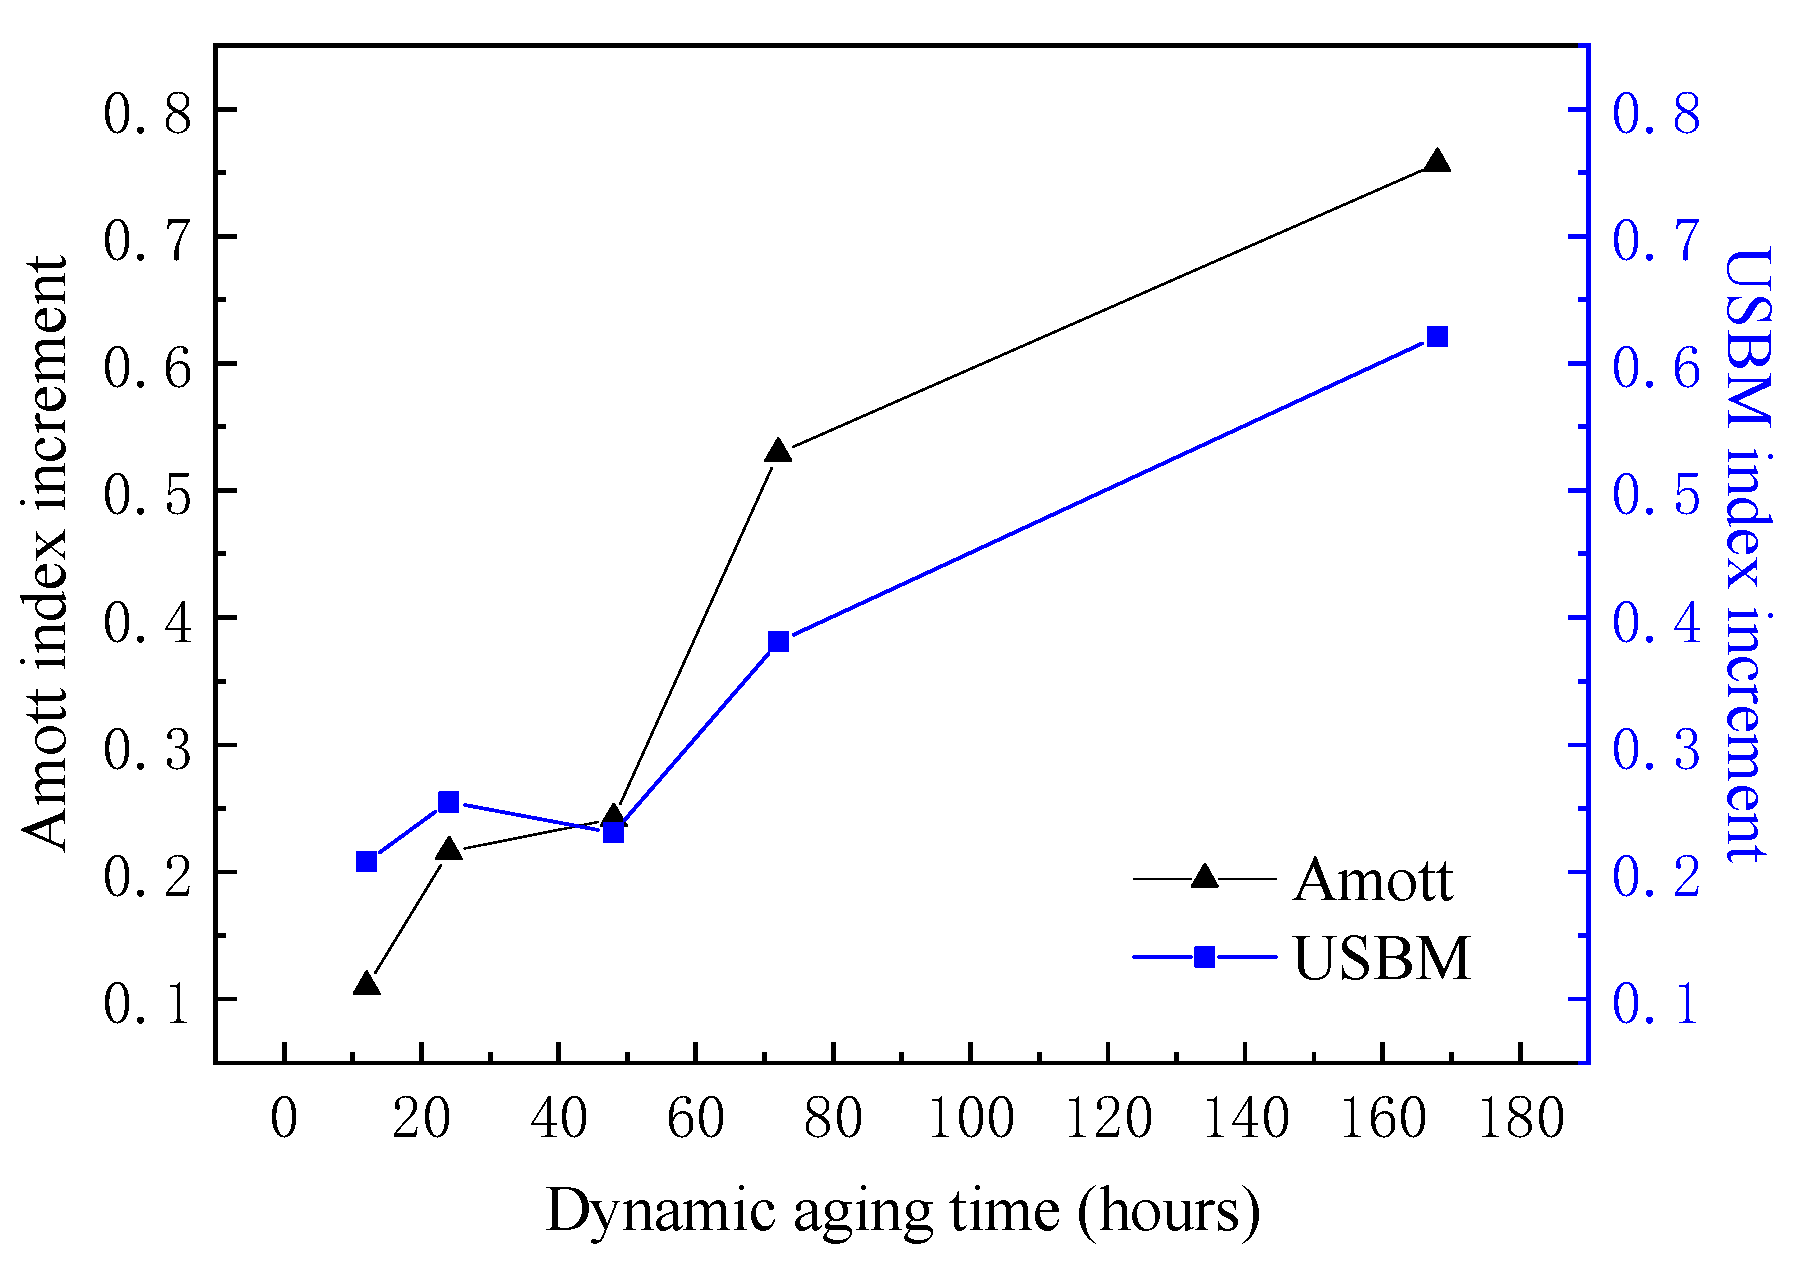
Figure 7 shows the wettability-index increments with an increasing dynamic-aging time. The wettability index alteration became more significant with a prolonged dynamic-aging time. The flushing volume of the VES during dynamic aging was much greater than 3 PVs that were injected for static-aging experiments. The wettability alteration in dynamic aging was more significant than that of static aging, which is believed to be caused by a higher contact degree between the VES and pore-wall surfaces in dynamic aging [12], and higher adsorption of the VES. In a dynamic-aging process, a VES solution is continuously injected into the core throughout the aging process, which means a more efficient contact between VES and pore surface [14]. This is also reflected in VES flooding; the rock wettability may alter significantly for the swept area, which was continuously flushed by VES solution. The water wetness is significantly enhanced, which may be particularly noticeable in the near-wellbore zone [27]. The possible mechanism for a higher adsorption of VES is shown in Figure 8. At a certain concentration, the VES-network micelles form in the solution. When the solution flows through the porous media under the shear of the pore throat, the network micelle structure of VES is destroyed into small pieces [32]. Some micelles adsorb onto the pore wall, increasing the interfacial charge, and resulting in the enhancement of the hydrophilicity of the pore-wall surface.

4.2. Effect of VES Concentration

Table 4 shows the parameters of core samples and the measurement results. The average wettability of the core before VES filtration was neutral–weakly oleophilic changing to hydrophilic after VES filtration. The core wettability index showed an increasing trend when the VES concentration was lower than 3000 mg/L, but still in the neutral–weakly hydrophilic range. When the injected VES concentration was higher than 3000 mg/L, the wettability index was increased to the weakly hydrophilic range. The increment in wettability indexes as a function of VES concentration is plotted in Figure 9. Both Amott and USBM curves show the same trend, that the increment of the core wettability index increases with increasing concentration, which is more obvious when the concentration is above 3000 mg/L. This may relate to the properties of VES solutions. In our previous work, we found that the viscosity of a VES increases with concentration. When the concentration is lower than 3000 mg/L, the VES has low viscosity [24], and VES solutions behave like the conventional EOR surfactant solution. When the concentration is above 3000 mg/L, the viscosity of the VES solution is significantly enhanced, which can reduce the mobility of VES in porous media and result in VES molecules more fully interacting with the pore surface, thus increasing their adsorption. In addition, the increase of VES concentration improves the adsorption of VES molecules onto the pore surface. As a result, the increased adsorption of VES results in the increase of interfacial negative charge, and the enhancement of hydrophilicity of the pore wall.

4.3. Effect of VES Flow Rate

For evaluating the effect of flow rate, a constant concentration of 5000 mg/L was used. The VES solution was filtered in the cores at different flow rates and the Amott/USBM wettability indexes were measured after static aging for 72 h. The parameters of the core samples and their wettability indexes are shown in Table 5. After the filtration of 5000 mg/L VES, the wettability of all the cores was altered from weakly–neutrally lipophilic to weakly hydrophilic. The increment in wettability indexes vs. filtration flow rate is plotted in Figure 10. As filtration flow rate increased, the core wettability-index increment increased slightly. This is because increasing the filtration flow rate resulted in a decrease in IPV and an increase in retention [28], which resulted in more interaction between VES and pore-wall surface. Generally, the effect of the flow rate (from 0.05 to 0.5 cm3/min) was not as significant as aging time and concentration.

4.4. Effect of Pore Radius

For evaluating the effect of pore radius, the average pore radius of the cores were calculated according to the measurement of gas permeability and porosity by the Kozeny-Carman equation [33]. VES solutions with a concentration of 5000 mg/L were used. The results are shown in Table 6. The wettability index of all cores after VES filtration were altered from initially neutral to weakly hydrophilic. Figure 11 shows the plots of the wettability-index increments as a function of filtration pore radius. Both the Amott and the USBM indexes showed a trend of slightly increasing with increasing pore radius. The experimental results confirm that the surface effect caused by the difference in pore radius can affect the wettability [10]. As the core permeability (pore radius) increased, the IPV value of the VES decreased, and the retention increased in the core [28], which resulted in more contact between the VES and the pore wall surface. As a consequence, wettability was altered to be more water-wet. Nevertheless, the permeability (pore radius) change did not induce a significant alteration of average wettability.

5. Conclusions

The average core wettability alteration before and after VES filtration was investigated using initially neutral cores. The results showed that all neutral cores were altered to be more water-wet after VES filtration, and the variation trend in Amott and USBM indexes was similar. Dynamic aging induced a more significant wettability alteration than static aging. As the concentration of VES increased, the viscosity of the VES solution increased rapidly, and this, in turn, increased the adsorption of VES in the core, which promoted the overall wettability of the core to become more hydrophilic. When increasing the filtration flow rate, some high viscosity VES aggregates are destroyed by shear, which results in a decrease in IPV and more retention in the core [28]. As a consequence, more interaction between the VES and pore-wall surface occurs, which alters the wettability of core to become more hydrophilic. In higher permeability cores, the IPV reduction allows the VES to remain in more pores, which slightly alters the overall wettability of the core to become more hydrophilic.

Author Contributions

Conceptualization, K.L.; methodology, X.J.; writing—original draft preparation, K.L. and B.C.; writing—review and editing, C.Y. and M.V.; Supervision, W.P. All authors have read and agreed to the published version of the manuscript.

Funding

This research was supported by the Ministry of Science and Higher Education of the Russian Federation under agreement No. 075-15-2020-931 within the framework of the development program for a world-class Research Center “Efficient development of the global liquid hydrocarbon reserves” and also supported by China National Natural Science Fund (No. U19B2010).

Institutional Review Board Statement

Not applicable.

Informed Consent Statement

Not applicable.

Data Availability Statement

Not applicable.

Conflicts of Interest

The authors declare no competing financial interest.

References

  1. Yadali Jamaloei, B.; Kharrat, R.; Asghari, K.; Torabi, F. The influence of pore wettability on the microstructure of residual oil in surfactant-enhanced water flooding in heavy oil reservoirs: Implications for pore-scale flow characterization. J. Pet. Sci. Eng. 2011, 77, 121–134. [Google Scholar] [CrossRef]
  2. Salehi, M.; Johnson, S.J.; Liang, J.T. Mechanistic study of wettability alteration using surfactants with applications in naturally fractured reservoirs. Langmuir 2008, 24, 14099–14107. [Google Scholar] [CrossRef]
  3. León-Pabón, J.-A.; Mejía-Pilonieta, T.-J.; Carrillo-Moreno, L.-F.; Buendía-Lombana, H.; Zapata, J.-F.; Díaz-Prada, C.-A. Experimental Comparison for the Calculation of Rock Wettability Using the Amott-Harvey Method and a New Visual Method. J. Oil Gas Altern. Energy Sources 2014, 5, 5–22. [Google Scholar] [CrossRef] [Green Version]
  4. Luo, P.; Li, S.; Knorr, K.D.; Nakutnyy, P. Underlying mechanisms of tight reservoir wettability and its alteration. In Proceedings of the Proceedings—SPE Symposium on Improved Oil Recovery, Tulsa, OK, USA, 14–18 April 2018. SPE-190214-MS. [Google Scholar]
  5. Anderson, W.G. Wettability Literature Survey—Part 2: Wettability Measurement. J. Pet. Technol. 1986, 38, 1246–1262. [Google Scholar] [CrossRef]
  6. Castillo, S.C.; Fjelde, I. Water and Surfactant Flooding at Differnet Wettability Conditions; University of Stavanger: Stavanger, Norway, 2011. [Google Scholar]
  7. Mandal, A.; Kar, S.; Kumar, S. The Synergistic Effect of a Mixed Surfactant (Tween 80 and SDBS) on Wettability Alteration of the Oil Wet Quartz Surface. J. Dispers. Sci. Technol. 2016, 37, 1268–1276. [Google Scholar] [CrossRef]
  8. Yi, H.; Zhang, X.; Liu, Y.; Song, S. AFM study on the wettability of mica and graphite modified with surfactant DTAB. J. Dispers. Sci. Technol. 2018, 39, 1060–1064. [Google Scholar] [CrossRef]
  9. Jiang, R.; Li, K.; Horne, R. A mechanism study of wettability and interfacial tension for EOR using silica nanoparticles. In Proceedings of the Proceedings—SPE Annual Technical Conference and Exhibition, San Antonio, TX, USA, 11 October 2017. SPE-187096-MS. [Google Scholar]
  10. Li, X.; Fan, X.; Brandani, S. Difference in pore contact angle and the contact angle measured on a flat surface and in an open space. Chem. Eng. Sci. 2014, 117, 137–145. [Google Scholar] [CrossRef]
  11. Elmofty, O. Surfactant Enhanced Oil Recovery by Wettability Alteration in Sandstone Reservoirs; Missouri Universigy of Science and Technology: Rolla, MO, USA, 2012. [Google Scholar]
  12. Bobek, J.E.; Mattax, C.C.; Denekas, M.O. Reservoir Rock Wettabiliity—Its Significance and Evaluation. J. Pet. Technol. 1958, 213, 155–160. [Google Scholar]
  13. Julius, P.; Ananthanarayanan, P.N.; Anbazhagan, G. Analysis on capillary pressure curves by wettability modification through surfactants. Indian J. Sci. Technol. 2015, 8, 2–5. [Google Scholar] [CrossRef] [Green Version]
  14. Fernø, M.A.; Torsvik, M.; Haugland, S.; Graue, A. Dynamic laboratory wettability alteration. Energy Fuels 2010, 24, 3950–3958. [Google Scholar] [CrossRef]
  15. Hou, B.F.; Wang, Y.F.; Huang, Y. Mechanistic study of wettability alteration of oil-wet sandstone surface using different surfactants. Appl. Surf. Sci. 2015, 330, 56–64. [Google Scholar] [CrossRef]
  16. Aspenes, E.; Graue, A.; Ramsdal, J. In situ wettability distribution and wetting stability in outcrop chalk aged in crude oil. J. Pet. Sci. Eng. 2003, 39, 337–350. [Google Scholar] [CrossRef]
  17. Wu, K.; Chen, Z.; Li, J.; Li, X.; Xu, J.; Dong, X. Wettability effect on nanoconfined water flow. In Proceedings of the National Academy of Sciences of the United States of America, Cambridge, MA, USA, 15 February 2017; Volume 114, pp. 3358–3363. [Google Scholar]
  18. Karimi, A.; Fakhroueian, Z.; Bahramian, A.; Pour Khiabani, N.; Darabad, J.B.; Azin, R.; Arya, S. Wettability alteration in carbonates using zirconium oxide nanofluids: EOR implications. Energy Fuels 2012, 26, 1028–1036. [Google Scholar] [CrossRef]
  19. Hou, B.; Jia, R.; Fu, M.; Wang, Y.; Bai, Y.; Huang, Y. Wettability Alteration of an Oil-Wet Sandstone Surface by Synergistic Adsorption/Desorption of Cationic/Nonionic Surfactant Mixtures. Energy Fuels 2018, 32, 12462–12468. [Google Scholar] [CrossRef]
  20. Das, S.; Nguyen, Q.; Patil, P.D.; Yu, W.; Bonnecaze, R.T. Wettability Alteration of Calcite by Nonionic Surfactants. Langmuir 2018, 34, 10650–10658. [Google Scholar] [CrossRef] [PubMed]
  21. Morrow, J.R. Wettability and Its Effect on Oil Recovery. J. Pet. Technol. 1990, 67, 1476–1484. [Google Scholar] [CrossRef]
  22. Bulgakova, G.T.; Kharisov, R.Y.; Pestrikov, A.V.; Sharifullin, A.R. Experimental study of a viscoelastic surfactant-based in situ self-diverting acid system: Results and interpretation. Energy Fuels 2014, 28, 1674–1685. [Google Scholar] [CrossRef]
  23. Siggel, L.; Santa, M.; Hansch, M.; Nowak, M.; Ranft, M.; Weiss, H.; Hajnal, D.; Schreiner, E.; Oetter, G.; Tinsley, J. A new class of viscoelastic surfactants for enhanced oil recovery. In Proceedings of the SPE—DOE Improved Oil Recovery Symposium Proceedings, Tulsa, OK, USA, 14–18 April 2012; pp. 1–9. [Google Scholar]
  24. Li, K.X.; Jing, X.Q.; He, S.; Ren, H.; Wei, B. Laboratory Study Displacement Efficiency of Viscoelastic Surfactant Solution in Enhanced Oil Recovery. Energy Fuels 2016, 30, 4467–4474. [Google Scholar] [CrossRef]
  25. Van Santvoort, J.; Golombok, M. Improved Oil Reservoir Sweep with Viscoelastic Surfactants. Energy Fuels 2016, 30, 9226–9232. [Google Scholar] [CrossRef]
  26. van Santvoort, J.; Golombok, M. Viscoelastic surfactants for diversion control in oil recovery. J. Pet. Sci. Eng. 2015, 135, 671–677. [Google Scholar] [CrossRef]
  27. Adejare, O.O.; Nasralla, R.A.; Nasr-Ei-Din, H.A. A procedure for measuring contact angles when surfactants reduce the interfacial tension and cause oil droplets to spread. SPE Res. Eval. Eng. 2014, 17, 365–372. [Google Scholar] [CrossRef]
  28. Li, K.; Jing, X.; He, S.; Wei, B. Static Adsorption and Retention of Viscoelastic Surfactant in Porous Media: EOR Implication. Energy Fuels 2016, 30, 9089–9096. [Google Scholar] [CrossRef]
  29. Donaldson, E.C.; Thomas, R.D.; Lorenz, P.B. Wettability Determination and Its Effect on Recovery Efficiency. SPE J. 1969, 9, 13–20. [Google Scholar] [CrossRef]
  30. Sharma, M.M.; Wunderlich, R.W. The alteration of rock properties due to interactions with drilling fluid components. J. Pet. Sci. Eng. 1987, 1, 127–143. [Google Scholar] [CrossRef]
  31. Torsaeter, O. A Comparative study of wettability test methods based on experimental results from North Sea Reservoir Rocks. In Proceedings of the 63rd Annual Technical Conference and Exhibition of the Society of Petroleum Engineers, Houston, TX, USA, 2–5 October 1988; pp. 199–207, SPE 18281. [Google Scholar]
  32. Rehage, H.; Hoffmann, H. Viscoelastic Surfactant Micelle Systems and Their Rheological Properties. Oilf. Chem. 2003, 20, 291–294. [Google Scholar]
  33. Srisutthiyakorn, N.; Mavko, G. The revised Kozeny-Carman equation: A practical way to improve permeability prediction in the Kozeny-Carman equation through pore-size distribution. In Proceedings of the SEG International Exposition and 87th Annual Meeting, Houston, TX, USA, 23 October 2017; pp. 3811–3815. [Google Scholar]
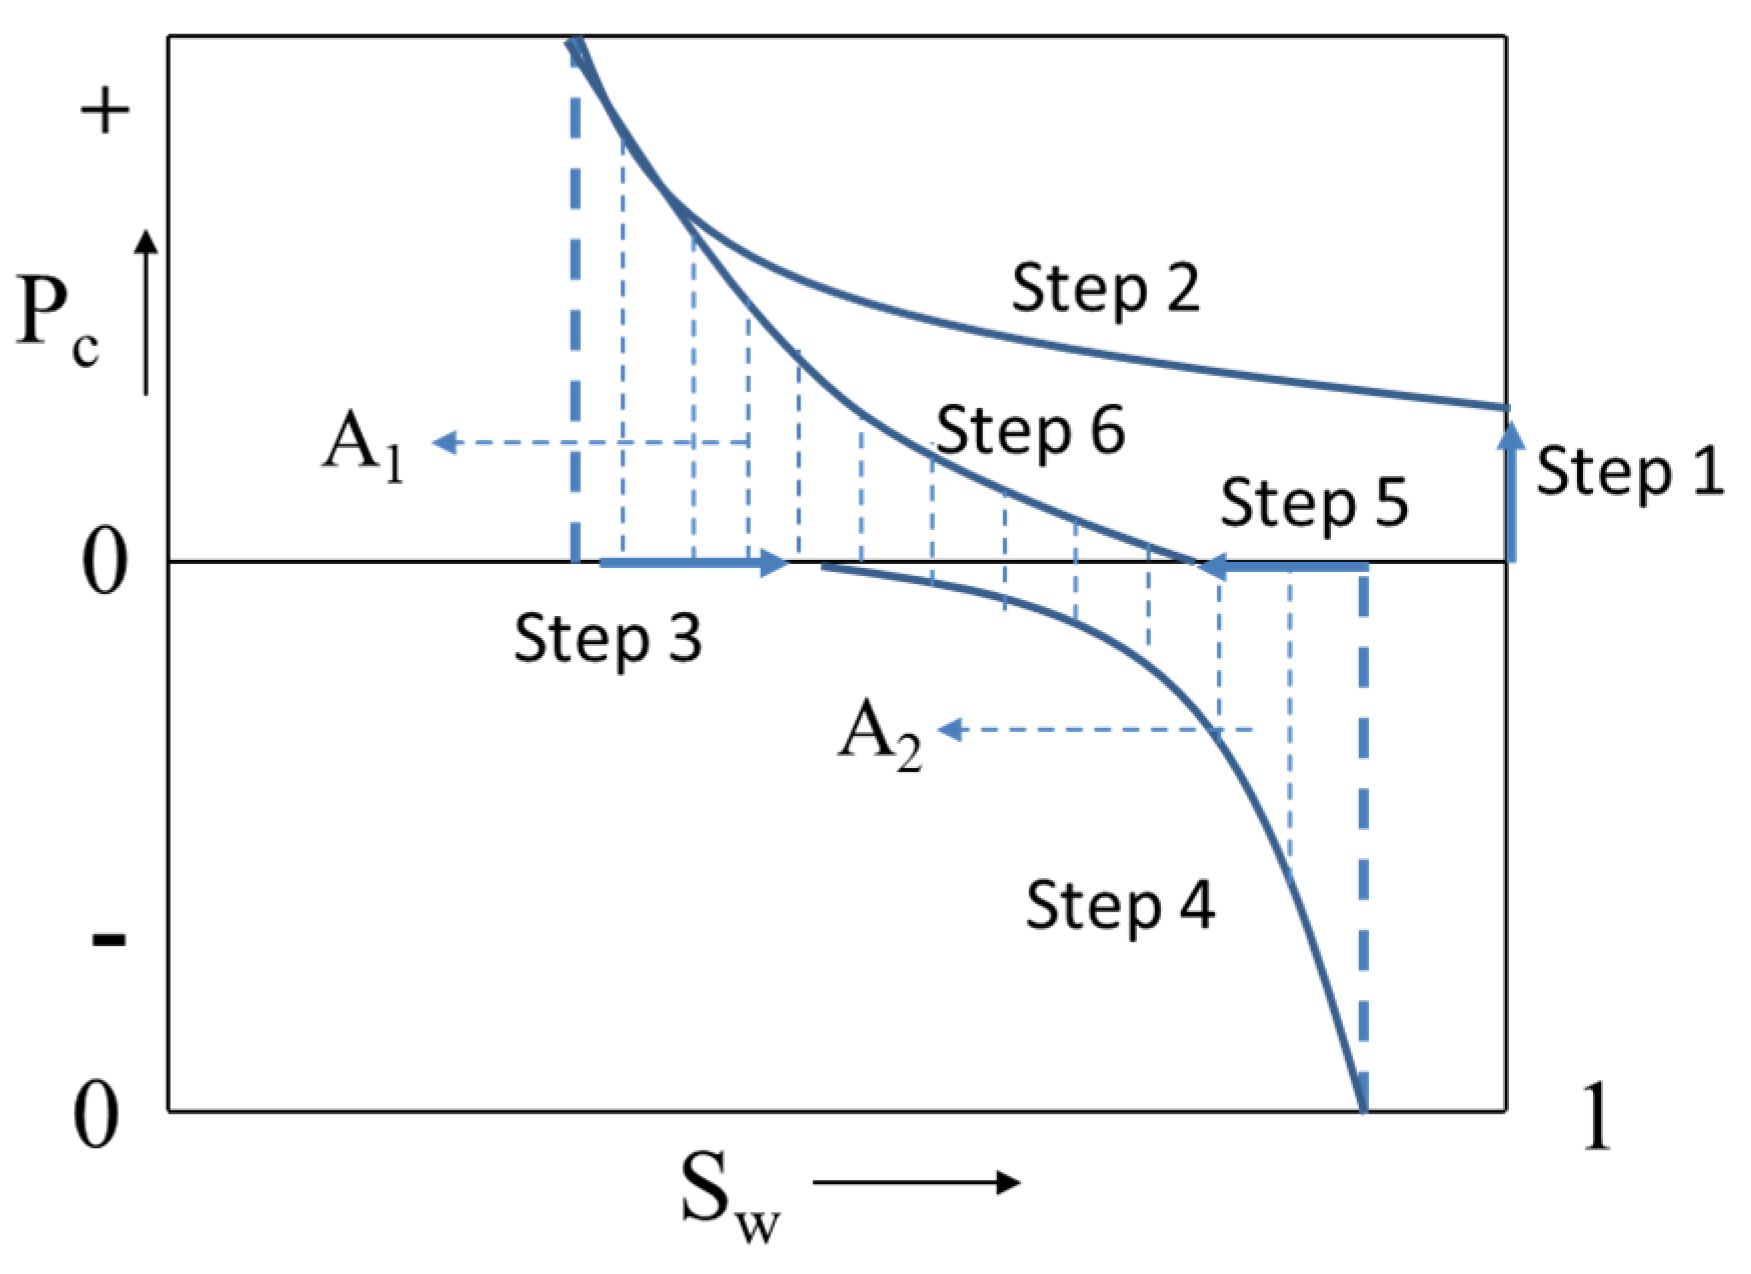
Figure 1. Combined Amott/USBM measurement process.
Energies 14 08454 g001
Figure 2. Molecular structures of VES components: (a) amido betaine; (b) sodium mesoporous acid.
Energies 14 08454 g002
Figure 3. Schematic of core filtration experimental setup: (1) core holder; (2) computer; (3) oven; (4) constant speed pump; (5) manual pump; (6) container; (7) oil sample; (8) brine; (9) VES solution; (10) six-way valve; (11) pressure sensor; (12) cylinder.
Energies 14 08454 g003
Figure 4. Meters used for measurements of: (a) water imbibition; (b) oil imbibition.
Energies 14 08454 g004
Figure 5. TDZ5-WS centrifuge and its internal structure.
Energies 14 08454 g005
Figure 6. Wettability-index increment vs. static-aging time.
Energies 14 08454 g006
Figure 7. Wettability-index increments vs. dynamic-aging time.
Energies 14 08454 g007
Figure 8. Wettability alteration through the pore throat in porous media: (a) before VES injection; (b) after VES flow.
Energies 14 08454 g008
Figure 9. Wettability-index increment vs. VES concentration.
Energies 14 08454 g009
Figure 10. Wettability-index increment vs. VES concentration.
Energies 14 08454 g010
Figure 11. Wettability alteration value vs. pore radius.
Energies 14 08454 g011
Table 1. Wettability criteria of the combined Amott/USBM method [3,5].
Core
Wettability
Strong
Lipophilic
LipophilicNeutral WetHydrophilicStrong
Hydrophilic
Weak
Lipophilic
NeutralWeak
Hydrophilic
Amott(−1.0, 0.7)(−0.7, −0.3)(−0.3, −0.1)(−0.1, 0.1)(0.1, 0.3)(0.3, 0.7)(0.7, 1.0)
USBMNegative value0 or close to 0Positive value
Table 2. Effect of static aging on wettability.
Core
No.
Length
(cm)
Diameter
(cm)
Permeability
(mD)
Porosity
(%)
Aging Time
(h)
Initial WettabilityVES Filtration
IBWBIVWV
100-207.062.5410016.3760.032−0.0460.1560.136
100-156.992.5410317.34120.017−0.0220.2160.218
100-87.022.5510216.34240.0440.0260.2550.256
100-67.042.559916.19480.0500.0510.2680.305
100-56.982.559817.10720.039−0.0120.2780.289
100-37.042.5510118.391680.035−0.0470.2860.299
Table 3. Effect of dynamic aging on wettability.
Core
No.
Length
(cm)
Diameter
(cm)
Permeability
(mD)
Porosity
(%)
Dynamic Aging Time (h)Initial WettabilityVES Filtration
IBWBIVWV
100-667.052.559816.16120.015−0.0360.1250.172
100-677.032.529616.9924−0.050−0.0510.1660.204
100-657.022.5410116.58480.016−0.0100.2580.221
100-687.012.5410215.99720.0580.0610.5870.442
100-696.992.559516.12168−0.056−0.0650.7010.556
Table 4. Effect of VES concentration on wettability.
Core.
No.
Length
(cm)
Diameter
(cm)
Permeability
(mD)
Porosity
(%)
Concentration
(mg/L)
Initial WettabilityVES Filtration
IBWBIVWV
100-317.032.559616.15100−0.028−0.0150.0430.036
100-326.992.559516.011000−0.032−0.0280.0560.052
100-337.012.5510216.563000−0.056−0.0610.0360.026
100-347.042.5510116.195000−0.015−0.0150.1010.063
100-356.992.549916.2610,000−0.068−0.0520.1490.136
Table 5. Effect of flow rate on wettability.
Core
No.
Length
(cm)
Diameter
(cm)
Permeability
(mD)
Porosity
(%)
Flow Rate
(cm3/min)
Initial WettabilityVES Filtration
IBWBIVWV
100-367.052.5510016.230.05−0.101−0.0850.1050.135
100-376.992.5510116.160.10−0.095−0.0150.1010.153
100-387.022.559816.510.30−0.098−0.0610.1560.162
100-397.042.5410217.110.50−0.065−0.0260.1890.193
Table 6. Effect of pore radius on wettability.
Core
No.
Length
(cm)
Diameter
(cm)
Permeability (mD)Porosity
(%)
Pore Radius
(μm)
Initial WettabilityVES Filtration
IBWBIVWV
50-17.012.54469.561.96−0.016−0.0180.0960.053
100-347.042.5510116.192.23−0.015−0.0150.1010.063
300-57.112.5531618.153.730.006−0.0100.1060.066
1000-17.042.55115620.536.71−0.005−0.0080.1160.081
2000-17.062.55235022.169.210.019−0.0130.1350.086
Publisher’s Note: MDPI stays neutral with regard to jurisdictional claims in published maps and institutional affiliations.