Abstract
There are currently trends in the world to transfer and adapt traditional solutions to contemporary needs. This applies, inter alia, to mobile shelters used by nomadic peoples. The article is devoted to the research on the quality of internal air in the yurt and the possibilities of its adaptation to high contemporary quality and environmental requirements, while maintaining its characteristic sustainable values. The tested traditional Mongolian yurt was moved from the dry and cold climate of the Asian steppe to the temperate climate of Central Europe and has been significantly modified. The outer shell materials have been changed, replacing natural materials with modern tight insulating foils. The wood-fired stove has been replaced with an electric heater and the roof opening has been firmly closed. All of these modifications resulted in far-reaching changes in the quality of the internal environment in the yurt. The conducted measurements and simulations of CO2 concentration in the modified yurt proved that the efficiency of ventilation system is not sufficient and that the air quality is very poor (even for a single user). In the case of a larger number of users, the concentration of CO2 has already reached a level that was dangerous to health. The simplest method of improving the air quality in the yurt is its careful unsealing to the required level. Striving for a low energy demand, however, would require a completely different approach (for example, in the form of forced ventilation with a heat recovery unit, ultimately powered with a PV array). Such a solution is very different from the traditional yurt model but is close to modern expectations and environmental requirements.
1. Introduction
The Mongolian yurt is the traditional dwelling of Asian nomadic tribes. The yurt is sometimes referred to as an example of the oldest mobile home [1,2]. In total, there are as many as 9 types of traditional yurts that have been or are still used in 31 countries around the world [3].
The traditional yurt was designed to be as light as possible to allow easy transportation. Its structure consists of walls and a roof only. The absence of foundations minimizes the impact on the environment; nothing remains when the object is removed. The wooden yurt skeleton is insulated with animal felt and covered with several layers of fabric, tightened by cords and textile straps.
Nowadays, more and more attempts of transferring or implementing the model of a portable building, to recreational as well as highly urbanized areas, can be observed. Such facilities are used both as temporary buildings, used for event purposes, but more and more often are used as original and environment friendly tourist solutions or living spaces. Certainly, one of the main advantages of such facilities is their very short construction time. The yurt meets many of the sustainability building criteria, such as natural cooling and ventilation, favorable shape factor (maximum volume limited by the minimum envelope area), use of harmless to the environment materials, minimum ground disturbance, usage of local and natural materials, and easy demolition [4,5]. On the other hand, the environmental impacts of energy use in the yurt or the indoor air quality were not important aspects and were not taken into account.
However, when introducing a new concept of temporary facilities to the market, it is necessary to take into account the requirements of a contemporary user and often completely different climatic and environmental conditions than the place where the yurt comes from. Such adaptation requires checking of traditional solutions not only in terms of design but also material solutions and internal microclimate [6,7]. It is necessary to thoroughly analyze the behavior of natural, original materials in terms of heat and humidity, and above all to assess the microclimate that develops in the yurt during its use. The main factors affecting indoor thermal environments and indoor air quality are external climate conditions, external envelope structure and geometry, internal heat gains, and equipment kind. In case of a very limited volume yurt, the behavior of occupants is a very significant factor that considerably affects momentary internal conditions.
Currently, a very important aspect in the development of civilization is the issue of reducing the emission of harmful substances into the atmosphere, striving for emission neutrality. This aspect has recently become, in context of adaptation of traditional yurt to modern requirements, an important reason to undertake scientific analyzes [2,3,8,9].
Hence, when a yurt appeared on the Cracow University campus, permanently inhabited by now, research was undertaken to assess its internal environment and energy consumption. The original Mongolian yurt was modified and adjusted by its owner to the new role. The external partitions’ structure and the way of heating the interior have been completely changed in order to adapt the solution to the local climate and contemporary users’ requirements. However, the introduced modifications were somewhat random and lacking in-depth analysis. Efforts were made to obtain the highest possible thermal resistance, but the impact of these changes on the internal environment quality was not analyzed. The aim of the analyses carried out in the article is an attempt to assess the air quality inside the yurt, under significantly modified conditions. The modified arrangement of the wall and roof materials, the tight outer shell, and electric heating resulted in a significant change in the quality of the internal environment and the quality of the internal air. The article attempts to answer the question concerning whether it is possible to maintain the sustainable advantages of a traditional yurt and at the same time remove its disadvantages related to the low quality of the internal environment.
In this paper only the results of CO2 concentration measurements and air flow rate in the yurt are presented and discussed. It was assumed that CO2 concentration is a basic factor of indoor air quality. The other aspects of internal environment and energy demand will be evaluated in the subsequent papers on the tested yurt.
Section 2 presents a review of the available literature on Mongolian yurts and their adaptation to modern requirements. Section 3 presents the construction of a traditional yurt and a modified yurt in Cracow, as well as the method of testing of CO2 concentration in the yurt. Then, in Section 4, the results of the measurements of CO2 concentration and the actual air exchange in the yurt are presented. Section 5 discusses the results of simulation calculations and the activities that guarantee the achievement of the required air quality in the yurt. Our conclusions, based on the conducted measurements and the analyses, are included in Section 6.
2. Research Background
The traditional yurt is the subject of numerous studies, both scientific (historical and technical) and those popularizing this form of human activity [3,10,11,12,13,14], as well as doctoral theses [2,15]. Some studies, mainly of an ethnographic or historical nature, are difficult to access and use due to the local language of the text.
The scientific publications on yurts are both comprehensive studies discussing a wide spectrum of issues related to the classification, history of creation and construction of yurts, as well as studies in which descriptions of the classification and philosophy of yurt construction are introduced as design inspiration in the process of architectural education [16].
Unfortunately, a few works only concern aspects related to energy use or the quality of the internal environment in the yurt.
Xu et al. [9] present the results of long-term (October–May) monitoring of air temperature and relative humidity in a traditional yurt in Mongolia, inhabited by two people and heated with an oil heater. Strong variability of both parameters during the year was shown, depending on external conditions. However, the authors’ conclusions regarding thermal features of yurt are quite controversial. They suggest increasing the yurt’s thermal inertia by adding to walls undefined material with high heat capacity. They also propose to increase the tightness of the housing due to the observed infiltration of external air and the use of an undefined modern technology to “optimize natural ventilation”.
Bayandelgera et al. [17] present studies of heating energy consumption of two yurts located in Mongolia: a traditional one heated with coal and a second one additionally insulated and heated with an electric thermal storage (ETS) heater. Simulations of solar photovoltaic cells operation in conjunction with an ETS heater were carried out to assess its energy efficiency during the heating season. During the whole heating season, the fraction of electricity delivered by the solar PV was equal to 31% of the total energy consumption. The remaining 69% was the amount of electricity imported from the main grid.
The issue of energy demand and air quality in the yurts used was discussed in the articles by Tsovoodava et al. [2,3,18]. The team’s research, however, was mainly based on simulation analyzes and was carried out for nine different yurt designs and Mongolian climate zone. The result of the analyses was a proposal of a modified yurt facility with the use of modern insulating materials such as PCM and aerogel. It was also found that a system composed of heating electric radiator and simple fan coil with the air handling unit and enthalpy wheel is the most energy efficient system for the yurt. The energy analysis presented in the paper proved that due to the implementation of all proposed changes demand on heating energy was decreased by 50%. In a traditional yurt, natural lighting and exhaust gas removal during the day are achieved by opening a large opening in the top of the yurt. The opening is tightly closed during the night. The results of air quality tests in the yurt showed that the bigger the internal volume, the lesser the CO2 concentration in yurts. CO2 concentration increased in the night much higher than any acceptable level, the maximum obtained value of CO2 concentration was 11,000 ppm. The operation schedule of top opening played a crucial role in ventilation.
Inspired by the construction of a traditional yurt, the zero-carbon emission Polar Lodge was proposed by Marques et al. [6]. It is an object to be used as a shelter for scientific research in Antarctica. It is planned that the yurts will replace tents, which are neither comfortable nor safe in polar conditions [6]. The purpose of this research was to design and build a sustainable, low-impact modular lodge to facilitate scientific studies in the Antarctic. The materials used in the construction of the Antarctic yurt were as follows: base platform made of plywood; wooden lattice wall structure, indoor finishing: two layers of natural wool with flameproof protection, outdoor covering; and waterproof biodegradable fabric. The environmental comfort and thermal performance of the Antarctic yurt was tested for two consecutive days by the team of researchers in an isolated area on Collins Bay. The following main observations have been achieved. The compact, round, yurt shape enables a good thermal performance, and in addition performs very well against the wind. The yurt insulation made of two layers of natural wool with fireproof protection ensured sufficient insulation from the exterior, and the innate acoustic characteristics of the wool used allowed users of the yurt to perceive a level of acoustic comfort and greater sense of shelter when compared to the usual common tents. The natural incoming zenithal daylight allowed for a comforting sense of place. The high floor-to ceiling height of the yurt provided valuable ergonomic space, allowing the user to stand up, move freely, and perform naturally any task. The construction of the yurt is completely biodegradable and environmentally friendly.
A separate research field is the search and proposed modifications related to the structural aspects of such objects. Among them, there are ideas of the use of recycled materials. Mrkonjic [19] in her paper reported an old idea of application of recycled metal sheets. Salvalai et al. [20] presented an original idea to use recycled downhill skis to build a yurt structure.
The directions of works presented above indicate that there is an interest in the adaptation of traditional solutions of mobile objects to modern needs in the world. The attempt to adapt and transfer the yurt to extreme Antarctic conditions is especially inspiring. However, in the available literature, the analysis of the internal air quality in the yurt concerns the traditional solution and indicates a huge problem with the periodic concentration of carbon dioxide. This information and the disturbing measurement results of CO2 concentration in a modern yurt became the direct reason for undertaking the research described below.
3. Materials and Methods
3.1. Historical Mongolian Yurt Structure
The most typical dwelling of the nomadic tribes on the Mongolian plateau, the Mongolian yurt, appeared in the 15-th century BC. Today, many herdsmen still live in such yurts. In addition to its function as a dwelling, the yurt has also become a symbol of Mongolian culture [9,12]. The mobile Mongolian yurt was created to meet the needs of nomadic tribes who roamed the Mongolian steppe in search of pastures for their animals. As the Mongolian plateau has a harsh climate with cold winters, windy springs and autumns (transitional seasons), and dry summers, the architectural form, building materials, and construction methods of the yurt reflect the climate adaptability characteristics of this dwelling type. The process of construction, use, and ability to be fully dismantled complies with the ecological laws of the grassland and the production modes and lifestyles of the grassland’s inhabitants [9,13].
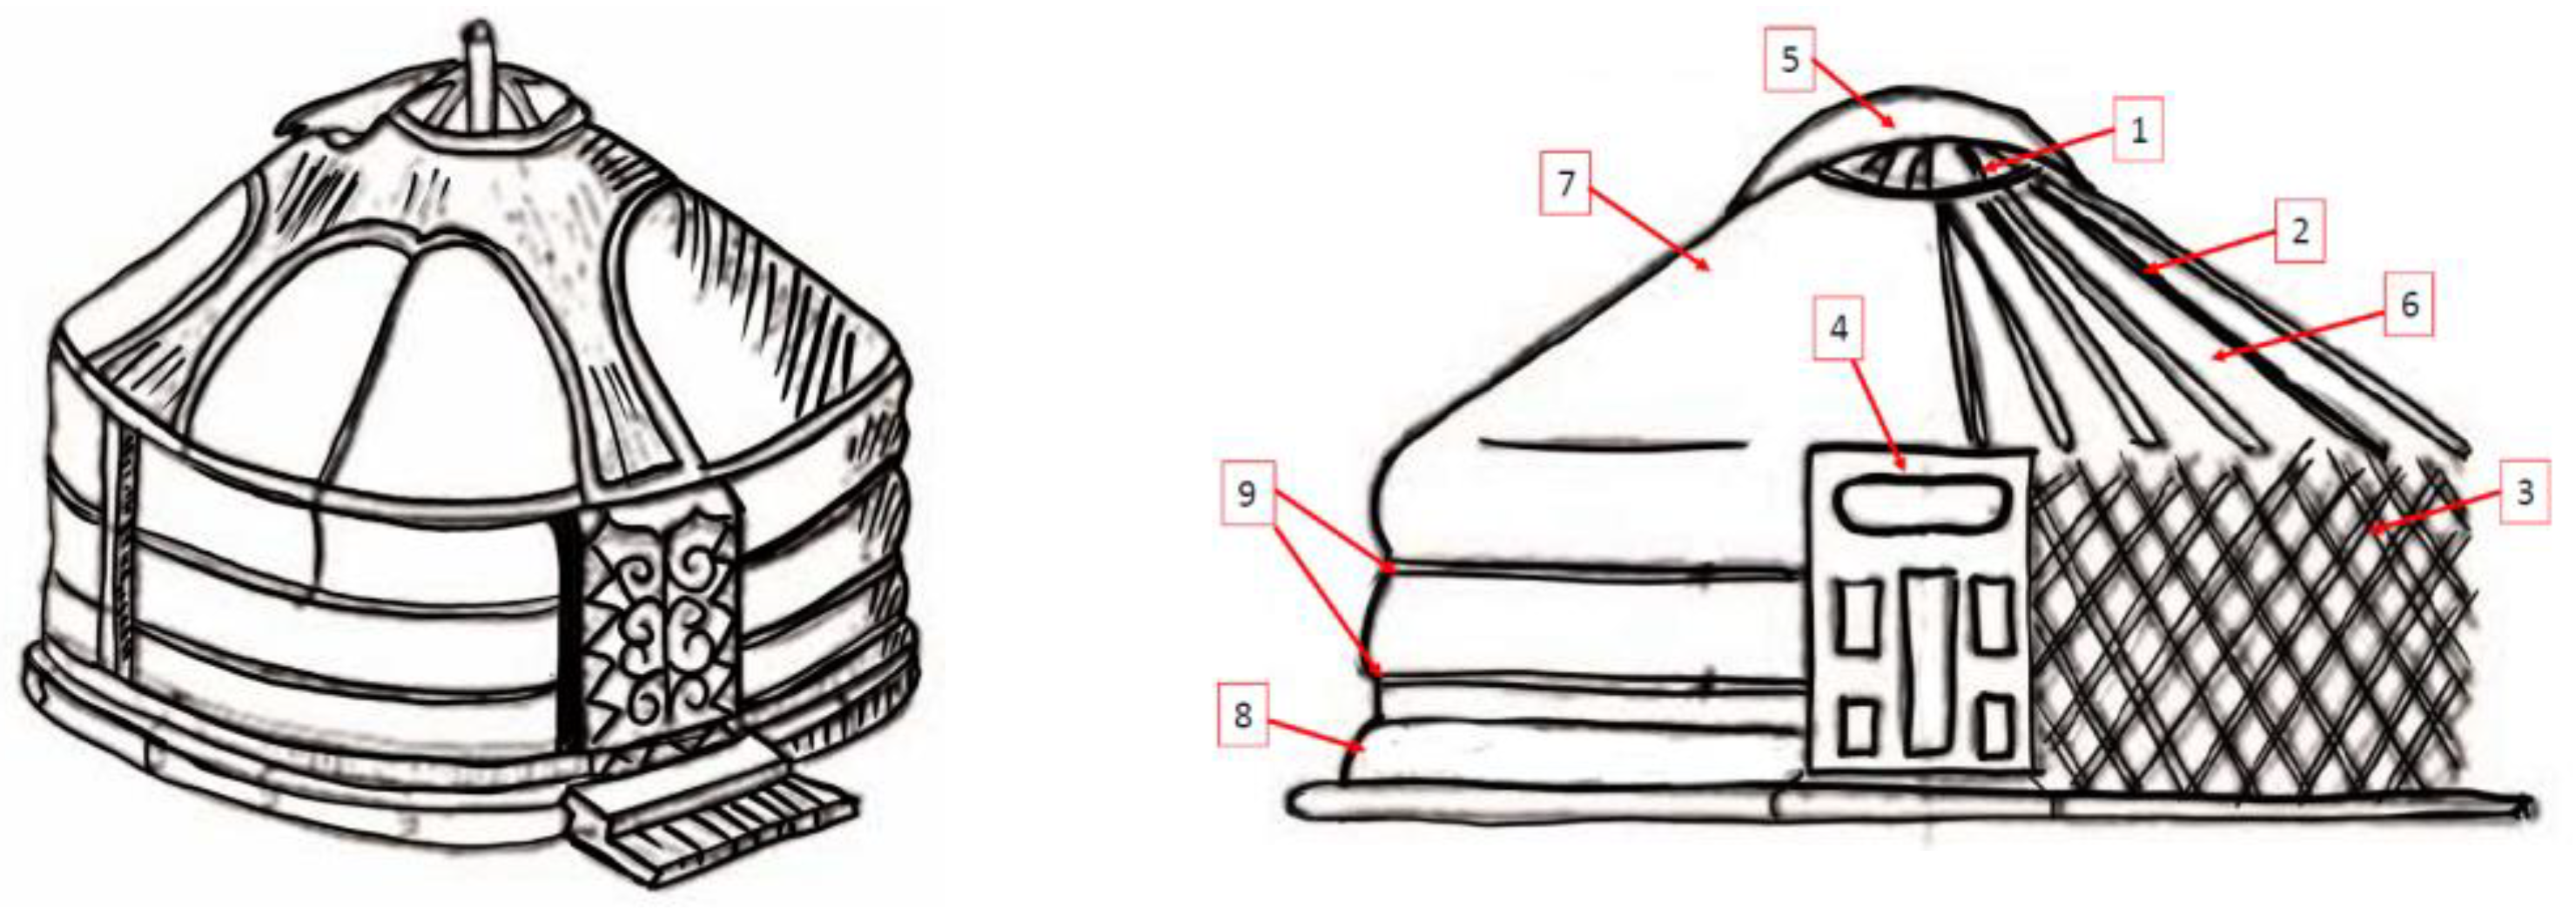
The yurt’s structure, materials, and operations have not been changed significantly since ancient times [1,11]. As described, inter alia, by Salvalai et al. [20] the traditional Mongolian yurt has a cylindrical wall and conical roof, and consists of a frame structure and insulating envelope. The framework has three main components: an upper crown wheel (Toono), crown supporting poles (Uni), and lattice walls (Khana). These three types of structural members are made of wood and form a reticulated shell structure that supports the envelope, Figure 1. The crown is a circular wooden wheel with radial arms, located at the top of the yurt; its main function is ventilation and lighting. The Uni poles connect the crown with the wall lattice. Those are usually long and slim wooden poles round or elliptical in shape. All the structural elements are connected by woollen ropes or mortise and tenon joints to form the yurt’s conical roof frame. The wall lattice is made by cross-bonding long slim wooden poles in form of diamond-shaped mesh, the intersection points being perforated and fixed with leather nails, Figure 2. The wall fragments are curved, rounded, and interconnected to form a cylindrical shape.
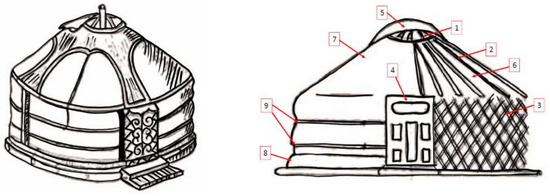
Figure 1.
Traditional elements of Mongolian Yurt. Wooden frame: 1. Toono-crown, 2. Uni-poles, 3. Walls, 4. Door. Felt cover: 5. Urkh, 6. Inside the felt roof, 7. Outside felt roof, 8. Khayaavch-felt or wooden boards closing off the lower edge of a yurt wall in winter, 9. Outside belt.
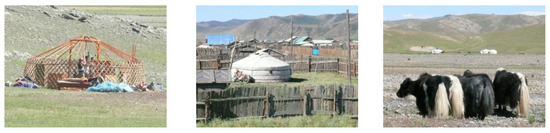
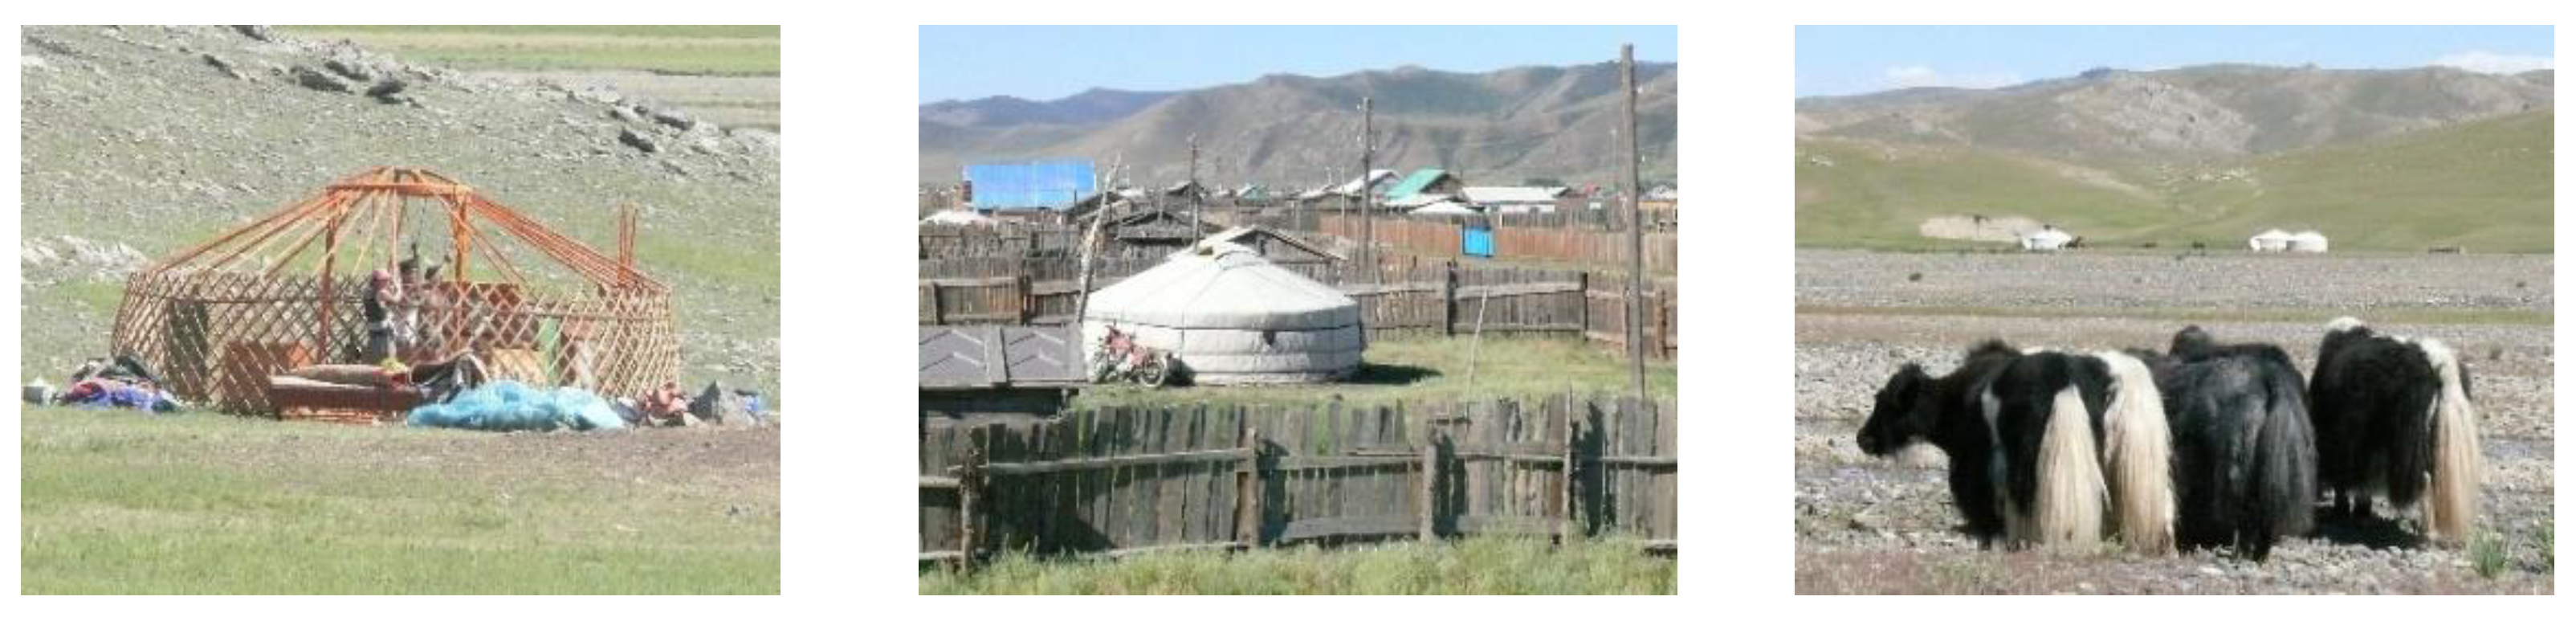
Figure 2.
Original Mongolian Yurt: (Photographs taken by Piotr Śliwiński during his expedition to Mongolia in 2008).
3.2. The Yurt Tested in Poland
The subject of research conducted at the Cracow University of Technology is a modified Mongolian yurt, transferred to Central European climate conditions.
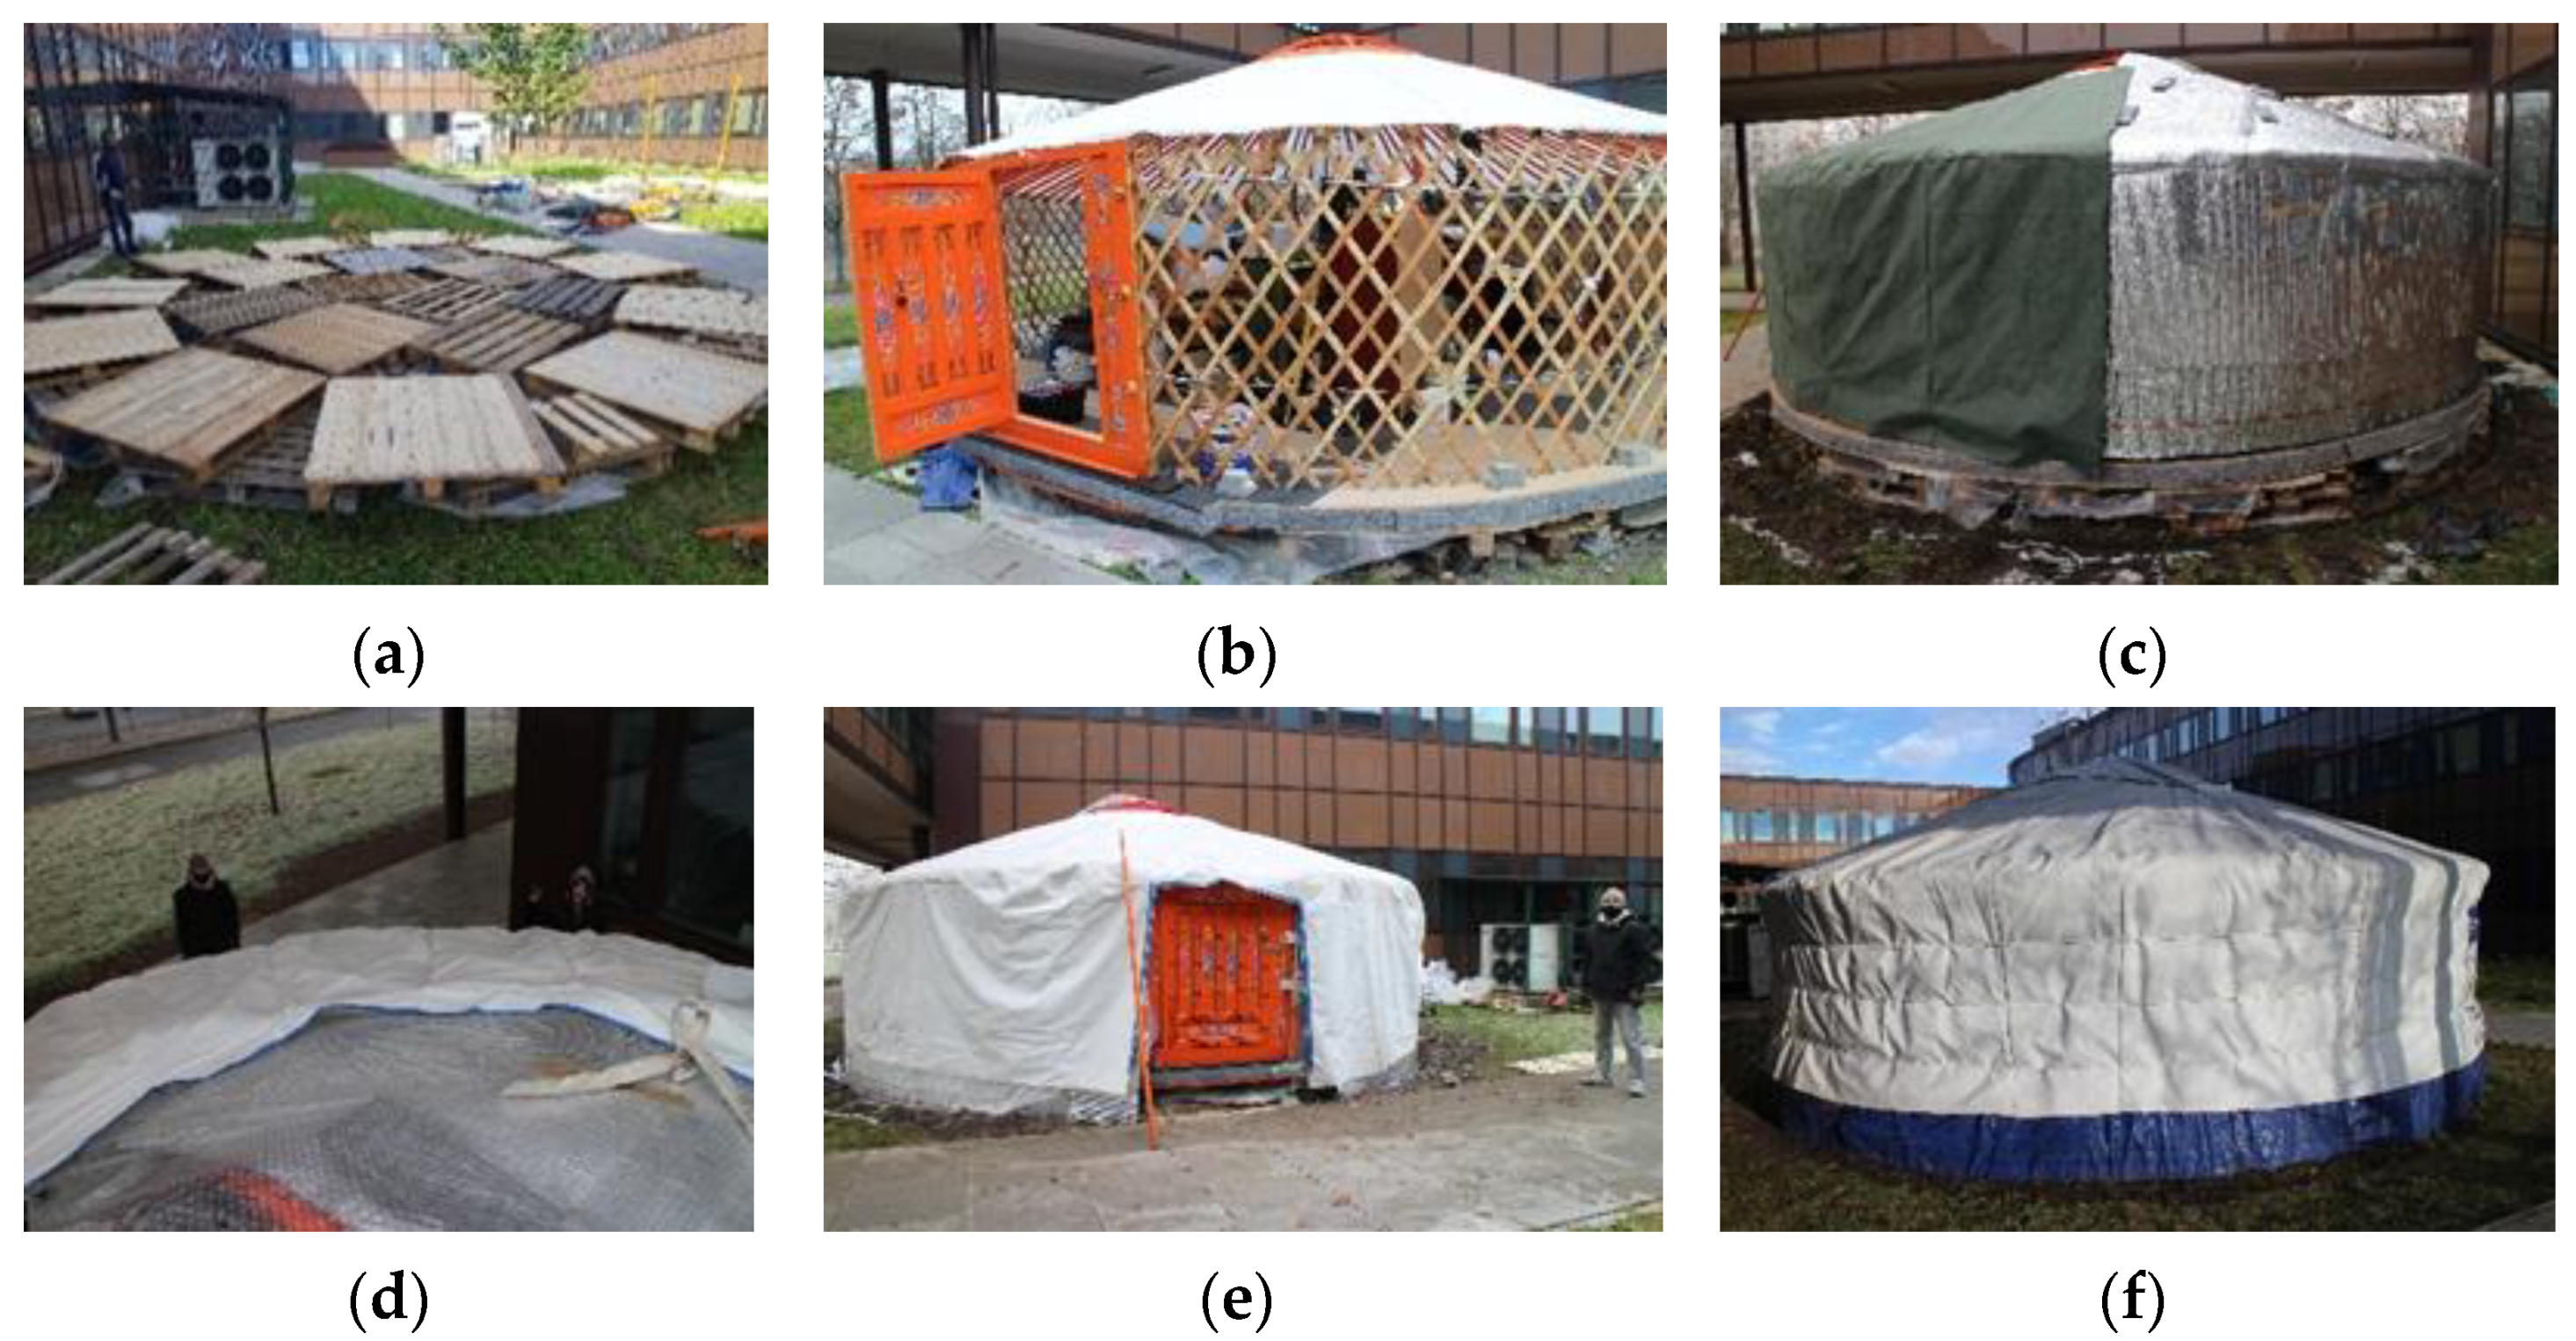
Its structure consists of the top wooden crown, wooden lattice wall and two supporting poles. Construction works were carried out mainly by Piotr Śliwiński with a little help from Mongolian students living in Cracow. The original wooden structure of the yurt remained unchanged. However, the whole yurt was placed not directly on the ground, but upon a structure made of wooden pallets, later insulated with Termo Organika expanded polystyrene panels. The original insulation of walls, made of natural felt was removed and replaced with thermal insulation Aluthermo, based on aluminum films and PE foam in-between, with spacer strips of polystyrene on the walls and the roof. Thermal insulation was covered from the outside with waterproof tarpaulin (green), bubble foil wrap and white protective synthetic material, Figure 3.
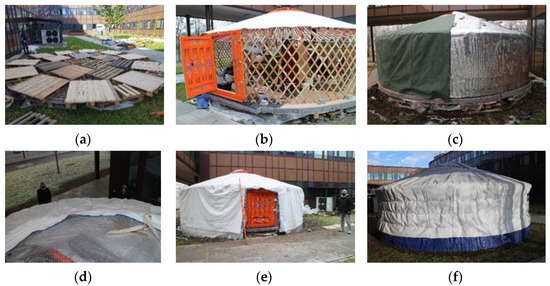
Figure 3.
The materials used in the yurt tested in Cracow, Poland (photographs taken by Piotr Śliwinski during construction of Mongolian yurt in Cracow in 2020). (a) wooden pallets supporting yurt; (b) walls of the yurt and the first internal layer, white fabric; (c) the second layer, aluminum films with PE foam and spacer strips of polystyrene, the third layer green tarpaulin; (d) fourth layer, bubble foil; (e) the fifth layer, white protective synthetic material; (f) final view of modified yurt.
The measurements of yurt geometry were conducted by means of the Creaform-HandySCAN Academy portable optical coordinate system and the VX Elements software with an accuracy of 0.1 mm, Figure 4. The system projects the code with the use of structured light onto the measuring object and reads the data in the form of a “point cloud”. Due to the size of the yurt, markers allowing for more precise adjusting of scans were also used. The results were exported to the validated metrology software and the volume inside the yurt was calculated.
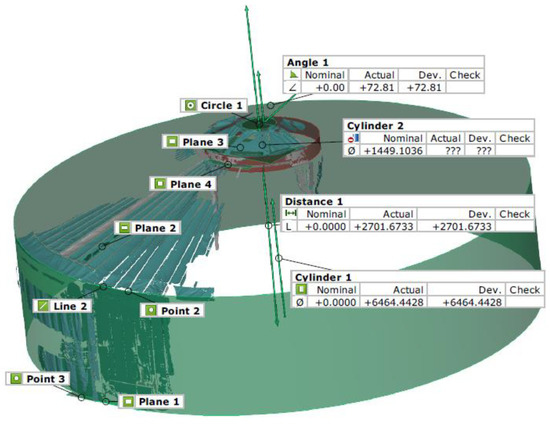
Figure 4.
Measurement of the yurt’s volume using Creaform-HandySCAN Academy. Total floor area of the tested yurt is equal to 31.24 m2 and its internal volume (above the elevated floor) is 54.68 m3.
3.3. Ventilation of Internal Space
The typical gravitational ventilation system supplies fresh air and removes contaminated and humid air directly to and from the internal environment. Too low rate of air exchange can negatively affect the inside air quality and people’s health while too high ventilation rate results in excess energy losses. Ventilation (that is, intentional air exchange) should be considered in conjunction with infiltration (that is, a natural effect of air transfer due to pressure difference between external and internal environment). In case of gravitational ventilation, where usually exhaust ducts only are organized, fresh air supply is provided by the uncontrolled infiltration rate through the cracks and leaks in building external envelope. In the case of the tested yurt, its lightweight envelope consists of several fabric layers and reflective foil insulation, supported by the wooden skeleton structure. Due to the presence of aluminum reflective foil, general air tightness of the external envelope is high. Potential leaks may appear at the joints of individual strips of foil, joints between the wall and the floor, around the roof window, and the door. Thus, air tightness of external building shell is a key factor of ventilation intensity and finally internal air quality.
The efficiency of air exchange can be evaluated by means of gas tracing method. One of the gases which may be used as a medium in those measurements is carbon dioxide. The CO2 generated by users can be treated as the tracer gas. This kind of approach makes the tests simpler and cheaper as no artificial gas emitters are required. Gas tracing measurement with CO2 allows for simultaneous evaluation of ventilation efficiency, building airtightness and also, partially, air quality. Such an approach to the problem was suggested by Persily [21], who presented some techniques to evaluate the building ventilation efficiency and indoor air quality analyzing carbon dioxide concentration within the internal space. Bulinska [22] used metabolically generated carbon dioxide to determine efficiency of ventilation systems in the buildings. Zhang [23] and Nowak-Dzieszko [24] used the same method while testing the ventilation rates of dormitories and offices. Benedettelli [25] and Cichowicz [26] used CO2 to measure ventilation intensity in the university facilities. All those measurements were conducted using gas tracer concentration decay method. The methodology of measurements, initially introduced by Sherman [27], was described in the ISO standard EN 12,569 [28]. It is based on the experimental measurements of natural decay of concentration of a tracer gas mixed with the internal air. This method was also used by the authors to check air exchange rate in the modified Mongolian yurt.
3.4. Internal Air Quality (IAQ)
In the previous chapter, attention was drawn to the possibility of using carbon dioxide as a trace gas to measure ventilation intensity, while the concentration of carbon dioxide in the air is also one of the very important aspects of indoor air quality. Polish governmental recommendations do not specify acceptable concentrations of carbon dioxide in rooms intended for permanent residence while the permissible levels of carbon dioxide are defined in the European standards and commonly used US requirements of American National Standards Institute (ANSI), American Society of Heating, Refrigerating and Air-Conditioning Engineers (ASHRAE) [29], and American Society for Testing and Materials (ASTM) [30]. According to those requirements the upper level of carbon dioxide concentration in spaces for permanent residence of people should not exceed 1000 ppm. To keep this requirement ca. 27 m3/h of fresh air per person should be supplied per hour [29]. The analyzed yurt is being used permanently so the same standards were used for evaluation of internal CO2 concentration in this case.
In every enclosed space where a human resides, the concentration of carbon dioxide increases due to depletion of the oxygen due to process of breathing. The carbon dioxide concentration in exhaled air is about 40,000 ppm [30]. However, the exact amount of CO2 produced by human body may differ depending on its weight and level of metabolic activity [29,30].
The CO2 exhaled stream is related to the amount of oxygen consumed. The amount of oxygen consumed by one person, m3/h, can be determined from the Equation (1) [28]:
where:
AD—DuBois surface (surface of human body), [m2]
M—metabolic rate, [met], (1 met is equal to 58.2 W/m2)
Rq—a respiratory quotient, [-]
Respiratory quotient can be assumed depending on the intensity of performed activity. The DuBois surface area can be taken as 1.8 m2 for an average adult person. In building design, however, it is convenient to adopt averaged standard values. The European standard EN-16798-3 [31] assumes that the indicative CO2 emission is equal to 20 L/(h per person). This value will be taken as a standard in further calculations.
Permissible levels of carbon dioxide in non-residential spaces are regulated by the standard EN 16798-3 [31]. It introduces four acceptable levels of carbon dioxide concentration depending on the selected level of indoor air quality. The Table 1 shows the permissible values of the carbon dioxide concentration according to the air quality category. As there are no specific standards describing yurt as a living space, the authors used the permissible values given in this standard in the evaluation of indoor air quality.

Table 1.
Permissible values for carbon dioxide concentration to the air quality category, acc. to standard EN 16798-3 [31].
So, if the standard CO2 emission was assumed as 20 l/(h per person), then to maintain the medium air quality (absolute concentration below 1000 ppm) in the yurt with single user, a continuous supply of 33.3 m3/h of external air is needed. External CO2 concentration was taken here as 400 ppm.
3.5. Measurement Methods
Measurements with the gas tracing method, using metabolically generated carbon dioxide, were conducted using 5 Rotronic CP11 m allowing the continuous measurements and registration of CO2 concentration, temperature and relative humidity. Recordings were taken every ten minutes. CO2 measurement precision was ±30 ppm.
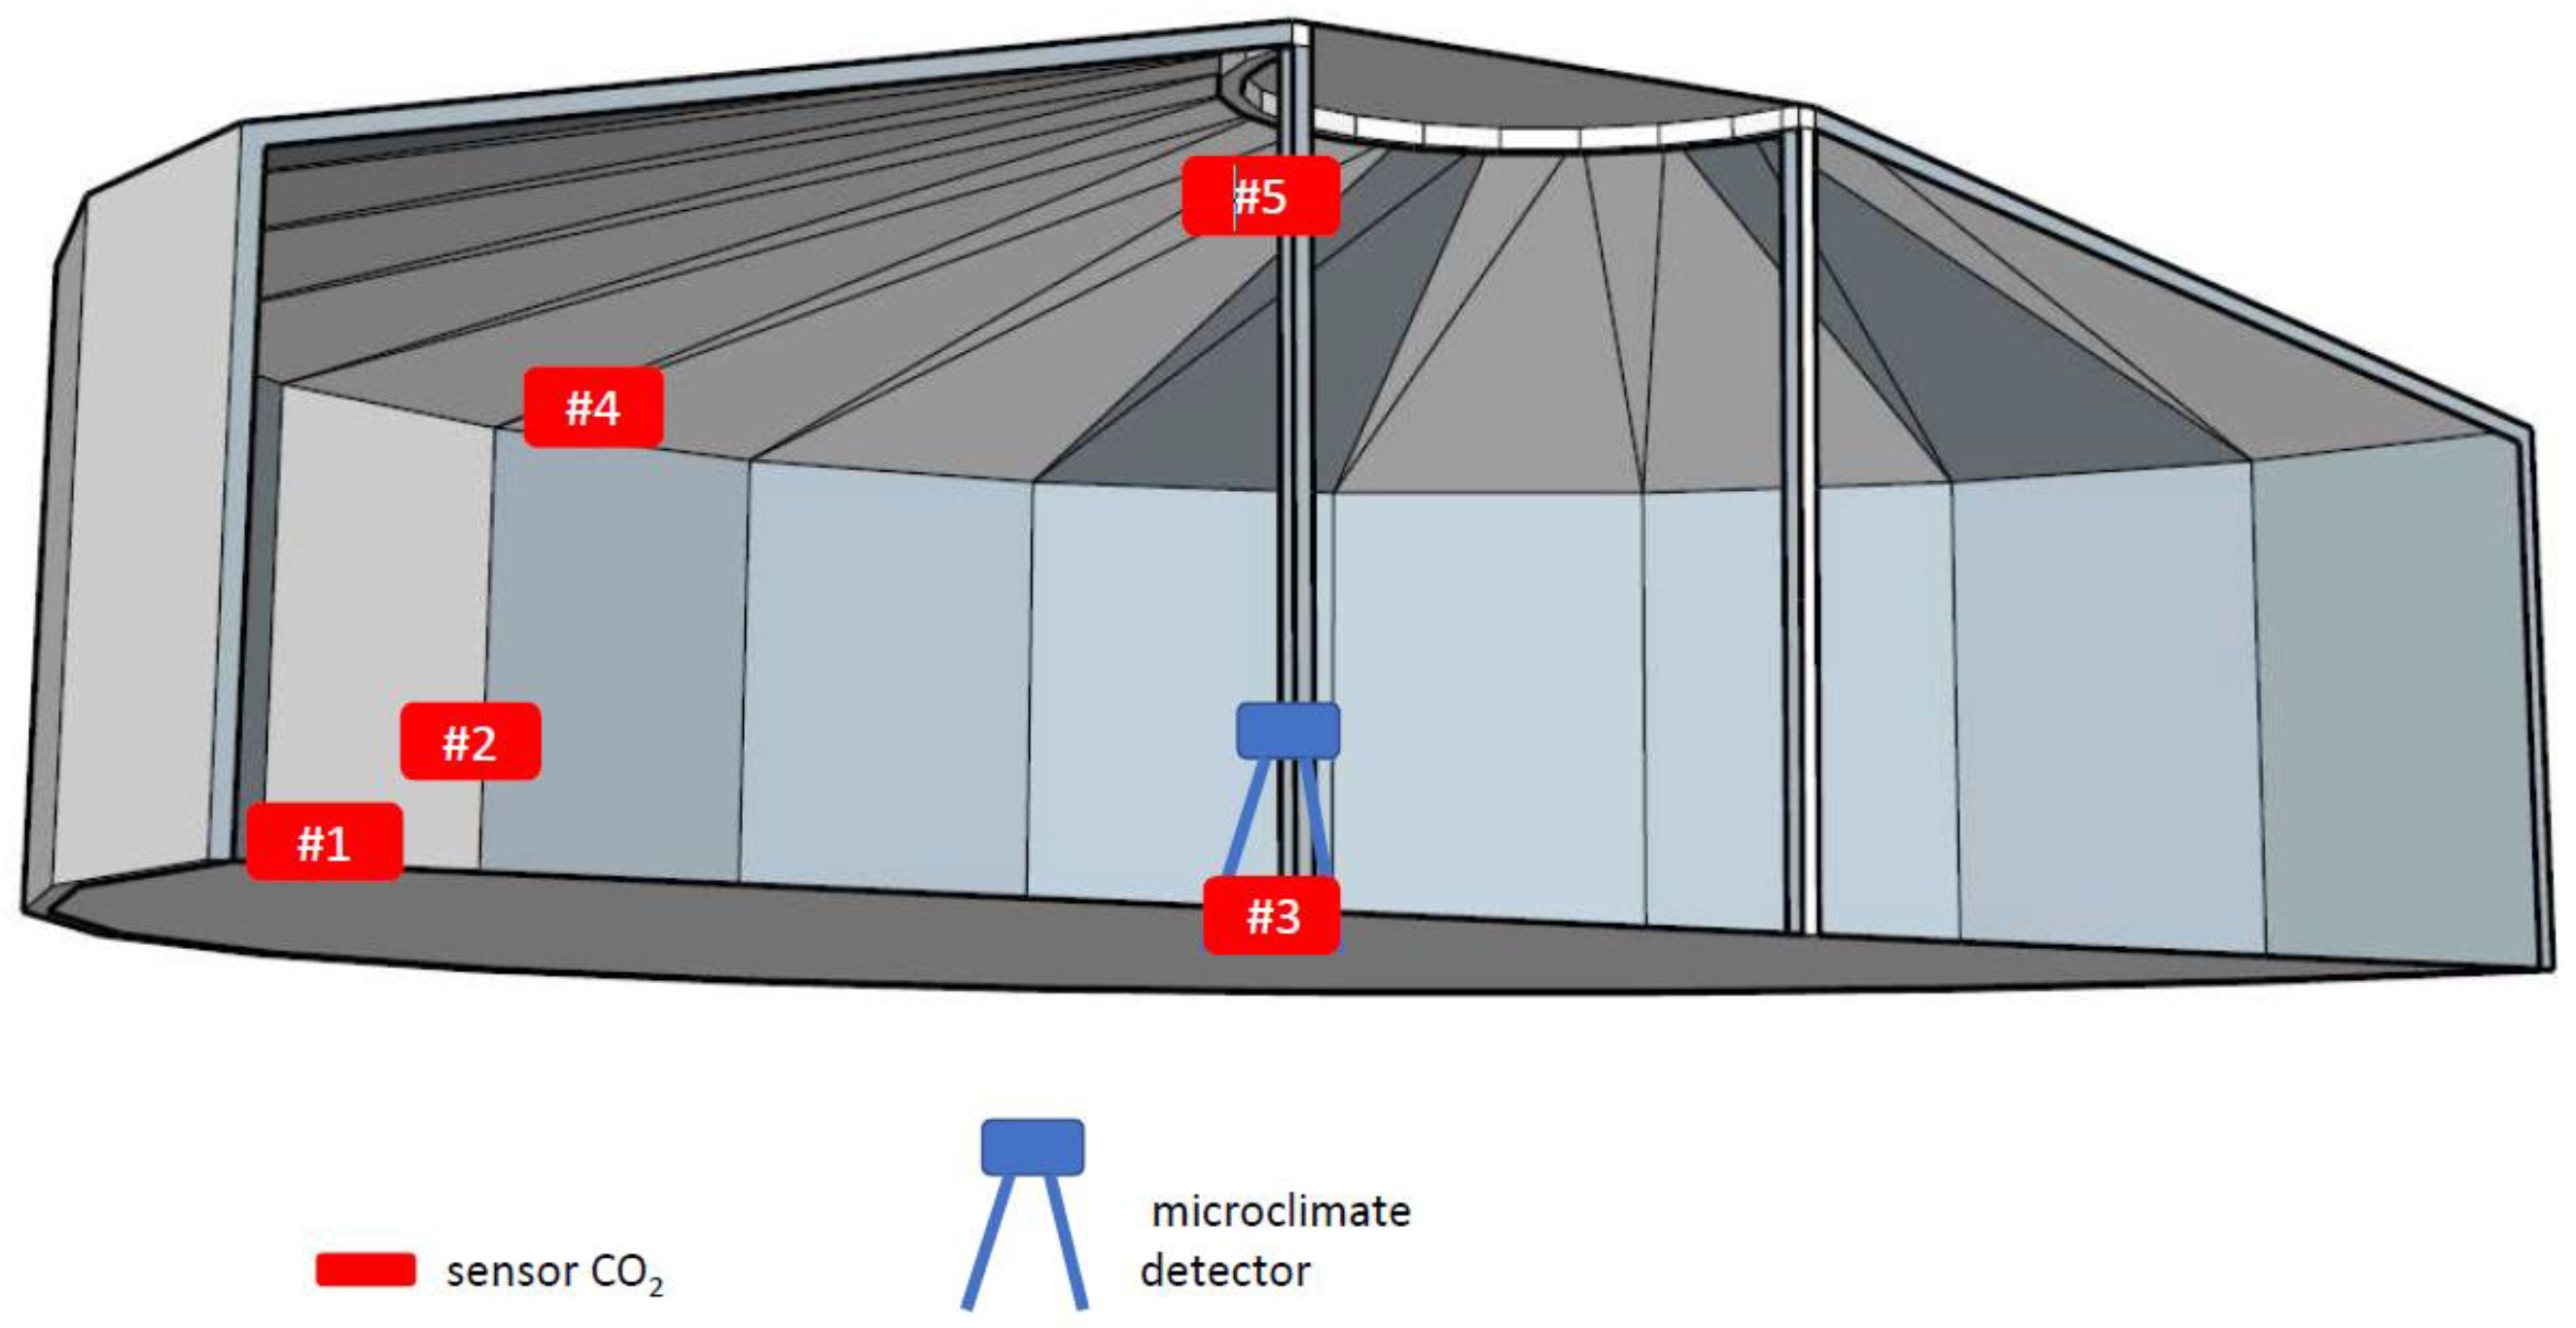
Tests were conducted between 14 January and 11 February 2021. The simultaneous measurements of CO2, temperature and humidity have been conducted. The detectors were located in different places of the tested space, which allows for the evaluation of spatial distribution of CO2 and fluctuations of the momentary concentration within the internal space. Description of sensors’ locations was presented in Table 2 and shown in Figure 5 and Figure 6. Before performing the test all the sensors were calibrated in accordance with the manufacturer’s instruction.
Table 2.
Description of sensors’ locations.
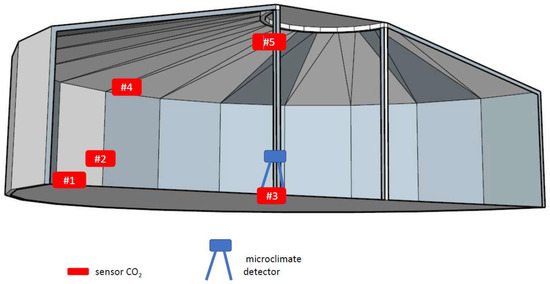
Figure 5.
CO2 sensor location map.
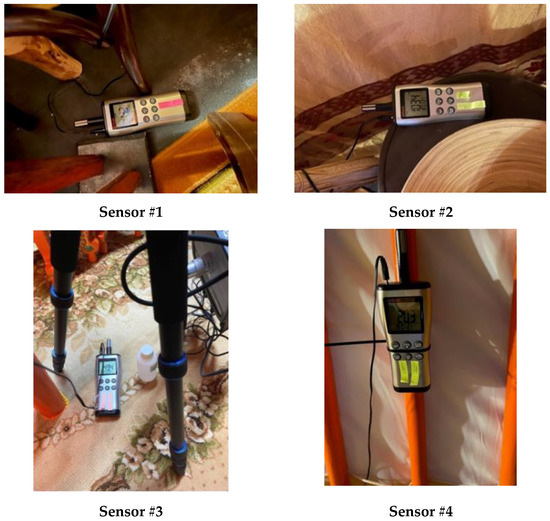
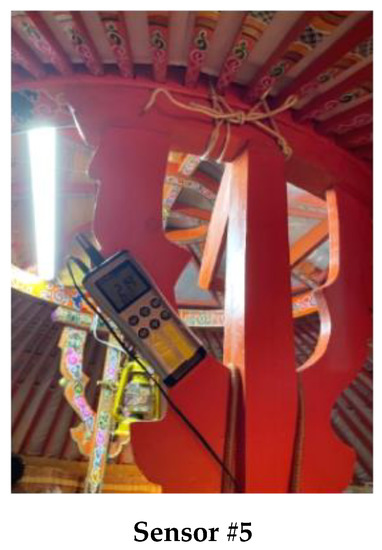
Figure 6.
Location of Rotronic measuring devices in the yurt.
The source of heat in the analyzed yurt is electrical heater which is not an internal source of contaminants including CO2. Typical Mongolian construction is heated by a wood fueled stove. Then the concentration of CO2 but also air change intensity driven by open flame would be much higher than in the analyzed object.
4. Testing Results
4.1. CO2 Concentration
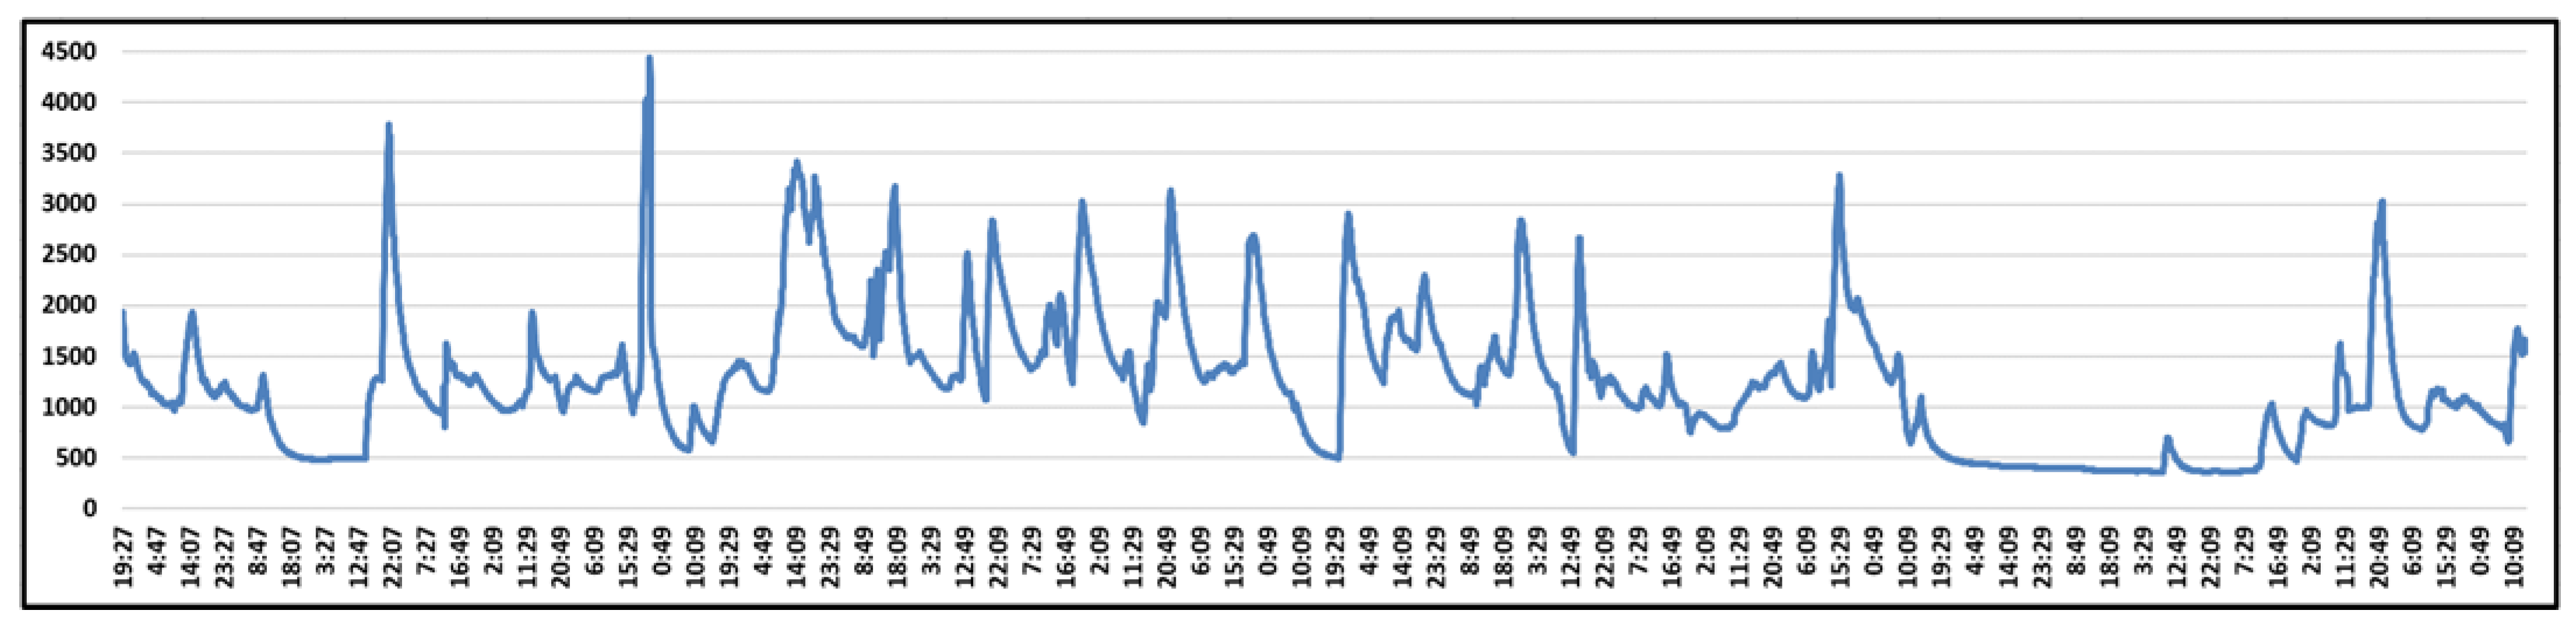
Figure 7 presents CO2 concentration within entire analyzed period of time averaged for all five sensors. These overall data show high level of variation and are closely affected by the usage way. For most of the time when yurt is occupied by users CO2 concentration exceeds the permissible level of 1000 ppm (black dashed line) at all sensors. Rapid concentration increase in the chart represents intensified usage conditions with increased number of users and extremely high CO2 concentration (even up to 4500 ppm).

Figure 7.
Average CO2 concentration in the yurt between 14 January and 11 February 2021.
Flat parts of diagram with the concentration close to the external one represents the periods when there was nobody in the yurt, for example between the 16th and 17th of January and between the 4th and 8th of February. Measurements were carried out for 27 days during winter season but only some representative periods were selected for further analysis to emphasize the observed phenomena. Analysis of CO2 concentration will be divided in two parts, the first one while yurt was occupied by users and the second part when users left and natural concentration decay of CO2 was observed.
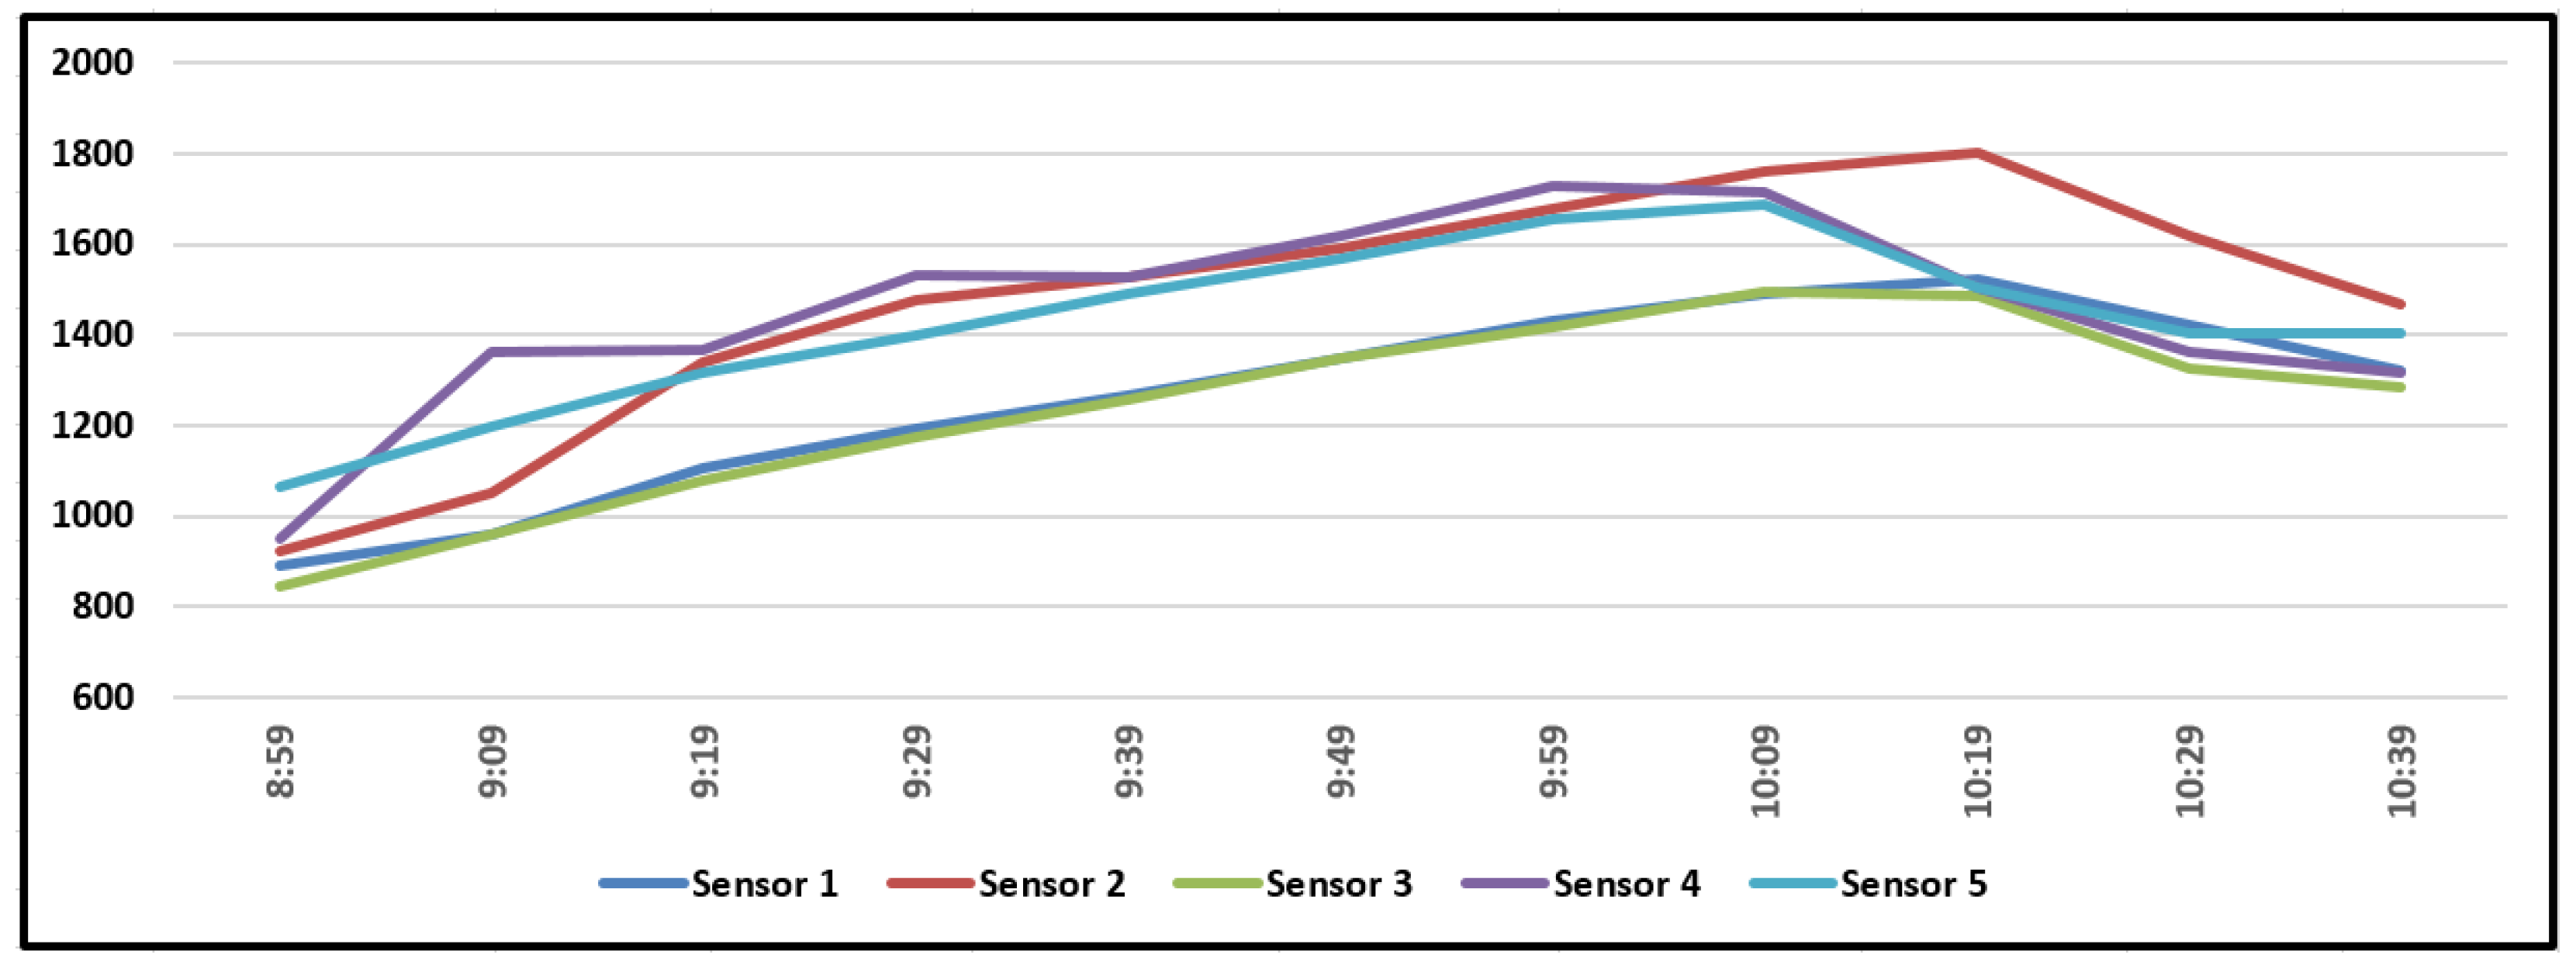
Figure 8 presents changes of CO2 concentration when yurt was occupied by three users for two and half hours. A sharp increase of carbon dioxide concentration can be observed. For all of the time CO2 concentration is at all sensors higher than 1000 ppm. However, there are significant differences in the values between the sensors. The lowest values are observed at two sensors located on the floor and the maximum value of 1800 ppm was measured next to the roof. In general, the higher momentary concentration values are observed at the sensors located closer to the users’ heads (i.e., CO2 emission sources). The height of the yurts near the walls is 1.75 m, at the top 3 m. The high concentration of CO2 in the upper part of the yurt, results from the location of the gas emission sources and a strong thermal stratification of internal air. Due to high thermal gradient in the yurt interior (from 7 up to 10 K), air mixing by convective phenomena is significantly weakened.
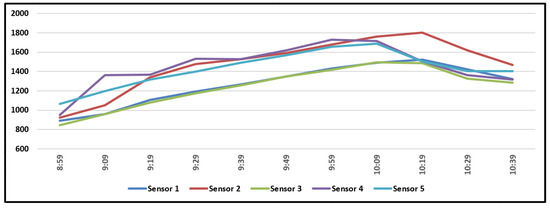
Figure 8.
CO2 concentration in the yurt between 9.00 am and 11.00 am on 9th of February 2021 with three users.
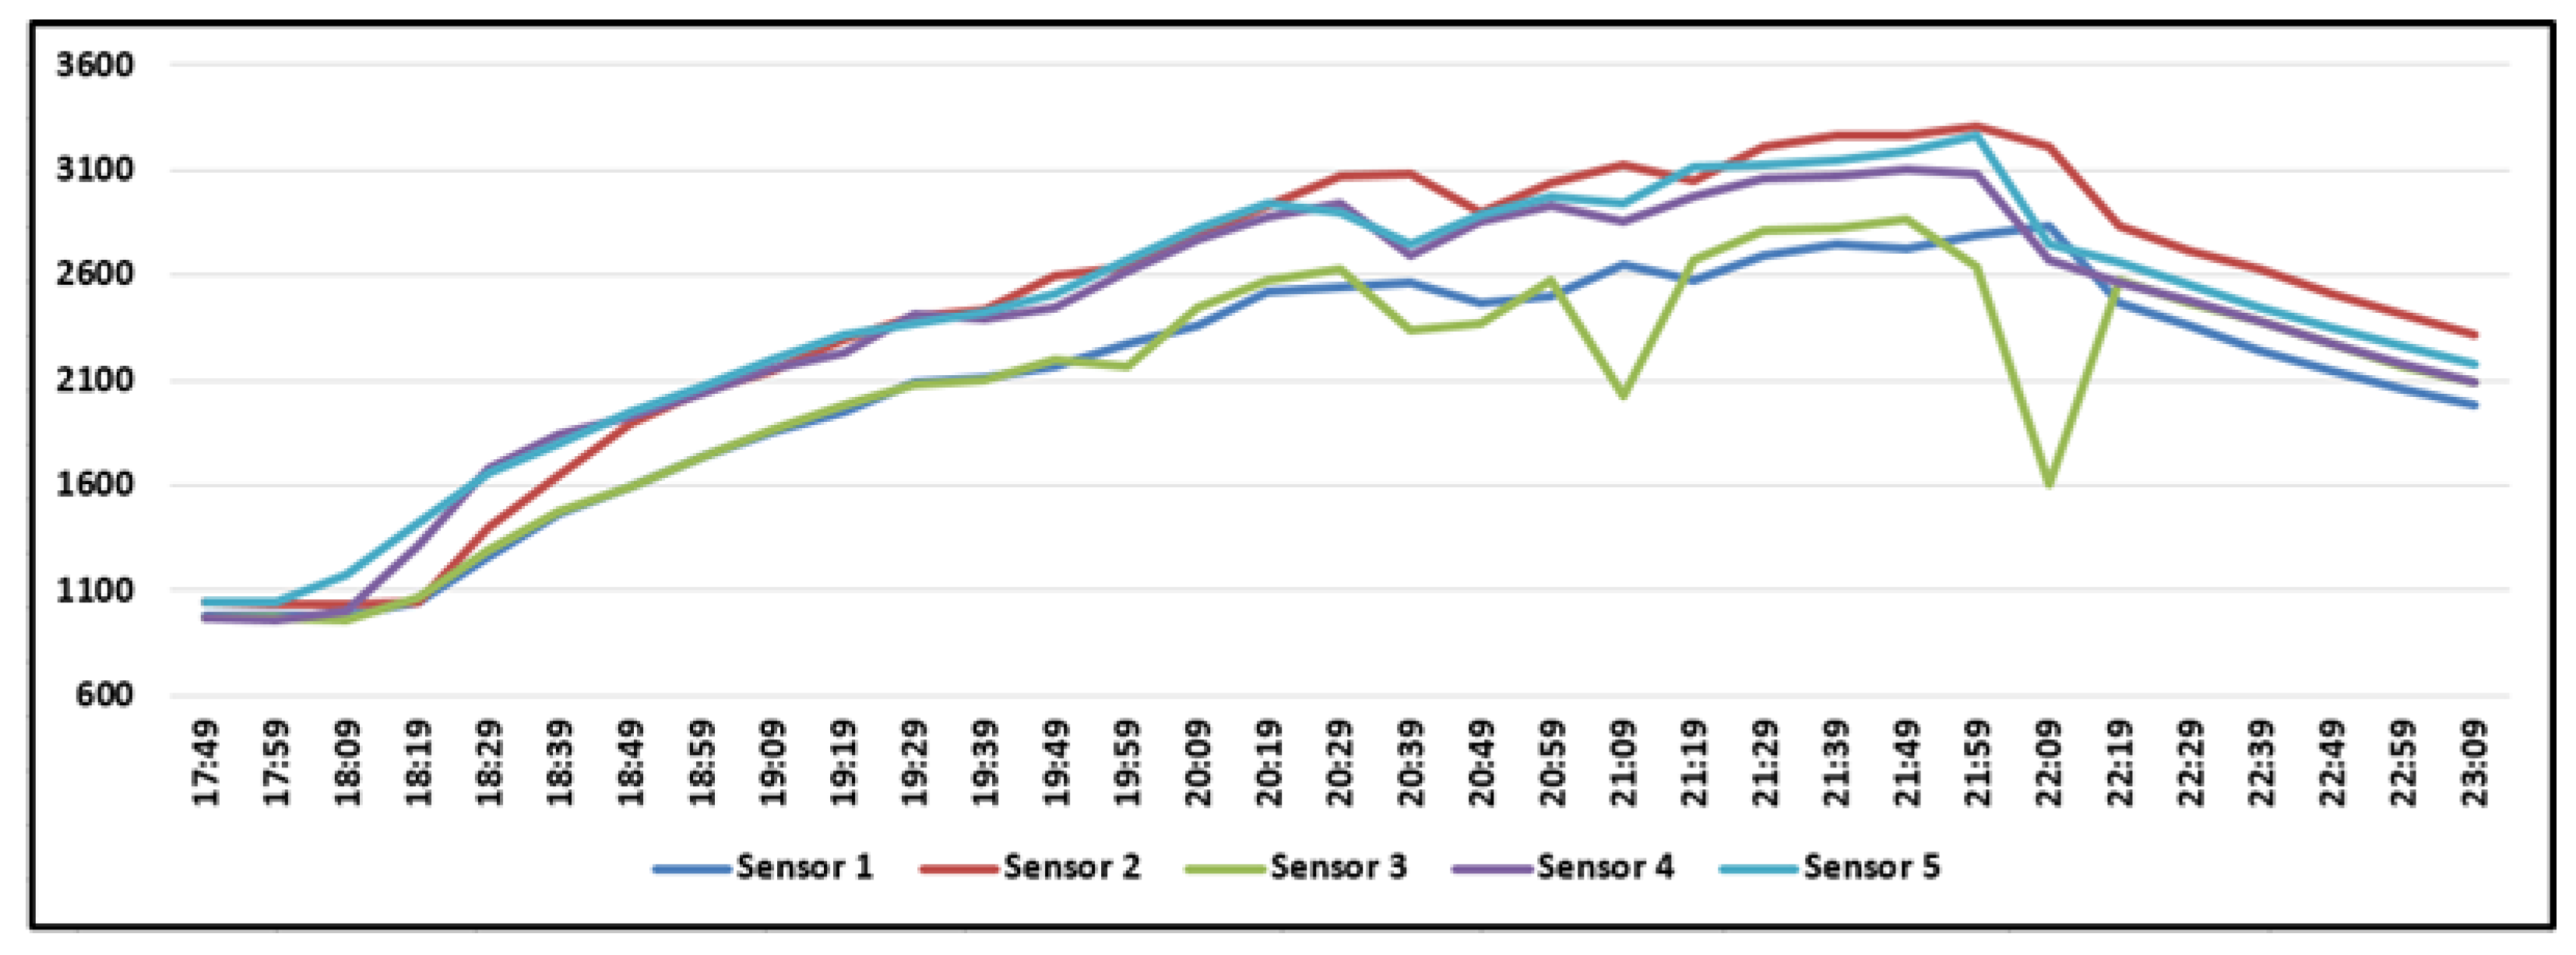
Figure 9 presents CO2 concentration when yurt was occupied by 5 users. In this case extremely high concentration was observed, exceeding even 3000 ppm. Such a high concentration must be no longer viewed in terms of comfort, but rather as a substantial health risk to users. Momentary drops of CO2 concentration at the floor (especially green curve i.e., sensor #3) are due to external door opening.
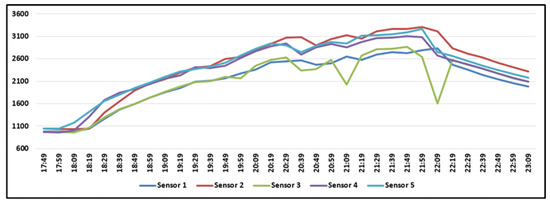
Figure 9.
CO2 concentration in the yurt between 6 pm and 11 pm on 9th of February 2021 with five users inside.
Based on the collected data the quality of internal air was classified. The external concentration of CO2 during entire measurement time was assumed at the level of 400 ppm. The levels of internal concentration of carbon dioxide in the analyzed period of time were described in Table 3. The readings, that were recorded while yurt was not occupied by users were not taken into consideration. Percentage share of concentration levels was based on the averaged values from five sensors.
Table 3.
Total concentration of CO2.
The comfort value of 1000 ppm [29] concentration is exceeded for 80% of occupation time. Per the classification of standard [31] that was presented in Table 1, the indoor air quality in tested yurt for 27.8% of analyzed time can be qualified as low (the worst defined in this standard category), which is very unsatisfactory result.
The high concentration of CO2 found in the above tests results from the insufficient intensity of air exchange in the tested object. In the next steps, attempts were made to determine the intensity of natural ventilation in the yurt.
4.2. Air Exchange Rate: Gas Tracing
Concentration decay data from representative periods were used to calculate the natural air flow rate by means of gas tracing method [28]. The example of CO2 concentration decay curve is presented in Figure 10.
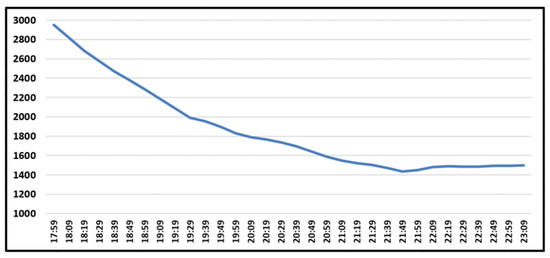
Figure 10.
CO2 concentration decay curve–23 January 2021
When using gas tracing method to determine the air exchange rate, the concentration of carbon dioxide in the whole tested zone should not differ by more than 10% of the mean concentration value [28]. For the calculation the decay curves meeting this requirement were chosen. In all the chosen periods of time this requirement was met. The gas tracing method, where carbon dioxide is applied as the tracing gas, can be used only when there is no one in the analyzed space.
The specific airflow rates were calculated separately for three representative days by means of a two-point decay method, Equation (2).
where:
N—time—mean specific airflow rate, [1/h]
t—time (t1: measurement start point, t2: measurement end point), [h].
The obtained results of measurements and calculations that have been conducted for the selected days are presented in Table 4.
Table 4.
Specific airflow rate calculations for different days.
The specific air flow rate is significantly affected by external climatic conditions that is why there are big differences between the values for different days. Unfortunately, local weather data collection was not possible in this time. According to the meteorological weather data, the outside air temperature during the three selected days was in the narrow range from 0 °C to 2 °C and the highest wind speed (10 km/h) was observed on February 4-th. For further considerations of the ventilation efficiency in the yurt, the averaged air change rate value of n = 0.25 1/h was assumed. This result was treated as a preliminary characteristic feature of this object in winter climate conditions. If the total internal volume of the yurt is 65.84 m3, then the average air change rate is equal to 16.46 m3/h. It is 50% lower than the rate (33.3 m3) required to maintain moderate concentration of CO2. Air change intensity rate needed to keep the assumed comfort conditions should be equal to 0.506 1/h.
4.3. Airtightness Pressure Test
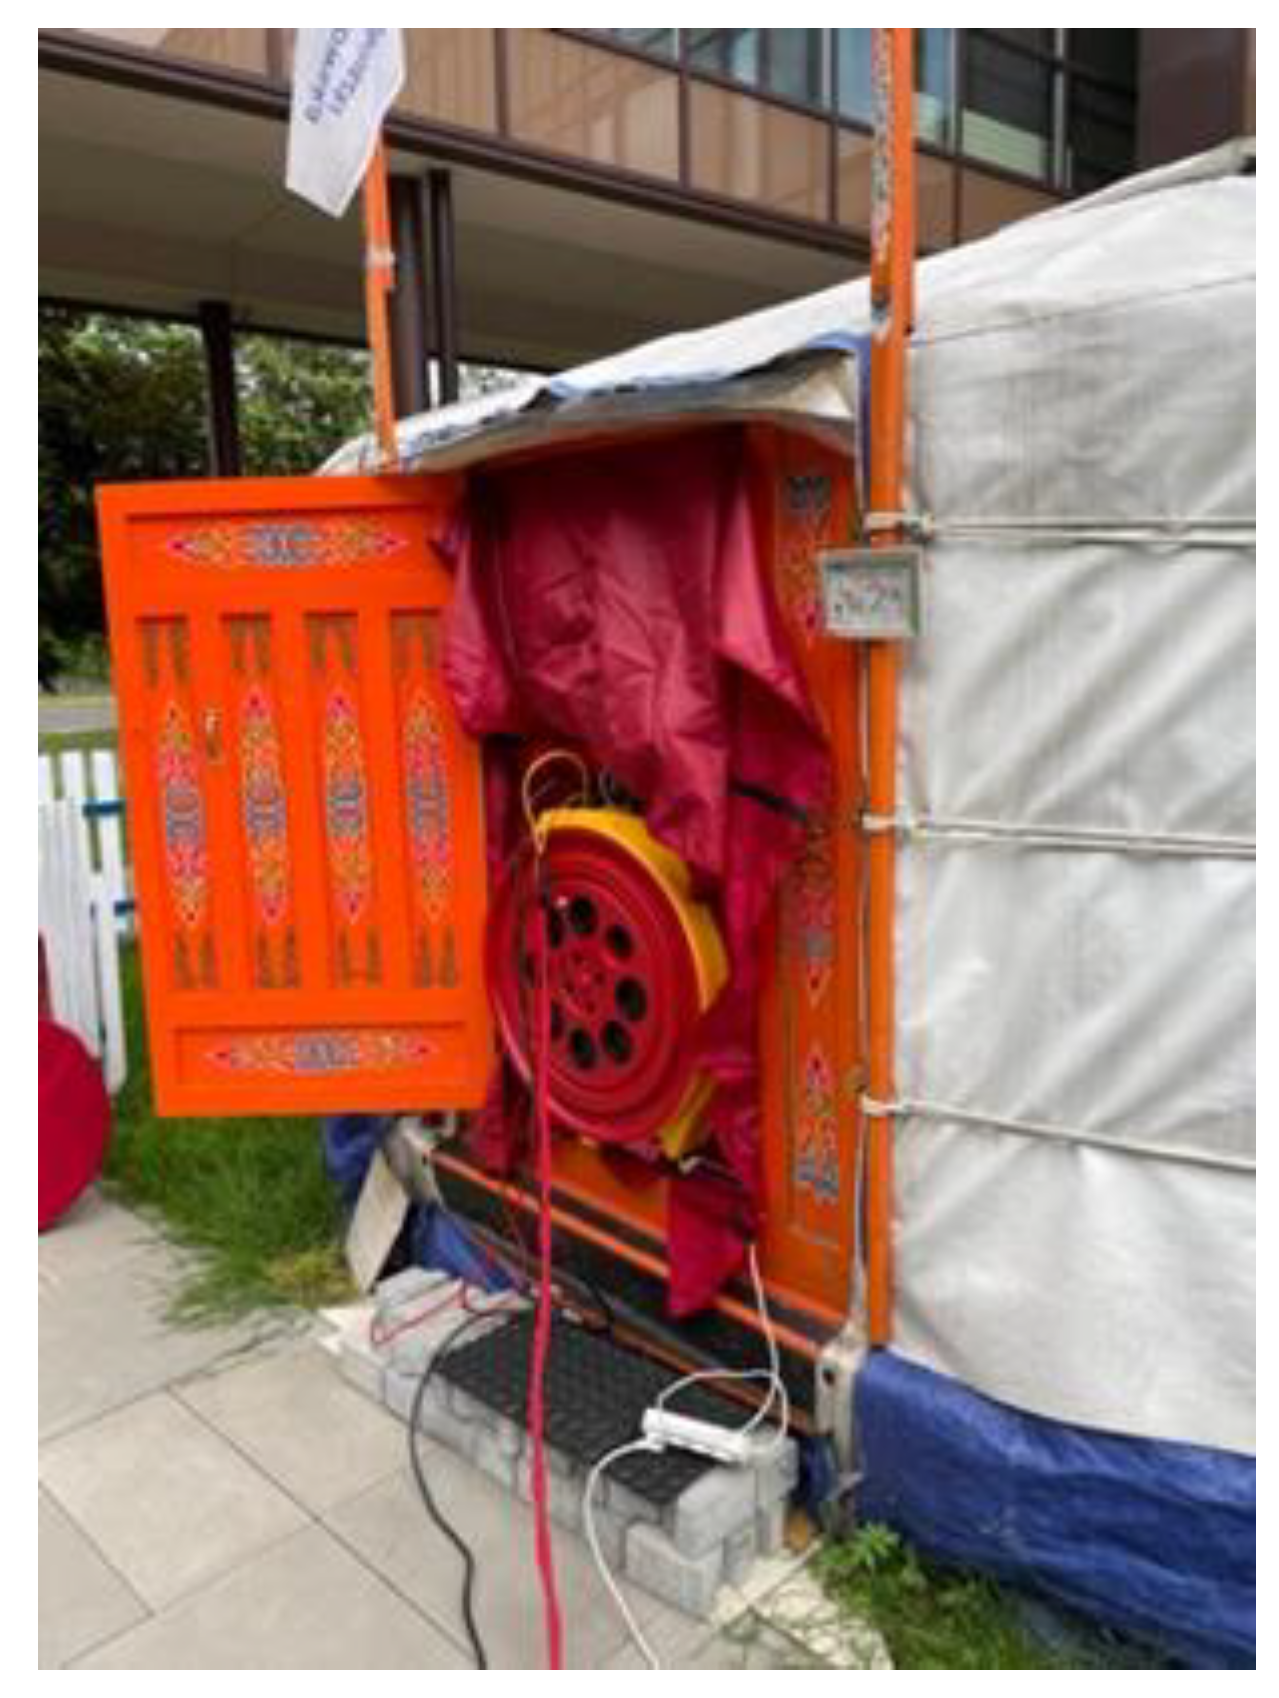
The airtightness of yurt envelope was measured using Blowerdoor fan with the digital controller Retrotec 3000 and Fantestic program to analyze test data. The measurements were conducted according to the standard EN 9972 [32]. The fan was installed in the doors, Figure 11, and all intentional openings in the building envelope such as roof windows were closed.

Figure 11.
Blower-door fan installed in the external door of yurt.
The measurements were conducted on the 2 July 2021, in the following weather conditions: external air temperature 21 °C, wind speed in Beaufort scale based on the own observation equal to 1, air temperature inside the yurt 21 °C.
Based on the results of test conducted in pressurization state the n50 coefficient describing the number of air changes per hour at 50 Pa pressure difference was determined. For the analyzed yurt it was equal to 14.6 h−1 for overpressure test and 8.0 h−1 for under-pressure test. The obtained results suggest a very low infiltration tightness of the facility. However, in the case of light yurt structure, the significant pressure change during the tests could cause unsealing of the connections of fabric or foil strips and an intense air flow that does not occur under average climate conditions [33]. Additionally, the huge difference between both results evidently indicates a sharp change in the tightness under overpressure conditions.
An approximate way of transition from pressure method to actual air change in time averaged real conditions was included in EN 13,789 [34]. According to this simplified approach the actual air exchange rate can be calculated from Equation (3):
n = n50/20 [1/h]
In case of the obtained pressure test result, it makes n = 0.73 and 0.4 1/h for both results, while the previously evaluated air change rate, based on measurements with gas tracing method, was equal to 0.25 1/h. So, the values obtained from the two independent testing methods are significantly different. Airtightness pressure test and the above simplified transition to normal atmospheric conditions is not suitable for this specific object.
5. Energy plus Simulation Results and Discussion
The Energy Plus program via the Design Builder interface was used to simulate the energy transfer and air exchange in the yurt. The detailed simulation allows for the analysis of the dynamic response of the object’s components and installations to external and internal environment changes, including air infiltration. For this purpose, a geometric model of the yurt and a detailed description of its external shell structure was prepared and the local weather data, available in form of an Energy Plus weather file, were selected [35].
The initially calculated value of air change rate 0.25 1/h was introduced as the basic parameter characterizing the yurt’s envelope. It was assumed that in the simulated cold part of the year (from January to April) roof window is firmly closed and even covered with snow, as it was observed during testing period, and air change is based on infiltration solely. According to Energy Plus documentation [36], infiltration is understood as the flow of air from the outdoor environment directly into a thermal zone. Infiltration is generally caused by the unintended openings and cracks. In the simple simulation model, called ‘infiltration design flow rate’, the user defines a characteristic air flow rate in simulated object, that is modified by momentary climate conditions. The BLAST set of modifying coefficients was selected for simulation, so the obtained results were in fact sensitive to temperature difference and wind speed. This simple infiltration model assumes a uniform and constant temperature throughout the entire volume of the analyzed object. This assumption obviously differs from the measured conditions in the yurt, a significant thermal stratification and fluctuations over time were observed in the tested space. For the simulation, a constant value of internal air temperature equal to +18 °C was assumed, as an electric heater setting, while the measured temperature changes during the user’s presence ranged from +14 °C to +25 °C, depending on considered period and height.
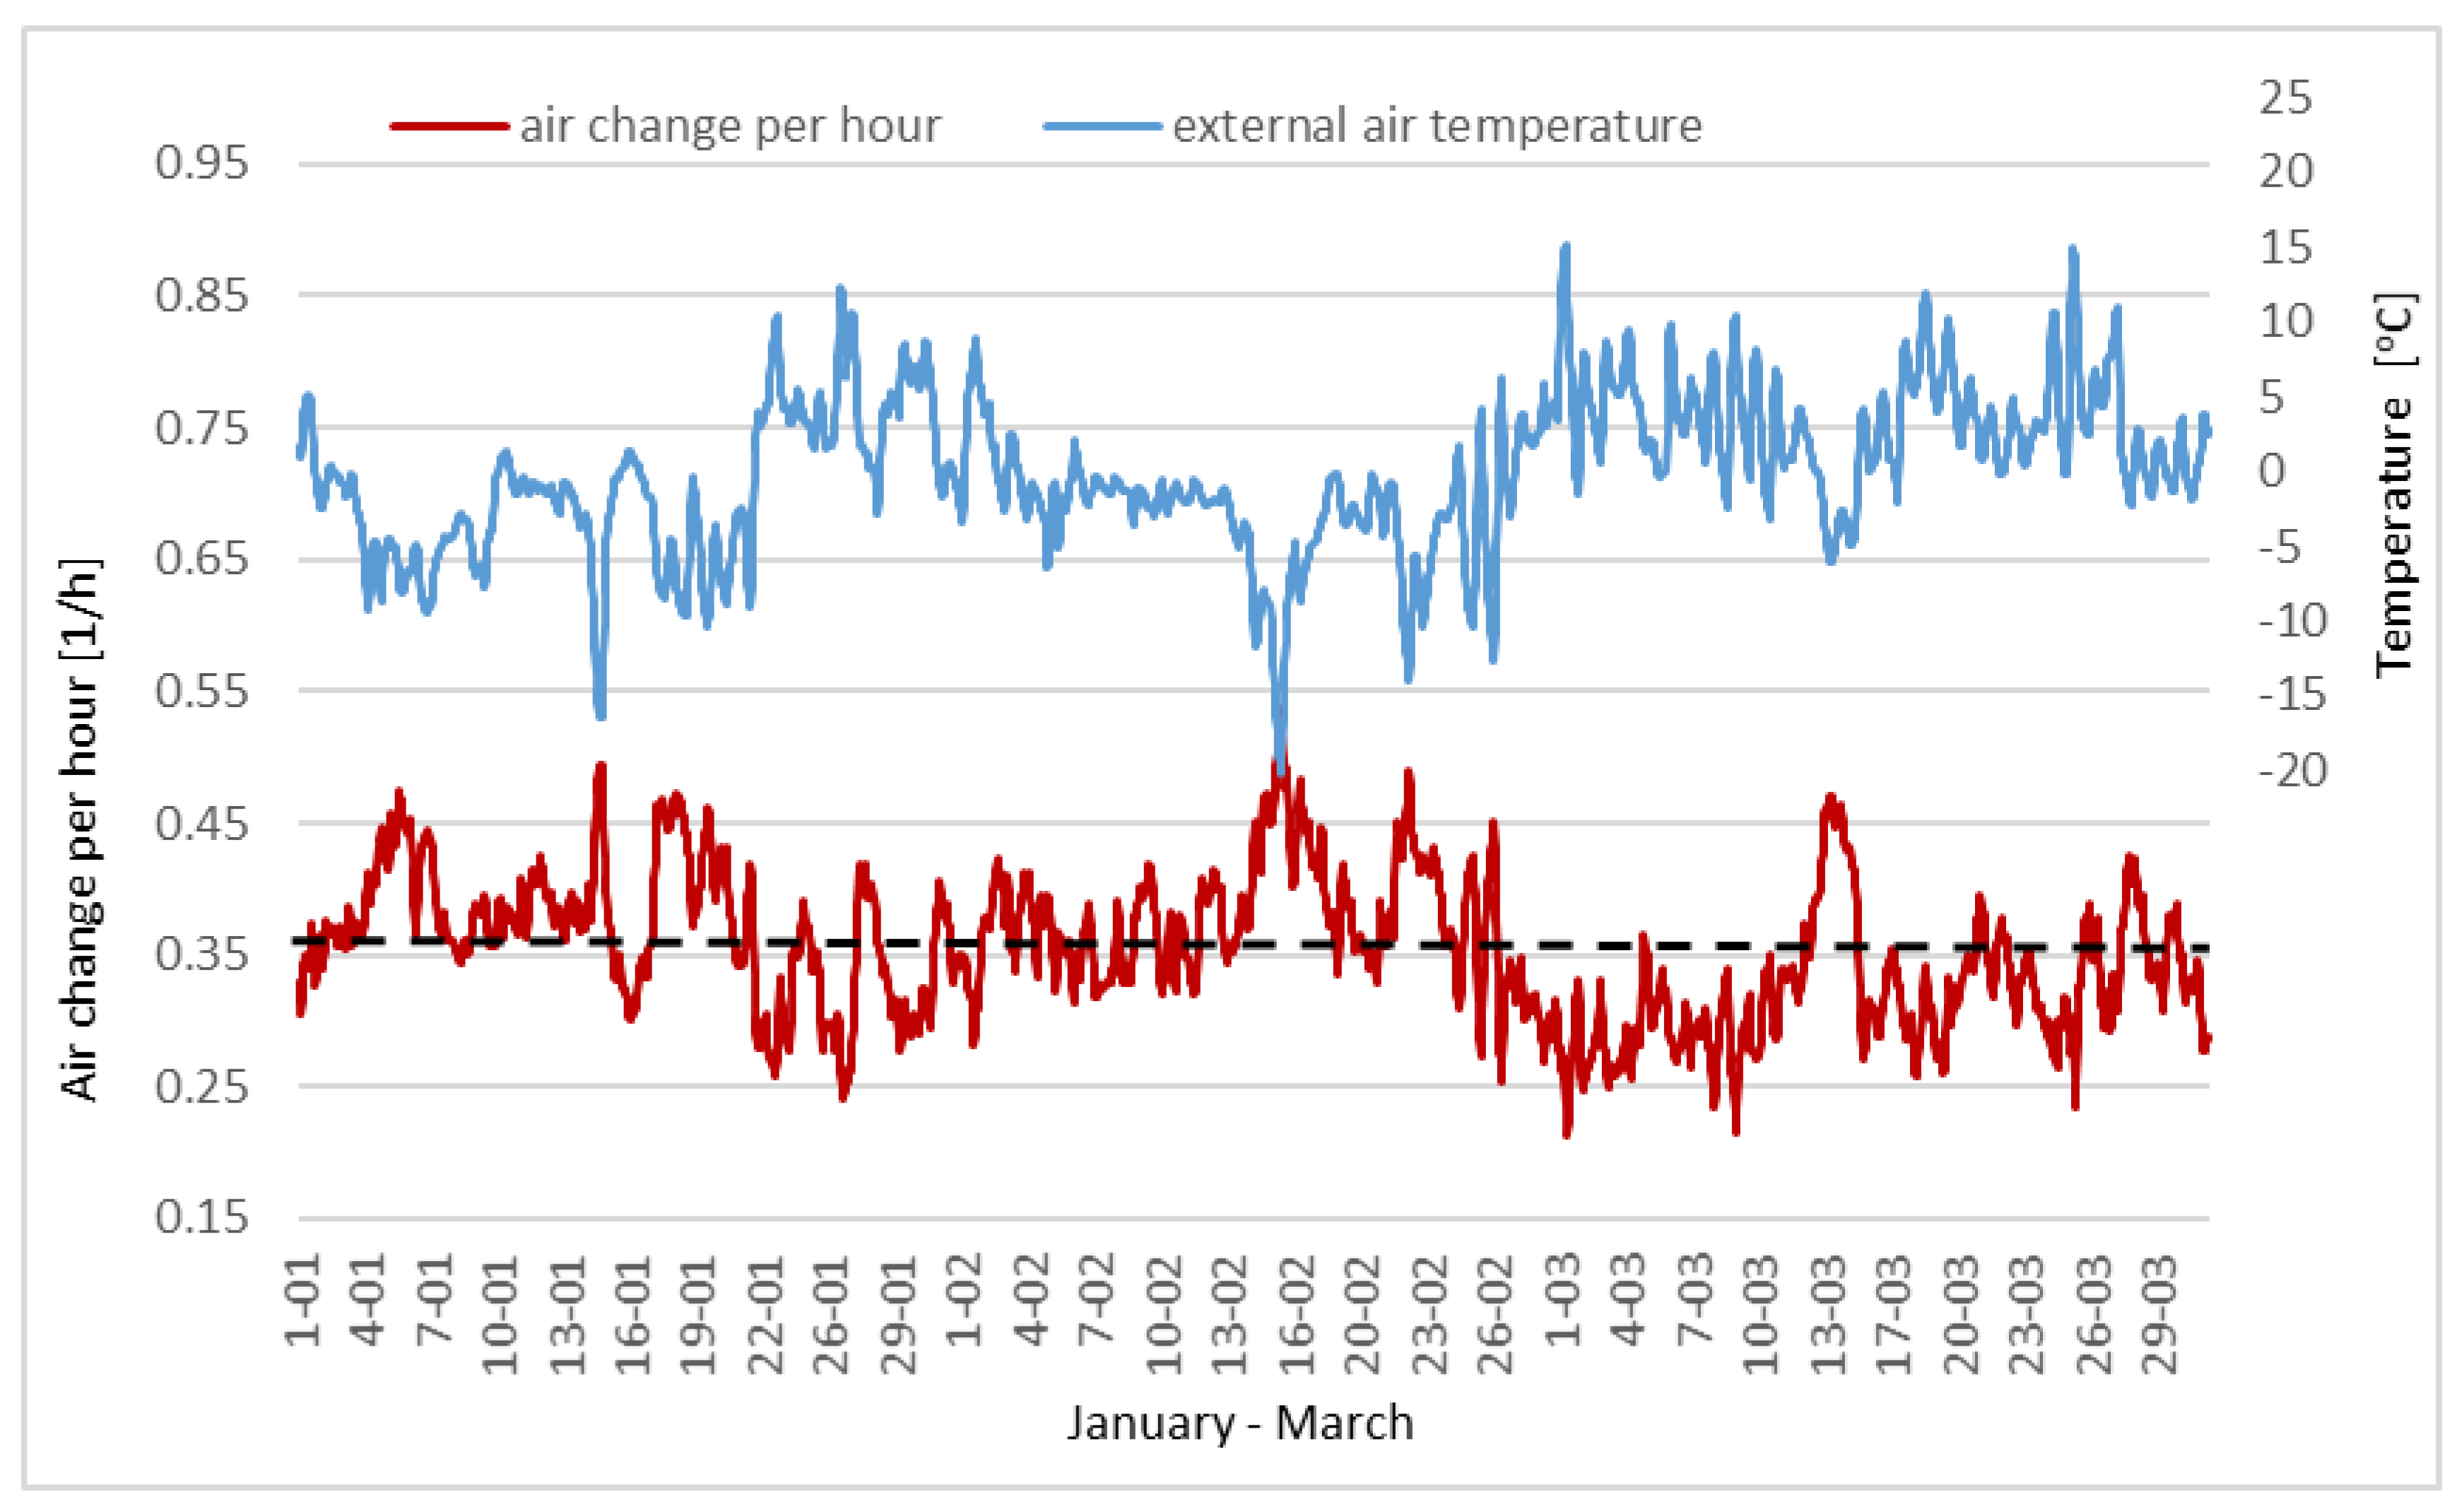
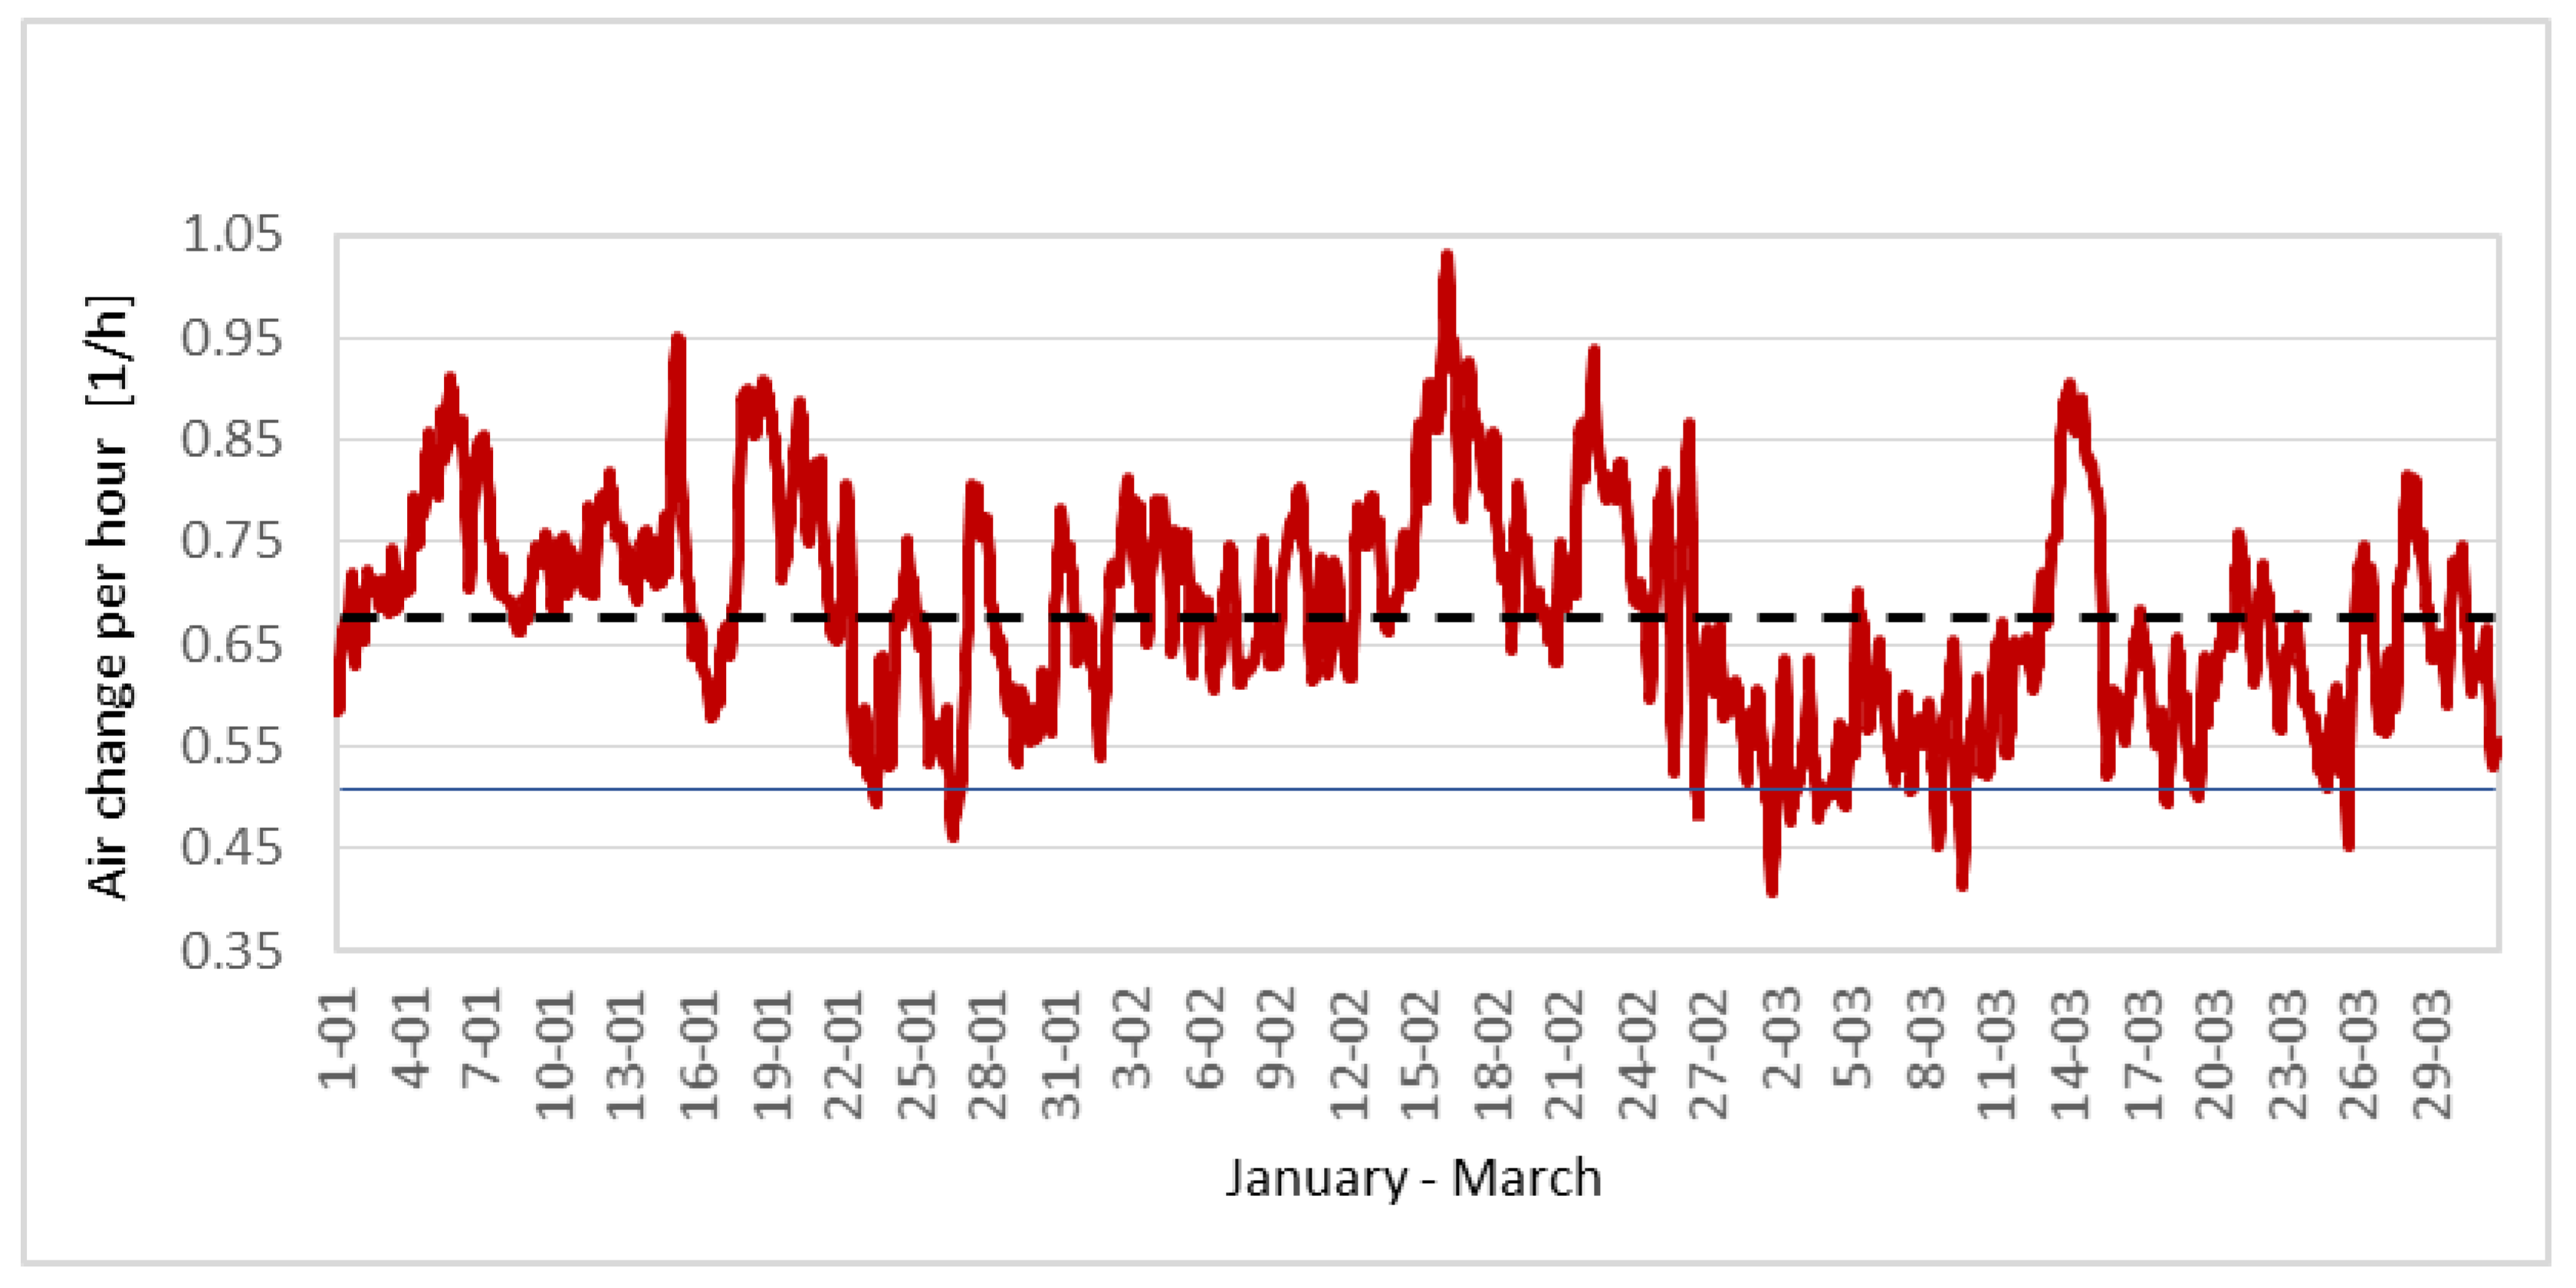
Simulation results of infiltration intensity and external temperature in the yurt for the first cold months of the year are shown in Figure 12. Statistical distribution of external air temperature and wind speed cause the air infiltration intensity to change strongly over time. There is a clear general dependence of air change on the outside temperature: the higher the temperature, the lower the air exchange, but the momentary wind speed values have a final decisive influence on infiltration intensity.

Figure 12.
Simulated air change intensity in the period January-March, the dashed line corresponds to the mean value. Assumed characteristic air flow rate n = 0.25 1/h.
According to Figure 12, it can be expected that since January until the end of March the actual air change rate will be oscillating around the value of 0.355 1/h (that is, the mean arithmetic value for the three month period). For only a few hours during this period, the conditions needed to maintain the required air minimum exchange (0.506 1/h) are present.
Previously presented experimental research, conducted in January and February, has shown that the actual air change rate resulted in poor quality due to the high concentration of CO2. The results of simulation confirm this observation. In the period of the low external temperature, although it is favorable for air change intensity, the obtained values were much lower than required to maintain the proper concentration of CO2.
Therefore, to obtain the desired air change intensity in a passive way only (i.e., by air infiltration), it is necessary to unseal the yurt’s external shell. The search for the required characteristics was conducted by means of trial-and-error method. Assuming the value of n equal to 0.38 1/h, the mean value of air changes in the analyzed period was 0.576 1/h, (i.e., clearly higher than the required hygienic value of 0.506 1/h). However, for 24% of the time of this period, the temporary air change rate will be still insufficient. While accepting for simulation in the program Energy Plus n equal to 0.45 1/h, a mean exchange value of 0.682 1/h was obtained. In this case only for 71 h during the whole analyzed period (3.3% of the total time) the temporary air exchange is lower than the required minimum value, Figure 13. It can also be assumed that a slightly lower air exchange and longer discomfort time, would also be acceptable as a rational compromise. Thus, it must be concluded that the design air infiltration rate in the yurt, passively assuring acceptable air quality, should be increased up to the range of 0.42–0.45 1/h. The obtained result is much higher than that measured by the trace gas method. This means that to maintain the correct air quality, it is necessary to unseal the yurt’s external shell and significantly increase air infiltration intensity. The above presented simulations were limited to the three coldest months of the year, as it was assumed that during this part of the year ventilation support by opening the door or roof window is unacceptable. In the warmer part of the year, a lack of a stack effect and sufficient temperature difference of internal and external air can be compensated by manually operated window opening.
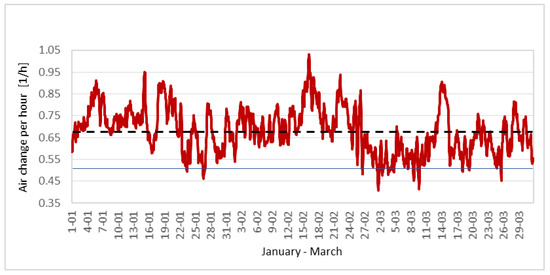
Figure 13.
Simulated air change intensity in the period January-March. Assumed characteristic air flow rate n = 0.45 1/h. The dashed line corresponds to the mean value and the continuous line to hygienic minimum n = 0.506 1/h.
The yurt is a special object when it comes to the energy balance. Its ecological advantage is based on low material consumption, potential mobility, biodegradability, and totally passive operation mode. These features, however, are associated with relatively low thermal resistance of building shell and significant heat losses as a result of conduction. Therefore, ventilation heat losses, that constitute a significant part of the heat balance, should be kept as low as possible, which is in conflict with air quality. This contradiction, typical for low-energy buildings, cannot, however, be resolved at the expense of indoor air quality. Building users must be provided with the required supply of fresh air. In a traditional facility with passive ventilation, this usually leads to considerable energy consumption.
Expected reduction of energy use requires departing from historical solutions and applying newer active technologies. Energy savings can be obtained, for example, by using a wall-mounted ventilator and energy recovery unit. Easily available and affordable heat recovery ventilation unit, for through the wall installation, exhausts stale air whilst introducing warmed fresh air from the outside. This simple solution has one more advantage, especially important in the case of the tested yurt. Abandoning of the traditional form of heating has disrupted the air exchange in the interior. Currently, only infiltration, based on accidental leaks in the shell, is the driving force of air exchange. The lack of any possibility to control the air flow intensity and adjust it to changing needs results in poor quality of the internal air. The introduction of a technically simple wall-mounted forced ventilation system with heat recovery, powered in large part by photovoltaic panel, would efficiently and sustainably solve this problem. Of course, adding a new device of modern technology to the traditional yurt would change significantly its character and environmental impact. Such an approach must therefore be treated as a far-reaching interference and change of the character of the entire facility.
6. Conclusions
The subject of the article is the currently observed tendency to adapt traditional housing solutions to the contemporary requirements and different climatic conditions. A special scientific aspect of the research raised in the paper is the collision of the traditional Mongolian shelter with the modern contradictory requirements of high quality of the internal environment and at the same time its sustainability. High expectations regarding air quality and thermal comfort demand advanced technologies and materials with an increased impact on environment, thus reducing or even losing the initial ecological advantages of the traditional Mongolian yurt.
The undertaken research showed also the problems with technical measurements in the specific, super-light structure of the yurt. One of them is a contradiction between too high operational tightness and, at the same time, a bad pressure test result. Other problems include strong spatial stratification of CO2 inside, rapid changes of temperature and CO2 concentration over time, etc.
The article deals with only one of the topics related to indoor air quality, others are the subject of further research and subsequent publications.
The traditional Mongolian yurt was moved from the dry and cold climate of the Asian steppe to the temperate climate of Central Europe and has been significantly modified. All of these modifications resulted in far-reaching changes in the properties of the partitions and the quality of the internal environment in the yurt. The conducted measurements and calculations of CO2 concentration in the modified yurt proved that the efficiency of ventilation system was not sufficient and the air quality was very poor even for a single user. In the case of a larger number of users, the concentration of CO2 has already reached a level that was dangerous to health.
Metabolically generated carbon dioxide was used as a tracer gas, the decay of the tracer gas allowed for calculation and evaluation of ventilation system efficiency. The average value of actual air changes n, obtained from measurements carried out on different days and weather conditions, was 0.25 l/h.
In the case of this specific, very light structure, the pressure tightness test with 50 Pa pressure difference did not yield reliable results.
In the Energy Plus program, the yurt was modeled using a simple algorithm (infiltration design flow rate) with the BLAST set of climate coefficients. The results of initial yurt simulation in the Energy Plus software confirmed the conclusions of the measurements. The air exchange in the yurt was too low, even for one user and at the convenient cold time of the year. Subsequent versions of simulation calculations allowed to determine that good indoor air quality can be obtained when the value of the characteristic air flow rate coefficient is close to 0.45 1/h. So, in the present conditions, where air exchange takes place only by means of natural infiltration, a significant reduction of the external shell tightness would be required.
However, this may be not an acceptable action in the era of climate change and the necessary reduction of the environmental load. Therefore, another modification of the yurt was proposed by using a device for forced air exchange and heat recovery from the ventilation air. Such a device, ultimately powered by PV array, although very distant from the Mongolian tradition, would create opportunities for a rational management of energy in such a facility.
Other necessary modifications of the yurt (e.g., those related to the thermal insulation of the outer shell) should also aim in a similar direction. What should definitely remain from the traditional solution is a specific light structure that guarantees mobility of the yurt, low value of built-in energy and close contact with the external environment. The structure of this facility must, finally, ensure a completely modern quality of energy management. Thermal comfort tests are carried out in the yurt and energy consumption is constantly registered. On this basis, further articles will be delivered that will allow to obtain a comprehensive description of the conditions in the yurt and indicate the necessary modifications to its structure and method of operation. Only such a broad approach and evaluation will be the basis for proposing a yurt as an example of a modern idea for sustainable construction.
Author Contributions
Conceptualization, T.K., K.N., S.K. and K.N.-D.; methodology, K.N.-D., K.N. and T.K.; software, K.N.-D. and T.K.; validation, K.N.-D., K.N. and T.K.; formal analysis, K.N., K.N.-D. and T.K.; investigation, K.N., K.N.-D., K.O. and P.Ś.; resources, K.N., K.O., K.N.-D. and P.Ś.; data curation, K.N., K.N.-D. and K.O.; writing—original draft preparation, K.N.-D. and T.K.; writing—review and editing, T.K., K.N. and S.K.; visualization, K.N., K.N.-D., S.K., T.K. and K.O.; supervision, T.K. All authors have read and agreed to the published version of the manuscript.
Funding
This research received no external funding.
Informed Consent Statement
Not applicable.
Acknowledgments
The authors would like to thank the authorities of the Cracow University of Technology, the Faculty of Civil Engineering and the Faculty of Mechanical Engineering for enabling research in the yurt at the university campus.
Conflicts of Interest
The authors declare no conflict of interest.
References
- Banzragch, D. Yurt as the Origin of Mongolian Architecture; Mongolian S.N.: Ulaanbaatar, Mongolia, 2006. [Google Scholar]
- Tsovoodavaa, G. A Transportable and Energy Optimized Residential Building Architectural Design for the Mongolian Climate. Ph.D. Thesis, University of Pecs, Pécs, Hungary, 2019. [Google Scholar]
- Tsovoodavaa, G.; Kistelegdi, I. Comparative analysis for traditional Yurts using thermal dynamic simulations in Mongolian climate. Int. J. Eng. Inf. Sci. 2019, 14, 97–108. [Google Scholar] [CrossRef]
- Bragança, L.; Mateus, R.; Koukkari, H. Building Sustainability Assessment. Sustainability 2010, 2, 2010–2023. [Google Scholar] [CrossRef] [Green Version]
- Kibert, C.J. Sustainable Construction Green Building Design and Delivery; John Wiley & Sons Ltd.: Hoboken, NJ, USA, 2008; ISBN 9780470114216. [Google Scholar]
- Marques, B.; Guedes, M.C.; Silwva, J.P. Low Energy, Low-Tech Building Design for the Extreme Cold of Antarctica. In Proceedings of the PLEA 2017 Conference, Edinburgh, Scotland, 2–5 July 2017. [Google Scholar]
- Fedorczak-Cisak, M.; Kowalska-Koczwara, A.; Nering, K.; Pachla, F.; Radziszewska-Zielina, E.; Śladowski, G.; Tatara, T.; Ziarko, B. Evaluation of the Criteria for Selecting Proposed Variants of Utility Functions in the Adaptation of Historic Regional Architecture. Sustainability 2019, 11, 1094. [Google Scholar] [CrossRef] [Green Version]
- Ayurzana, B. An elementary thermal analysis of a Mongolian Ger by the lattice Boltzmann method. In Proceedings of the The 13th International Conference of Technology and Innovation “KHURELTOGOOT-2017”, Ulaanbaatar, Mongolia, 21 October 2017. [Google Scholar]
- Xu, G.; Jin, H.; Kang, J.; Guoqiang, X. Experimental Study on the Indoor Thermo-Hygrometric Conditions of the Mongolian Yurt. Sustainability 2019, 11, 687. [Google Scholar] [CrossRef] [Green Version]
- King, P. The Complete Yurt Handbook; Eco-Logic Books/Worldly Goods: Bristol, UK, 2001; ISBN 9781899233083. [Google Scholar]
- Bat-Ulzii, B.; Dagmid, O. Encyclopedia of the Ger, the Dwelling House of Mongols; Mongolian C.H.: Ulaanbaatar, Mongolia, 2016. [Google Scholar]
- Ke, M.A.N. Mongolian yurt: A mixture of the sacred and the secular along with science. J. South-Cent. Univ. Natl. 2003, 4, 29–31. [Google Scholar]
- Li, H.; Huiqin, H.; Jianbowen, B. Research on actuality of Mongolian herdsman’s housing and living space on Inner Mongolia Hurunui Grassland. Arch. J. 2009, 2, 42–48. [Google Scholar]
- Nikiforov, B.S.; Baldorzhieva, V.B.; Nikiforov, S.O.; Markhadaev, B.E. The design of Mongolian yurts(gér): Genesis, typology, frame and modular technologies and their transformations. Sci. Eur. 2017, 1, 56–69. [Google Scholar]
- Manfield, P. A Comparative Study of Temporary Shelters used in Cold Climates. Master’s Thesis, St. Johns College, Annapolis, MD, USA, February 2000. [Google Scholar]
- Malibekuly, Z.; Semenyuk, O.; Dyisebayev, U.; Kuc, S. Architecture of the yurt and its impact on teaching young architects. World Trans. Eng. Technol. Educ. 2020, 18, 225–230. Available online: http://www.wiete.com.au/journals/WTE&TE/Pages/Vol.18,%20No.2%20(2020)/24-Kuc-S.pdf (accessed on 30 July 2021).
- Bayandelgera, B.E.; Ueda, Y.; Adiyabatb, A. Experimental investigation and energy performance simulation of Mongolian Ger with ETS heater and solar PV in Ulaanbaatar city. Energies 2020, 13, 5840. [Google Scholar] [CrossRef]
- Tsovoodavaa, G.; Kistelegdi, I. Review and systemization of the traditional yurt. In Proceedings of the Conference: 13th Miklos Ivanyi International PhD and DLA Symposium, Pécs, Hungary, 3–4 November 2017; Pollack Press: Pécs, Hungary, 2017; ISBN 978-963-642-780-1. (Abstract). [Google Scholar]
- Mrkonjic, K. Autonomous Lightweight Houses: Learning from Yurts-PLEA2006. In Proceedings of the 23rd Conference on Passive and Low Energy Architecture, Geneva, Switzerland, 6–8 September 2006; Universitat Politecnica de Catalunya: Barcelona, Spain, 2006. [Google Scholar]
- Salvalai, G.; Imperadori, M.; Sesana, M.M.; Crippa, G. Ski Yurt: Upcycle of Downhill Skis for a Shelter in Cacine—Guinea-Bissau. In Research for Development. Innovative Models for Sustainable Development in Emerging African Countries; Aste, N., Della Torre, S., Talamo, C., Singh, A., Rossi, C., Eds.; Springer Open, Fondazione Politecnico di Milano: Milan, Italy, 2020; pp. 71–84. [Google Scholar]
- Persily, A.K. Evaluating Building IAQ and ventilation with indoor carbon dioxide. Ashrae Trans. 1997, 103, 1–12. [Google Scholar]
- Bulińska, A. Analysis of the use of metabolically generated carbon dioxide as a tracing gas for determination of indoor air exchange. Ph.D. Thesis, Silesian University of Technology, Gliwice, Poland, 2011. (In Polish). [Google Scholar]
- Zhang, W.; Wang, L.; Ji, Z.; Hui, Y. Test on ventilation Rates of Dormitories and Offices in University by the CO2 Tracer Gas Method. Procedia Eng. 2015, 121, 662–666. [Google Scholar] [CrossRef] [Green Version]
- Nowak, K.; Nowak-Dzieszko, K.; Marcinkowski, A. Analysis of Ventilation Air Exchange Rate and Indoor Air Quality in the Office Room Using Metabolically Generated CO2. IOP Conf. Ser. Mater. Sci. Eng. 2018, 415, 012028. [Google Scholar] [CrossRef]
- Benedettelli, M.; Naticchia, B.; Carbonari, A.; Pascucci, M. Testing of Tracer Gas Based Measurement Procedure to Asses Air Change Rates in Buildings. In Proceedings of the Conference: 32nd International Symposium on Automation and Robotics in Construction, Oulu, Finland, 15–18 June 2015. [Google Scholar]
- Cichowicz, R.; Gawron-Skarbek, A.; Godala, M.; Zimna-Walendzik, E.; Sabiniak, H.; Szatko, F. Assesment of carbon dioxide concentration in the air of selected university facilities. Probl. Hyg. Epidemiol. 2014, 95, 287–291. [Google Scholar]
- Sherman, M.H. Tracer gas techniques for measuring ventilation in a single zone. Build. Environ. 1990, 25, 365–374. [Google Scholar] [CrossRef]
- Thermal Performance of Buildings and Materials—Determination of Specific Airflow Rate in Buildings—Tracer Gas Dilution Method; European Standard EN 12569 ISO/FDIS 12569; International Organization for Standardization: London, UK, 2012.
- Ventilation for Acceptable Indoor Air Quality; ANSI/ASHRAE Standard 62.1-2019; American Society of Heating, Refrigerating and Air-Conditioning Engineers: Atlanta, GA, USA, 2019.
- Standard Guide for Using Indoor Carbon Dioxide Concentrations to Evaluate Indoor Air Quality and Ventilation; ASTM Standard D 6245-98; American Society of Heating, Refrigerating and Air-Conditioning Engineers: Atlanta, GA, USA, 1998.
- Ventilation for Non-Residential Buildings—Performance Requirements for Ventilation and Room-Conditioning Systems; European Standard EN 16798-3:2017; European Committee for Standardization: Brussels, Belgium, 2017.
- Thermal Performance of Buildings—Determination of Air Permeability of Buildings—Fan Pressurization Method; European Standard EN 9972; European Committee for Standardization: Brussels, Belgium, 2015.
- Bomberg, M.; Kisilewicz, T.; Nowak, K. Is there an optimum range of airtightness for a building? J. Build. Phys. 2016, 39, 395–420. [Google Scholar] [CrossRef]
- Thermal Performance of Buildings—Transmission and Ventilation Heat Transfer Coefficients—Calculation Method; European Stnadard EN ISO 13789; European Committee for Standardization: Brussels, Belgium, 2017.
- Kisilewicz, T. Computer Simulation in Solar Architecture Design. Archit. Eng. Des. Manag. 2007, 3, 106–123. [Google Scholar] [CrossRef]
- Energy plus Documentation; EnergyPlus™ Version 9.0.1; Documentation, Engineering Reference; U.S. Department of Energy: Washington, DC, USA, 2018.


Publisher’s Note: MDPI stays neutral with regard to jurisdictional claims in published maps and institutional affiliations. |
© 2021 by the authors. Licensee MDPI, Basel, Switzerland. This article is an open access article distributed under the terms and conditions of the Creative Commons Attribution (CC BY) license (https://creativecommons.org/licenses/by/4.0/).