Article

A Comparative Analysis of Energy Consumption by Conventional and Anchor Based Dynamic Positioning of Ship

by
Andrzej Łebkowski
* and
Jakub Wnorowski
*
Department of Ship Automation, Gdynia Maritime University, Poland Morska St. 83, 81-225 Gdynia, Poland
*
Authors to whom correspondence should be addressed.
Energies 2021, 14(3), 524; https://doi.org/10.3390/en14030524
Submission received: 8 November 2020 / Revised: 5 January 2021 / Accepted: 18 January 2021 / Published: 20 January 2021

Abstract

:
One of the requirements for ships equipped with dynamic positioning system is the ability to maintain a given position in various hydrometeorological conditions. At the same time, efforts at reducing electricity consumption are made in order to reduce operating costs and emissions of exhaust gases, such as sulfur oxides and greenhouse gases such as carbon dioxide (CO2). For this purpose, the ship designer at the design stage must predict both how much energy the ship will theoretically use during operation and how the expenditure can be reduced. The publication presents a comparison of energy consumption with two different approaches to ship positioning: the use of classic dynamic positioning utilizing a set of thrusters and by using a set of anchors. In order to determine the energy consumption during positioning, the matrix method was used, on the basis of which the analysis of the ability to hold the position of the ship (capability plot) was performed, in accordance with the recommendations of the classification society DNV GL. Thanks to this analysis, it was possible to find such a distribution of thrust vectors on propulsors that the ship would not lose its set position under the hydrometeorological conditions specified in the analysis. As a result of comparing the two positioning systems, it turned out that using anchor-based positioning uses 24% less energy than positioning based on a set of thrusters, which translates into 24% less CO2 emissions into the atmosphere.

1. Introduction

The history of dynamic positioning systems dates back to 1954, when the Offshore Company in Mexico launched the first oil rig [1]. In 1965, the science vessel Glomar Challenger began its 15-year mission. It was the first to be equipped with a computer-controlled dynamic positioning system. This event marks the beginning of work on the development and improvement of digital control algorithms. In 1977, the Kongsberg company [2] began to use Kalman filters in their positioning systems, which allowed for smoother control of the ship’s movements over time [1,3]. From that moment on, new methods of controlling the dynamic positioning systems and many publications began to emerge in the world, which until today are considered as the basis for engineers designing such systems [4,5,6].
The rapid development of the world economy has created a demand for various types of vessels in the offshore sector, such as: oil-seeking vessels [7,8], rescue vessels [9], pipeline laying vessels [10,11,12], oil rig service vessels [13], ships for servicing offshore wind farms [13], or floating hotel ships for crews working on platforms or offshore wind farms [14,15]. These types of vessels are usually equipped with a dynamic positioning system and a set of powerful thrusters. Among the drive systems used in dynamic positioning systems, there are diesel-mechanical, diesel-electric and hybrid propulsion configurations. Offshore Support Vessels (OSV) most often use the diesel-electric configuration. The configuration of this type consists of diesel generating sets, electronic power converters and electric propulsion motors transmitting the torque to thrusters. Two types of azimuth and podded thrusters are known [16,17]. The podded thruster is suspended directly under the ship’s hull together with an electric motor that drives it directly. The azimuth thruster is located similarly to the gondola thruster under the ship’s hull, with the difference that the torque is transmitted to it from the electric machine located in the ship’s hull via gears and shafts. Both types of thrusters make it possible to react to frequent changes in weather conditions. In OSV units, during positioning, the thrusters work all the time, which causes the consumption of very large amounts of fuel and the associated large emissions of exhaust gases into the atmosphere (nitrogen oxides NOx, sulfur oxides SOx, oxygen, carbon dioxide, water vapor) [18]. Regardless of the configuration of the propulsion system and the type of thrusters, the owners of all ships equipped with a dynamic positioning system are required to carry out periodic tests related to the system’s resistance to possible damage, called FMEA (Failure Mode and Effect Analysis) [19,20,21]. Such analysis is performed by companies licensed by the International Maritime Organization (IMO) [22,23,24]. The analysis is preceded by several weeks of preparation and determination of tests, based on the technical condition of the ship. An example test of system resistance to a UPS (Uninterruptible Power Supply) power outage is shown in Table 1. The test is provided by one of the companies performing FMEA analyses.
The above table consists of several sections:
  • The place of the test –> in this case it is the UPS switchboard,
  • Determination what the test concerns –> 230 V UPS power rail,
  • A section specifying the expected impact of a power failure on devices connected to the particular power rail, e.g., specifying that in the event of a power failure to the joystick system, no impact on the dynamic positioning system is expected.
The person or persons carrying out the analysis perform the tests with the ship’s crew usually an electrician on duty. During many hours of tests, the following are checked, among others: the impact of electrical switchgear failure on the ship’s position, how quickly the emergency power is depleted in the event of a complete power failure and whether damage to any of the thruster’s sensors will cause it to start working at full power. Tests that have not been passed are categorized into three levels: A, B and C. Level A and B mean that the ship cannot perform its work until it has passed them. Level C means minor problems that should be solved, but do not cause problems with dynamic positioning.
Other requirements that must be met by a vessel with a dynamic positioning system is to have up-to-date graphs of the ability to maintain position, the so-called capability plots (CP) [25]. They are performed so that in the event of a DP system failure, it is possible on their their basis to decide the ship’s course in order to minimize the influence of wind on the ship’s position. Capability plots can be performed by companies certified by the International Maritime Organization. Figure 1 shows an example of a CP chart.
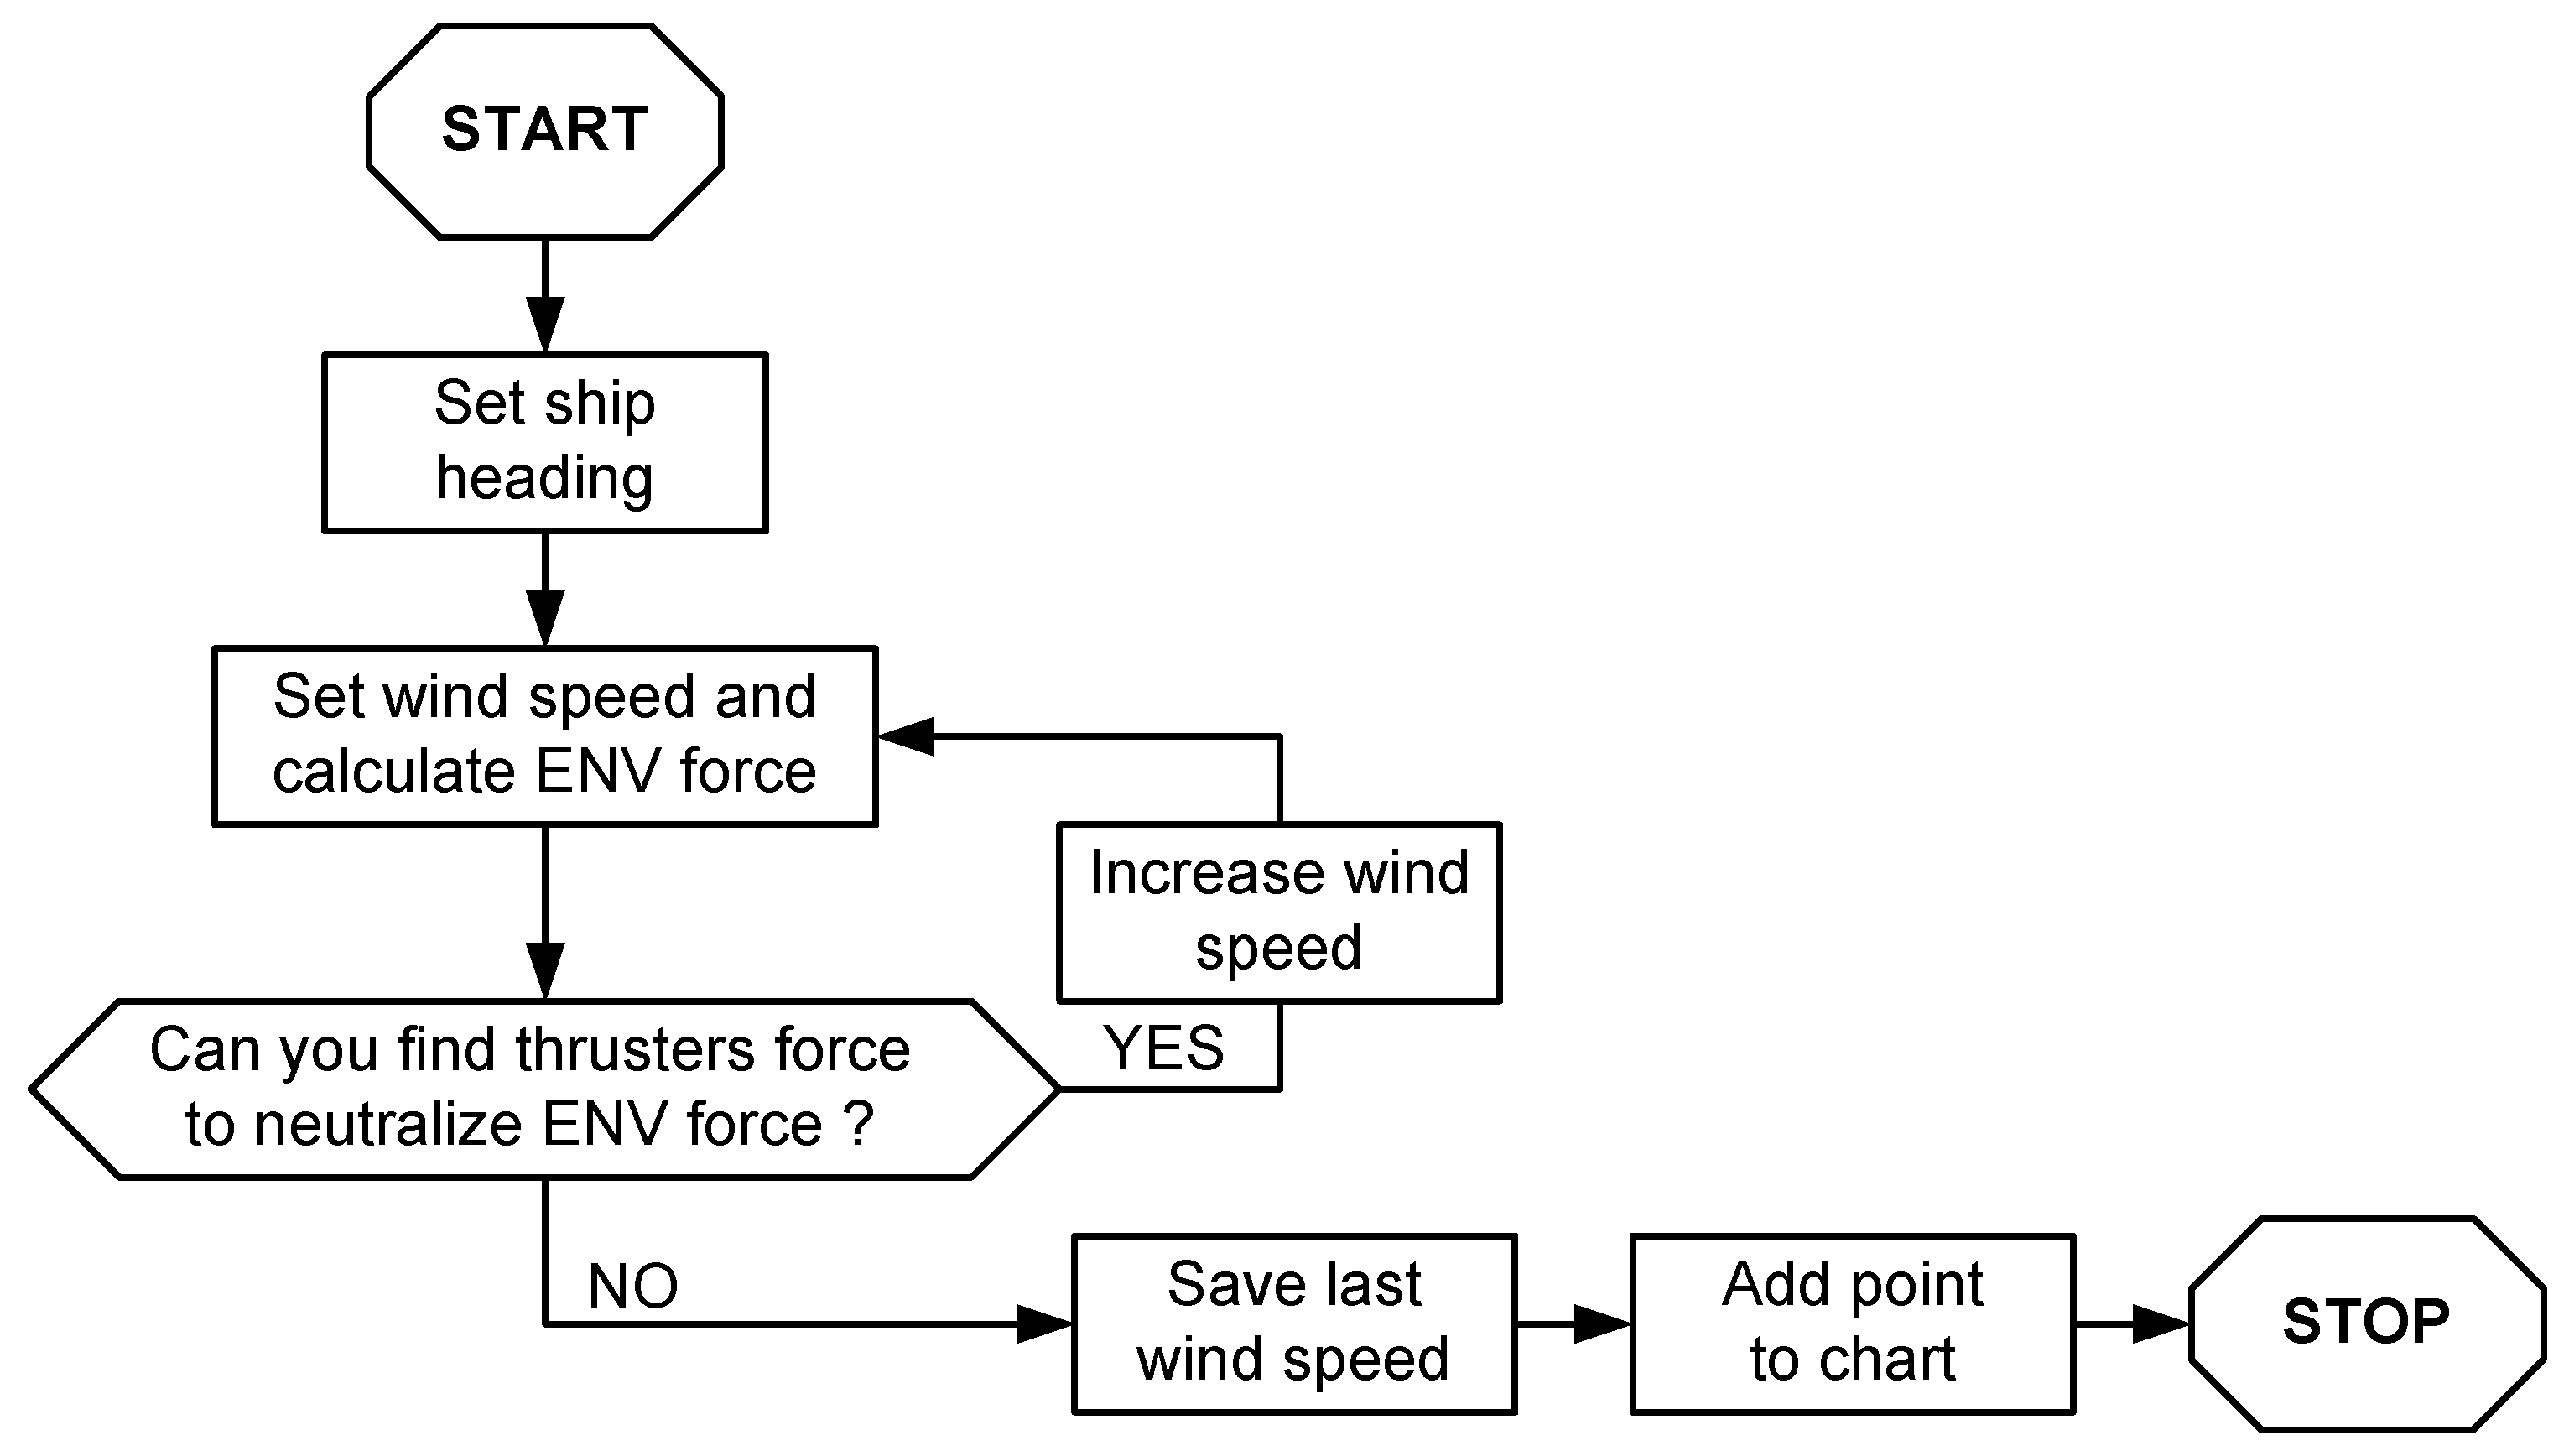
Graphs of this type are always presented in the form of a polar graph, in the center of which there is a shape symbolizing the ship’s silhouette. There are numbers around the graph’s perimeter indicating the angles in degrees at which the environmental force acts on the ship. The analysis is performed every 10 degrees. The horizontal scale shows the value of the wind speed. The blue line indicates the maximum value of wind speed that can occur at a given angle of incidence, that still allows keeping the ship in a given position. Wind blowing from the bow is assumed to be at 0 degrees, and from the stern at 180 degrees. The detailed algorithm for step-by-step process of creating the chart from Figure 1 is shown in Figure 2.
The process of creating the chart from Figure 2 starts with angle of 0 degrees and a randomly selected wind speed. After finding the maximum value of the wind speed for which it was possible to determine the distribution of forces among individual thrusters, this speed is added as a point on the graph, and then the next angle value is similarly computed. After all angles have been tested, the entire graph is drawn with a line connecting the individual points.
When performing the capability plots analysis, two significant pieces of information are obtained:
wind speed,
the power of thrusters needed to cancel out the influence of the wind.
The speed of the sea current in capability plots is constant at 0.5 m/s as per [26], and its angle is equal to the wind angle. Using the relationship between the generated thrust and thruster power, given in [26], it is possible to determine the characteristics of power consumption from wind speed, which in turn can be used to estimate energy consumption and fuel consumption during positioning. The dependencies of power consumption on wind speed presented in the further part of the article were determined on the basis of the proprietary program for creating capability plots, developed in the C# language environment and with the help of the LocalSolver library [27]. This library allows to derive optimums for nonlinear functions.
In addition to ships equipped with thrusters only, there are vessels that have been equipped with a basic set of thrusters and a set of anchors intended for positioning. Examples of such vessels are bottom drilling vessels [28], rescue vessels that cooperate with divers, and wreckage vessels. The biggest advantage of positioning based on an anchor set is zero or very low ship energy consumption for positioning itself, which follows the current trends in ecology and is in line with the Ship Effective Energy Management Plan (SEEMP) [29], which was introduced by the International Martitime Organization on 1 January 2013. According to this plan, ships should, among other tasks, monitor fuel combustion, maintain fuel system equipment, maintain an appropriate fuel mixture and take advantage of fuel saving opportunities. The positioning system with an anchor set definitely favors the latter.
The publication presents the results of a comparative analysis for two positioning systems—the classic dynamic positioning system and the system using a set of anchors. The total energy consumption during positioning by a vessel using two different systems was analyzed. The energy consumption of a vessel with an anchor set was estimated on the basis of measurement data recorded on the actual vessel, since the crew’s individual approach to anchor drop speed, slackening or anchor line tension makes it difficult to quantify energy consumption from simulation alone.
Energy consumption on a ship with a conventional dynamic positioning system was estimated by performing the following steps:
  • The capability plot analysis.
  • Based on the results of the analysis from point 1, the dependencies of the strength of individual thrusters on the wind speed were determined
  • Using the dependencies given in [29], the individual thrusters’ forces were converted into power.
  • The dependencies of the used thruster power on the wind speed were determined,
  • Based on the characteristics from sub-point 4 and the graph of changes in wind speed during positioning, the power consumption over time was determined.
  • Knowing the changes in power consumption and the positioning time, it was possible to determine the energy consumption.
The aim of the analyses was to show that with the low cost of installing the system with a set of anchors, an easy reduction of fuel consumption during positioning is possible, and thus reduction of exhaust gases emission into the atmosphere, in accordance with the regulations introduced by International Maritime Organization (IMO) contained in Annex VI of the MARPOL Convention [30].

2. Review of Existing Methods of Reducing Energy Consumption

The problem of excessive carbon dioxide emissions and excessive energy consumption affects the entire world, whether it is in the land or maritime sector. On land, it is theoretically easier to develop methods to reduce gas emissions from conventional coal-fired power plants. For example, the percentage of use of alternative energy sources such as biogas plants can be increased. In [31] a biogas plant is presented, which uses municipal waste to reduce both carbon dioxide emissions and produce “green” energy. Another approach to reducing electricity costs can be found in [32] where a method of maximum power point tracking with the use of neural networks was presented, which allows to increase the efficiency of solar panels.
Publications related to methods of saving energy on ships can be divided into several subgroups:
  • Methods related to control algorithms,
  • Methods related to the structure of the ship
  • Methods related to analysis during ship design process

2.1. Methods Related to Control Algorithms

This group includes methods that do have an indirect impact on lower energy consumption, by improving the current control methods, making them faster, less unreliable and better at dealing with interference from, for example, environmental forces. Examples of such solutions are, for example: sliding control presented in [33], the use of neural networks and fuzzy logic from [34] or the improvement of PID controllers widely used in dynamic positioning using fuzzy logic [35,36,37]. Thanks to the improvement of the control algorithms, the positioning system can more efficiently distribute the power to the thrusters, which translates into lower energy consumption. The group also includes all kinds of algorithms related to determining the route of the passage for a ship [38,39], steering along a given route of passage [40,41,42], and determining anti-collision maneuvers [43,44]. A separate group consists of algorithms enabling the autonomous movement of the vessel in the maritime navigation environment, including the acquisition of objects, determination of the route of the passage, steering along the designated route, implementation of anti-collision maneuvers and precise maneuvering in port areas [45,46,47,48,49].

2.2. Methods Related to the Structure of the Ship

This group includes methods that directly affect the ship’s structure, reducing fuel consumption. These include hybrid installations that combine photovoltaic systems with a conventional drive based on thermal diesel engines, e.g., such as in [50,51]. An interesting solution seems to be the use of wind energy through the use of a sail, which is compatible with the conventional propulsion [52,53]. An interesting solution may be the application of hybrid drive systems using electric motors [54], hydrogen fuel cells [55,56], Flettner rotors [57], the Magnus effect [58,59,60], hybrid energy sources [61] and others [62,63,64].
Another idea for reducing fuel consumption is presented in [65], where using numerical methods, fuel consumption is optimized during positioning. The research conducted using this method showed fuel savings on the order of 2%.

2.3. Methods Related to Analysis during Ship Design Process

This group includes analyzes performed during ship design. They include the graphs of the vessel’s position-keeping capability [66] presented in this article. The presented diagrams allow the designer to determine the energy demand depending on the analysis of various variants of the set of thrusters and the hydrometeorological conditions in the presence of which the vessel can be operated. Thanks to this, one can easily plan both the power of the thrusters and their location on the ship, so as to maximize the ratio of power to energy consumption. For example, the designer may notice that by using a weaker thruster, but by moving it to the right place of the ship, the same effect or better can be achieved than by using a stronger thruster without moving it.
Unfortunately, there is currently a deficit related to publications on energy consumption with the use of positioning based on a set of anchors. This makes it interesting to compare this positioning method with a conventional dynamic positioning system to show the differences in both approaches to the positioning method and the resulting differences in energy consumption.

3. Research Methodology

In order to create the capability plot and obtain the dependence of the thrusters force on the wind speed, a mathematical model of the tested vessel should be developed, an another mathematical model of environmental forces should be determined, and the distribution of forces on propulsors using the relations obtained in items 1 and 2 should be calculated.
In this chapter, each of the above points has been described, followed by presentation of several simulations along with the obtained results.

3.1. Mathematical Model of Environmental Forces

The mathematical model of environmental forces consists of:
  • Wind force and resulting torque
  • The strength of the sea current and the resulting torque
The individual forces and torque were calculated according to the equations given in [67,68,69,70,71].

3.1.1. Wind Force and Torque

The wind force affecting a given ship is a binary function, because it depends both on the wind angle at the LPP/2 point of the ship (LPP—Length between Perpendiculars) and the wind speed. For the purposes of the analysis, two components of the wind force (one acting on the X axis, the other on the Y axis of the ship) were determined, which are expressed by the following functions [67]:
X w i n d = q · C x ( γ w ) · A F W
Y w i n d = q · C Y ( γ w ) · A L W
The torque was determined from the following function:
M w i n d = q · C M ( γ w ) · A F W · H F W
where γw—wind incidence angle in relation to LPP/2 point; AFW—Cross-section of the upper part of the hull; ALW—Hull lateral surface above the water; HFW—Shift of the geometric center of the hull side surface with respect to LPP/2; CX—shape factor for the X axis; CY—form factor for the Y axis.
The coefficient of exerted pressure on the hull at a given wind speed was determined from the following function:
q = 1 2 · ρ a · V W 2
where: ρa—air density coefficient; Vw—wind speed [m/s].
The Blendermann method [67] is used to determine the hull shape coefficients.

3.1.2. Sea Current and Torque

The strength of the sea current was calculated similarly to the strength of the wind [67]:
X c u r r e n t = q · C x ( γ C ) · A F C
Y c u r r e n t = q · C Y ( γ C ) · A L C
The torque was determined from the function:
M c u r r e n t = q · C M ( γ C ) · A F C · H F C
where: γC—angle of incidence of the sea current with respect to the LPP/2 origin point; AFC—Cross-section of the underwater part of the hull; ALC—Lateral surface of the hull underwater; HFC—Shift of the geometric center of the underwater side surface of the hull relative to the origin point LPP/2; CX—shape factor for the X axis; CY—shape factor for the Y axis.
The coefficient of pressure exerted on the hull at a given speed of sea current was determined from the following relationship:
q = 1 2 · ρ W · V C 2
where: ρw—water density coefficient; VC—sea current speed [m/s].

3.2. Mathematical Model of Thrusters

In order to determine the forces that different types of thrusters generate for individual axles of the ship, the following assumptions were made:

3.2.1. Tunnel Thruster

In the examples below it is assumed that the tunnel thruster acts only on the Y axis of the ship at an angle of 90 degrees. Therefore, the direction of the force is signed. If the force is acting on starboard then the force is positive, and if acting on port side-negative. In connection with the above statements, the following system of equations of forces, acting on the axes of a given ship can be assumed:
X F o r c e = 0
Y F o r c e = F T T · sin 90 °
M = F T T · sin 90 ° · P o s X
where: XForce—thruster force acting on the X axis of the ship; YForce—thruster force acting on the ship’s Y axis; M—torque generated by the thruster; FTT—total thruster force; PosX—the position of the thruster on the X axis with respect to the point LPP/2 [m].

3.2.2. Azimuth Thruster

The azimuth thruster is an example of a thruster with a theoretical yaw range of 360 degrees, but it is physically limited by technological solutions. After the entry into force of the latest regulations of DNV GL (Det Norske Veritas Germanischer Lloyd) [22], the mathematical model will have to take into account the forbidden areas [72,73].
In the simulations conducted in this article, technological limitations were removed and the thruster was allowed to turn in any direction and at any angle to find the local optimum of the function.
Due to the fact that the thruster acts on all axes of the ship, its force equations take the form:
X F o r c e = F A T · cos α
Y F o r c e = F A T · sin α
M = F A T ( sin α · P o s X ) ( cos α · P o s Y )
where: XForce—thruster force acting on the X axis of the ship; YForce—thruster force acting on the ship’s Y axis; M—torque generated by the thruster; FAT—total thruster force; PosX—position of the thruster on the X axis with respect to the point LPP/2 [m]; PosY—the position of the thruster on the Y axis in relation to the point LPP/2 [m]; α—the direction in which the thruster is facing.

3.2.3. Main Screw

The main thruster is a special thruster that is usually used for ship motion, but if the ship lacks azimuth thrusters, it can be used for positioning.
The mathematical model assumes that the thruster generates thrust in only one direction, and therefore does not generate any torque or forces on the ship’s Y axis.
X F o r c e = F T T · cos 180 °
Y F o r c e = 0
M = 0
where: XForce—thruster force acting on the X axis of the ship; YForce—thruster force acting on the ship’s Y axis; M—torque generated by the thruster; FTT—total thruster force.

3.3. Determination of the Distribution of Forces on Propulsors

The analysis of the ship’s ability to keep position begins with the calculation of environmental forces acting on each of the ship’s axes for a given value of wind speed and its angle.
The forces acting on each ship axis and the generated torsional torque are determined as the sum of the individual components of environmental forces:
F X E N V = X w i n d + X c u r r e n t + X w a v e s
F Y E N V = Y w i n d + Y c u r r e n t + X w a v e s
M E N V = M w i n d + M c u r r e n t + M w a v e s
The force that the thrusters exert on the ship and the torque generated by them is determined by the sum of the individual forces acting on the ship’s axes:
F T x = i = 0 n X F o r c e i
F T y = i = 0 n Y F o r c e i
M T = i = 0 n M i
A ship maintains its position when the forces generated by the propulsors balance the environmental forces. In order to determine the forces of individual thrusters, they should be determined from the equations below.
F T x = F X E N V
F T y = F Y E N V
M = M E N V
For example, a situation may be considered where the ship is subjected to a longitudinal force F X E N V = 200   kN , a transverse force F X E N V = 200   kN and a torsional torque M E N V = 100   kN . If the ship is equipped with 3 azimuth propulsors, the system of equations to be solved is as follows:
F A T 1 · cos α 1 +   F A T 2 · cos α 2 +   F A T 3 · cos α 3 =   200
F A T 1 · sin α 1 +   F A T 2 · sin α 2 +   F A T 3 · sin α 3 =   200
F A T 1 ( sin α 1 · P o s X 1 ) ( cos α 1 · P o s Y 1 ) + F A T 2 ( sin α 2 · P o s X 2 ) ( cos α 2 · P o s Y 2 ) + F A T 3 ( sin α 3 · P o s X 3 ) ( cos α 3 · P o s Y 3 ) =   100
where: F A T 1 ,   F A T 2 ,   F A T 3 —unknown thruster forces; α 1 , α 2 , α 3 unknown angles of the thruster force; P o s X 1 ,   P o s X 2 ,   P o s X 3 —position of the thruster on the X axis of the ship; P o s Y 1 ,   P o s Y 2 ,   P o s Y 2 —position of the thruster on the Y axis of the ship.
The above example shows that if there are 3 equations, one needs to find 6 unknown values. As the number of thrusters increases, so does the number of unknowns.
In the software developed for analyzing the ability to hold the ship’s position, the LocalSolver [27] solver was used, thanks to which it was possible to calculate such a system of equations using the iterative method. Different data sets are created for the given equations, and then the solver checks if all requirements are met for the given set. The disadvantage of this solution is that it entails computational complexity, and the execution time of the analysis varies, depending on the complexity of the model, from several minutes to over an hour.

4. Simulation Studies of Energy Consumption in Various DP Systems

Capability plots make it possible to determine the energy consumption of thrusters during operations for various environmental forces. Using the dependencies given by DNV GL [26], one can easily convert the force generated by a given thruster into power, which easily translates into energy consumption in a given period of time.
To illustrate the use of capability plots to determine energy consumption, this chapter will compare two different positioning systems: a conventional dynamic positioning system and an anchor set positioning system [74].

4.1. Conventional Dynamic Positioning System

It is assumed that the conventional dynamic positioning system is a system equipped with a set of thrusters that remain active all the time during positioning [75]. The system is capable of responding to any environmental conditions within the scope for which it is designed and when the environmental forces acting on the ship do not exceed its position-keeping capability.
For simulation purposes, a ship the dimensions of which are given in Table 2 was used. It was equipped with generators, the parameters of which are presented in Table 3. Data on ship thrusters is available in Table 4. The percentage share of each of the thrusters in the power consumption of individual electrical switchboards is presented in Table 5.
A vessel with the dimensions given in Table 2 is an example of a small vessel typically used in the offshore sector or as a search and rescue vessel.
The ship was equipped with a three-phase 690 V, 60 Hz power supply system. The 690 V marine power plant consists of 4 main diesel generator sets connected to two separate switchboards (Table 3). One of the switchboards powers all starboard devices and the other one powers port devices. Two generators are connected to each switchboard: one with 1500 kW of power and one with 2000 kW. Each electrical switchboard can supply up to 3,500 kW of power [76,77,78,79,80]. The thrusters are connected to the switchboard by means of circuit breakers, a three-phase transformer and a 12-pulse converter [81,82,83,84,85,86].
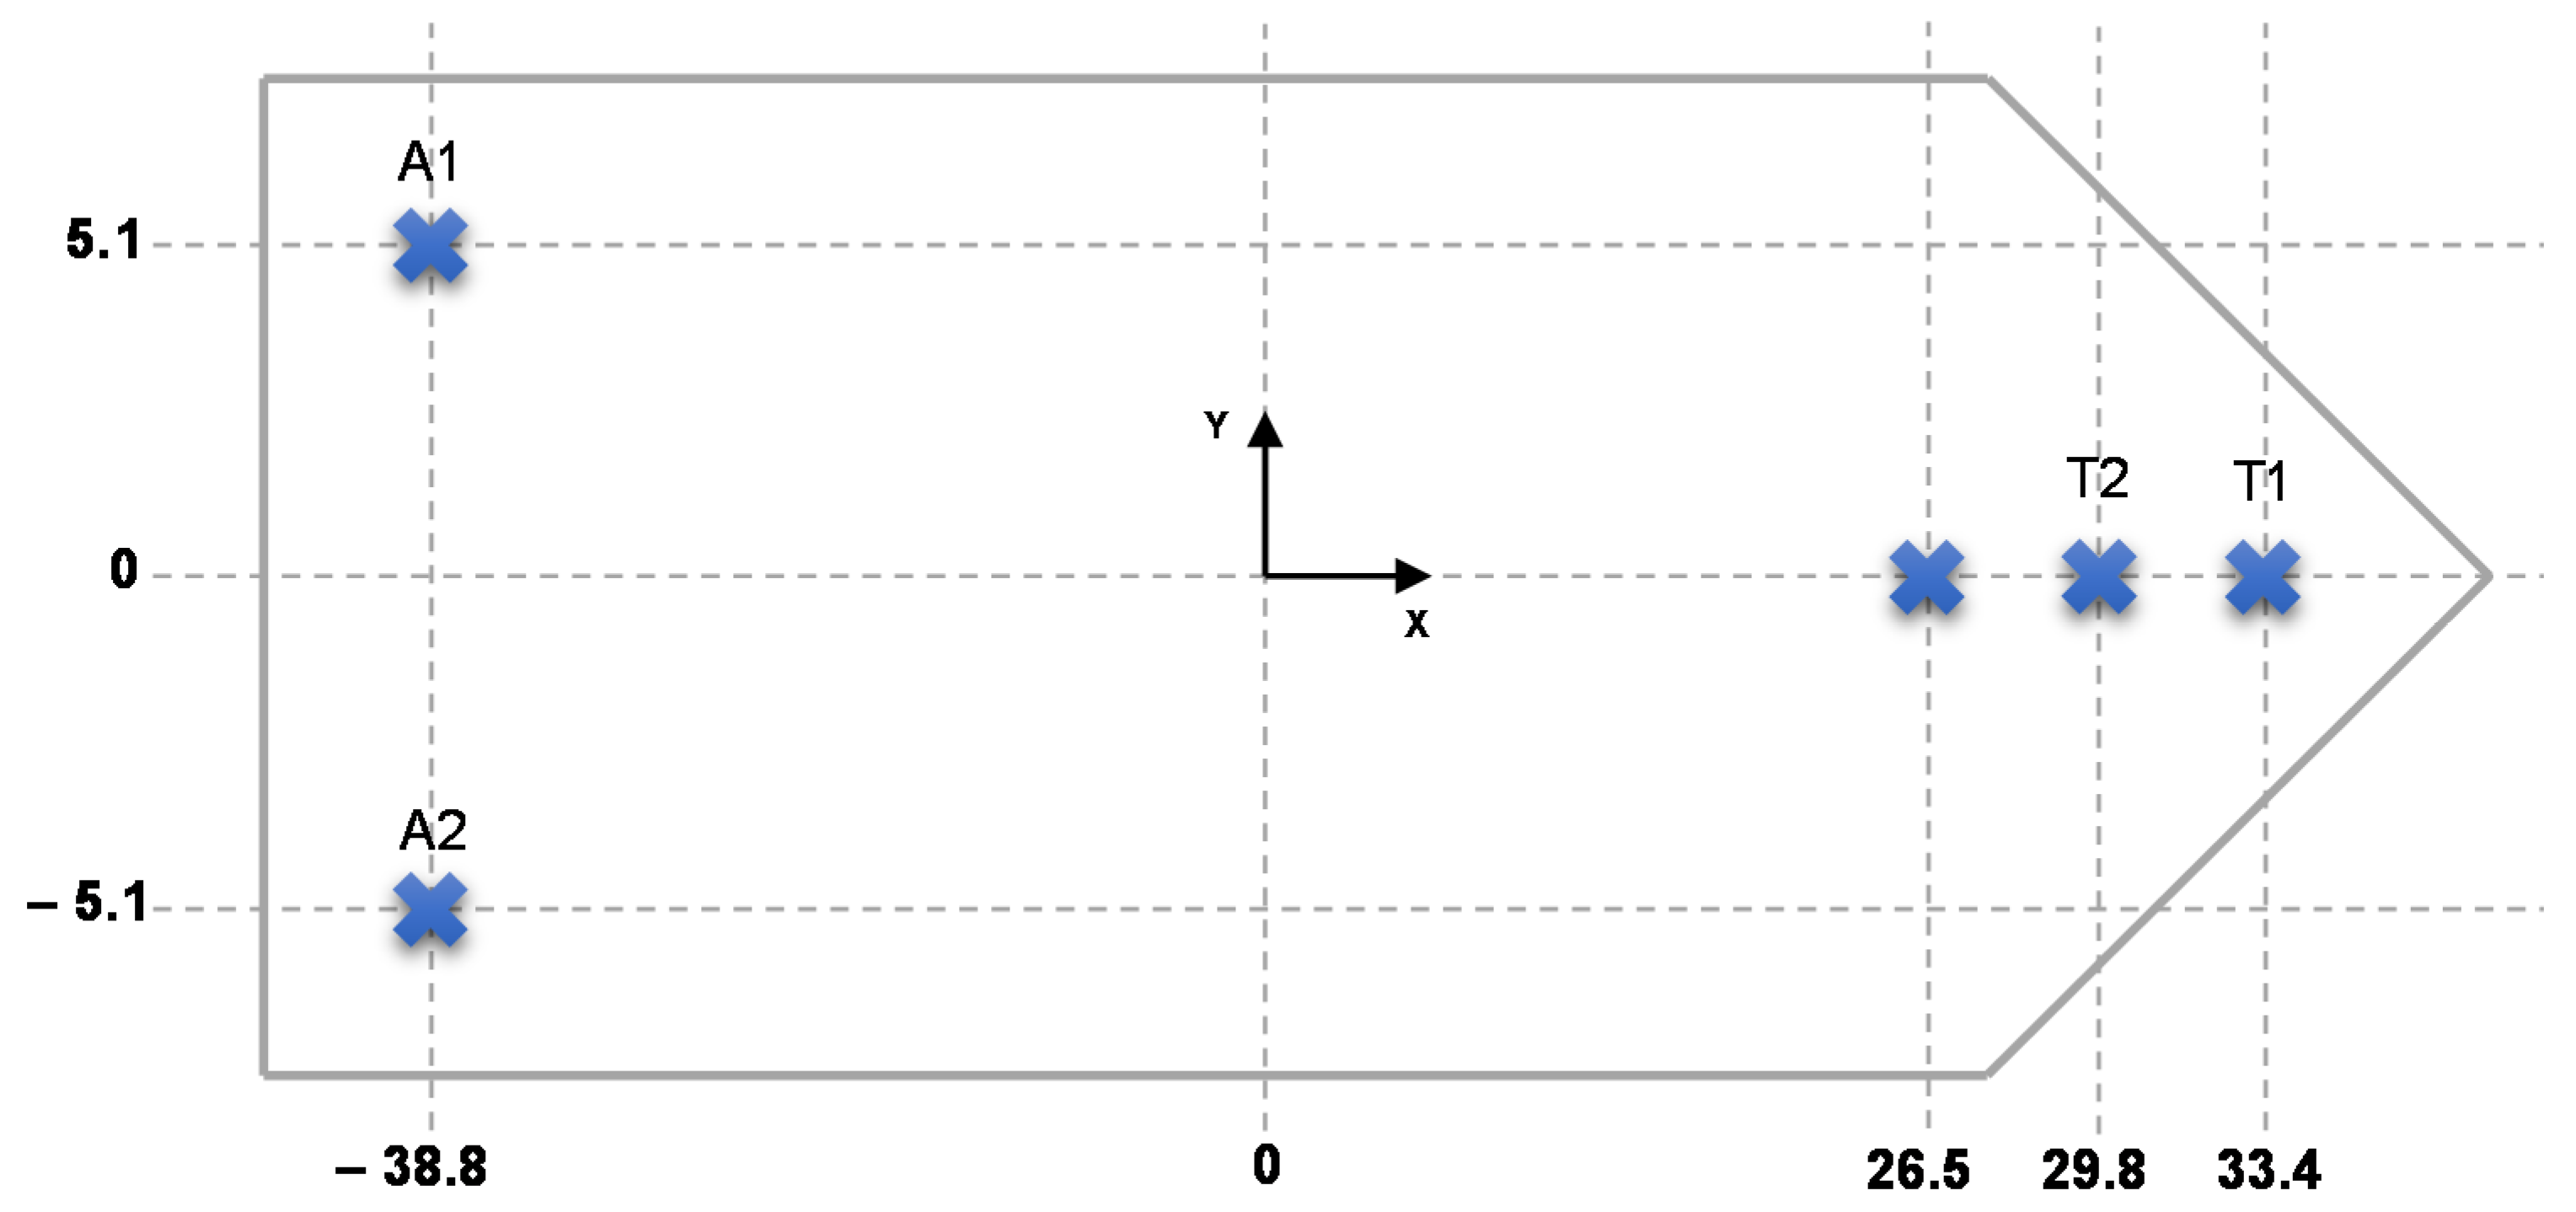
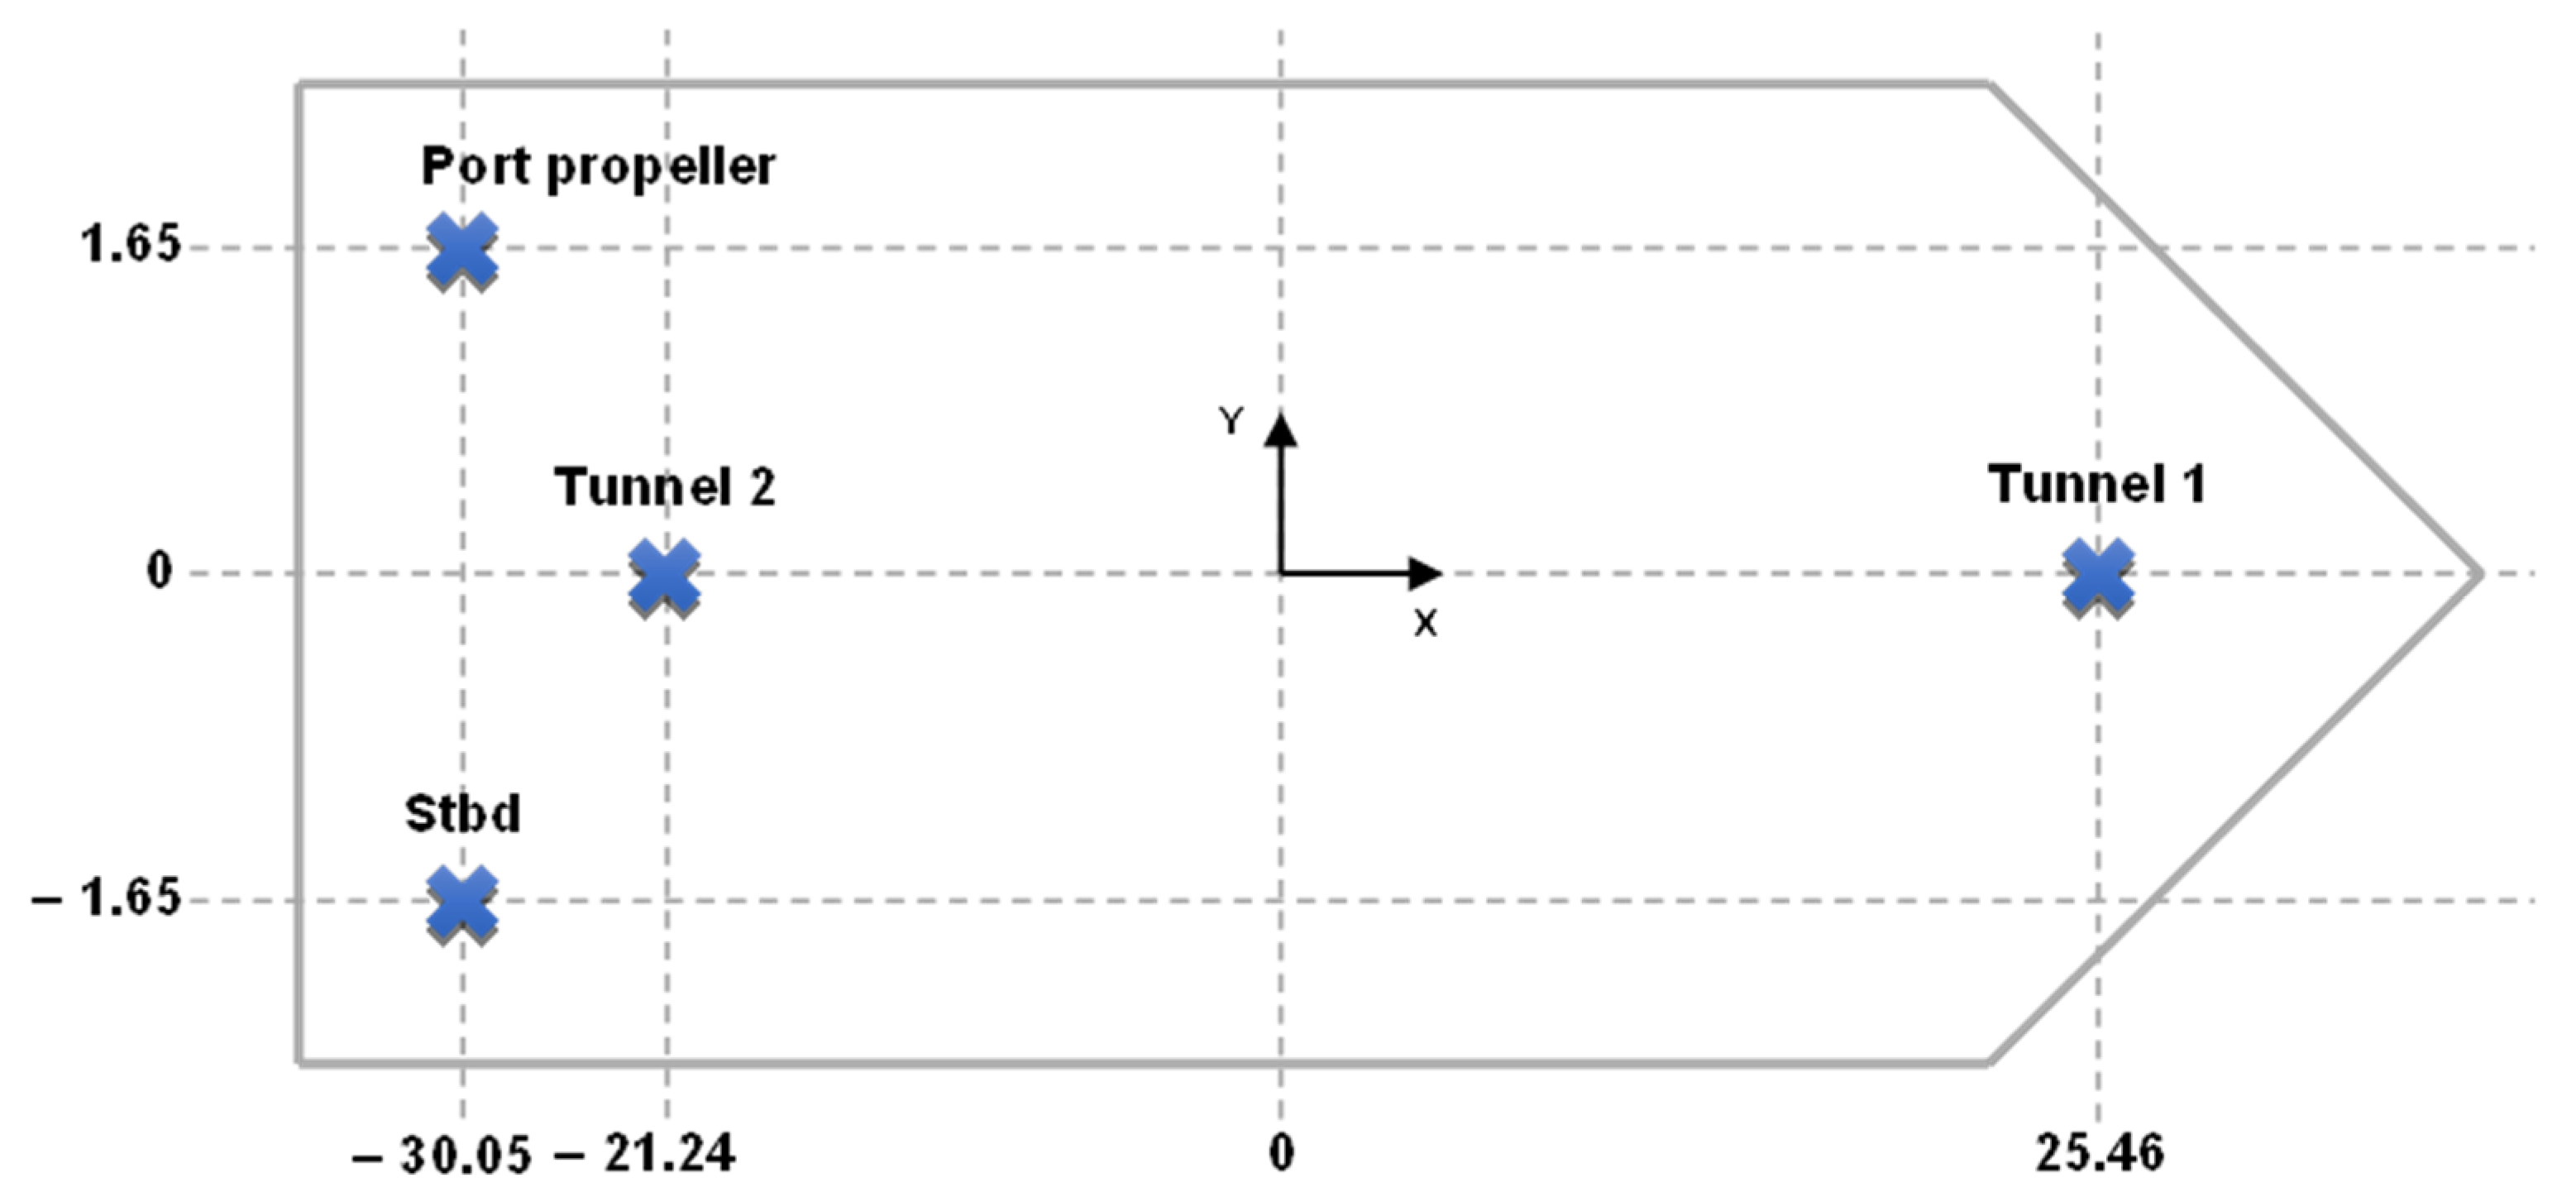
The ship is equipped with five thrusters as shown in Table 4. It has two tunnel thrusters T1 and T2, a small azimuth thruster AT1 at the bow and two larger azimuth thrusters A1 and A2 at the stern of the vessel [87,88]. Such a combination of thrusters allows for easy maneuvering of the ship both in the port and during open sea operations, e.g., during positioning at an oil platform. Additionally, thanks to the azimuth thrusters, it easily compensates for changes in the environmental force caused by the change in the angle of wind attack on the hull.
Figure 3 shows the arrangement of individual thrusters on the ship. The origin point to which distances are related is at point LPP/2 (see Table 2). Positive values for the X axis are towards the bow of the vessel, negative values towards the stern. For the Y axis, positive values are on the port side and negative values on the starboard side.
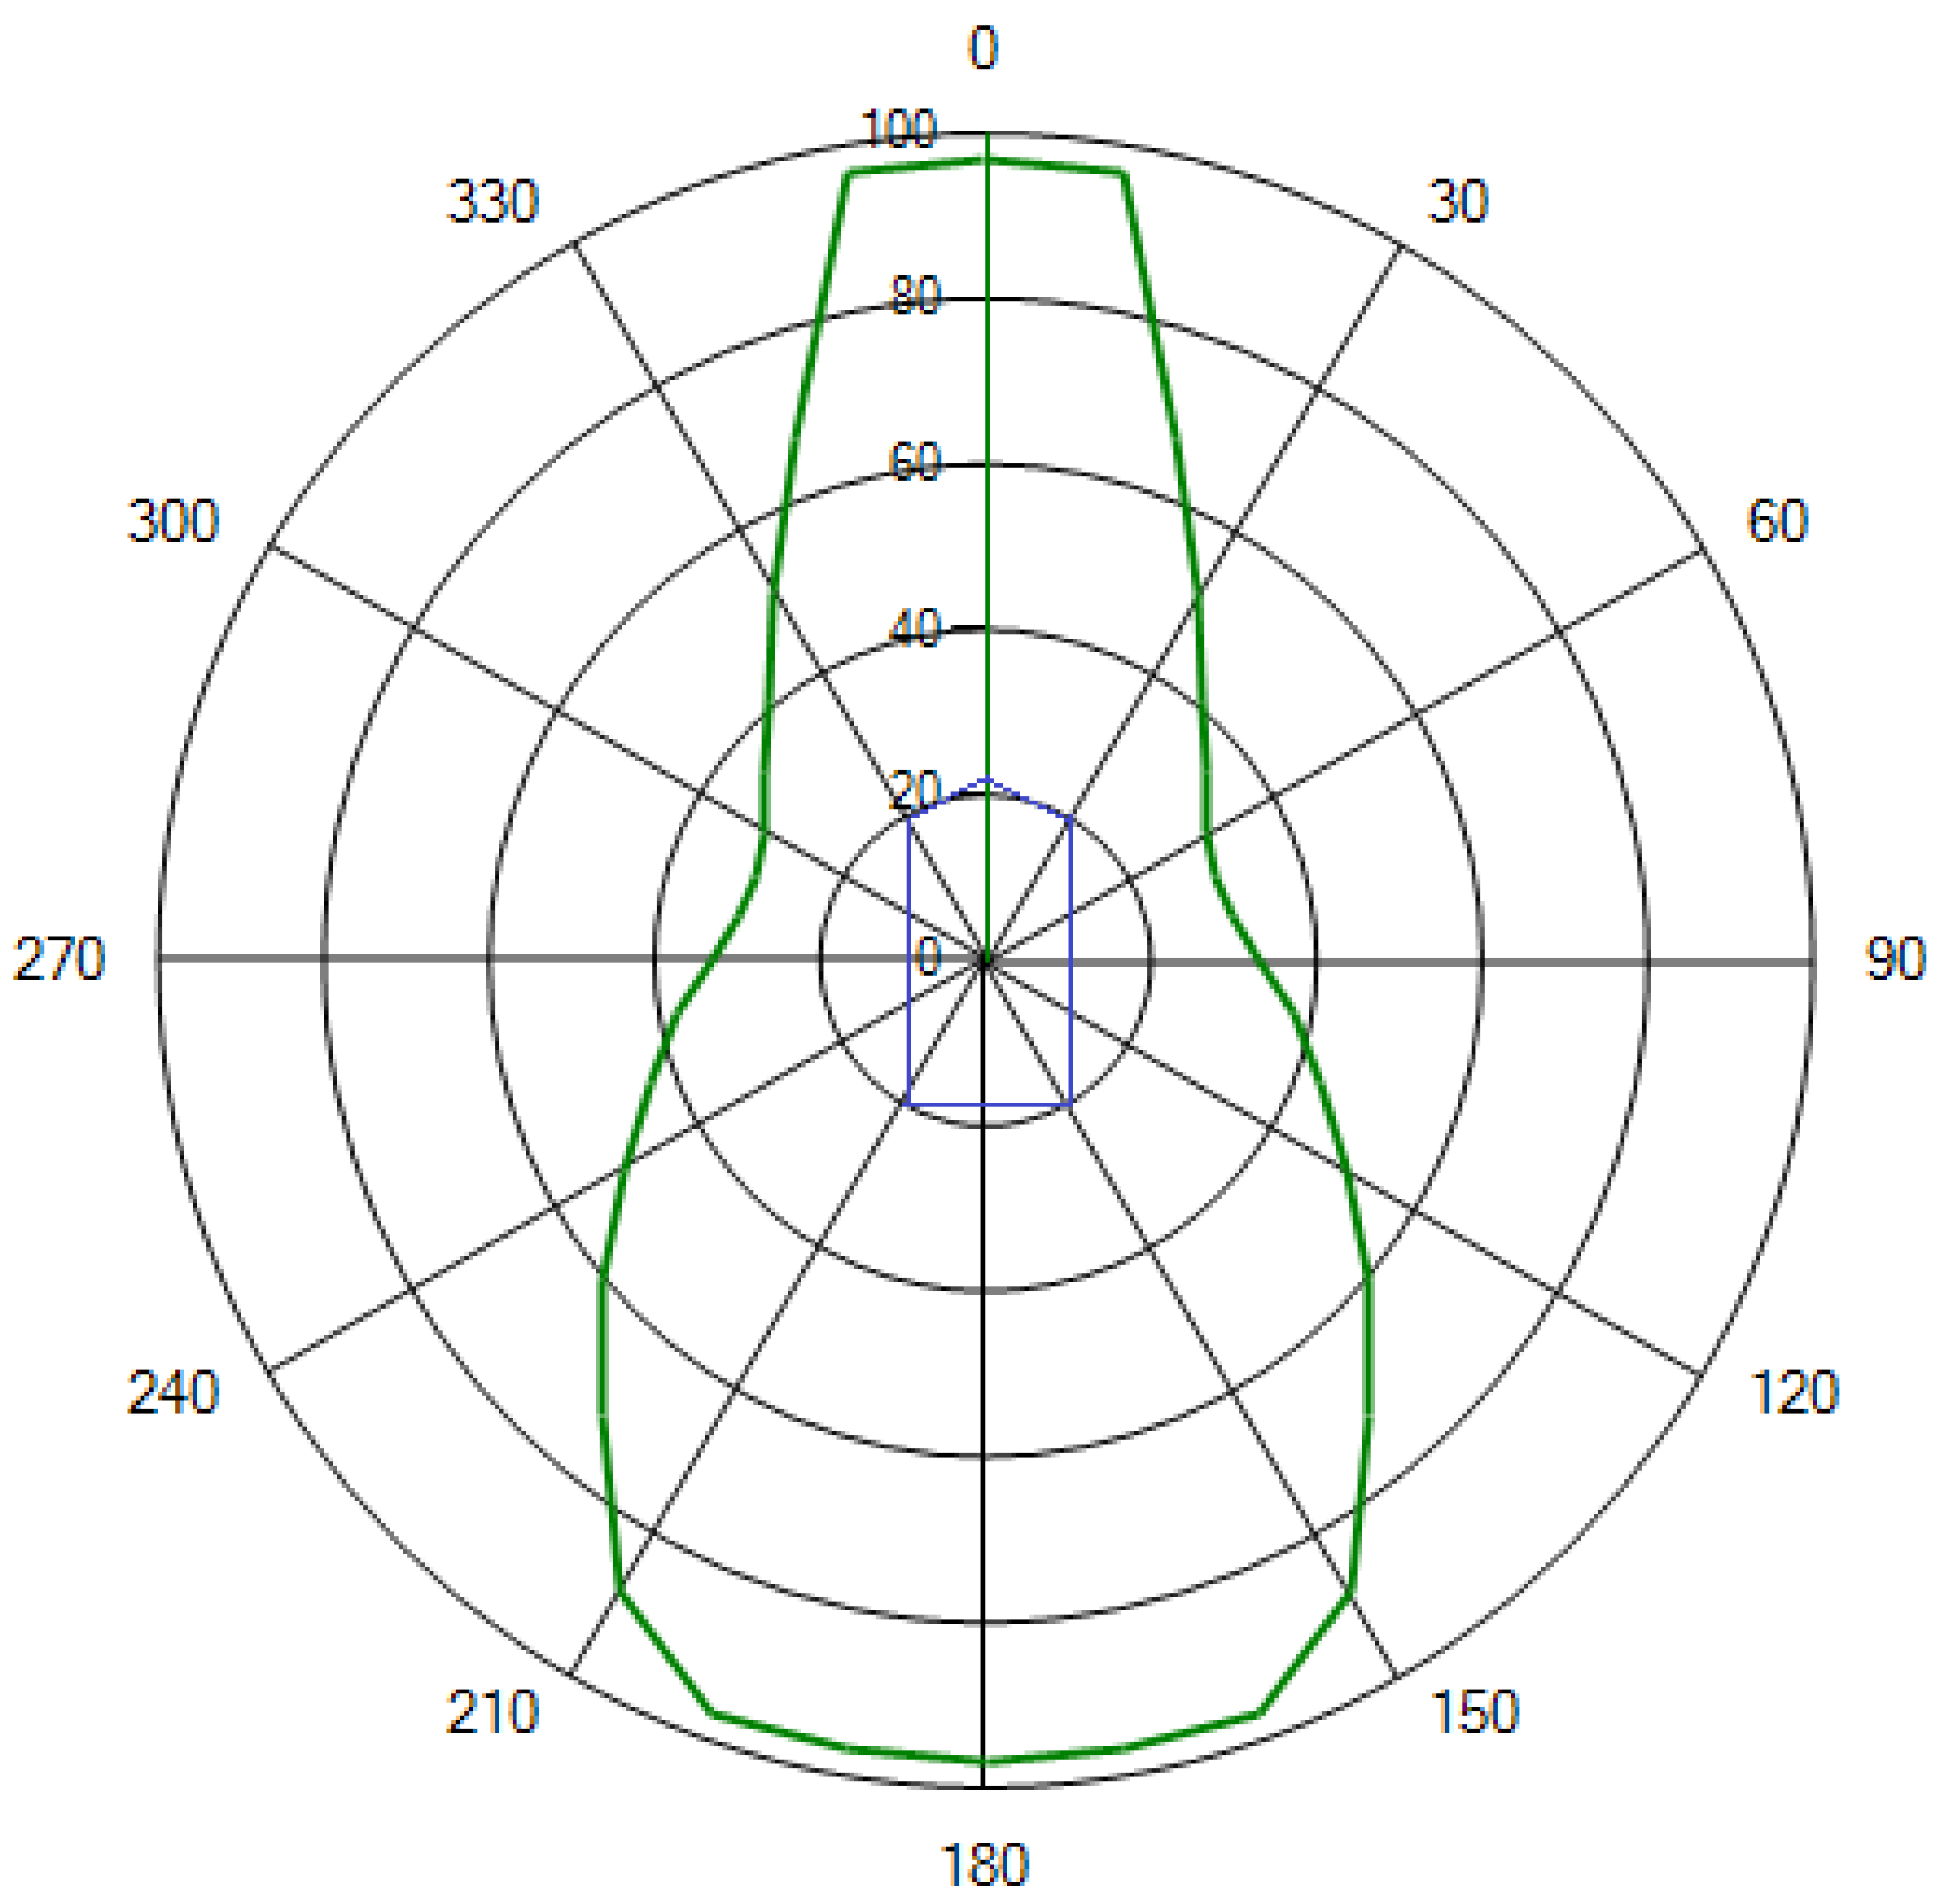
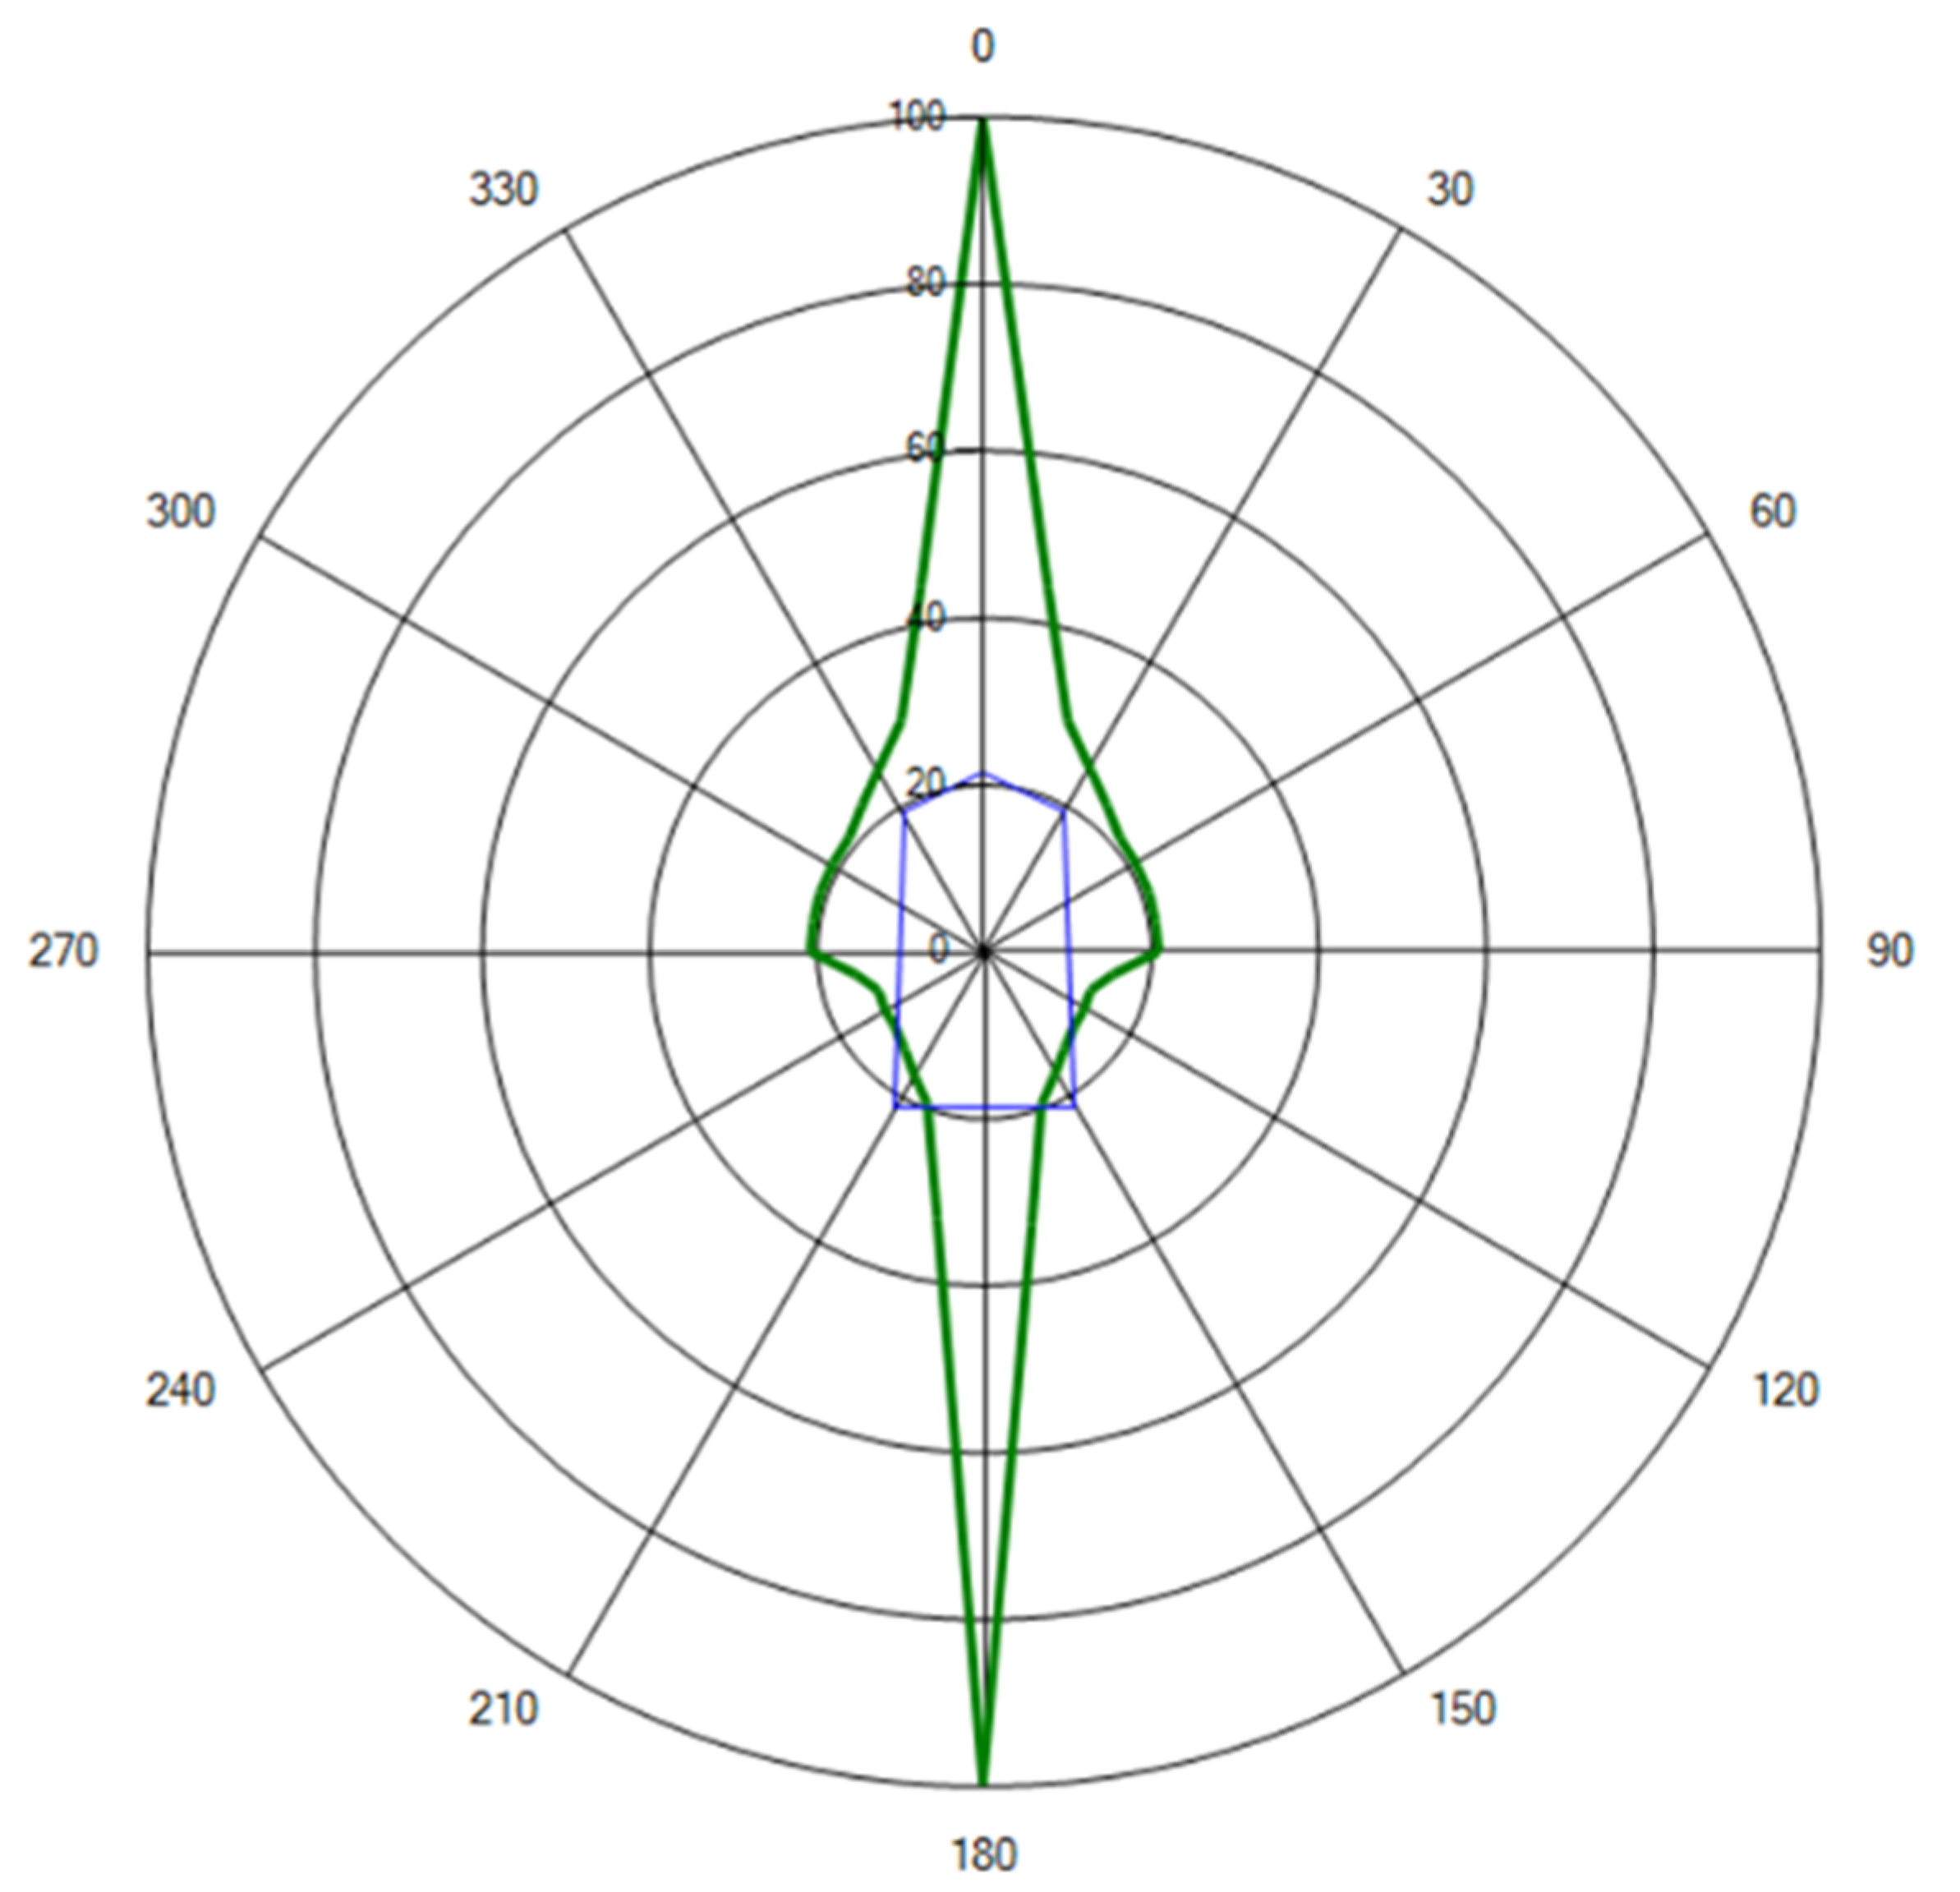
The discussed capability plot analysis will be carried out for the “Intact” condition, which is a situation where all thrusters are working and there is no damage to the ship’s electrical system. In this case, it is assumed that each thruster can get a percentage of its maximum power from a specific electrical switchboard, in accordance with the data given in Table 5. The T1 and A2 thrusters are connected only to switchboard No. 1, and T2 and A1 to switchboard No. 2 The AT1 thruster is connected to both switchboards and can draw half of its maximum power from each of them. The result of the capability plot analysis is shown in Figure 4.
The vertical axis of the graph indicates the maximum wind speed in knots at which the vessel will still be able to hold its position. It is assumed that 0 degrees on the graph corresponds to the wind from the bow and 180 degrees to the wind from the stern of the vessel.
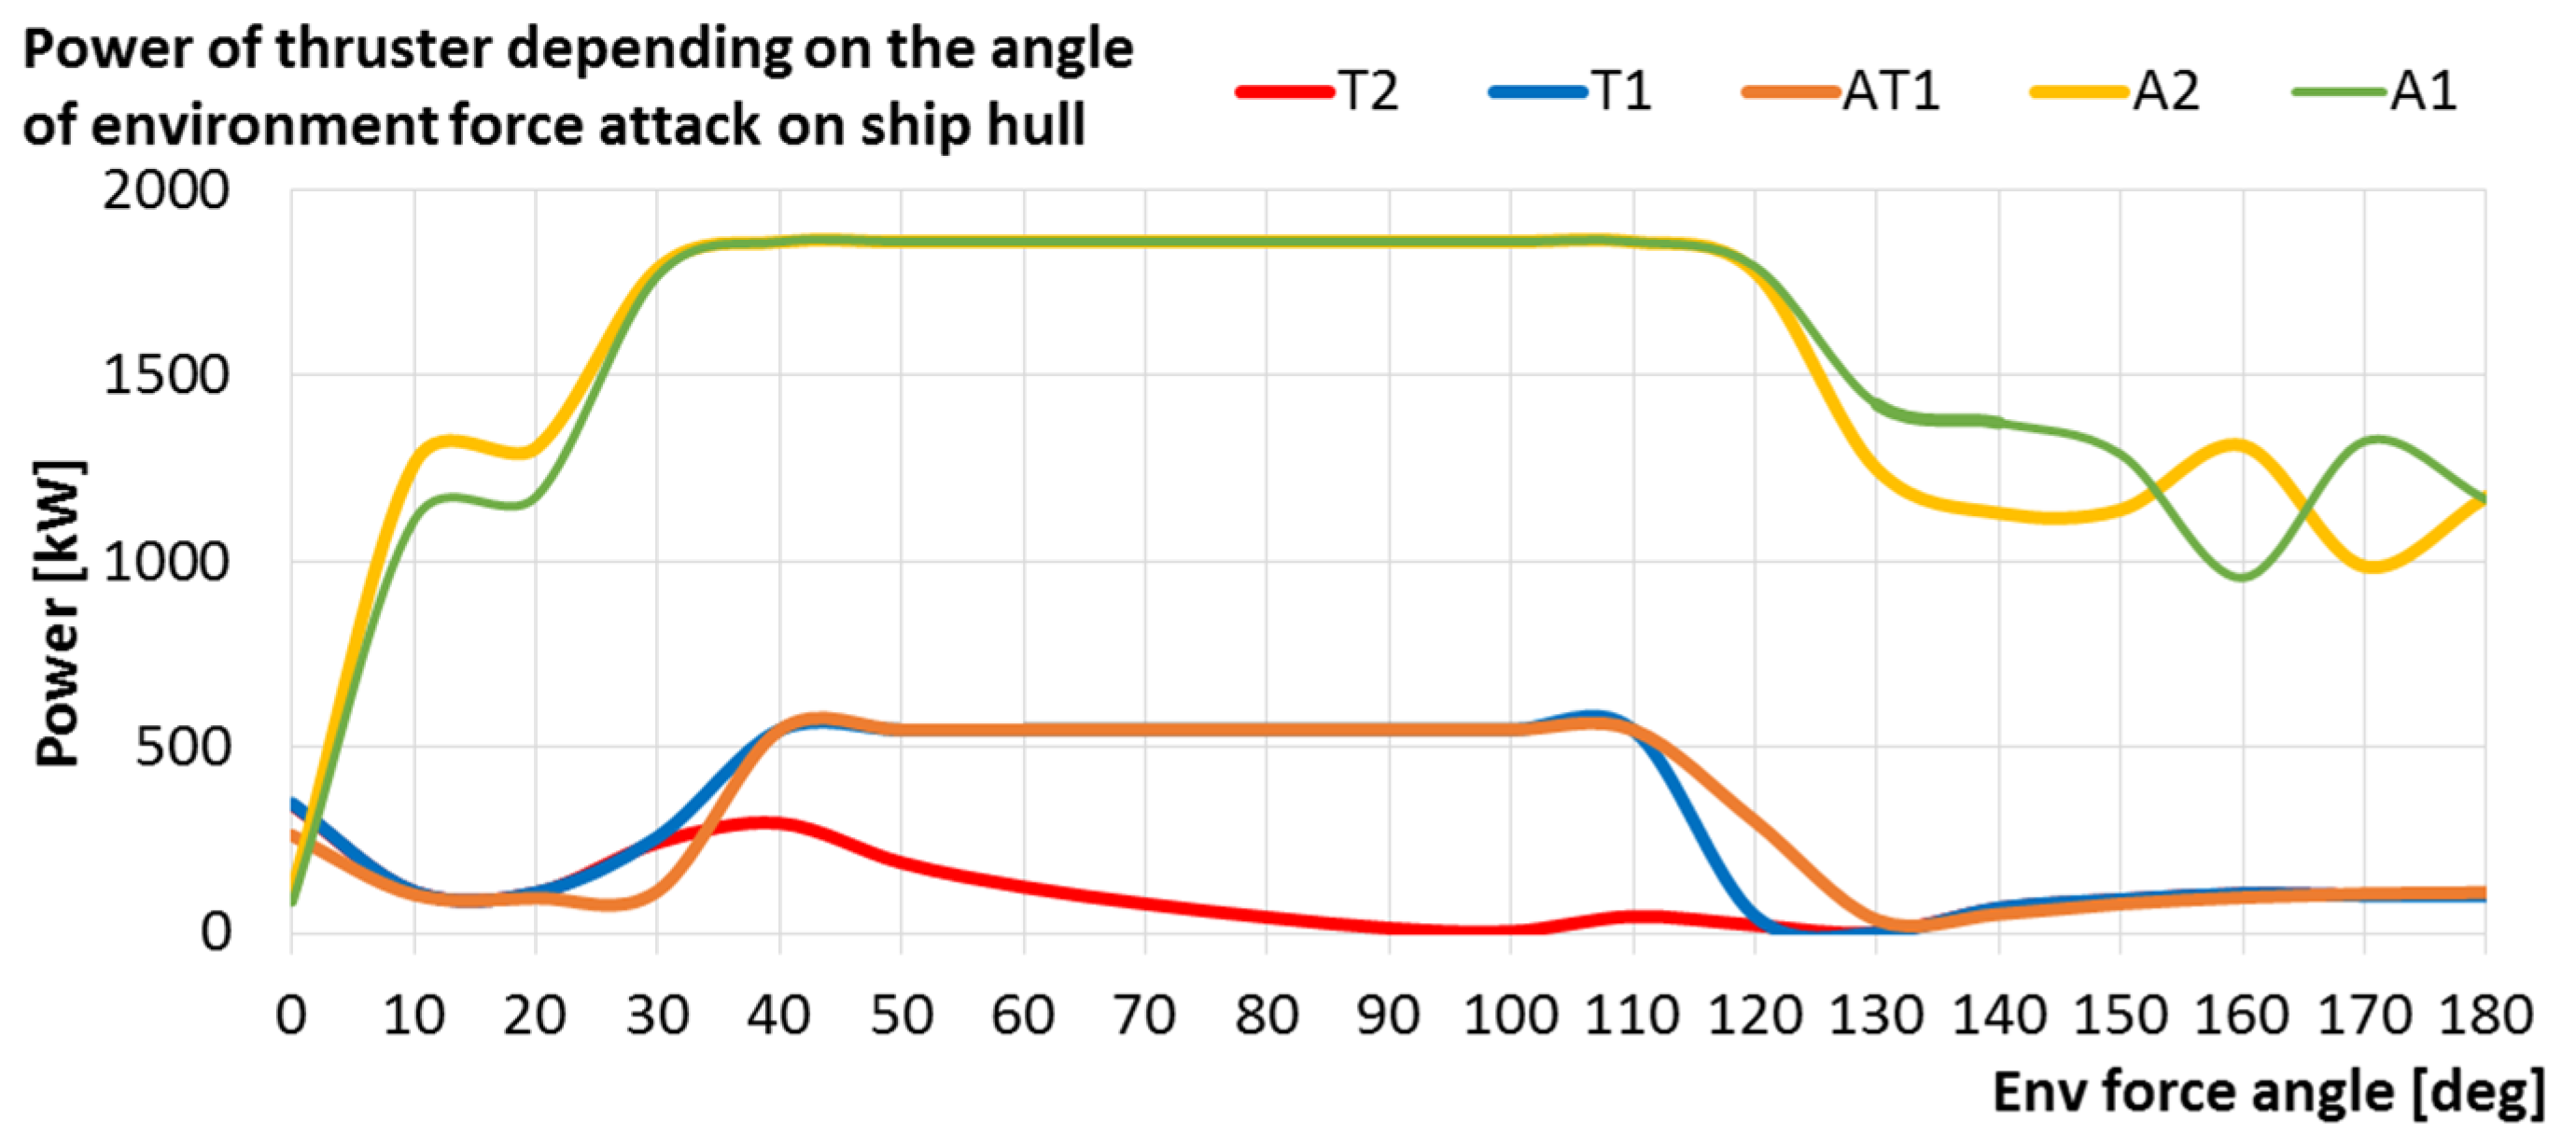
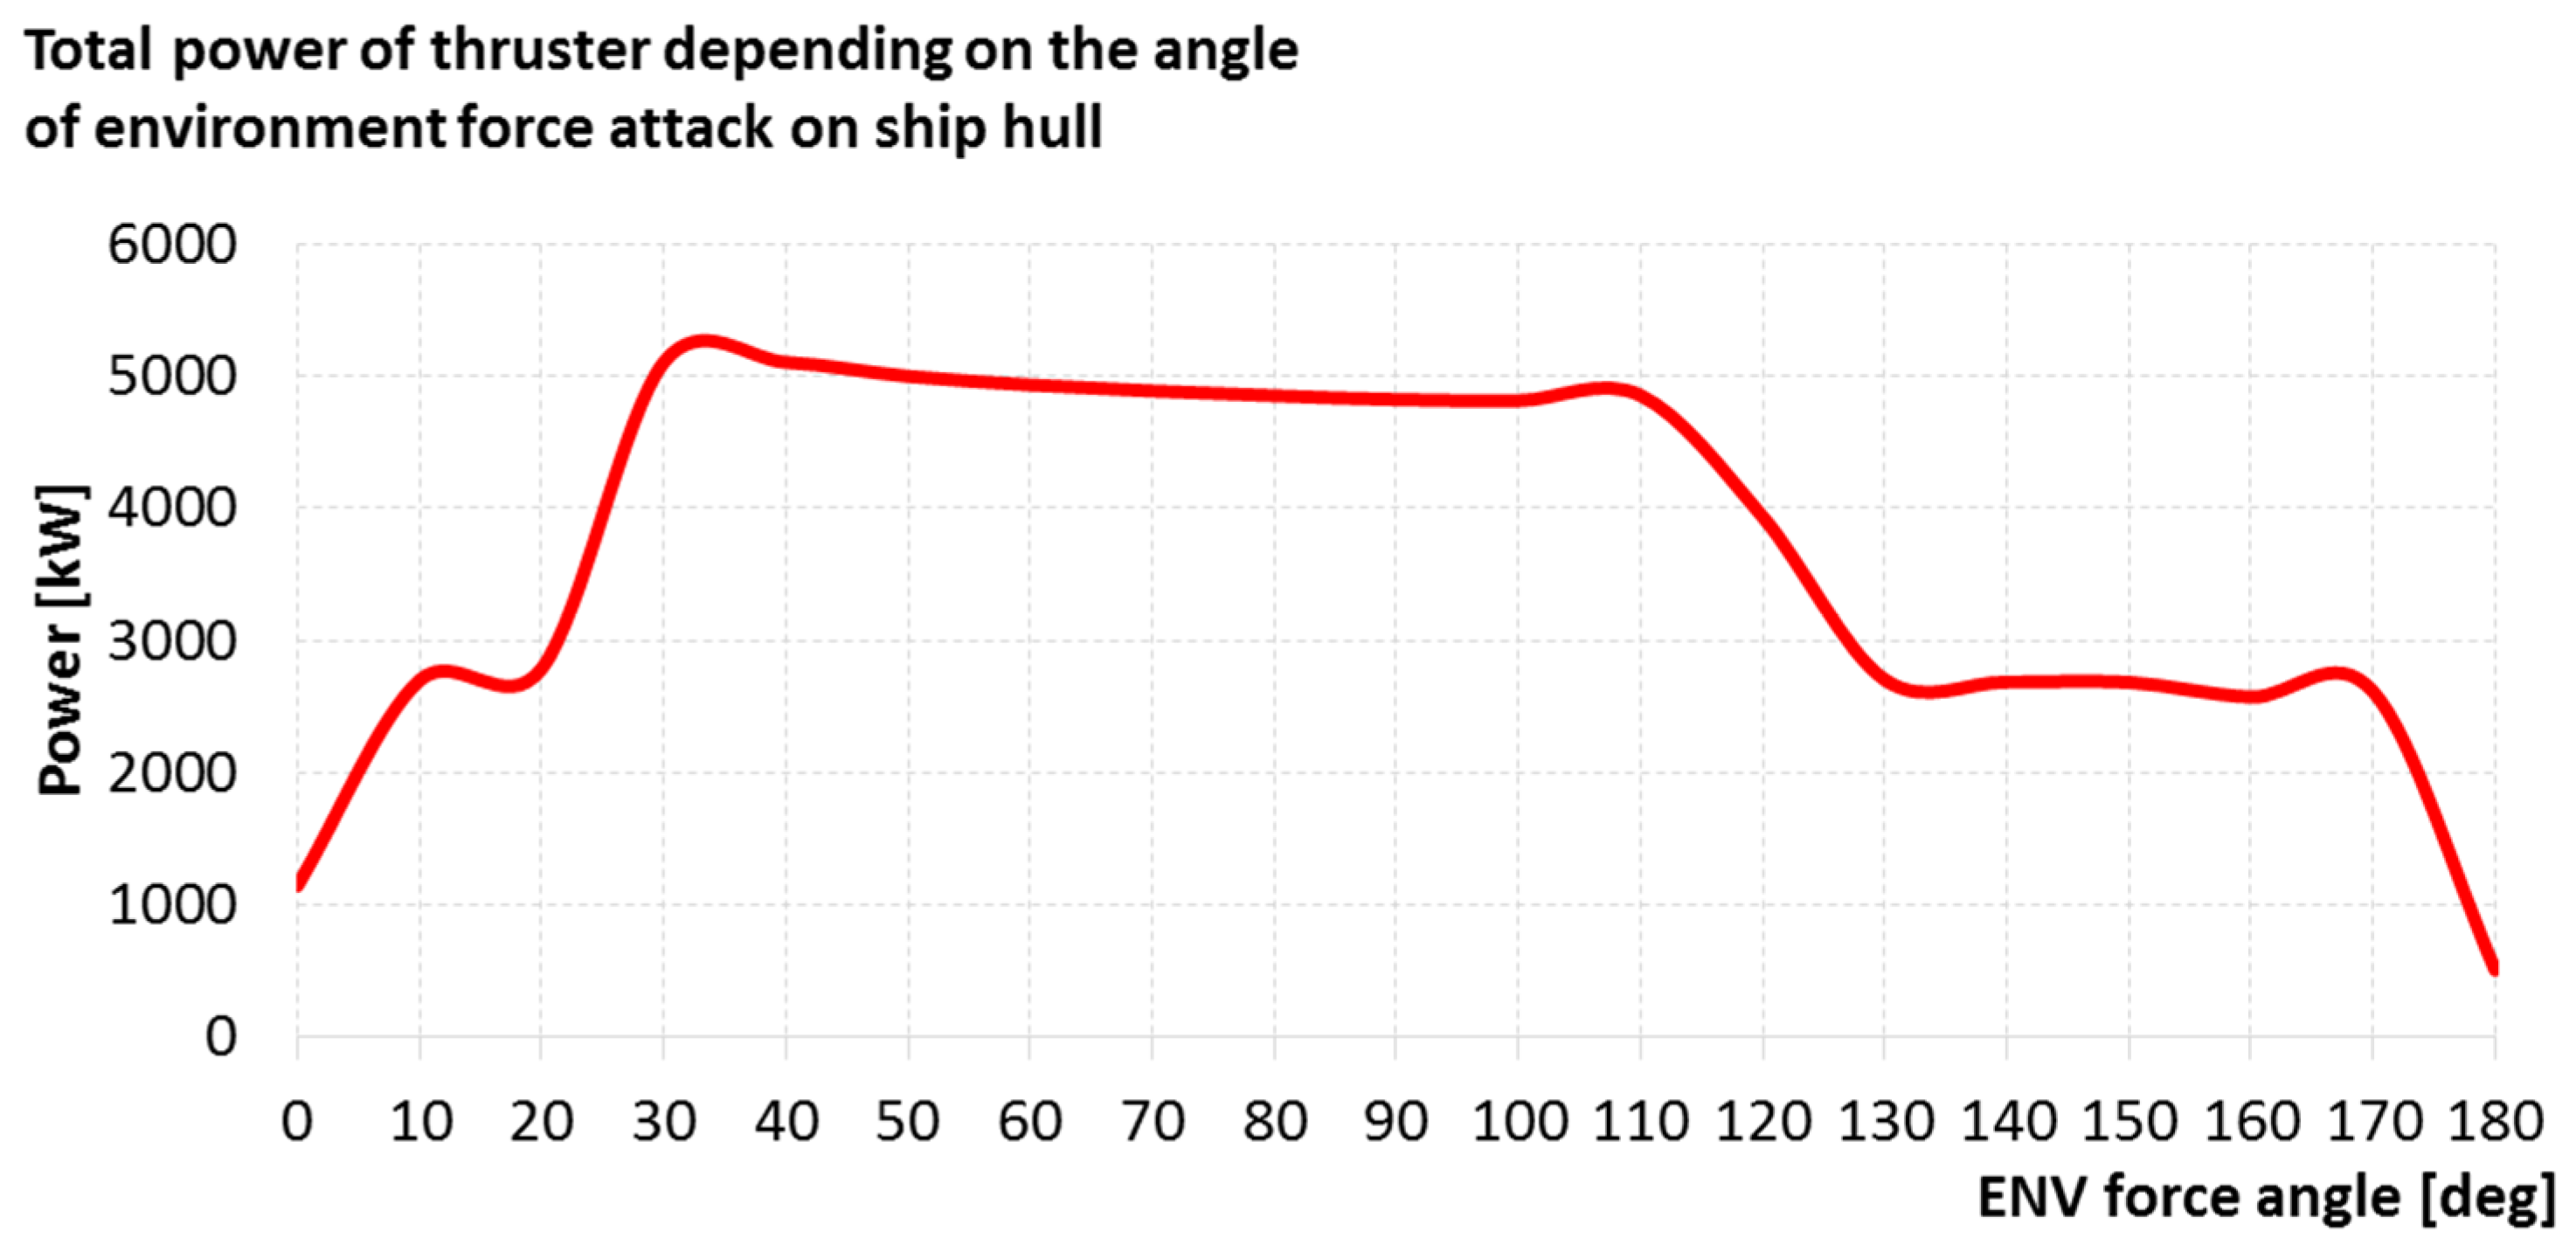
When delving into the data provided by the above analysis, several interesting relationships can be distinguished when it comes to the power of individual thrusters during operation. Figure 5 shows the dependence of the power of individual thrusters on the angle of the environmental forces for the wind speed values marked with the green line in the diagram in Figure 4. Figure 6 shows the dependence of the total power of all thrusters on the angle of environmental forces, for the same wind speed and direction data.
Figure 5 shows that both azimuthal thrusters have the largest share of power in maintaining position, which is due to the presence of significant longitudinal and transverse forces generated by the environment. Figure 6 shows the data from Figure 5 as the sum of the forces of individual propulsors for a given angle of interaction of environmental forces.
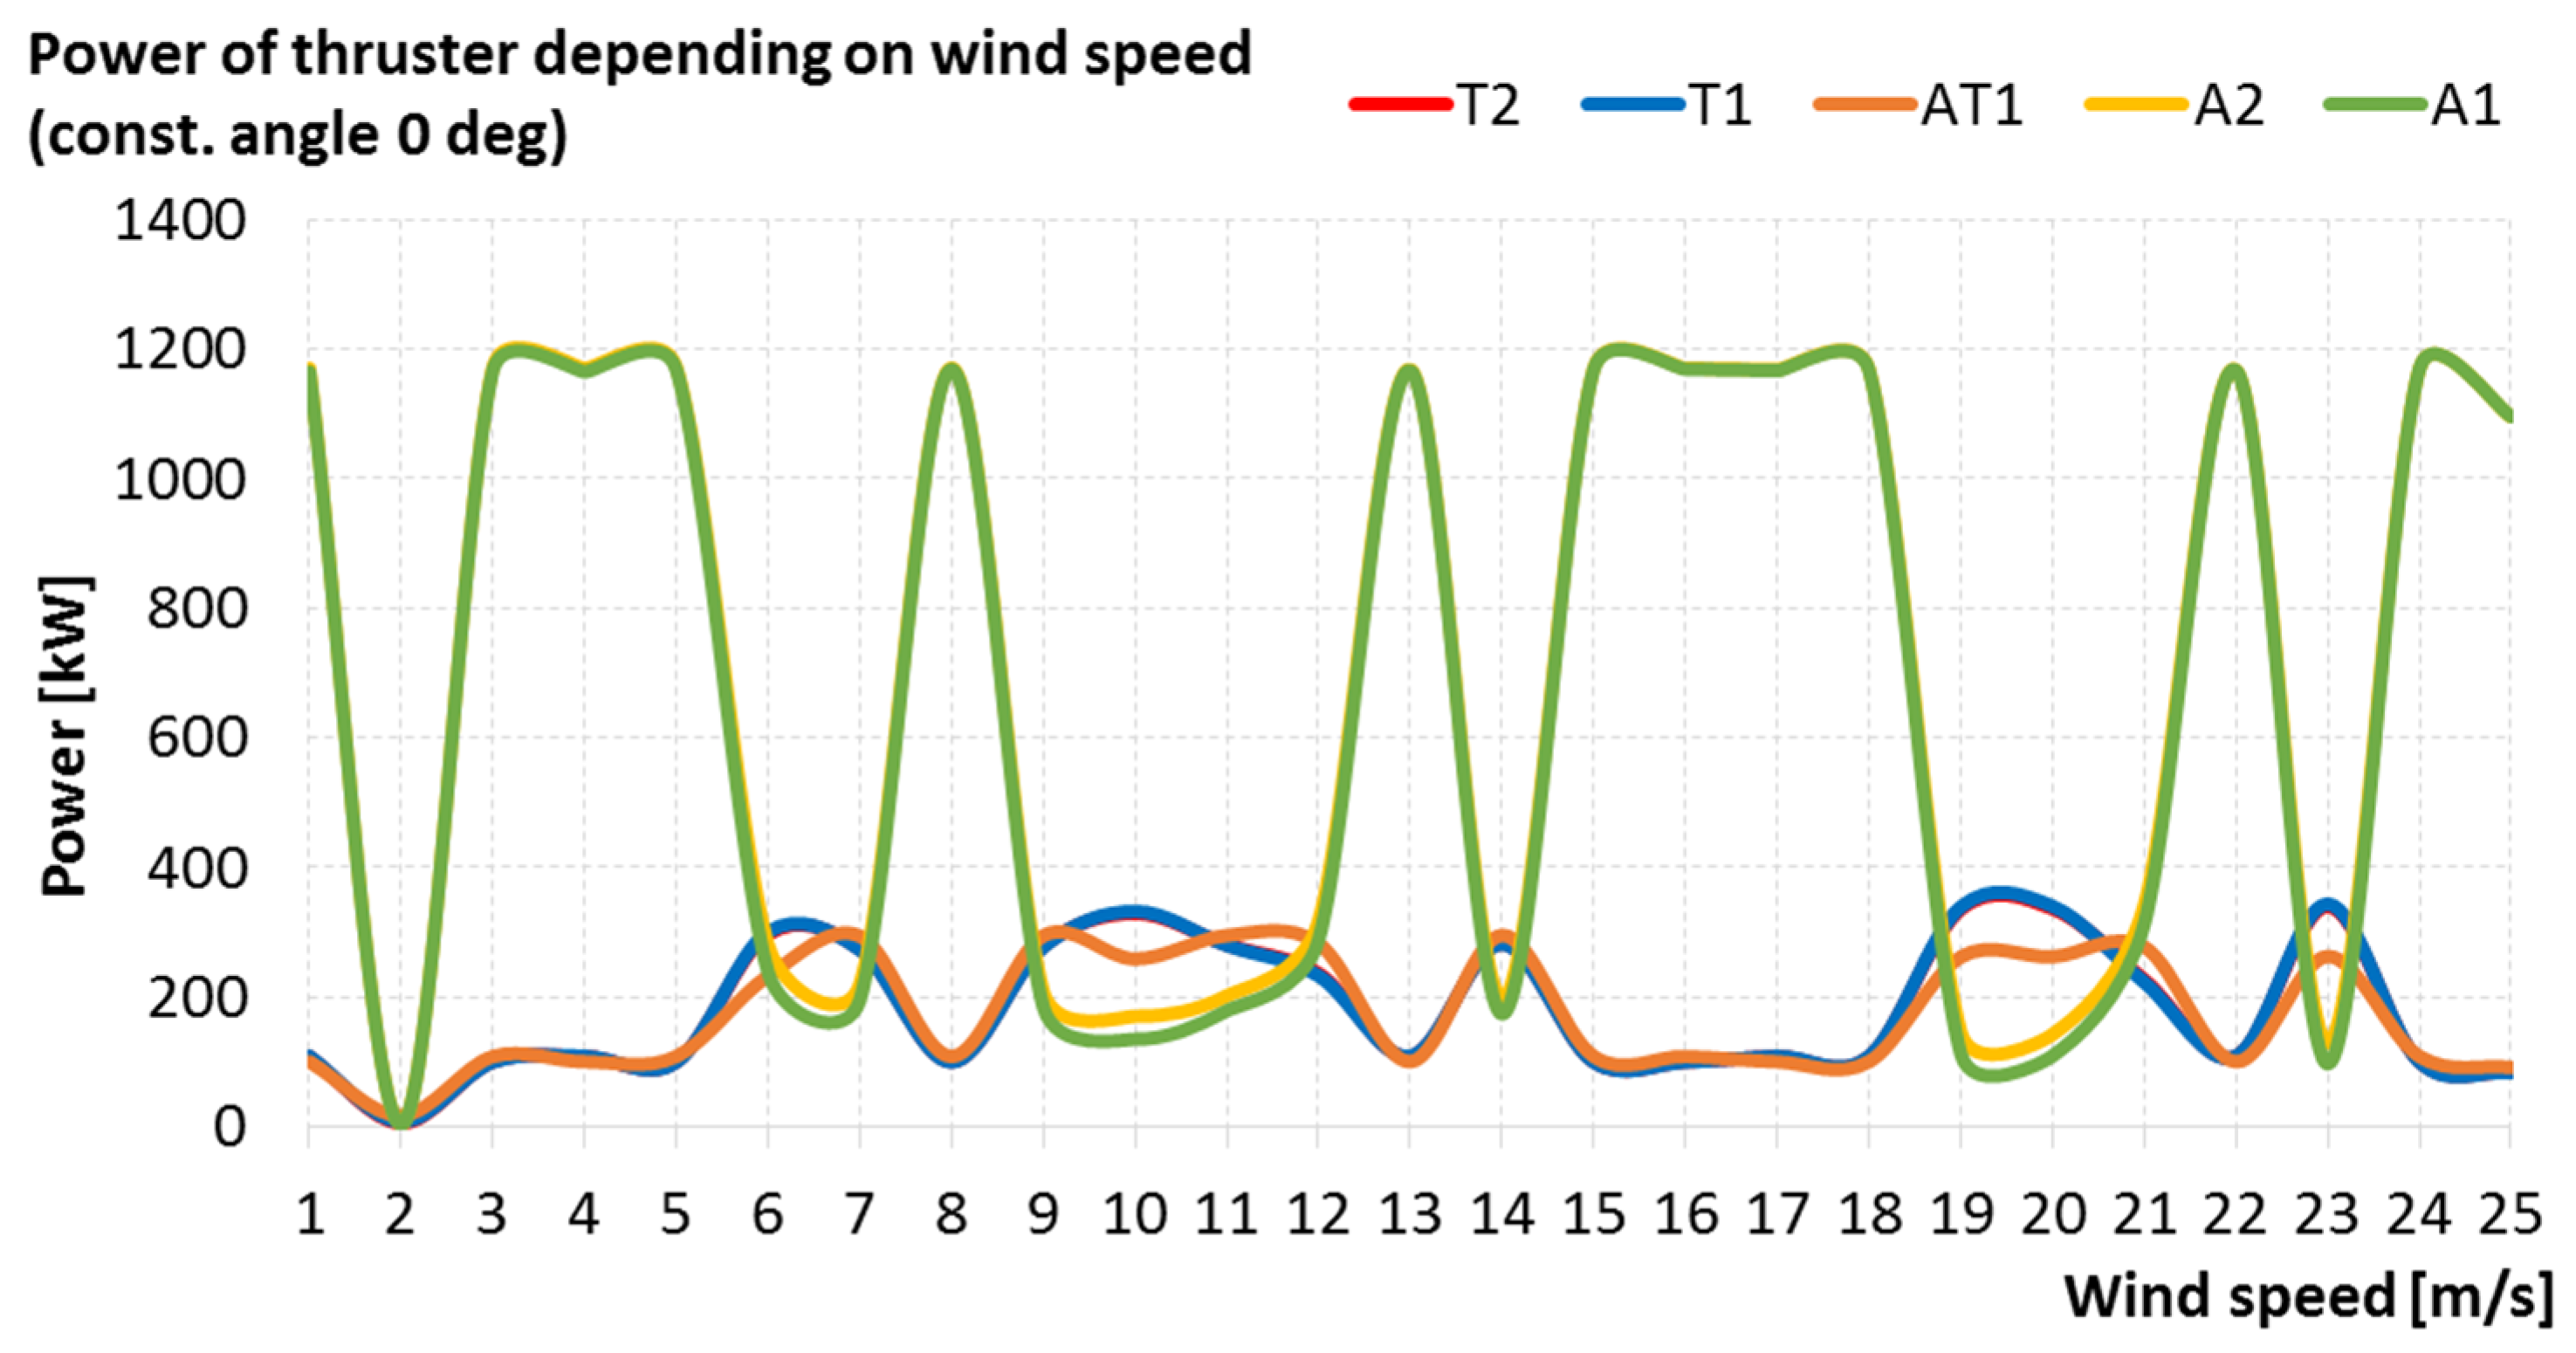
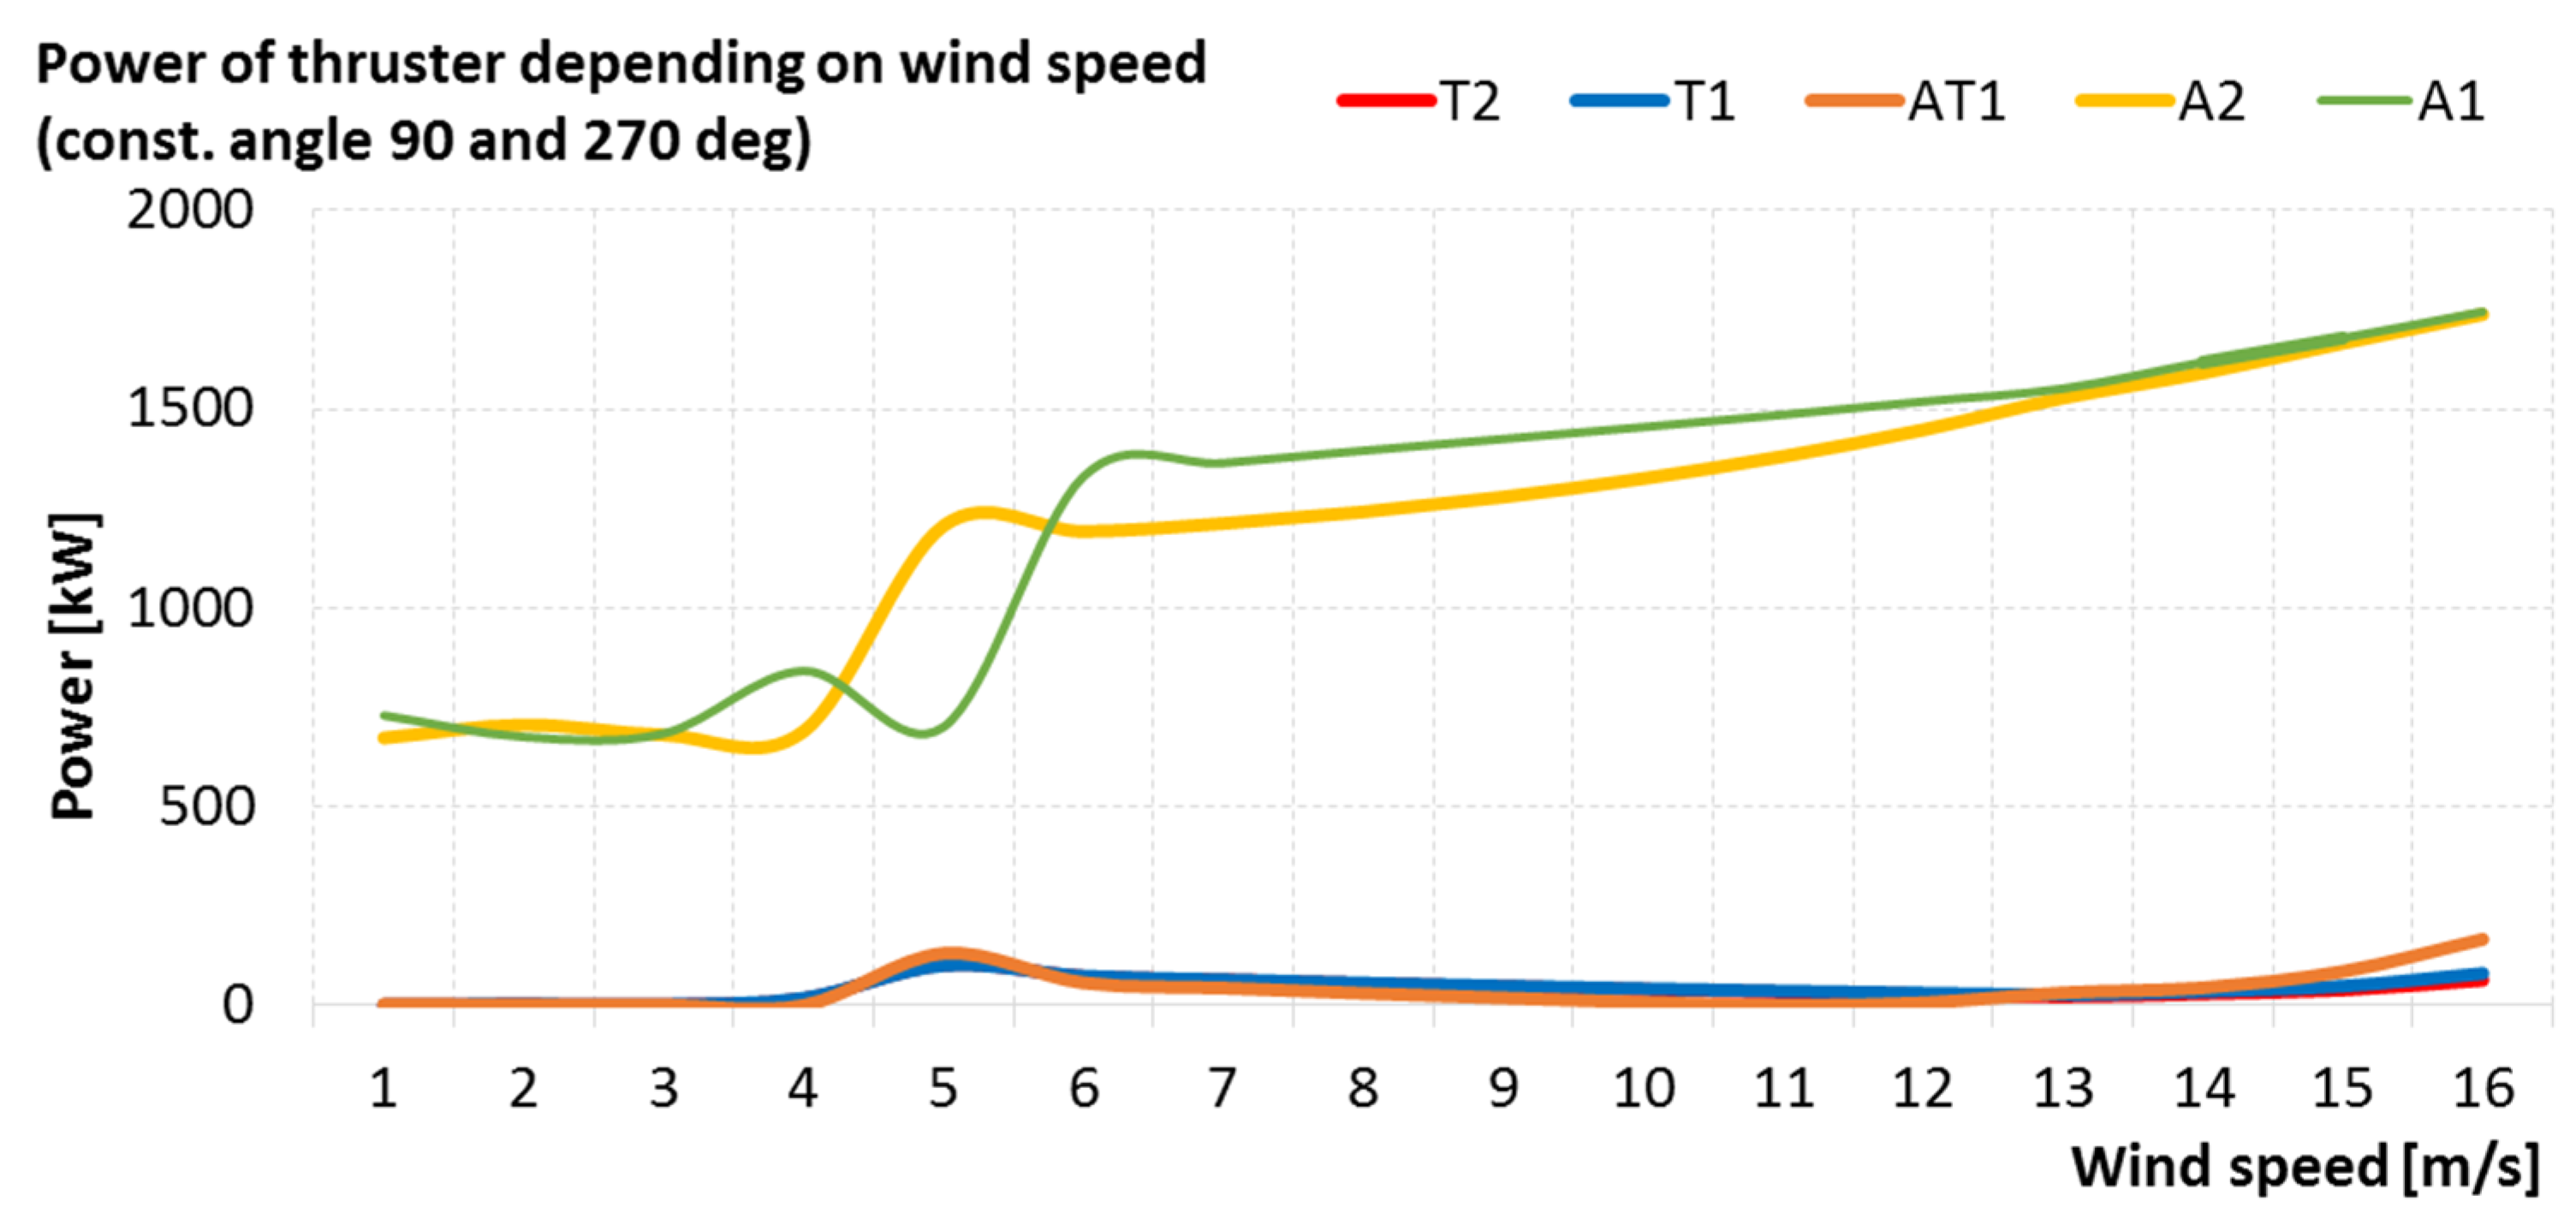
Another analysis that can be carried out is the selection of a constant angle of environmental impact on the ship and determination of the power consumption with changing wind speed. This type of analysis will be used later in the article to determine the energy consumption of thrusters. Figure 7 shows the analysis of power consumption by thrusters for a constant angle of incidence of environmental forces.
The wind speed scale in Figure 8 has been limited to 16 m/s as this is the maximum speed for a 90 or 270 degrees angle at which the ship can hold its position. The characteristics plots presented in Figure 8 show that the azimuth thrusters are mainly responsible for maintaining the position. This is due to the fact that they can rotate practically 360 degrees and it is easier to use them to compensate for environmental forces than to determine the thrust vectors for each azimuth and tunnel thrusters.
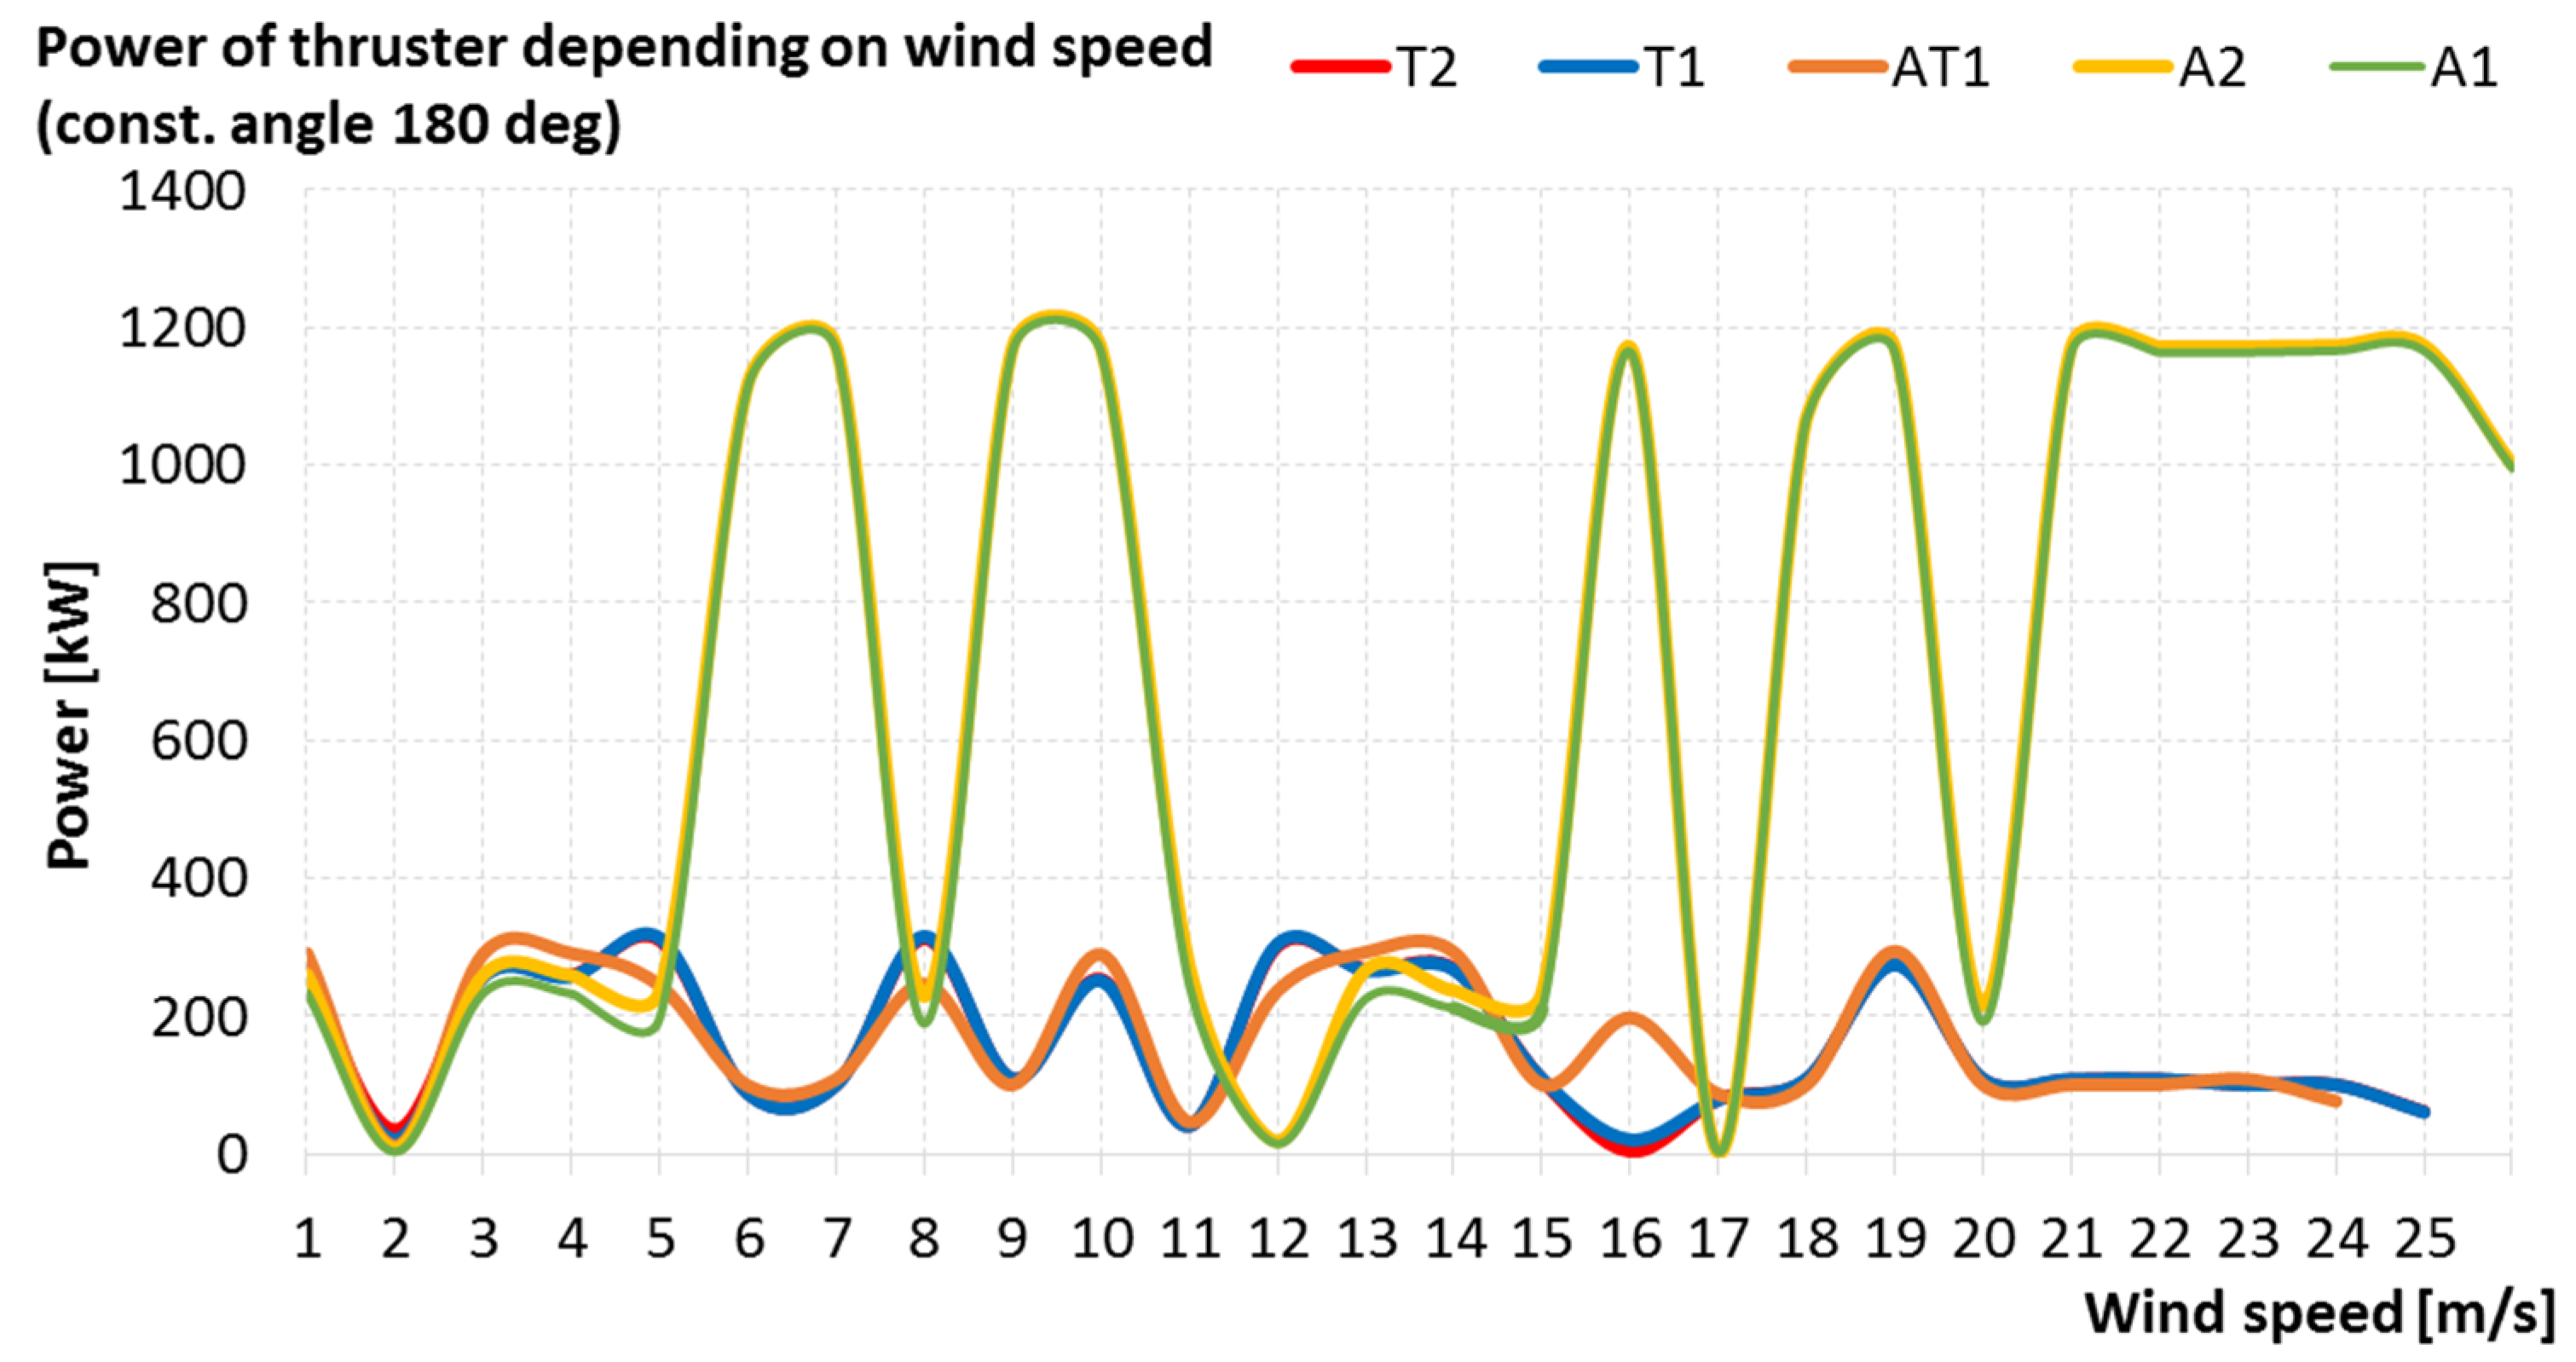
In the case of the influence of environmental forces at an angle of 180 degrees, it can be seen that the azimuth thrusters play a major role due to the fact that only the surrounding longitudinal force is present. Figure 9 also shows that tunnel thrusters are involved in positioning, which indicates that the azimuthal thrusters in fact produce not only longitudinal but also transverse force that needs to be compensated. Figure 9, Figure 10 and Figure 11 show the dependence of the power of individual thrusters on the wind speed for a constant angle of the environmental forces.
In order to determine energy consumption by thrusters, the positioning time and wind speed changes should be determined. Figure 10 shows a graph of changes in wind speed during 10 h of vessel positioning.
Based on the graphs in Figure 7 and Figure 10, it is possible to determine the total power consumption corresponding to the given wind speed.
The energy consumption ET can be determined by calculating the area under the curve in Figure 11, while the average energy consumption Eavg can be calculated by dividing the ET by the positioning time. The simplest method for determining ET is to integrate the area under the graph using the trapezoidal rule, which gives the following result:
ET = 18257.86 [kWh]
Eavg = 1825.7 [kWh]
where: ET—total energy consumption during the operation, Eavg—average hourly energy consumption
Based on the value of total energy consumption, the amount of fuel used during operation can be determined and the approximate value of CO2 emissions can be determined:
E f u e l = 45.6   [ MJ / kg ] = 12.66   [ kWh / kg ]
C O 2 e m i s s i o n = 11.24   [ t ]
where: Efuel—calorific value of 1 L of diesel fuel, C O 2 e m i s s i o n —amount of CO2 emitted per tonnes.
Despite many advantages, the conventional method of positioning the ship with thrusters causes high energy consumption, which translates into high fuel consumption and CO2 emissions. In 10 h of positioning, the ship emitted more CO2 than Japan per capita in 2017 [89]. Nowadays, there is a great interest in saving non-renewable energy resources [90,91] by looking for “greener” methods of generating energy or, if it is not feasible, at least in reducing energy consumption.

4.2. Positioning System with a Set of Anchors

There are situations in which typical thruster-based dynamic positioning cannot be used, e.g., when divers are working in the ship’s vicinity or the ship will need to hold its position for several days. In such a situation, a positioning system based on an anchor set can be used. In this system, positioning depends on placing the anchors symmetrically around a given point, and then tensioning the anchor chains in such a way that the ship is in the desired place. Additionally, prior to the operation, the anchorage should be planned, taking into account the expected wind speed, anchor drop depth, the wind angle of attack on the hull during positioning and many others, e.g., whether other ships will be moving through the area of operation [92,93]. All this makes positioning on anchors much more difficult than using classic DP, and requires a very experienced crew.
The analysis presented below is based on data obtained from one of the ships that use the positioning system with an anchor set on a daily basis. Table 6 presents the geometrical dimensions of the vessel used in the simulation.
It is quite a small and light ship. Compared to the presented vessel with the classic dynamic positioning system, it is almost 3 times lighter. These types of ships are used to work with divers.
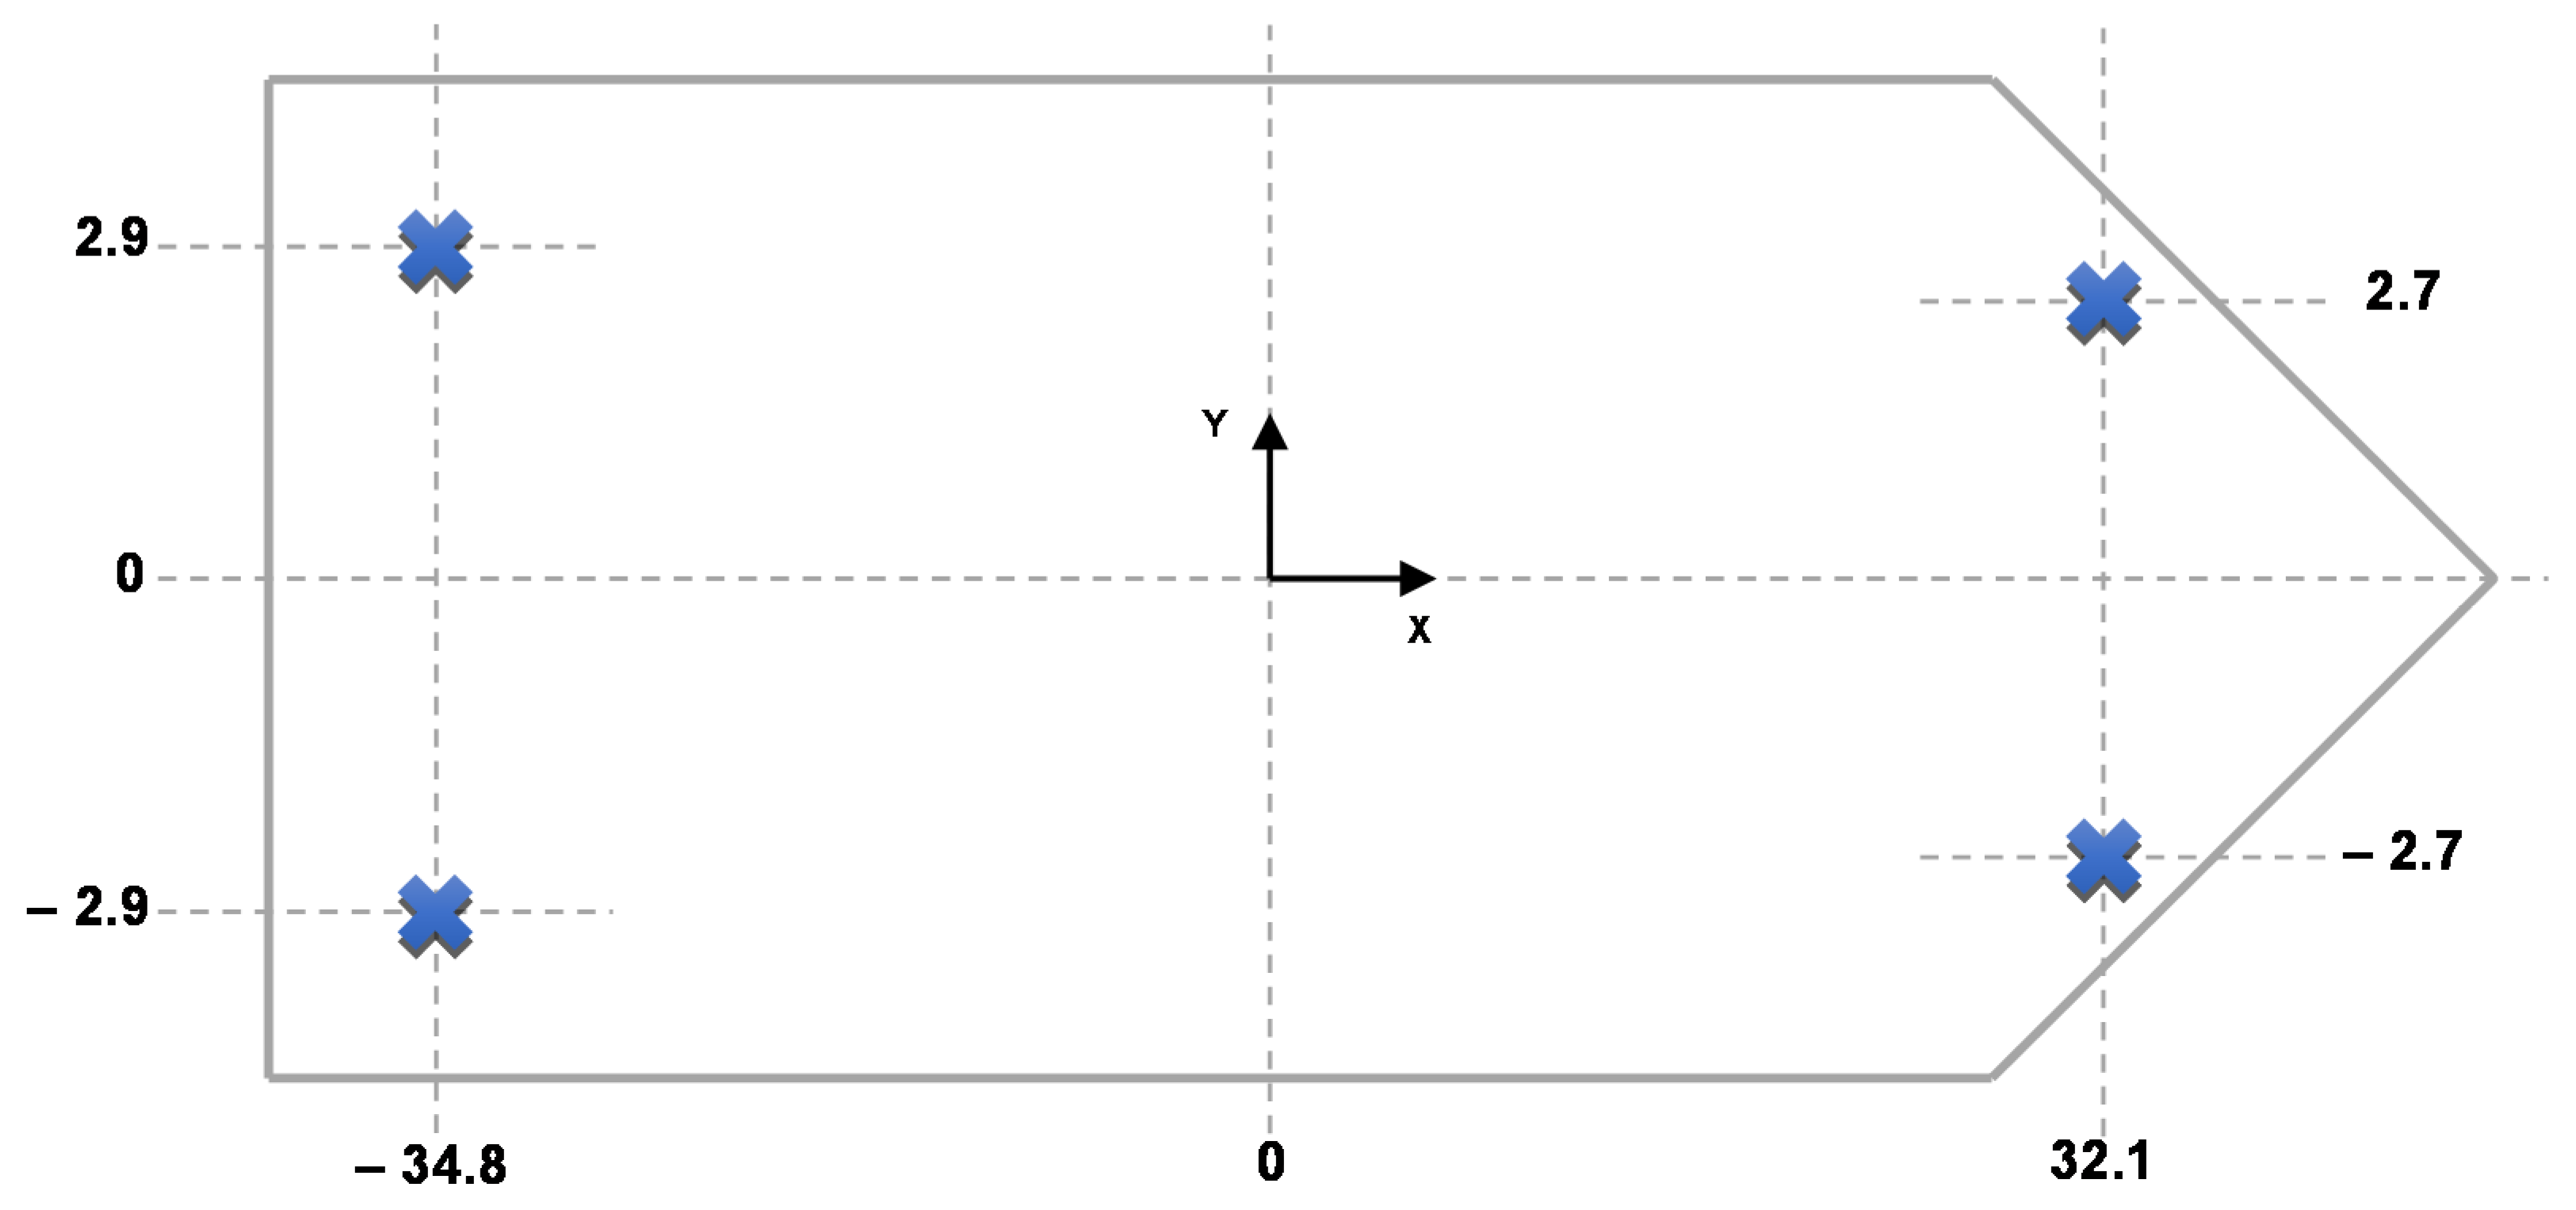
The ship was equipped with two tunnel thrusters and two thrusters. It is a small set of thrusters that is not suitable for classical positioning, but sufficient for propelling the vessel around.
Figure 12 shows the arrangement of individual thrusters on the ship. The origin point for all distances is halfway between the perpendiculars (LPP/2). Positive values for the X axis are towards the bow and negative values towards the stern. For the Y axis, positive values are on the port side and negative values are on the starboard side.
The ship’s energy system consists of the main switchboard and a set of 3 × 400 V generators. The main switchboard is connected to: thrusters, fire pumps and hydraulic pump starters.
After carrying out the capability plot analysis (Figure 13), it can be seen that the ship is able to maintain its position even when the wind speed reaches 50 m/s, but only when it blows from the bow or stern. In other situations, the ship would not be able to meet the DP 2 requirements set out in [22] by the DNV GL.
Apart from the thrusters listed in Table 7, the ship is equipped with a set of four anchors: two in the bow and two in the stern.
Positioning with a set of anchors is not based on thrusters, but on hydraulic windlasses and the chain breaking resistance (Figure 14). Table 8 gives the maximum stresses that can occur depending on the amount of unwound anchor chain from the windlass.
The most common way of positioning such a ship is shown in Figure 15. When placing the anchors in this arrangement, the most common way of positioning is to tighten the anchor chains to the maximum value. This method works well in mild weather conditions. In the event of frequent changes in wind speed, large waves, etc., the anchor chains might break.
When designing a ship, the maximum and minimum distance from the ship to which it is safe to drop the anchor is determined. The performed calculations take into account the parameters of the unwound chain related to the total length of the chain, its mass and the cross-sectional area of the chain’s span, as well as the maximum depth to which the anchor can be dropped.
Due to the energy consumption, positioning with an anchor set is a specific process, because the windlasses are driven by hydraulic systems and not directly by the electric drive supplied from the ship’s switchboards. Due to the slight variation in the tension of the chains between the anchor and the ship’s hull, the energy consumption is negligible compared to the conventional positioning system.
Analyzing the capability plot charts presented in Figure 16, it can be seen that the positioning of the ship using a set of anchors is possible only at low wind speeds (up to a maximum of about 15 m/s). Figure 16 shows the ship’s ability to maintain the assumed position in cases where the occurrence of wind of variable speed, the angle of its impact on the unit and the presence of sea currents with a speed equal to: 0, 0.5 and 1.0 knots. The propulsion system of the ship is able to maintain its position with winds of up to 50 m/s acting on the hull from the bow or stern. In the case of wind blowing perpendicular to the ship’s side (90 or 270 degrees), its speed may not exceed 15 m/s. The following analyzes illustrate the ship’s ability to hold position using 500m (Figure 16a–c), 750 m (Figure 16d–f) and 1000 m (Figure 16g–i) anchor chain lengths. The best positioning results for the vessel, in relation to the above-mentioned sea current speeds, were achieved with the use of an anchor chain with a length of 1000 m. According to Table 8, this length of anchor chain has the highest breaking strength. Likewise, for a 500 m chain, the wind speed at which the ship will maintain its position is the lowest.
First row: 500 m of anchor chain length, for: (a) 0 knot, (b) 0.5 knot, (c) 1 knot magnitude of sea current; Second row: 750 m of anchor chain length, for: (d) 0 knot, (e) 0.5 knot, (f) 1 knot magnitude of sea current; Third row: 1000 m of anchor chain length, for: (g) 0 wick, (h) 0.5 wick, (i) 1 knot magnitude of sea current.
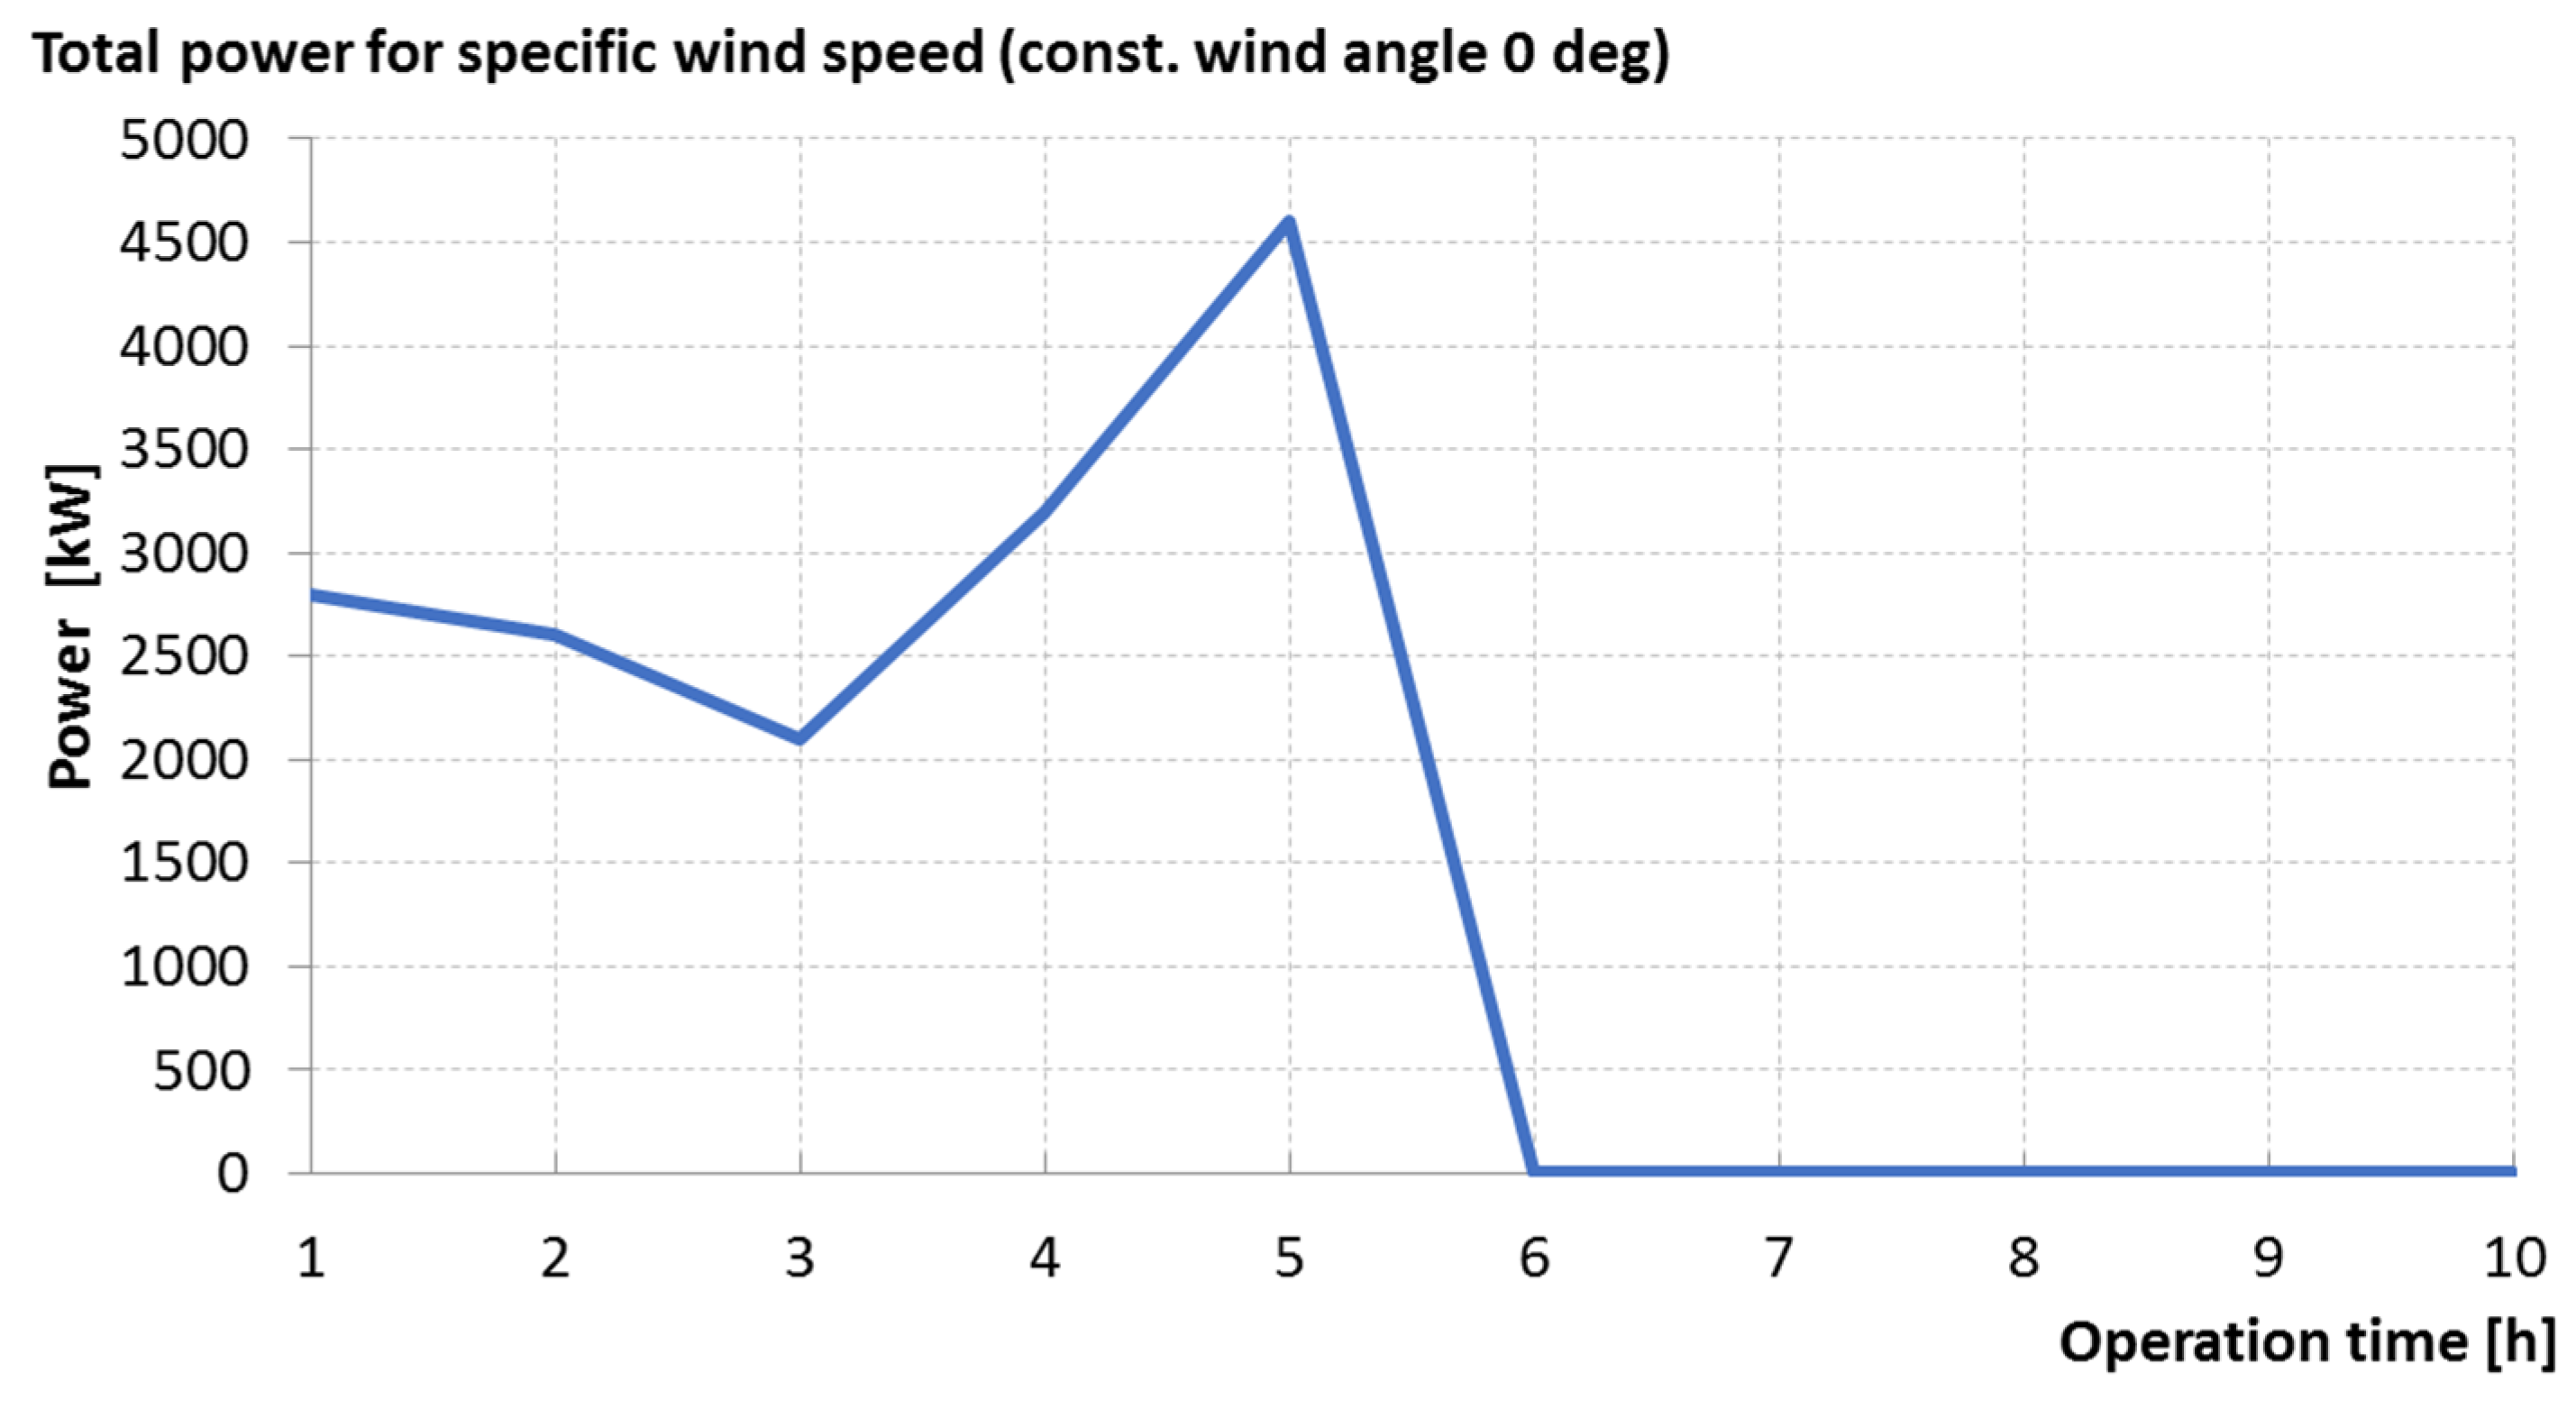
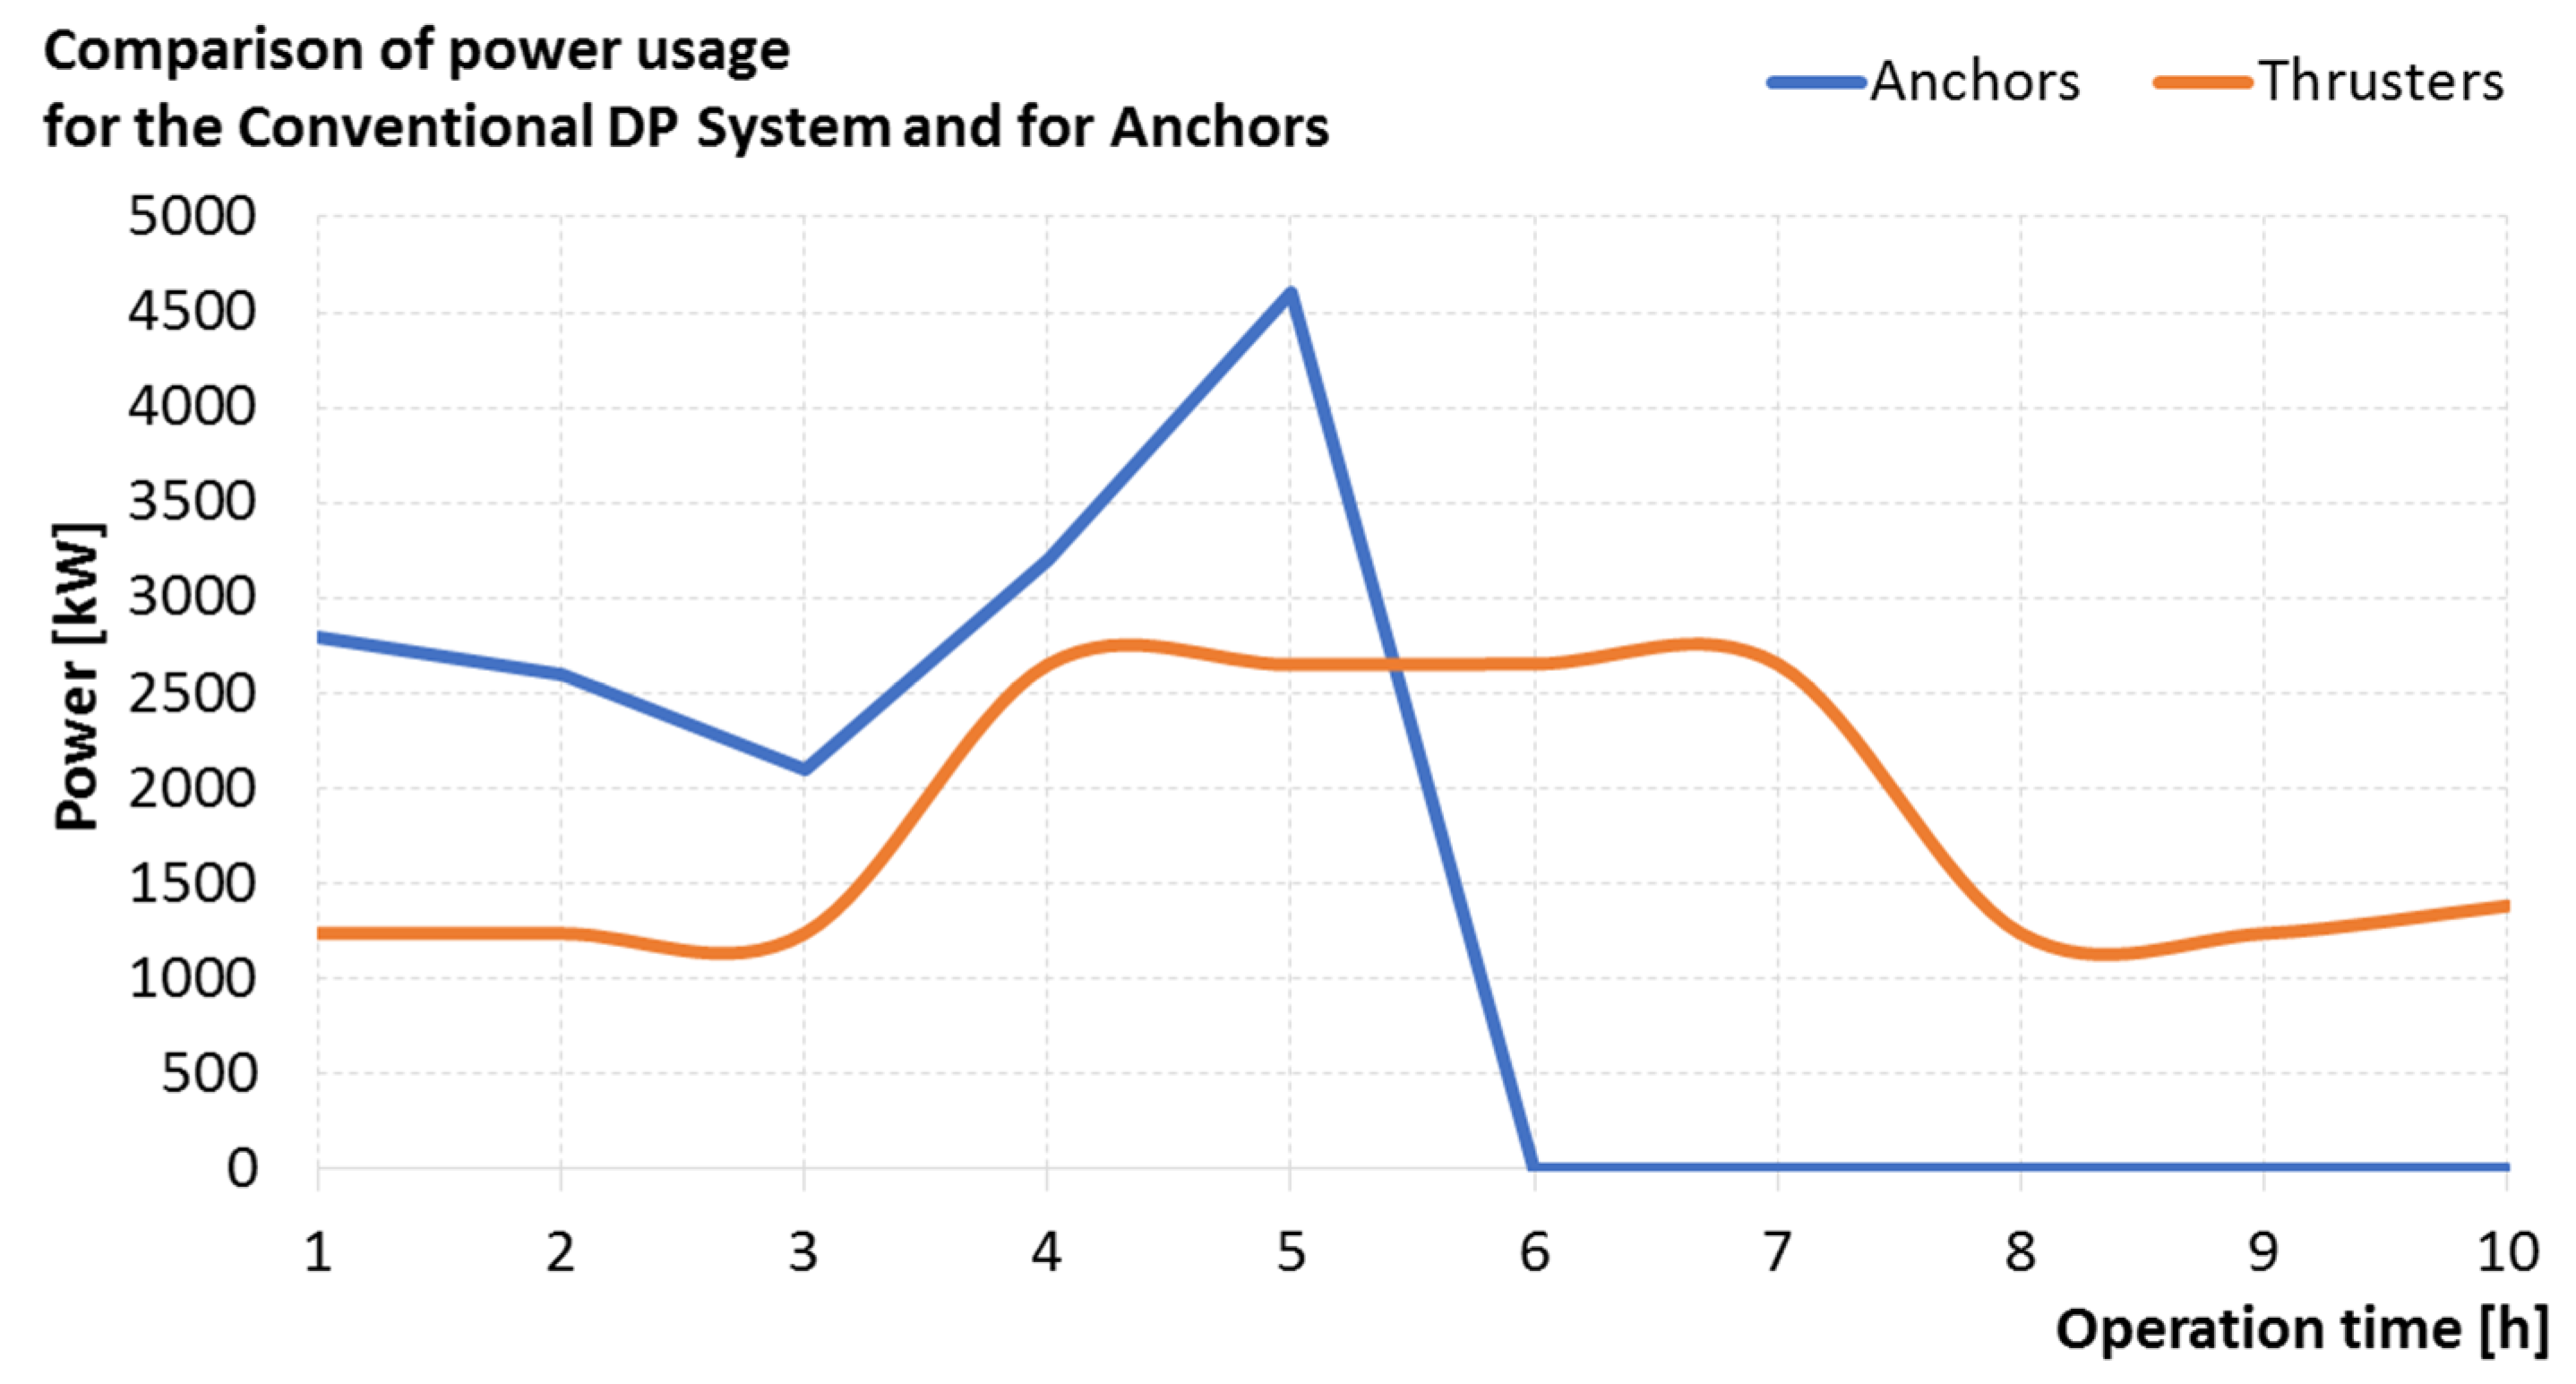
Due to the specific form of positioning, it is difficult to determine using simulation how much energy the ship used from the moment it started dropping anchors until it reached the set point. Therefore, the power consumption was determined on the basis of the real vessel data, which had the power consumption read out every hour. The actual values of power consumption by the vessel are shown in Figure 17.
Depending on the moment of reading the power taken from the ship’s switchboard, the values presented in Figure 17 may refer to the power consumption of the thrusters themselves-when the ship was moving from one anchor discharge point to another anchor discharge point, or power consumption by thrusters and hydraulic pumps working when the anchor is dropped to the bottom.
From Figure 17, one can infer that it took five hours for the ship to drop the anchors and reach the desired position. The maximum total power occurred during the fifth hour, which resulted from the operation of all windlasses responsible for hauling the anchor chains. After the windlass brakes were applied, the hydraulic pumps and thrusters were turned off, therefore the power dropped to zero.
The total energy consumption for the ship’s anchoring can be determined from the measurement of the area under the curve shown in Figure 17:
ET = 13,900 [kWh]
Eavg = 1390 [kWh]
C O 2 e m i s s i o n = 8.56   [ t ]
where: ET—total energy consumption during the deployment of anchors; Eavg—average hourly energy consumption during the deployment of anchors, C O 2 e m i s s i o n —CO2 emissions during the deployment of anchors.
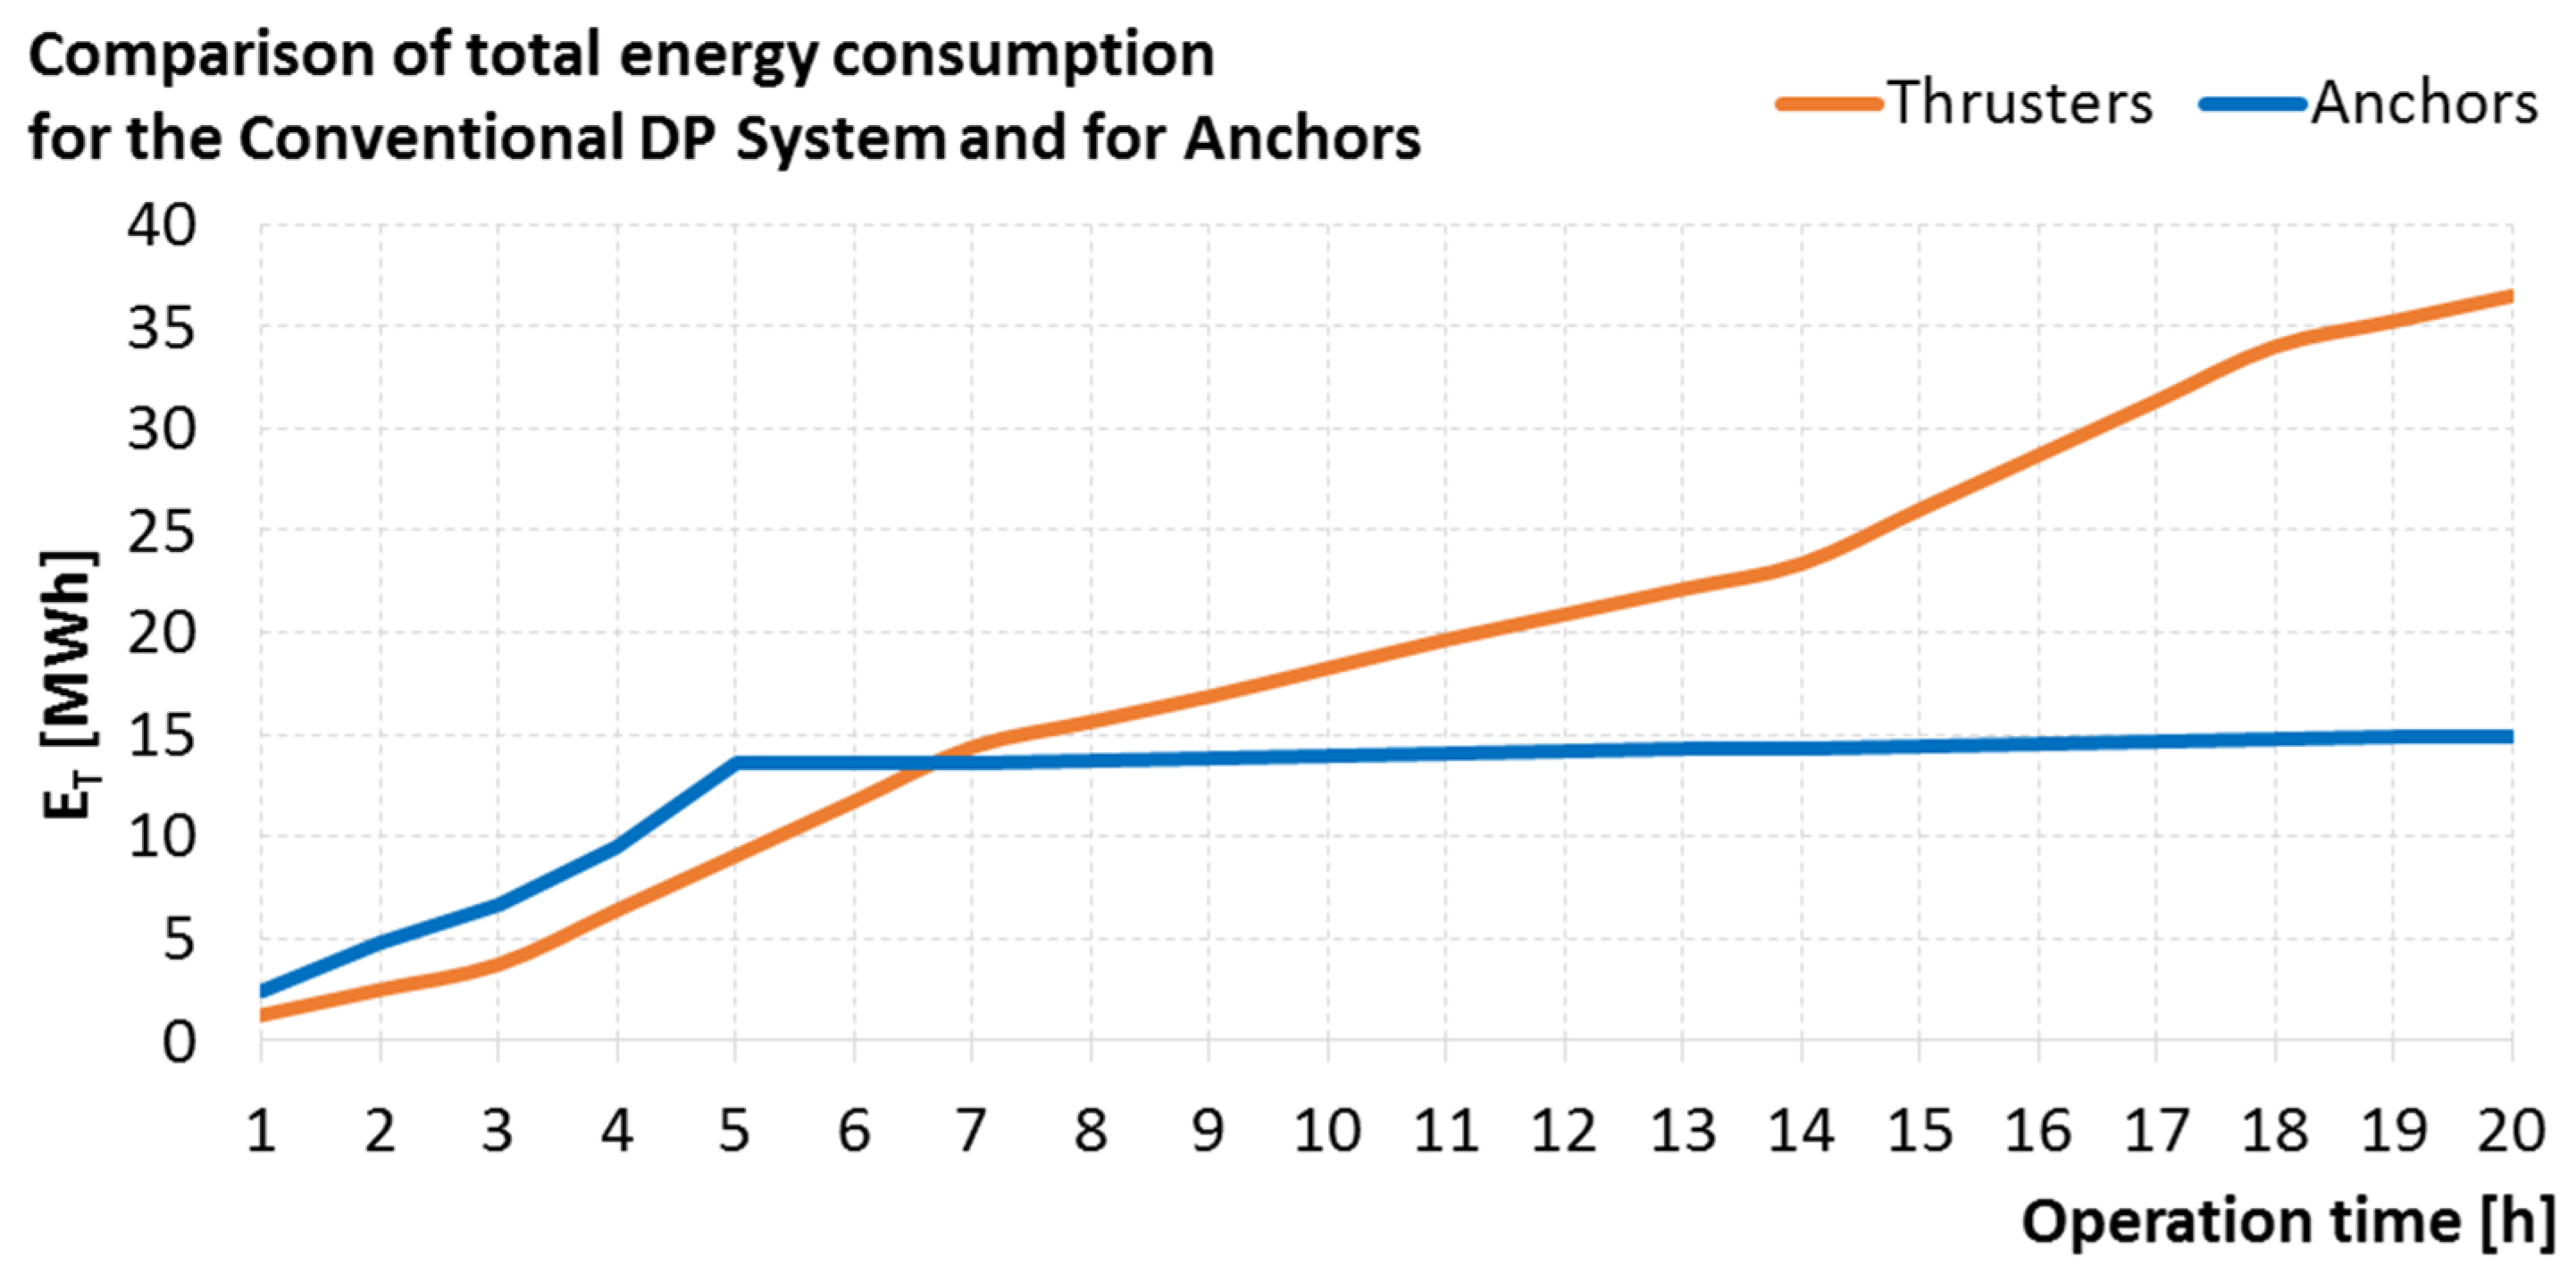
By comparing the average hourly energy consumption of a conventional dynamic positioning system with the anchor set system, it can be seen that the anchor set system has lower energy consumption when the vessel remains in a given position for long periods. At the same time, in the first phase of the anchor system’s operation, related to anchor deployment, the energy consumption of the ship is higher compared to the positioning system based on thrusters. Figure 18 shows a comparison of the energy consumption during positioning by the conventional dynamic positioning system and the one using an anchor set.
For the purposes of calculating CO2 emissions generated during the positioning operation, it was assumed that the amount of CO2 is proportional to the fuel consumption of a given system and amounts to 3.08 kg CO2/1 kg of diesel fuel (2.64 kg CO2/1 L of diesel fuel) [94].

4.3. Comparison of Positioning Systems

In Chapter 4, two different approaches to ship positioning are presented. It presents the practical application of the capability plot graphs to visualize the vessel’s position holding ability. Then, on the basis of the conducted analyzes, the thrusters’ power values were calculated, which made it possible to determine the average energy consumption of a given vessel. Table 9 presents a comparative analysis of the parameters of the dynamic positioning system and the positioning system with a set of anchors.
Figure 19 shows a comparison of energy consumption for both analyzed systems. As shown, the total power consumption of a conventional positioning system increases as the positioning time increases, in contrast to the anchor-set system where the power consumption became virtually constant as the anchor chains were pulled and the vessel reached its desired position. Low energy consumption is associated with keeping the vessel in a fixed position and the operation of the electro-hydraulic chain tensioning system.

5. Conclusions

The analysis of the obtained results clearly indicates that the positioning system based on a set of anchors is much less energy-consuming compared to the conventional dynamic positioning system. At adopted analysis time of 10 h, the difference in energy consumption in favor of the positioning system with the anchor set allowed to achieve fuel consumption savings of 24% compared to the conventional dynamic positioning system. After 20 h of operation of both systems, the difference in energy consumption was already over 59%.
Proportionally to the lower energy consumption, the amount of exhaust gas emitted to the environment is reduced, which is related to the reduction of carbon dioxide emissions. After 10 h of operation, the difference in CO2 emissions was around 24% in favor of the anchor system. Each subsequent hour of positioning increases this value.
Apart from the advantages of lower energy consumption, the positioning system based on an anchor set also has several disadvantages. The main disadvantages are the possibility of breaking the anchor lines when trying to raise the anchor or under too much tension, and the cables becoming entangled if they become too loose during the anchor stage.
The obtained results of the simulations made it possible to carry out a comparative analysis related to energy consumption and the behavior of a given ship with a specific presence of hydrometeorological disturbances in the form of wind or sea currents. On this basis, it was possible to estimate the forces generated by individual thrusters and to conclude that the thruster furthest towards the stern of the ship had the greatest impact on maintaining the position.
Based on the capability plot analysis presented, for example, in Figure 4, Figure 13 and Figure 16, it is possible to estimate a ship’s energy consumption depending on the hydrological conditions. This information can be used by switchgear designers to predict the energy demand or estimate the energy consumption of a ship.

Author Contributions

Conceptualization, J.W. and A.Ł.; computations, J.W. and A.Ł.; methodology, J.W. and A.Ł.; experimental verification, J.W. and A.Ł.; writing text of the article, J.W. and A.Ł.; review and editing, J.W. and A.Ł.; visualization, J.W. and A.Ł.; supervision, J.W. and A.Ł. All authors have read and agreed to the published version of the manuscript.

Funding

The project is financed from the Ministry of Science and Higher Education program named “Regionalna Inicjatywa Doskonałości” in the years 2019–2022, project number 006/RID/2018/19, the sum of financing 11 870 000 PLN.

Institutional Review Board Statement

Not applicable.

Informed Consent Statement

Not applicable.

Data Availability Statement

Not applicable.

Conflicts of Interest

The authors declare no conflict of interest.

References

  1. Dynamic Positioning Committee. Available online: https://Dynamic-positioning.com/timeline/ (accessed on 6 October 2020).
  2. Kongsberg Website. Available online: https://www.kongsberg.com (accessed on 10 October 2020).
  3. Mehrzadi, M.; Terriche, Y.; Su, C.-L.; Othman, M.B.; Vasquez, J.C.; Guerrero, J.M. Review of Dynamic Positioning Control in Maritime Microgrid Systems. Energies 2020, 13, 3188. [Google Scholar] [CrossRef]
  4. Fossen, T.I. Handbook of Marine Craft Hydrodynamics and Motion Control = Vademecum de Navium Motu Contra Aquas et de Motu Gubernando; John Wiley & Sons, Ltd.: Chichester, UK, 2014; ISBN 978-1-1199-9149-6. [Google Scholar]
  5. Kalman filtering for positioning and heading control of ships and offshore rigs. IEEE Control Syst. 2009, 29, 32–46. [CrossRef]
  6. Sørensen, A.J.; Sagatun, S.I.; Fossen, T.I. Design of a Dynamic Positioning system using model-based control. Control Eng. Pract. 1996, 4, 359–368. [Google Scholar] [CrossRef]
  7. Chin, C.S.; Dev, A.K. Modeling and Dynamic Positioning Simulation of OD21 Drill Ship. In Offshore Support Vessels, In Proceedings of the 4th International Conference on Technology and Operation of Offshore Support Vessels, Singapore, 16–17 August 2011; Dev, A.K., Aksu, S., Eds.; Research Publishing Services: Singapore, 2011; pp. 85–96. ISBN 978-981-08-9731-4. [Google Scholar]
  8. LePage, A.; Wide, P. Deep Diving From a Dynamically Positioned Drill Ship. In Proceedings of the Offshore Technology Conference, Houston, TX, USA, 28 April 1973. [Google Scholar] [CrossRef]
  9. Jung, C.-Y.; Yoo, S.-L. Optimal Rescue Ship Locations Using Image Processing and Clustering. Symmetry 2019, 11, 32. [Google Scholar] [CrossRef] [Green Version]
  10. Bruschi, R.; Vitali, L.; Marchionni, L.; Parrella, A.; Mancini, A. Pipe technology and installation equipment for frontier deep water projects. Ocean Eng. 2015, 108, 369–392. [Google Scholar] [CrossRef]
  11. Jensen, G.A.; Fossen, T.I. Mathematical Models for Model-Based Control in Offshore Pipelay Operations. In Volume 3: Pipeline and Riser Technology, In Proceedings of the ASME 2009 28th International Conference on Ocean, Offshore and Arctic Engineering, Honolulu, HI, USA, 1 May–5 June 2009; ASMEDC: Washington, DC, USA, 2019; pp. 269–276. ISBN 978-0-7918-4343-7. [Google Scholar]
  12. Jensen, G.A.; Safstrom, N.; Nguyen, T.D.; Fossen, T.I. Modeling and Control of Offshore Pipelay Operations Based on a Finite Strain Pipe Model. In Proceedings of the 2009 American Control Conference, St. Louis, MO, USA, 10–12 June 2009; IEEE: Piscataway, NJ, USA, 2009; pp. 4717–4722, ISBN 978-1-4244-4523-3. [Google Scholar]
  13. Offshore Support Vessels. Available online: https://www.wartsila.com/encyclopedia/term/offshore-support-vessels-(osvs) (accessed on 25 October 2020).
  14. Erin Gill. Floating Hotels Advance Offshore Construction. Available online: https://www.windpowermonthly.com/article/1189367/floating-hotels-advance-offshore-construction (accessed on 5 November 2020).
  15. Floating Accomodations. Available online: https://floatingaccommodations.com/Our-Services/Offshore (accessed on 5 November 2020).
  16. WARTSILA. AZIPOD. Available online: https://www.wartsila.com/encyclopedia/term/azipod-(azimuthing-podded-drive) (accessed on 15 October 2020).
  17. Verhaar Omega, J.V. Channel Thrusters. Available online: https://verhaar.com/en/channel-thrusters/ (accessed on 15 November 2020).
  18. Wartsila. Exhaust gas Emissions from Ships. Available online: https://www.wartsila.com/encyclopedia/term/exhaust-gas-emissions-from-ships (accessed on 14 October 2020).
  19. DP Fmea/Fmeca Proving Trials. Available online: https://www.dpmarine.org/services/Dynamic-positioning/dp-fmea-fmeca-proving-trials/ (accessed on 15 October 2020).
  20. Herdzik, J. Remarks of the fmea procedures for ships with dynamic positioning systems. Sci. J. Gdyn. Marit. Univ. 2015, 91, 47–53. [Google Scholar]
  21. Dynamic Positioning Failure Mode Effects Analysis Assurance Framework Risk-Based Guidance. Available online: https://www.ocimf.org/media/159746/dp-failure-mode-effects-analysis-assurance-framework-risk-based-guidance.pdf (accessed on 15 October 2020).
  22. DNV GL. Available online: https://www.dnvgl.com/ (accessed on 6 October 2020).
  23. SEnControl. Available online: http://www.sencontrol.com/en/ (accessed on 1 September 2020).
  24. Wartsila.com. Wärtsilä—Enabling Sustainable Societies with Smart Technology. Available online: https://www.wartsila.com/ (accessed on 6 September 2020).
  25. Kongsberg, D.P. Capability Analysis. Available online: http://www.adamsoffshore.com/pdf/aqdpcapplot.pdf (accessed on 10 October 2020).
  26. Assessment of Station Keeping Capability of Dynamic Positioning Vessels. Available online: https://rules.dnvgl.com/docs/pdf/DNVGL/ST/2016-07/DNVGL-ST-0111.pdf (accessed on 8 October 2020).
  27. LocalSolver. Available online: https://www.localsolver.com/ (accessed on 10 January 2020).
  28. RIGZONE. How Does a Drillship Work? Available online: https://www.rigzone.com/training/insight.asp?insight_id=306&c_id= (accessed on 18 October 2020).
  29. Jurdzinski, M. Planning the energy efficiency on board the ships. Pr. Wydz. Nawig. 2013, 28, 5–10. [Google Scholar] [CrossRef] [Green Version]
  30. International Maritime Organization. International Convention for the Prevention of Pollution from Ships (MARPOL). Available online: https://www.imo.org/en/About/Conventions/Pages/International-Convention-for-the-Prevention-of-Pollution-from-Ships-(MARPOL).aspx (accessed on 20 October 2020).
  31. Wang, Q.; Wei, H.-H.; Xu, Q. A Solid Oxide Fuel Cell (SOFC)-Based Biogas-from-Waste Generation System for Residential Buildings in China: A Feasibility Study. Sustainability 2018, 10, 2395. [Google Scholar] [CrossRef] [Green Version]
  32. Chang, S.; Wang, Q.; Hu, H.; Ding, Z.; Guo, H. An NNwC MPPT-Based Energy Supply Solution for Sensor Nodes in Buildings and Its Feasibility Study. Energies 2019, 12, 101. [Google Scholar] [CrossRef] [Green Version]
  33. Tannuri, E.A.; Agostinho, A.C.; Morishita, H.M.; Moratelli, L. Dynamic Positioning systems: An experimental analysis of sliding mode control. Control Eng. Pract. 2010, 18, 1121–1132. [Google Scholar] [CrossRef]
  34. Chang, W. Fuzzy Control of Dynamic Positioning Systems for Ships. J. Mar. Sci. Technol. 2002, 47–53. [Google Scholar]
  35. Zhang, Z.; Wu, D. Operator Panel Design for Dynamic Positioning Simulator. In Proceedings of the 2018 Chinese Automation Congress (CAC), Xi’an, China, 30 November–2 December 2018; IEEE: Piscataway, NJ, USA, 2018; pp. 1020–1023, ISBN 978-1-7281-1312-8. [Google Scholar]
  36. Xu, L.; Liu, Z.-Q. Design of fuzzy PID controller for ship Dynamic Positioning. In Proceedings of the 2016 Chinese Control and Decision Conference (CCDC), Yinchuan, China, 28–30 May 2016; IEEE: Piscataway, NJ, USA, 2016; pp. 3130–3135, ISBN 978-1-4673-9714-8. [Google Scholar]
  37. Xie, D.; Han, X.; Jia, B.; Liu, Y.; Zheng, S. Research on improved PID Dynamic Positioning System Based on Nonlinear Observer. In Proceedings of the 2018 Chinese Automation Congress (CAC), Xi’an, China, 30 November–2 December 2018; IEEE: Piscataway, NJ, USA, 2018; pp. 698–702, ISBN 978-1-7281-1312-8. [Google Scholar]
  38. Wu, G.; Atilla, I.; Tahsin, T.; Terziev, M.; Wang, L. Long-voyage route planning method based on multi-scale visibility graph for autonomous ships. Ocean Eng. 2020, 108242. [Google Scholar] [CrossRef]
  39. Wang, L.; Zhang, Z.; Zhu, Q.; Ma, S. Ship Route Planning Based on Double-Cycling Genetic Algorithm Considering Ship Maneuverability Constraint. IEEE Access 2020, 8, 190746–190759. [Google Scholar] [CrossRef]
  40. Kula, K.; Tomera, M. Control System of Training Ship Keeping the Desired Path Consisting of Straight-lines and Circular Arcs. TransNav 2017, 11, 711–719. [Google Scholar] [CrossRef] [Green Version]
  41. Tomera, M.; Alfuth, L. Waypoint Path Controller for Ships. TransNav 2020, 14, 375–383. [Google Scholar] [CrossRef]
  42. Rybczak, M.; Rak, A. Prototyping and Simulation Environment of Ship Motion Control System. TransNav 2020, 14, 367–374. [Google Scholar] [CrossRef]
  43. Lisowski, J.; Mohamed-Seghir, M. Comparison of Computational Intelligence Methods Based on Fuzzy Sets and Game Theory in the Synthesis of Safe Ship Control Based on Information from a Radar ARPA System. Remote Sens. 2019, 11, 82. [Google Scholar] [CrossRef] [Green Version]
  44. Lisowski, J. Multistage Dynamic Optimization with Different Forms of Neural-State Constraints to Avoid Many Object Collisions Based on Radar Remote Sensing. Remote Sens. 2020, 12, 1020. [Google Scholar] [CrossRef] [Green Version]
  45. Lisowski, J. Sensitivity of Safe Trajectory in a Game Environment to Determine Inaccuracy of Radar Data in Autonomous Navigation. Sensors 2019, 19, 1816. [Google Scholar] [CrossRef] [Green Version]
  46. Mohamed-Seghir, M. Methods based on fuzzy sets to solve problems of Safe Ship control. In Novel Algorithms and Techniques in Telecommunications and Networking; Springer: Dordrecht, The Netherlands, 2010; pp. 373–377. [Google Scholar]
  47. Chen, C.; Delefortrie, G.; Lataire, E. Experimental investigation of practical autopilots for maritime autonomous surface ships in shallow water. Ocean Eng. 2020, 218, 108246. [Google Scholar] [CrossRef]
  48. Jha, A.; Subedi, D.; Lovsland, P.-O.; Tyapin, I.; Reddy Cenkeramaddi, L.; Lozano, B.; Hovland, G. Autonomous Mooring towards Autonomous Maritime Navigation and Offshore Operations. In Proceedings of the 2020 15th IEEE Conference on Industrial Electronics and Applications (ICIEA), Kristiansand, Norway, 9–13 November 2020; IEEE: Piscataway, NJ, USA, 2020; pp. 1171–1175, ISBN 978-1-7281-5169-4. [Google Scholar]
  49. Peng, Z.; Wang, J.; Wang, D.; Han, Q.-L. An Overview of Recent Advances in Coordinated Control of Multiple Autonomous Surface Vehicles. IEEE Trans. Ind. Inf. 2021, 17, 732–745. [Google Scholar] [CrossRef]
  50. Lee, K.-J.; Shin, D.; Yoo, D.-W.; Choi, H.-K.; Kim, H.-J. Hybrid photovoltaic/diesel green ship operating in standalone and grid-connected mode—Experimental investigation. Energy 2013, 49, 475–483. [Google Scholar] [CrossRef]
  51. Tang, R. Large-scale photovoltaic system on green ship and its MPPT controlling. Sol. Energy 2017, 157, 614–628. [Google Scholar] [CrossRef]
  52. Fritz, F. Application of an Automated Kite System for Ship Propulsion and Power Generation. In Airborne Wind Energy; Ahrens, U., Diehl, M., Schmehl, R., Eds.; Springer: Berlin/Heidelberg, Germany, 2013; pp. 359–372. ISBN 978-3-642-39964-0. [Google Scholar]
  53. Kim, J.; Park, C. Wind power generation with a parawing on ships, a proposal. Energy 2010, 35, 1425–1432. [Google Scholar] [CrossRef]
  54. Hein, K.; Xu, Y. Coordinated Optimal Voyage Planning and Energy Management of All-electric Ship with Hybrid Energy Storage System. IEEE Trans. Power Syst. 2020, 1. [Google Scholar] [CrossRef]
  55. Chen, W.; Tai, K.; Lau, M.; Abdelhakim, A.; Chan, R.R.; Kare Adnanes, A.; Tjahjowidodo, T. On the Modelling of Fuel Cell-Fed Power System in Electrified Vessels. In Proceedings of the 2020 IEEE 21st Workshop on Control and Modeling for Power Electronics (COMPEL), Aalborg, Denmark, 9–12 November 2020; IEEE: Piscataway, NJ, USA, 2020; pp. 1–8, ISBN 978-1-7281-7160-9. [Google Scholar]
  56. Sun, Y.; Xu, Q.; Yuan, Y.; Yang, B. Optimal Energy Management of Fuel Cell Hybrid Electric Ships Considering Fuel Cell Aging Cost. In Proceedings of the 2020 IEEE/IAS Industrial and Commercial Power System Asia (I&CPS Asia), Weihai, China, 13–15 July 2020; IEEE: Piscataway, NJ, USA, 2020; pp. 240–245, ISBN 978-1-7281-4303-3. [Google Scholar]
  57. Lele, A.; Rao, K.V.S. Net power generated by flettner rotor for different values of wind speed and ship speed. In Proceedings of the 2017 International Conference on Circuit, Power and Computing Technologies (ICCPCT), Kollam, India, 20–21 April 2017; Staff, I., Ed.; IEEE: Piscataway, NJ, USA, 2017; pp. 1–6, ISBN 978-1-5090-4967-7. [Google Scholar]
  58. Abramowicz-Gerigk, T.; Burciu, Z. Design and Operational Innovations in Adapting the Existing Merchant River Fleet to Cost-Effective Shipping. Pol. Marit. Res. 2019, 26, 157–164. [Google Scholar] [CrossRef] [Green Version]
  59. Abramowicz-Gerigk, T.; Burciu, Z.; Jachowski, J. An Innovative Steering System for a River Push Barge Operated in Environmentally Sensitive Areas. Pol. Marit. Res. 2017, 24, 27–34. [Google Scholar] [CrossRef] [Green Version]
  60. Abramowicz-Gerigk, T.; Burciu, Z. Application of Ship Motion Simulation in Reliability Assessment of Ship Entrance into the Port. TransNav 2016, 10, 613–617. [Google Scholar] [CrossRef]
  61. Li, Z.; Xu, Y.; Wu, L.; Zheng, X. Adaptive Risk-Averse Chance-Constrained Stochastic Coordination of Hybrid AC/DC Multi-Energy Ships Considering Renewable Energy and Ship Swinging. IEEE Trans. Power Syst. 2020, 1. [Google Scholar] [CrossRef]
  62. Nam, S.; Park, D.; Zadeh, M.K. Energy Storage System as Auxiliaries of Internal Combustion Engines in Hybrid Electric Ships. In Proceedings of the 2020 15th IEEE Conference on Industrial Electronics and Applications (ICIEA), Kristiansand, Norway, 9–13 November 2020; IEEE: Piscataway, NJ, USA, 2020; pp. 431–436, ISBN 978-1-7281-5169-4. [Google Scholar]
  63. Belal, H.B.; Uddin, M.; Karim, T.; Nath, S. Design and Implementation of an Eco-Friendly Water Vehicle. In Proceedings of the 2019 International Conference on Robotics, Electrical and Signal Processing Techniques (ICREST), Dhaka, Bangladesh, 10–12 January 2019; IEEE: Piscataway, NJ, USA, 2019; pp. 233–236, ISBN 978-1-5386-8012-4. [Google Scholar]
  64. Weintrit, A.; Neumann, T. Safety of Marine Transport Introduction; CRC Press-Taylor & Francis Group: Abingdon, UK; Gdynia Maritime University: Gdynia, Poland, 2015. [Google Scholar]
  65. Rindaroey, M.; Johansen, T.A. Fuel Optimal Thrust Allocation in Dynamic Positioning. Ifac Proc. Vol. 2013, 46, 43–48. [Google Scholar] [CrossRef] [Green Version]
  66. Xu, S.; Wang, L.; Wang, X. Local optimization of thruster configuration based on a synthesized positioning capability criterion. Int. J. Nav. Archit. Ocean Eng. 2015, 7, 1044–1055. [Google Scholar] [CrossRef] [Green Version]
  67. Fossen, T.I. Handbook of Marine Craft HydroDynamics and Motion Control. IEEE Control Syst. 2016, 36, 78–79. [Google Scholar] [CrossRef]
  68. Johansen, T.A.; Fossen, T.I.; Berge, S.P. Constrained Nonlinear Control Allocation With Singularity Avoidance Using Sequential Quadratic Programming. IEEE Trans. Contr. Syst. Technol. 2004, 12, 211–216. [Google Scholar] [CrossRef] [Green Version]
  69. Xu, S.; Wang, X.; Wang, L.; Meng, S. Applying the Bisection Search Method to Search the Maximum Environmental Conditions in DPCap Analysis for Marine Vessels. IJOPE 2015, 25, 104–111. [Google Scholar] [CrossRef]
  70. Xu, S.; Wang, X.; Wang, L.; Meng, S.; Li, B. A thrust sensitivity analysis based on a synthesized positioning capability criterion in DPCap/DynCap analysis for marine vessels. Ocean Eng. 2015, 108, 164–172. [Google Scholar] [CrossRef]
  71. Webster, W.C.; Sousa, J. Optimum Allocation for Multiple Thrusters. In Proceedings of the Ninth International Offshore and Polar Engineering Conference, Brest, France, 30 May 1999. [Google Scholar]
  72. DNV GL, Rules for Classification of Ships. Available online: https://rules.dnvgl.com/docs/pdf/DNV/rulesship/2012-01/ts607.pdf (accessed on 10 October 2020).
  73. Fay, H. Dynamic Positioning Systems. Principles, Design and Applications; Éditions Technip: Paris, France, 1990; ISBN 2710805804. [Google Scholar]
  74. You, Y.; Kim, S.; Kim, W. Development of a safe operation capability chart as the design basis of a rudder area. Int. J. Nav. Archit. Ocean Eng. 2018, 10, 529–544. [Google Scholar] [CrossRef]
  75. Wang, L.; Yang, J.-M.; Xu, S.-W. Dynamic Positioning Capability Analysis for Marine Vessels Based on a DPCap Polar Plot Program. China Ocean Eng. 2018, 32, 90–98. [Google Scholar] [CrossRef]
  76. Masnicki, R.; Mindykowski, J. Coordination of operations in registration channel of data from electrical power system. Measurement 2017, 99, 68–77. [Google Scholar] [CrossRef]
  77. Pilat, A.; Tarasiuk, T.; Jankowski, P. PSCAD Model of the Marine Sub-system with Nonlinear Load for Power Quality Assesment. In Proceedings of the 2018 20th European Conference on Power Electronics and Applications (EPE’18 ECCE Europe), Riga, Latvia, 17–21 September 2018. [Google Scholar]
  78. Jankowski, P.; Pilat, A.; Tarasiuk, T. The study of chaotic behaviour in the marine power system containing nonlinear varying load. In Proceedings of the 2018 International Conference and Exposition on Electrical and Power Engineering (EPE), Iasi, Romania, 18–19 October 2018; pp. 113–118. [Google Scholar]
  79. Gorniak, M.; Tarasiuk, T. Voltage spectrum in shipboard microgrid with the varying nonlinear load. In Proceedings of the 2018 20th European Conference on Power Electronics and Applications (EPE’18 ECCE Europe), Riga, Latvia, 17–21 September 2018. [Google Scholar]
  80. Tarasiuk, T.; Gorniak, M. Load Sharing in Ship Microgrids Under Nonsinusoidal Conditions—Case Study. IEEE Trans. Energy Convers. 2017, 32, 810–819. [Google Scholar] [CrossRef]
  81. Kasprowicz, A. Induction Generator with Three-Level Inverters and LCL Filter Connected to the Power Grid; Bulletin of the Polish Academy of Sciences. Tech. Sci. 2019, 67. [Google Scholar] [CrossRef]
  82. Masnicki, R. The Fluency of Data Flow in the Instrument for Measurement and Registration of Parameters of the Electrical Power Network. In Proceedings of the 2015 IEEE 15th International Conference on Environment and Electrical Engineering (EEEIC), Rome, Italy, 10–13 June 2015; pp. 2040–2044. [Google Scholar]
  83. Iwaszkiewicz, J.; Mysiak, P. Supply System for Three-Level Inverters Using Multi-Pulse Rectifiers with Coupled Reactors. Energies 2019, 12, 3385. [Google Scholar] [CrossRef] [Green Version]
  84. Iwaszkiewicz, J.; Muc, A. Trójfazowy trójpoziomowy falownik z obniżoną zawartością harmonicznych. Electrotech. Rev. 2019, 1, 128–133. [Google Scholar] [CrossRef] [Green Version]
  85. Hashad, M.; Iwaszkiewicz, J. A novel orthogonal-vectors-based topology of multilevel inverters. IEEE Trans. Ind. Electron. 2002, 49, 868–874. [Google Scholar] [CrossRef]
  86. Mysiak, P. Multipulse diode converters—Frequency domain analysis of operation of the applied coupled three-phase reactor. In Proceedings of the 6th International Conference-Workshop, 2009 Compatability and Power Electronics (CPE), Badajoz, Spain, 20–22 May 2009; IEEE: Piscataway, NJ, USA, 2009; pp. 53–60, ISBN 978-1-4244-2855-7. [Google Scholar]
  87. Gnaciński, P.; Hallmann, D.; Pepliński, M.; Jankowski, P. The effects of voltage subharmonics on cage induction machine. Int. J. Electr. Power Energy Syst. 2019, 111, 125–131. [Google Scholar] [CrossRef]
  88. Gnaciński, P.; Pepliński, M.; Hallmann, D.; Jankowski, P. Induction cage machine thermal transients under lowered voltage quality. IET Electr. Power Appl. 2019, 13, 479–486. [Google Scholar] [CrossRef]
  89. Pettinger, T. Top CO2 Polluters and Highest per Capita—Economics Help. Available online: https://www.economicshelp.org/blog/10296/economics/top-co2-polluters-highest-per-capita/ (accessed on 6 October 2020).
  90. What are Nonrenewable Resources and How Do We Protect Them? Available online: https://www.rubicon.com/blog/nonrenewable-resources/ (accessed on 13 October 2020).
  91. Seckin Salvarli, M.; Salvarli, H. For Sustainable Development: Future Trends in Renewable Energy and Enabling Technologies. In Renewable Energy—Resources, Challenges and Applications; Al Qubeissi, M., El-kharouf, A., Serhad Soyhan, H., Eds.; IntechOpen: London, UK, 2020; ISBN 978-1-78984-283-8. [Google Scholar]
  92. Kula, K.S. An Overview of Roll Stabilizers and Systems for Their Control. TransNav 2015, 9, 405–414. [Google Scholar] [CrossRef] [Green Version]
  93. Kula, K.S. Heading Control System with limited Turning Radius based on IMC Structure. In Proceedings of the 21st International Conference Methods Models Automation Robotics (MMAR), Międzyzdroje, Poland, 29 August–1 September 2016; pp. 134–139. [Google Scholar] [CrossRef]
  94. Gupta, H.N. Fundamentals of Internal Combustion Engines, 2nd ed.; PHI Learning Private Limited: Delhi, India, 2014; ISBN 978-81-203-4680-2. [Google Scholar]
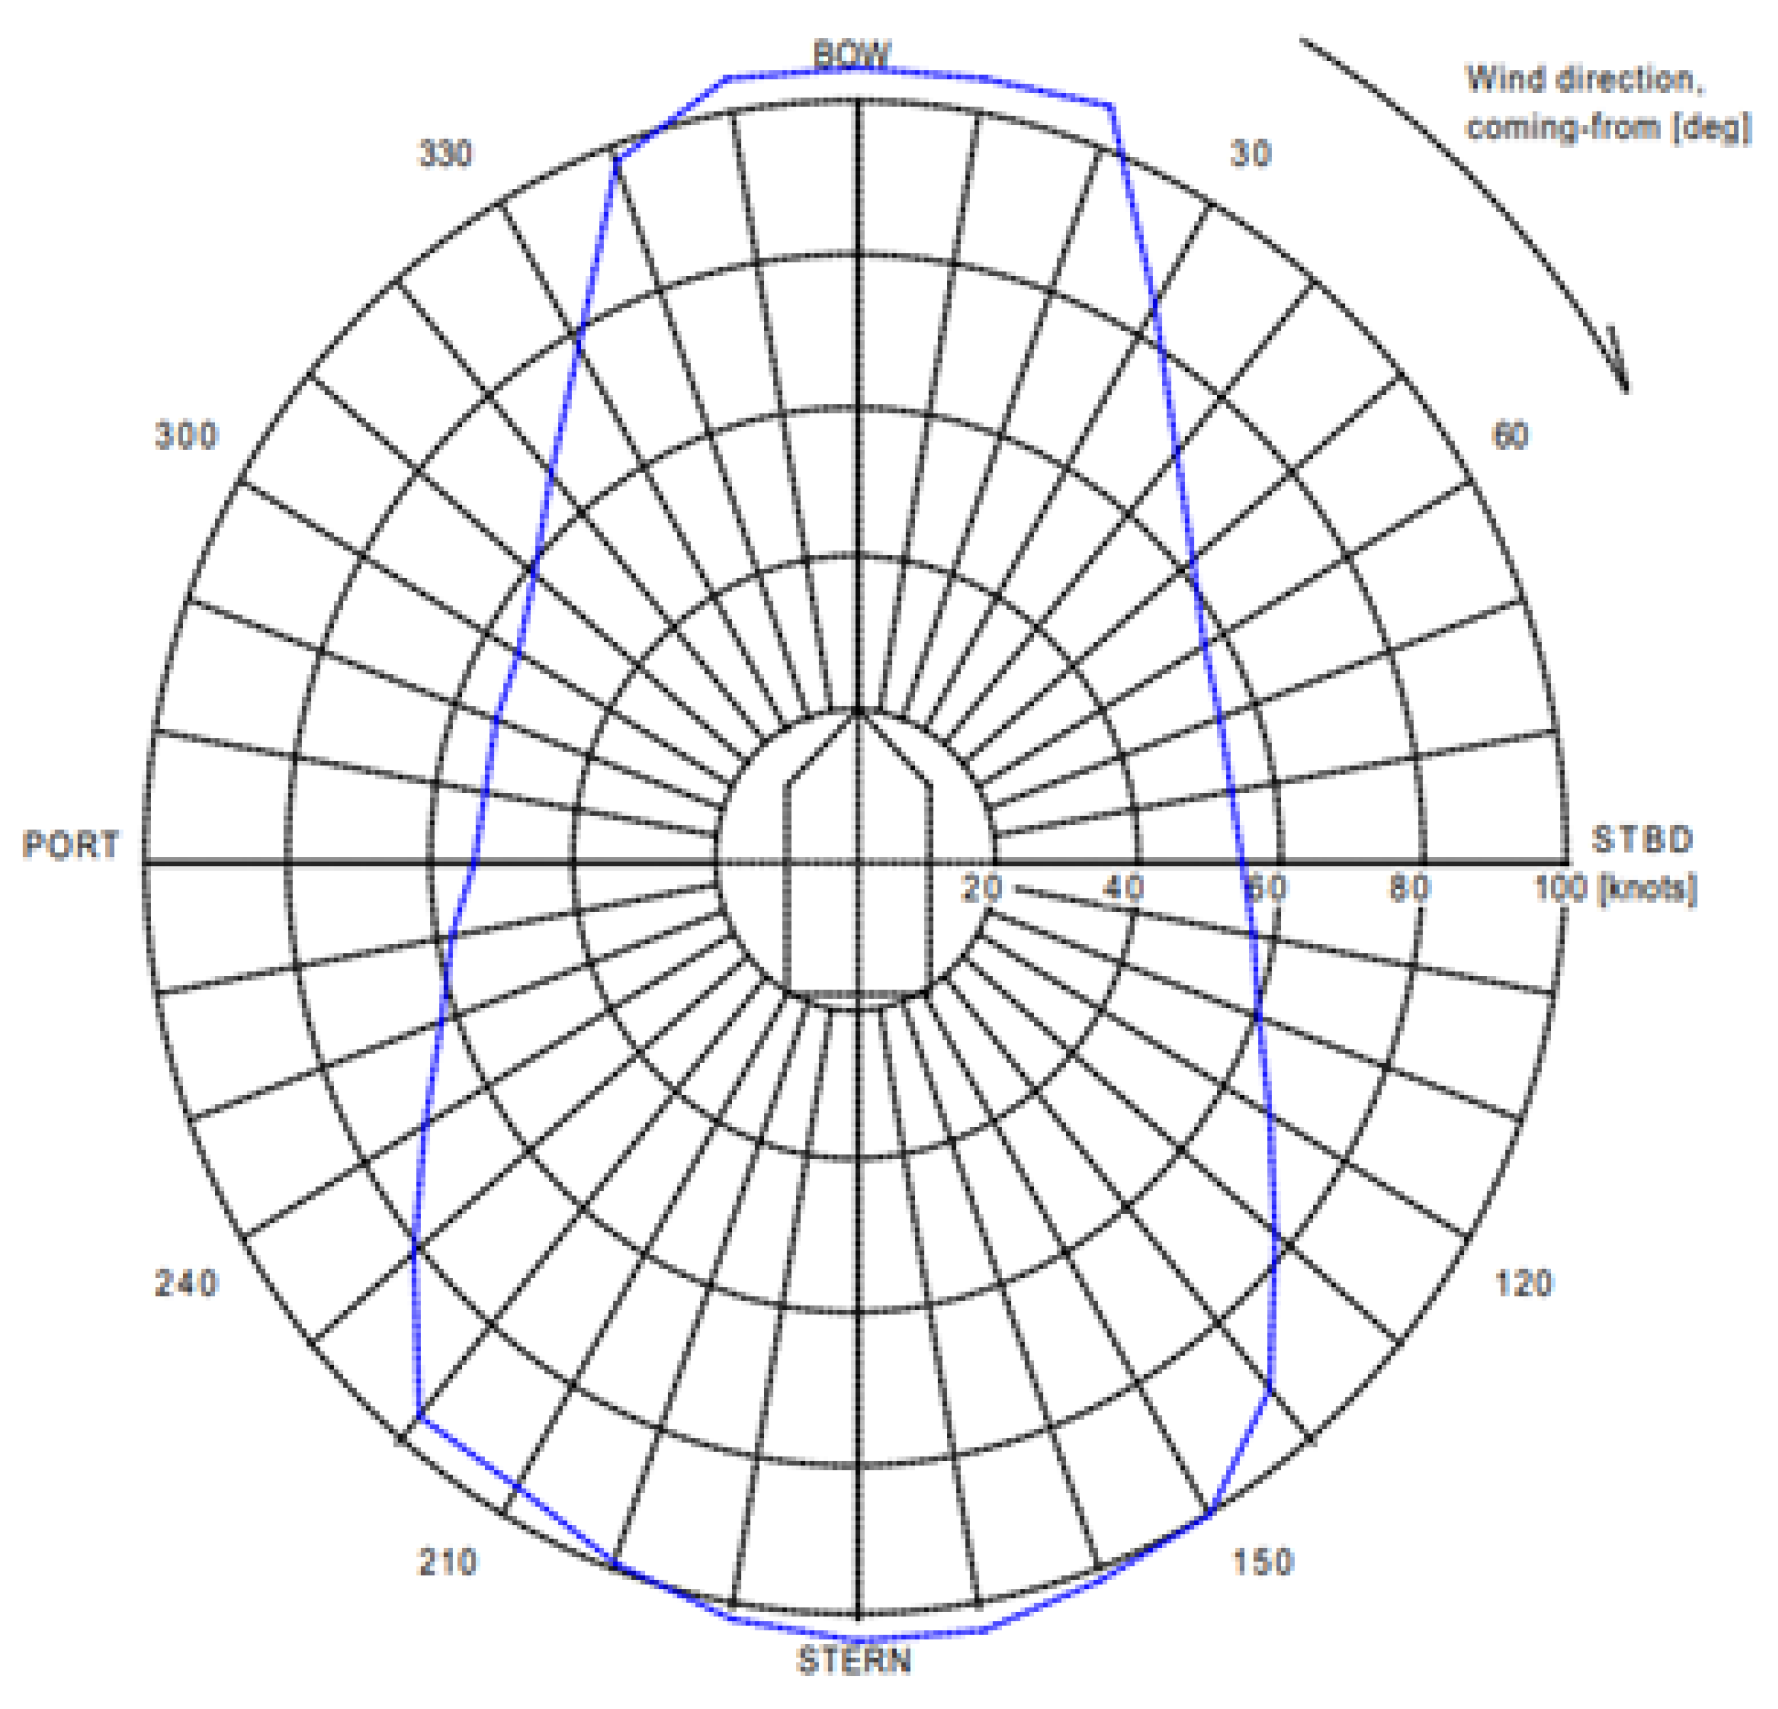
Figure 1. Sample chart with the capability plot (CP) analysis.
Energies 14 00524 g001
Figure 2. Algorithm for plotting the ability to hold a position.
Energies 14 00524 g002
Figure 3. Distribution of thrusters on the ship.
Energies 14 00524 g003
Figure 4. The result of the capability plot analysis for a conventional positioning system.
Energies 14 00524 g004
Figure 5. The power of individual thrusters depending on the angle of attack of environmental forces.
Energies 14 00524 g005
Figure 6. The sum of the powers of individual thrusters depending on the angle of attack of environmental forces.
Energies 14 00524 g006
Figure 7. The power of individual thrusters depending on the wind speed (0 deg. angle).
Energies 14 00524 g007
Figure 8. The power of individual thrusters depending on the wind speed (90 and 270 deg.).
Energies 14 00524 g008
Figure 9. The power of individual thrusters depending on the wind speed (180 deg. angle).
Energies 14 00524 g009
Figure 10. Wind speed changes during 10-h positioning.
Energies 14 00524 g010
Figure 11. Power consumption by thrusters during positioning.
Energies 14 00524 g011
Figure 12. Distribution of thrusters on the ship.
Energies 14 00524 g012
Figure 13. The result of the capability plot analysis.
Energies 14 00524 g013
Figure 14. Layout of the windlasses on the ship.
Energies 14 00524 g014
Figure 15. The most popular method of anchoring.
Energies 14 00524 g015
Figure 16. Capability plots for anchor-based positioning.
Energies 14 00524 g016
Figure 17. Power consumption during the positioning operation.
Energies 14 00524 g017
Figure 18. Comparison of the power of both systems.
Energies 14 00524 g018
Figure 19. Comparison of energy consumption for both systems.
Energies 14 00524 g019
Table 1. Sample fragment of FMEA tests concerning UPS power failure [23].
C1—230V UPS Distribution Board Instrument Room
Source: Main—230V UPS 1
Backup—230V MSB Bus A (Automatic Changeover)
Ref.DescriptionNotificationPrimary EffectEffect on DP
C1 1–14No DP related consumersLoss of power supplyNot DP RelatedNo effect on position keeping capability.
C1 14AC/DC ConverterLoss of power supplyNot DP RelatedNo effect on position keeping capability.
C1 15IAS ServersLoss of backup power to IAS servers, one on bridge and one in ECRServers remain operational on power from UPS No. 2 and 3No effect on position keeping capability.
C1 16–17No DP related consumersLoss of power supplyNot DP RelatedNo effect on position keeping capability.
C1 18Independent Joystick systemLoss of power supplyLoss of independent joystick systemNo effect on position keeping capability. Loss of backup system.
C1 19Loss of supply or Short CircuitAll of AboveAll of AboveAll of Above,
Where: UPS—Uninterruptible Power Supply; DP—Dynamic Positioning; AC/DC—Alternating Current/Direct Current; IAS—Integrated Automation Systems; ECR—Engine Control Room.
Table 2. Data for ship with conventional positioning system.
ParameterValue
Length overall (LOA) [m]:90
Length between perpendiculars (LPP) [m]:70
Breadth [m]:22
Draught [m]:5
Displacement [T]:6400
Distance between foremost and aft most point of the hull below the surface at design draft even keel [m]:82.8
Water plane area [m2]:1390
Projected longitudinal area above water [m2]:900
Surge position of geometric center of the projected longitudinal area above water with respect to LPP/2 [m]:12.5
Projected longitudinal area below water [m2]:420
Surge position of geometric center of the projected longitudinal area below water with respect to LPP/2 [m]:5.5
Surge position of water line center with respect to LPP/2 [m]:−0.35
Projected transverse area above water [m2]:430
Projected transverse area below water [m2]:140
Table 3. Generators powering the ship with conventional positioning system.
GeneratorPower [kW]Connected to Switchboard
Generator 115001
Generator 215002
Generator 320001
Generator 420002
Table 4. Thruster data for conventional positioning system.
ThrusterThrust Max [kN]Thrust Min [kN]Power [kW]X [m]Y [m]
T1118−11858833.40
T2118−11858829.80
AT190−9058826.60
A1400−2462000−38.85
A2400−2462000−38.8−5
Table 5. Power consumption of individual thrusters.
ThrusterSwitchboard 1Switchboard 2
T1100%0%
T20%100%
AT150%50%
A10%100%
A2100%0%
Table 6. Ship hull data for anchor positioning system.
ParameterValue
Length overall (LOA) [m]:72.7
Length between perpendiculars (LPP) [m]:64
Breadth [m]:11.6
Draught [m]:3.4
Displacement [T]:1886
Distance between foremost and aft most point of the hull below the surface at design draft even keel [m]:67.1
Water plane area [m2]:639
Projected longitudinal area above water [m2]:437
Surge position of geometric center of the projected longitudinal area above water with respect to LPP/2 [m]:0.1
Projected longitudinal area below water [m2]:223
Surge position of geometric center of the projected longitudinal area below water with respect to LPP/2 [m]:−2.9
Surge position of water line center with respect to LPP/2 [m]:−1.5
Projected transverse area above water [m2]:140
Projected transverse area below water [m2]:36
Table 7. Thrusters data for a ship with an anchor set.
ThrusterThrust Max [kN]Thrust Min [kN]Power
[kW]
Tunnel 124−24250
Tunnel 224−24250
Port propeller181−1812000
Stbd propeller181−1812000
Table 8. Maximum values of the tension of the anchor chains depending on the length of the unwound chain.
WinchMax Tension [kN]
(500 m Chain)
Max Tension [kN]
(750 m Chain)
Max Tension [kN]
(1000 m Chain)
Port Winch 1102.53116.47124.85
Stbd Winch 1102.53116.47124.85
Port Winch 2102.53116.47124.85
Stbd Winch 2102.53116.47124.85
Table 9. Comparison of the dynamic positioning system and the positioning system with a set of anchors.
Conventional DP SystemAnchor System
Advantages
-
ready for positioning immediately after reaching the set point,
-
the ability to easily change the course and the set position during positioning,
-
cooperates with the autopilot,
-
resistance to frequent changes in environmental conditions.
-
high energy consumption ends when the anchors are deployed,
-
ability to maintain position for long periods when anchor lines are taut.
Disadvantages
-
energy consumption throughout the positioning period,
-
ability to hold position depends on the set of thrusters used
-
the deployment of the anchors takes several hours,
-
limited ability to change course and position during positioning,
-
experienced crew required to operate the windlasses,
-
only applicable in moderate weather conditions,
-
longer time of leaving the position (crisis, alarm, fire, etc.)
Average hourly energy consumption (for 10 h of positioning)1825.7 [kWh]1390 [kWh]
Fuel consumption4258 [l]3241.6 [l]
C O 2 e m i s s i o n 11.24 [t]8.56 [t]
Application
-
positioning in a short period of time,
-
positioning when frequent position changes are required.
-
positioning over a longer period of time,
-
positioning in areas where work with divers is carried out,
-
fixing of oil rigs, wind farms, floating hotel owners, etc.
Publisher’s Note: MDPI stays neutral with regard to jurisdictional claims in published maps and institutional affiliations.