Article

Thermal Efficiency of Trombe Wall in the South Facade of a Frame Building

by
Przemysław Miąsik
* and
Joanna Krasoń
Department of Building Engineering, Rzeszow University of Technology, ul. Poznańska 2, 35-959 Rzeszów, Poland
*
Author to whom correspondence should be addressed.
Energies 2021, 14(3), 580; https://doi.org/10.3390/en14030580
Submission received: 21 December 2020 / Revised: 19 January 2021 / Accepted: 20 January 2021 / Published: 23 January 2021
(This article belongs to the Section G: Energy and Buildings)

Abstract

:
The article presents the possibility of using a mass collector-storage wall (CSW), integrated into the structure of a building with a light skeleton structure. The considered system is a proposal for an energy-saving solution that can be used in buildings with various utility purposes. The article presents the results of experimental tests of a collector-storage wall mounted in the space of the skeleton structure of the southern facade of a building for the period of one year, as well as the results of numerical simulation. In the summer, the influence of the use of heat-insulating roller shutters on limiting overheating of the chamber interior was investigated. The effect of using the roller shutters is a reduction in the average value of the heat flux by about 77%. In the winter, the energy efficiency of the wall was tested. The obtained effect is energy consumption during the heating season at a level comparable to a wall with a traditional structure with a coefficient of U = 0.30 W/(m2K). The results of the numerical tests showed high agreement with the direct results, which provides a basis for the use of such simulations in further research on the search for the optimal structure of a collector-storage wall.

1. Introduction

Issues related to energy saving and production are currently among the priority topics being investigated by global research institutions. Renewable energy sources include, among others, solar radiation energy along with its derivatives, which are hydro, wind and biomass energy. Due to the way solar radiation energy is processed, two groups of systems using photothermal conversion can be distinguished:
-
active systems—in which installations and equipment are employed to obtain solar radiation energy;
-
passive systems—most often integrated into the structure of an external barrier, which will obtain solar radiation energy without additional equipment.
A characteristic feature of passive systems is the free flow of heat flux based on the natural phenomena of convection, radiation and conduction. Passive solar solutions may be divided into direct and indirect gain systems. The former relates to an increase in thermal energy of a building by the absorption of direct, short-wave solar radiation transmitted to the building’s interior by its transparent barriers [1,2,3], while the latter refers to the building’s interior temperature increase by the absorption of long-wave radiation re-emitted by its opaque barriers. In order to maximize a building’s thermal performance, its opaque barriers should have adequate thermal capacity, which will make it possible to store the heat and transmit it into the building interior over a prolonged period of time. The example of the indirect gain system is the collector-storage wall (CSW) [4,5,6].
Collector-storage walls, also known as Trombe walls, are commonly seen [4,5,7,8,9,10]; they are an alternative solution to walls made using monolithic concrete technology [11,12] or wooden walls [13,14,15], and are constantly being modified to increase their energy efficiency [16,17,18,19,20]. The Trombe wall consists of the following layers: an external glazing that is in contact with the external air, an air gap and a layer that accumulates thermal energy. The main advantage of this type of structure is the possibility of stabilizing the temperature of the internal air in an adjacent room. This is due to the high heat capacity of the storage layer. Due to the high weight of this layer, collector-storage walls are most often used in buildings with masonry or monolithic reinforced concrete walls.
The task of the storage layer, during a period of low external air temperature, is to use the stored thermal energy obtained from solar radiation, and then transfer it to an adjacent room in a period of lower temperatures. On the other hand, during a period of high external air temperature, the task of the storage layer is to stabilise the temperature of the internal air, protecting the room against overheating. To prevent the wall itself from overheating the room, external shading covers (e.g., blinds) [4,21,22] should be used.
Research is being conducted on modified Trombe wall solutions both in the period of low temperatures (winter, transition period) [8,23,24] and in the period of high temperatures (summer) [25], in various geographical locations [26,27,28], aimed at determining the effectiveness of these solutions in various environmental conditions. Article [25] presents a method of limiting the overheating of rooms in summer by introducing additional shading (roller shutter) and ventilation. The use of the additional elements reduced the cooling energy requirement by up to about 73%. During the heating season, the main purpose of using CSW is to obtain and accumulate, in the masonry layer, as much solar radiation energy as possible during the day. The stored energy is then transferred into the adjacent room over a shifted period of time. In article [23], the research confirms a reduction in energy consumption during the heating season with the use of a modified southern facade. In article [8], the authors determined the amount of energy consumption during the heating season, depending on the type of heating system used. They confirmed that the application of a Trombe wall and the use of solar radiation energy will reduce the energy consumption for heating by about 20%.
One of the further modifications is the use of a forced air system through the operation of fans and an additional internal partition, making up a component of a collector-storage wall [29].
Phase change material (PCM), thanks to its latent heat properties, is also used in collector-storage walls. In these walls, PCM is used in different places. It is placed in the masonry layer or in the cement mortar, creating a composite [30,31,32]. PCM can be placed as a separate layer connected to the masonry structure, located on the glazing side [33,34,35]. Then, the purpose of the above solutions is to increase the storage of thermal energy obtained from solar radiation. In article [36] the authors used two layers of PCM located on the inside of the masonry wall, separated by a layer of thermal insulation. The aim of this solution was to improve the thermal comfort in the room throughout the year. In the numerical tests, a PCM layer adjacent to the wall layer with a phase transformation temperature of 30 °C and a PCM layer on the inside with a phase transformation temperature of 18 °C were assumed. The simulations confirmed an improvement of thermal comfort in the room adjacent to the modified wall.
In order to obtain the best results from the collector-storage walls under consideration, research has been carried out in two areas: experimental [23,24,33] and by means of computer simulations [8,26,36,37]. The obtained results were often compared with each other and then correlations (validations) between them were created [38,39]. At the same time, on the basis of previous simulations, experimental tests have been carried out, confirming the results obtained during the simulation tests. In article [40], the authors performed mathematical and simulation analysis in conjunction with experimental tests. An average deviation of 5.14% was found between the theoretical experiments and the obtained test results, and a thermal comfort in the room was achieved at a very good level.
Another collector-storage wall solution is their use in frame buildings with light filling of the wall space. Buildings of this construction are characterized by small accumulation and thermal inertia. This is a disadvantageous feature due to the inability to stabilize the air temperature in the adjacent room. Particularly significant temperature fluctuations occur in the case of southern facades, where the influence of solar radiation leads to the overheating of rooms in summer [3,41,42]. This phenomenon reduces the comfort of using such a room. In order to improve thermal comfort in buildings with a light skeleton structure, various modifications of the wall filling are carried out [28,43,44,45].
This article proposes the use of a collector-storage wall as a filling of the wall space in a frame building in its southern facade (a hybrid combination of two solutions). It is a system that uses a combination of two solutions: the use of an storage wall that obtains solar radiation energy in the southern facade of the building and the use of a traditional lightweight housing with high thermal insulation in the remaining external walls of the frame building.
The tests were carried out in real conditions and a computer simulation of the wall was made. In the experimental and numerical studies, the influence of rain and wind on the operation of the barriers was not taken into account. The aim of the research was to check whether the solution of a collector-storage wall as a filling of the skeleton structure in the southern facade of a building will have a positive effect on the thermal conditions in the adjacent room.

2. Materials and Methods

2.1. Research Site

The subject of the research is a collector-storage wall filling a skeleton steel structure. Field tests in real climatic conditions were carried out thanks to the installation of the wall in question in the southern elevation of a test chamber located at the Rzeszów University of Technology (Figure 1). The chamber with internal dimensions of 2200 mm × 1500 mm × 2500 mm (length × width × height) was used to simulate the real environmental conditions of the room adjacent to the wall being tested. The chamber was positioned in such a way that the tested wall was positioned in the southern elevation. This was a deliberate procedure, because on the southern elevation—due to intense sunlight—the structure of the wall was subject to the most variable boundary conditions.

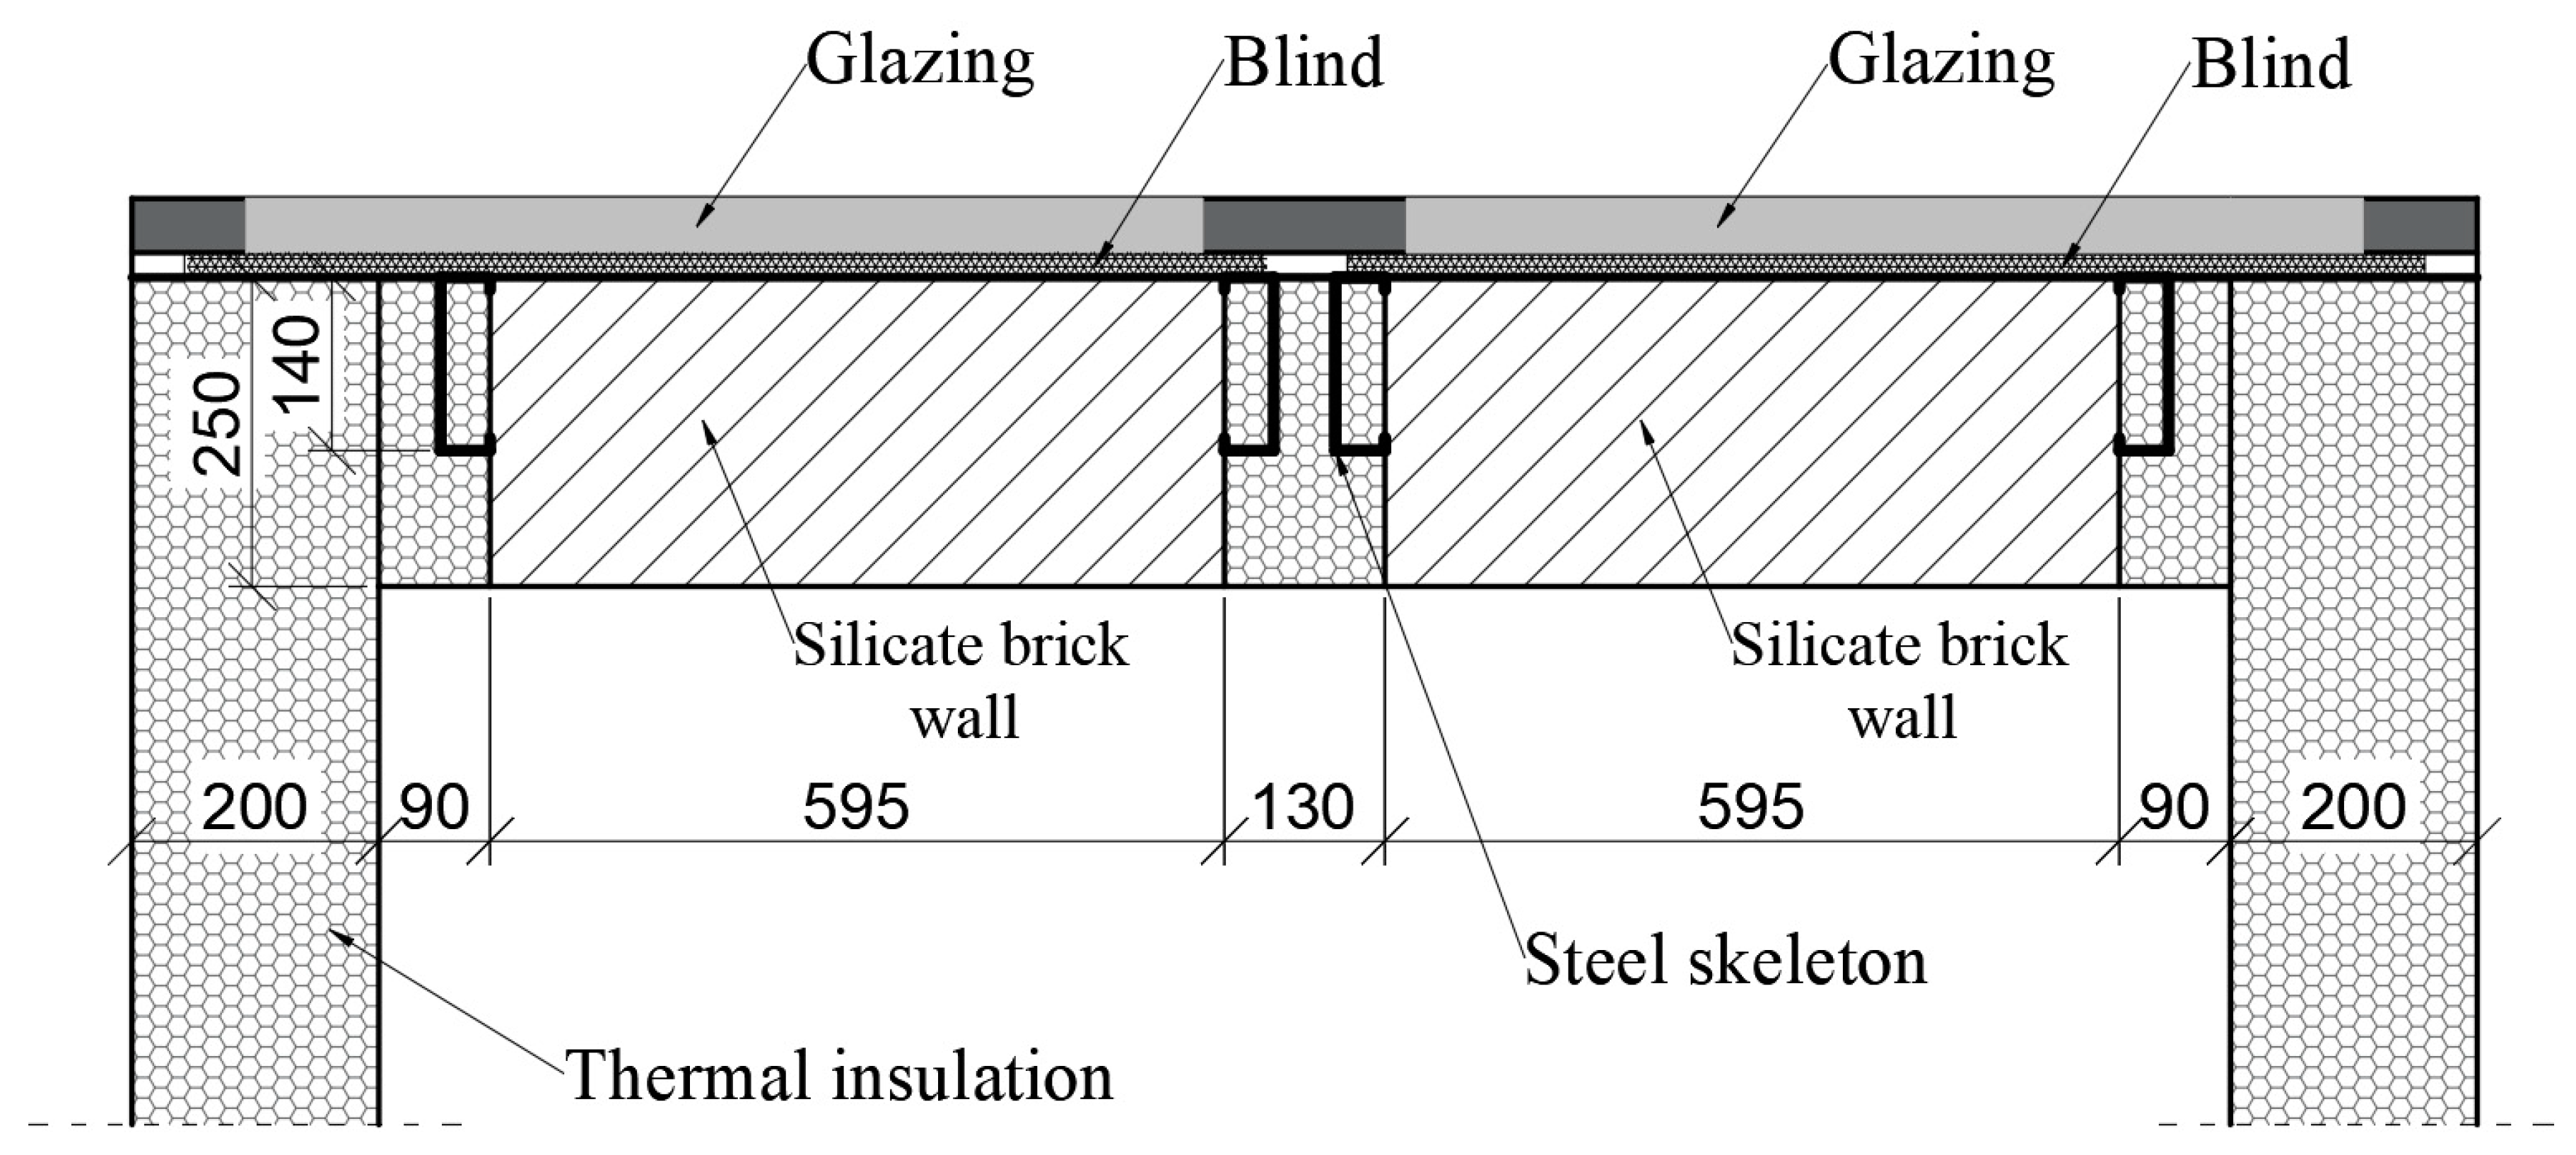
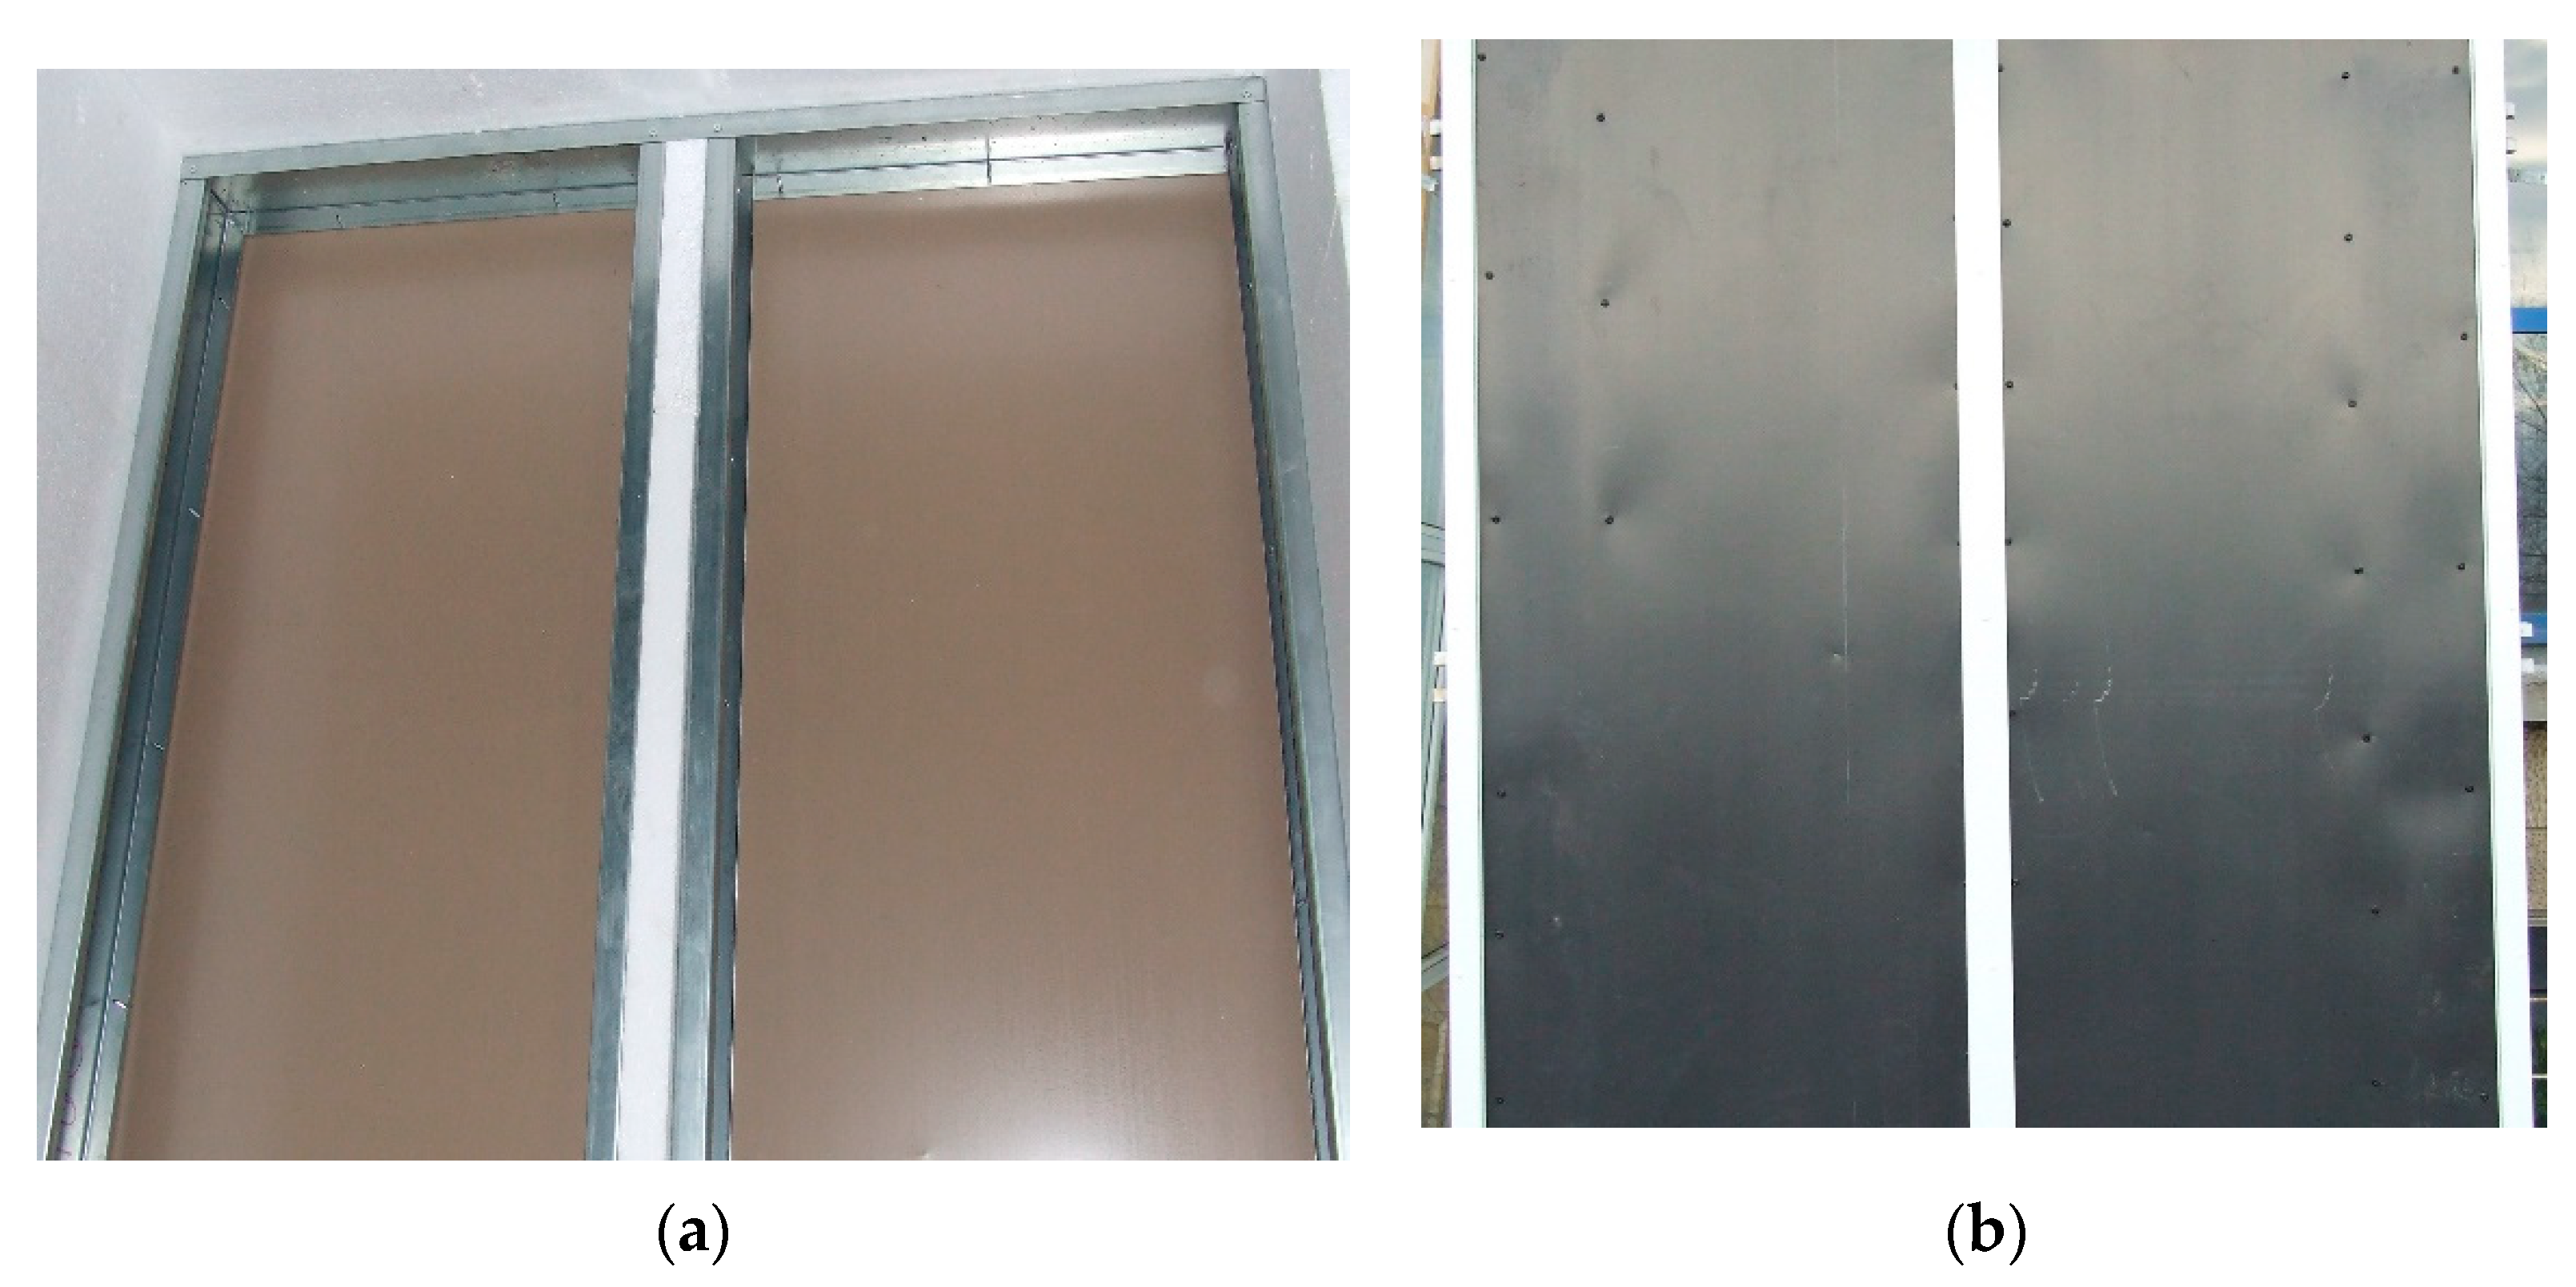
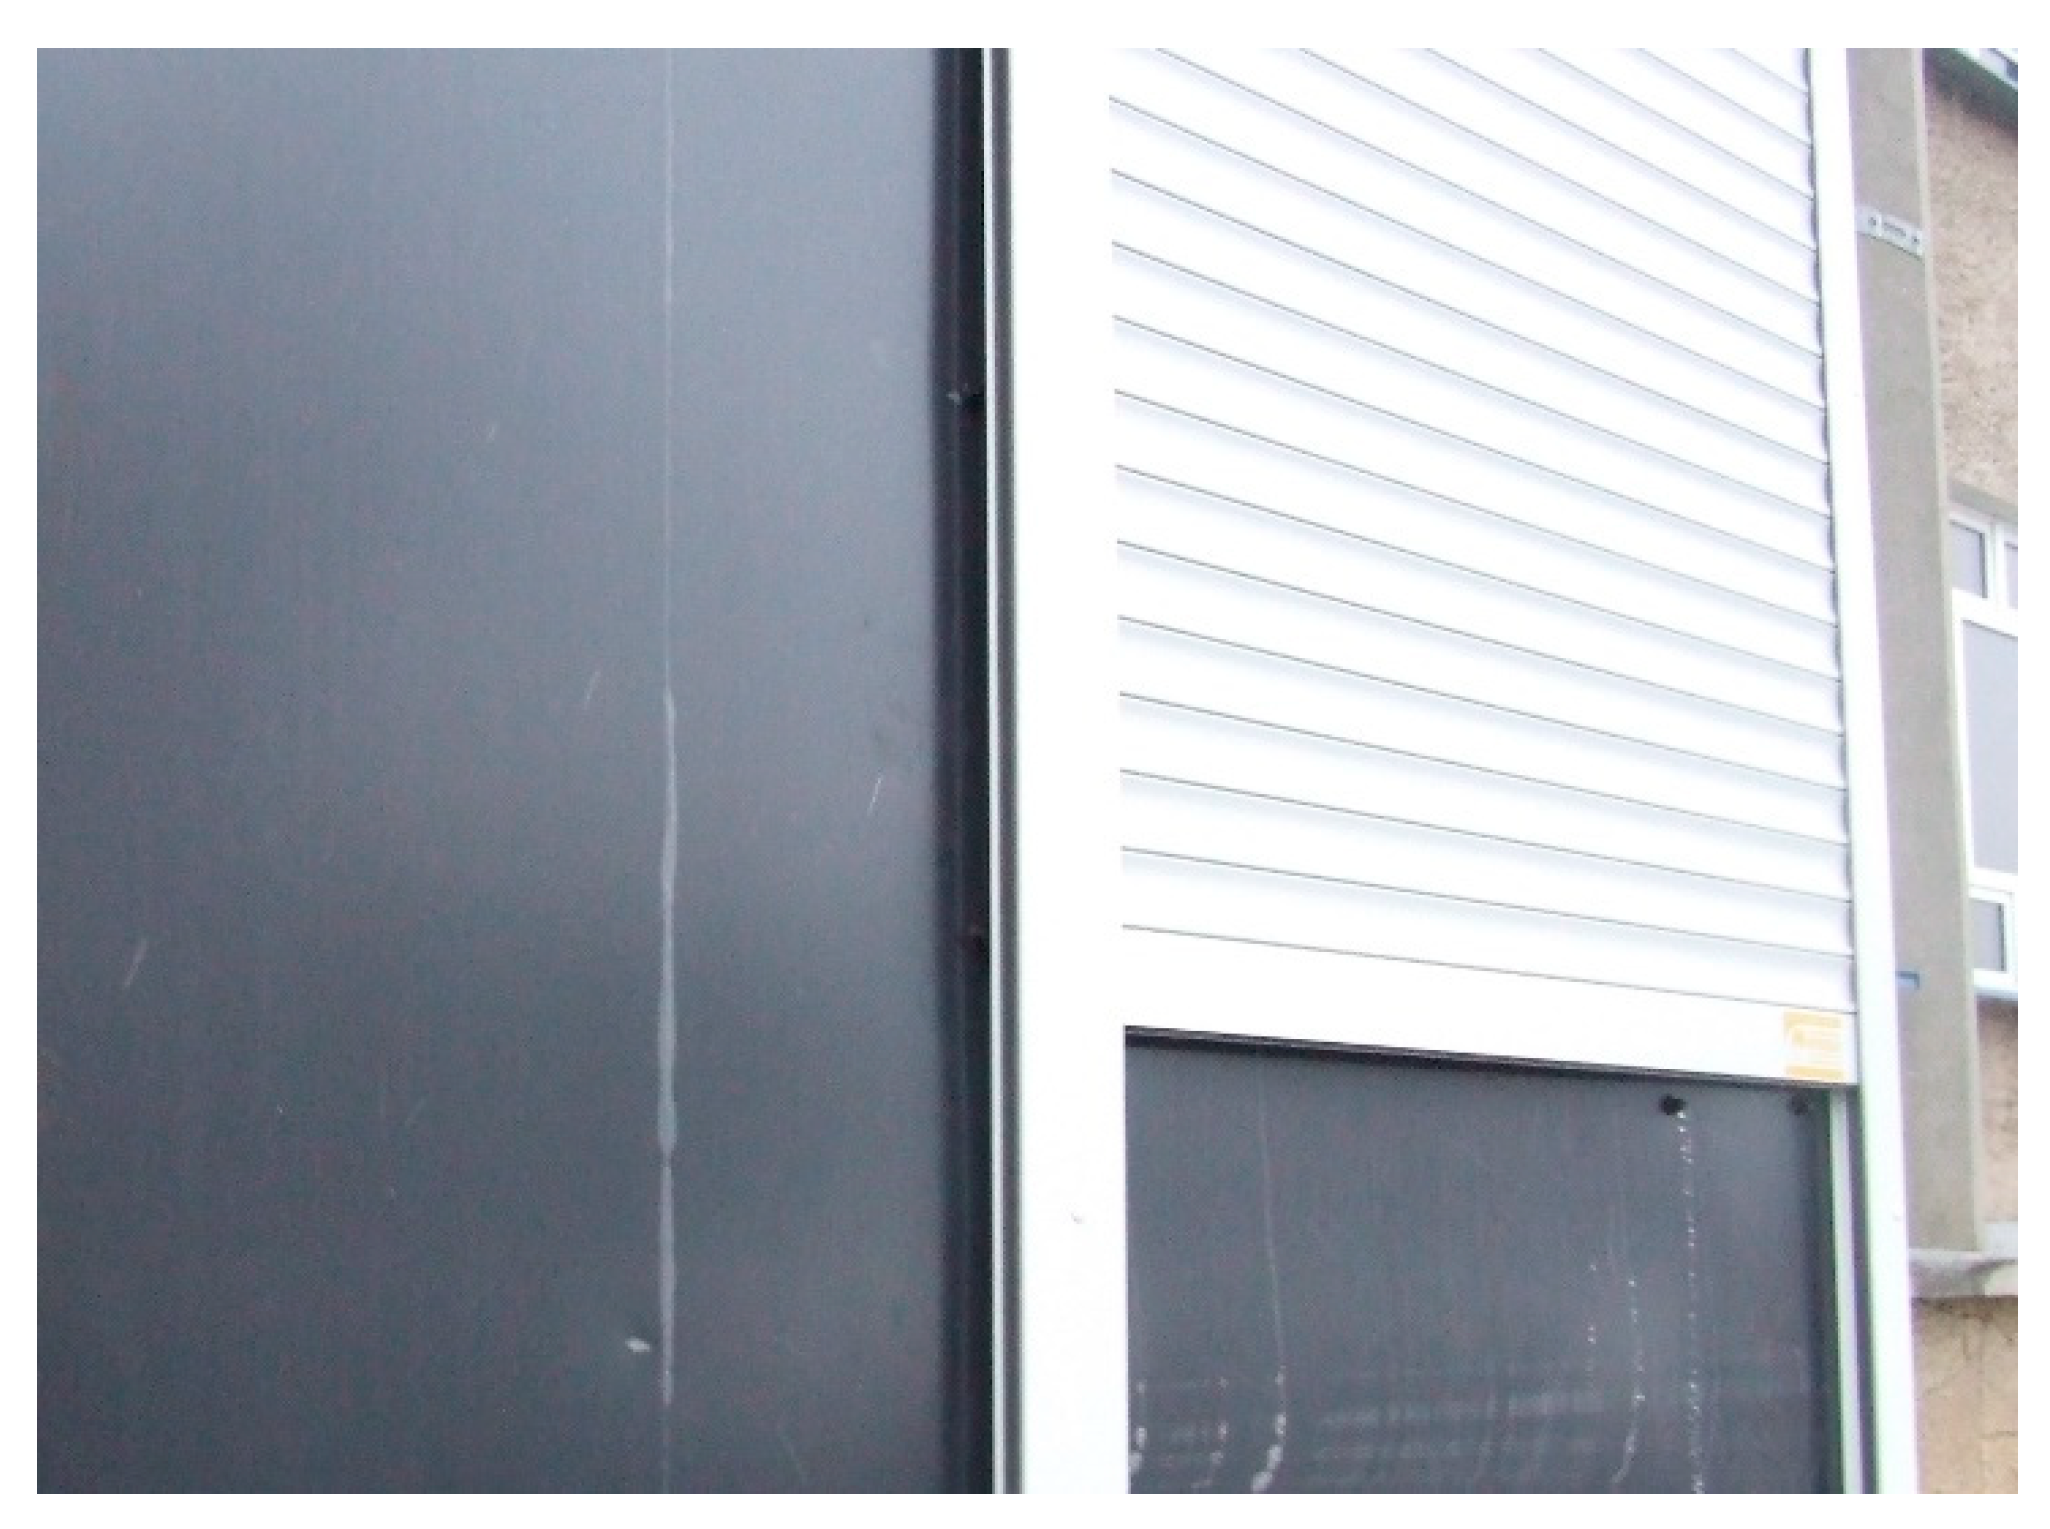
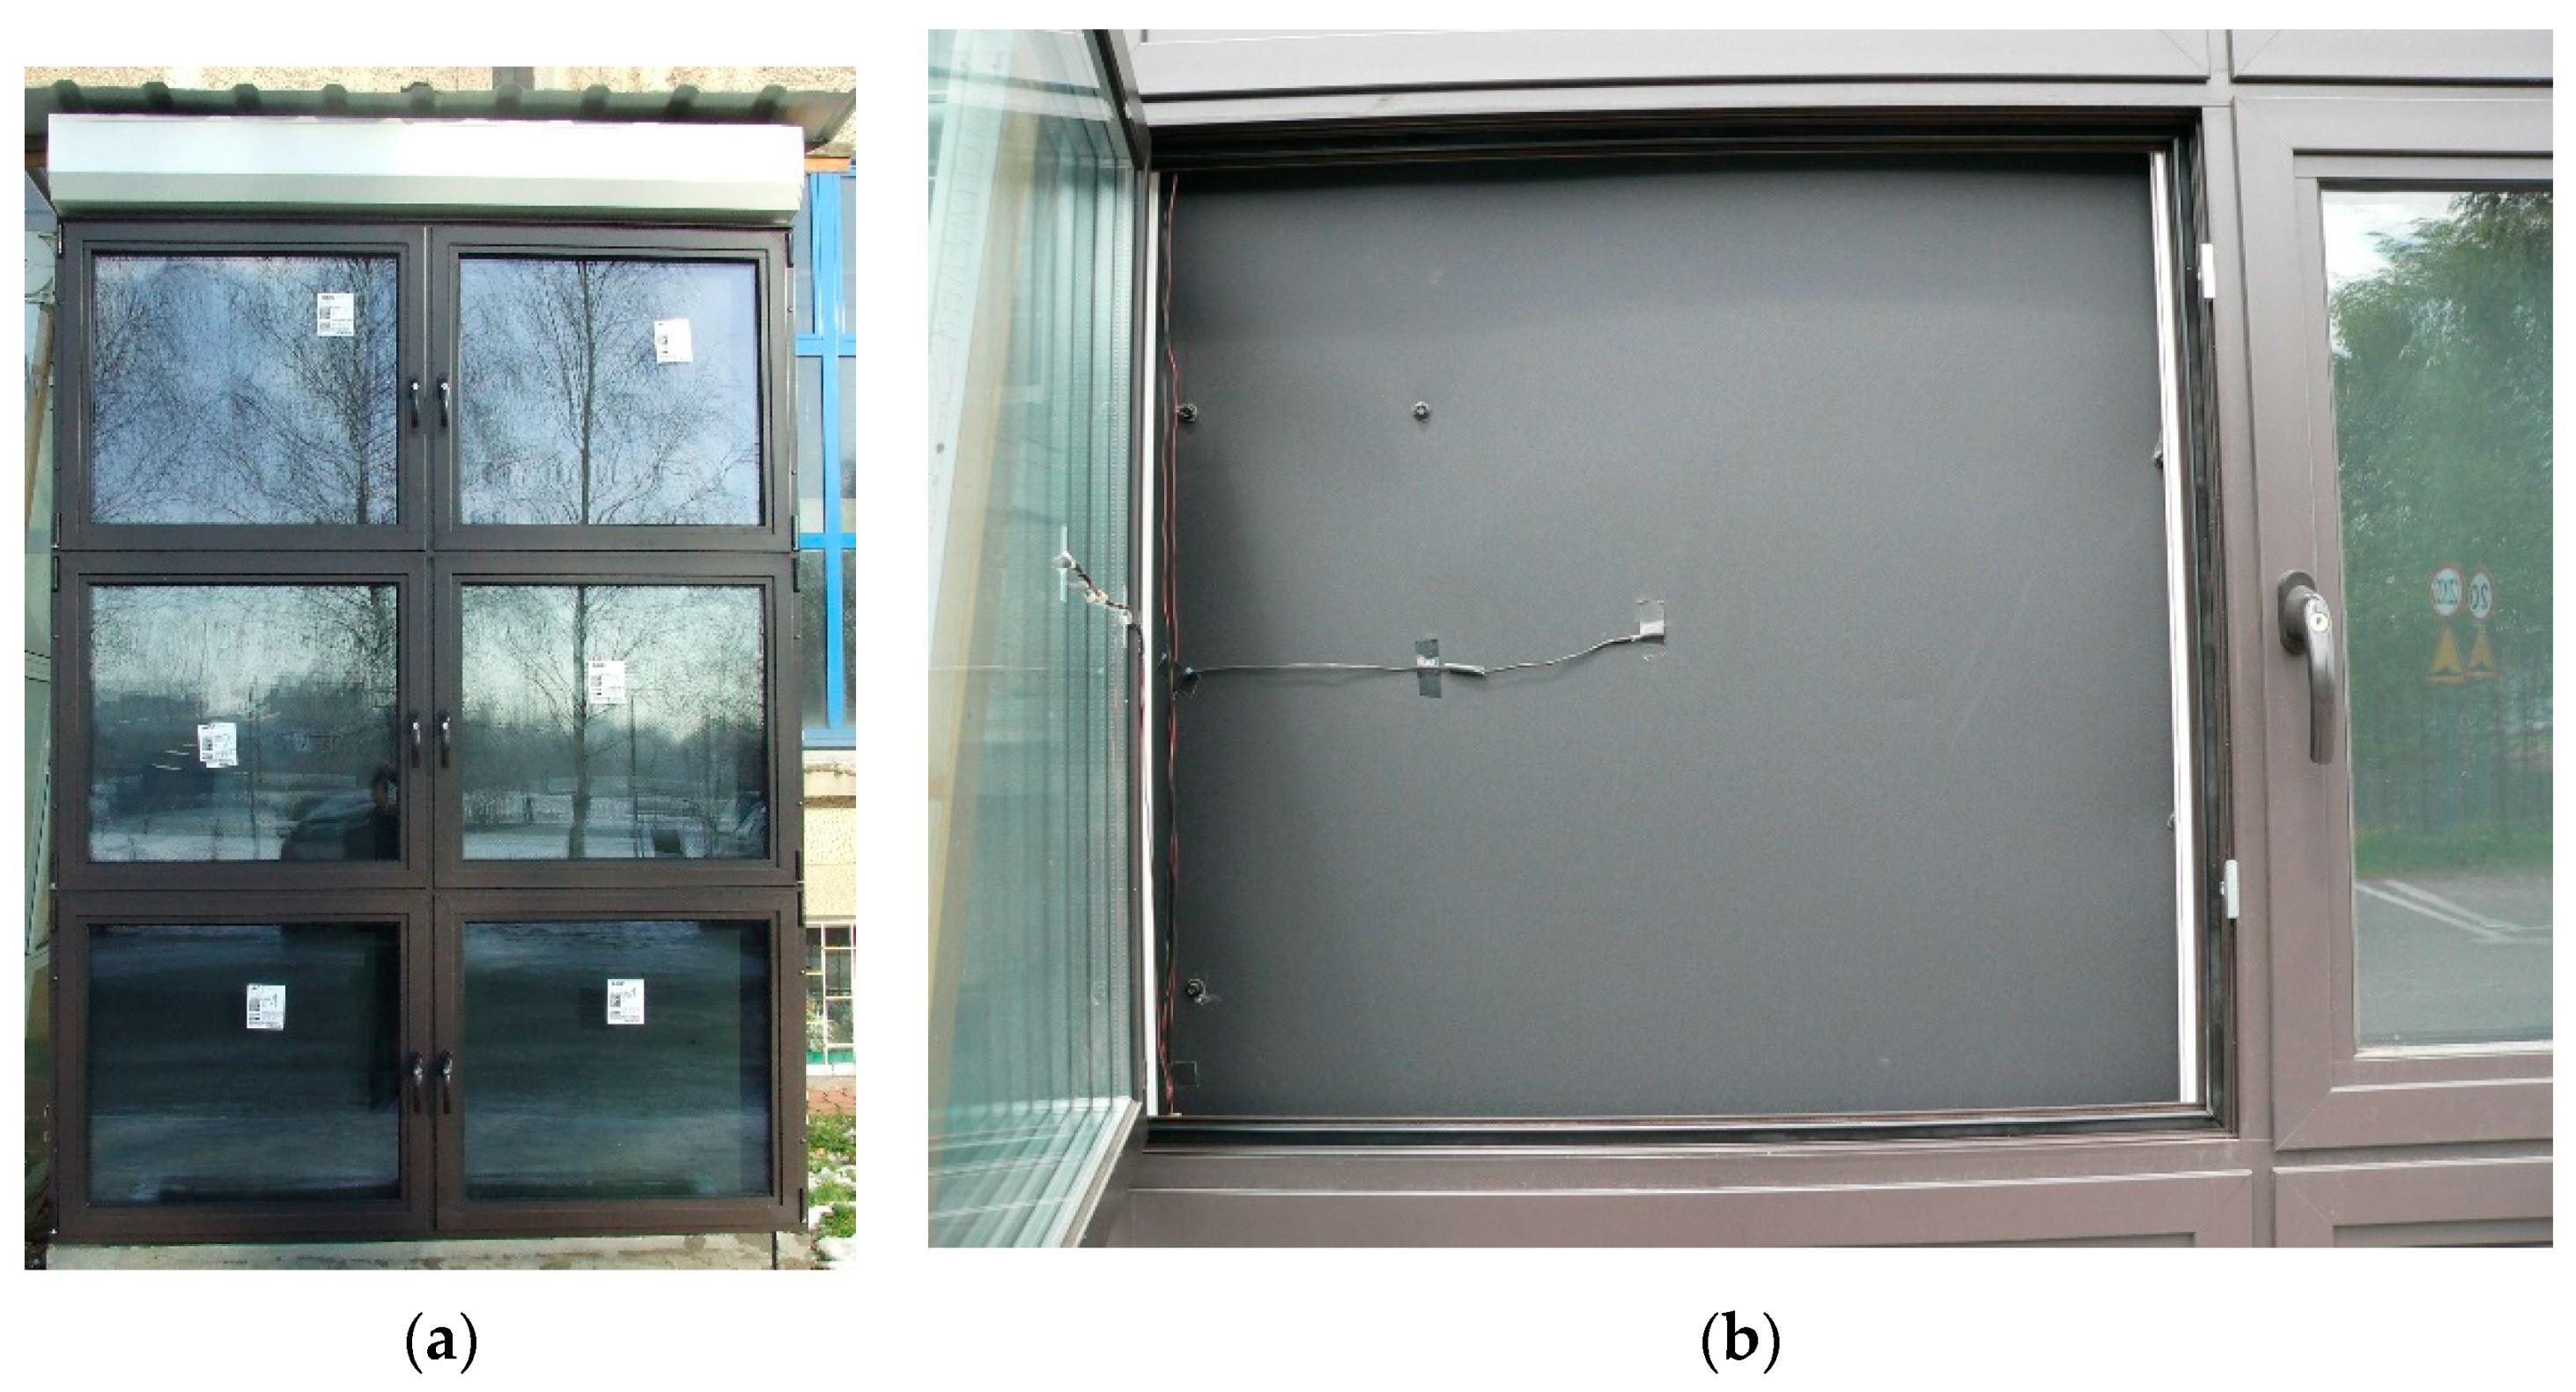
2.2. Design of the Wall

The considered barrier was constructed as follows: from the outside, there was a double-pane glazing unit with a width of 24 mm (4 mm pane + 16 mm air gap + 4 mm second pane). Directly behind the glass there was a 1 mm thick steel sheet absorber. The absorber was in contact with a 140 mm wide steel skeleton, the space between the skeleton profiles was filled with a wall made of 250 mm silicate brick. A horizontal cross-section through the barrier is presented in a drawing (Figure 2).
The technical properties of the materials used are presented in Table 1. The parameters of silicate brick wall and thermal insulation were determined on the basis of our own research carried out in the laboratory of Rzeszów University of Technology.
The construction of the wall is a steel skeleton, made of steel C-sections with a width of 140 mm. On the outer side of the structure there is a housing made of black steel sheet, which is also an absorber of solar radiation. The space inside the structure sections was filled with a thermally insulating material (Styrofoam) (Figure 3).
The absorber transfers the energy from solar radiation to the accumulating material, which is a 250 mm-thick silicate brick wall. The inner surface of the wall is covered with cement-lime plaster and painted with white acrylic paint (Figure 4).
One of the objectives of the research was to determine the effect of thermal insulation resistance (in the form of external roller shutters) on the limitation of the heat flux through the wall. On the outer surface of the absorber two heat-insulating roller shutters (Figure 5), with a timer-controlled drive, were mounted in a vertical arrangement. The internal function of the programmer allowed for automatic changes in the position of the roller shutters depending on the local sunrise and sunset times. During the entire test period, the temperature in the chamber was kept at a minimum level of +20 °C (heating was turned on automatically when the internal air temperature dropped below +20 °C and turned off after reaching the temperature of +20.1 °C).
The outer layer of the wall consists of glazing, which transmits short-wave radiation towards the absorber, causing it to heat up, while limiting the thermal radiation emitted by the absorber towards the outside. Another advantage is that a favourable visual effect of the facade is obtained. The shutters were placed between the absorber and the glazing. This arrangement of layers in the wall was adopted due to the protruding elements of the glazing frame, which contained security locks and handles allowing access to the partition space from the outside. This solution allowed access to the sensors located on the absorber (Figure 6).
The authors of the research are aware that, in practice, it is more advantageous if a roller shutter is located on the outside of the glazing. Especially in summer, such a system is more advantageous because of the possibility of limiting the overheating of the wall.

2.3. Research Apparatus

During the measurements, the following measurement data related to the heat flux flow through the wall were recorded:
-
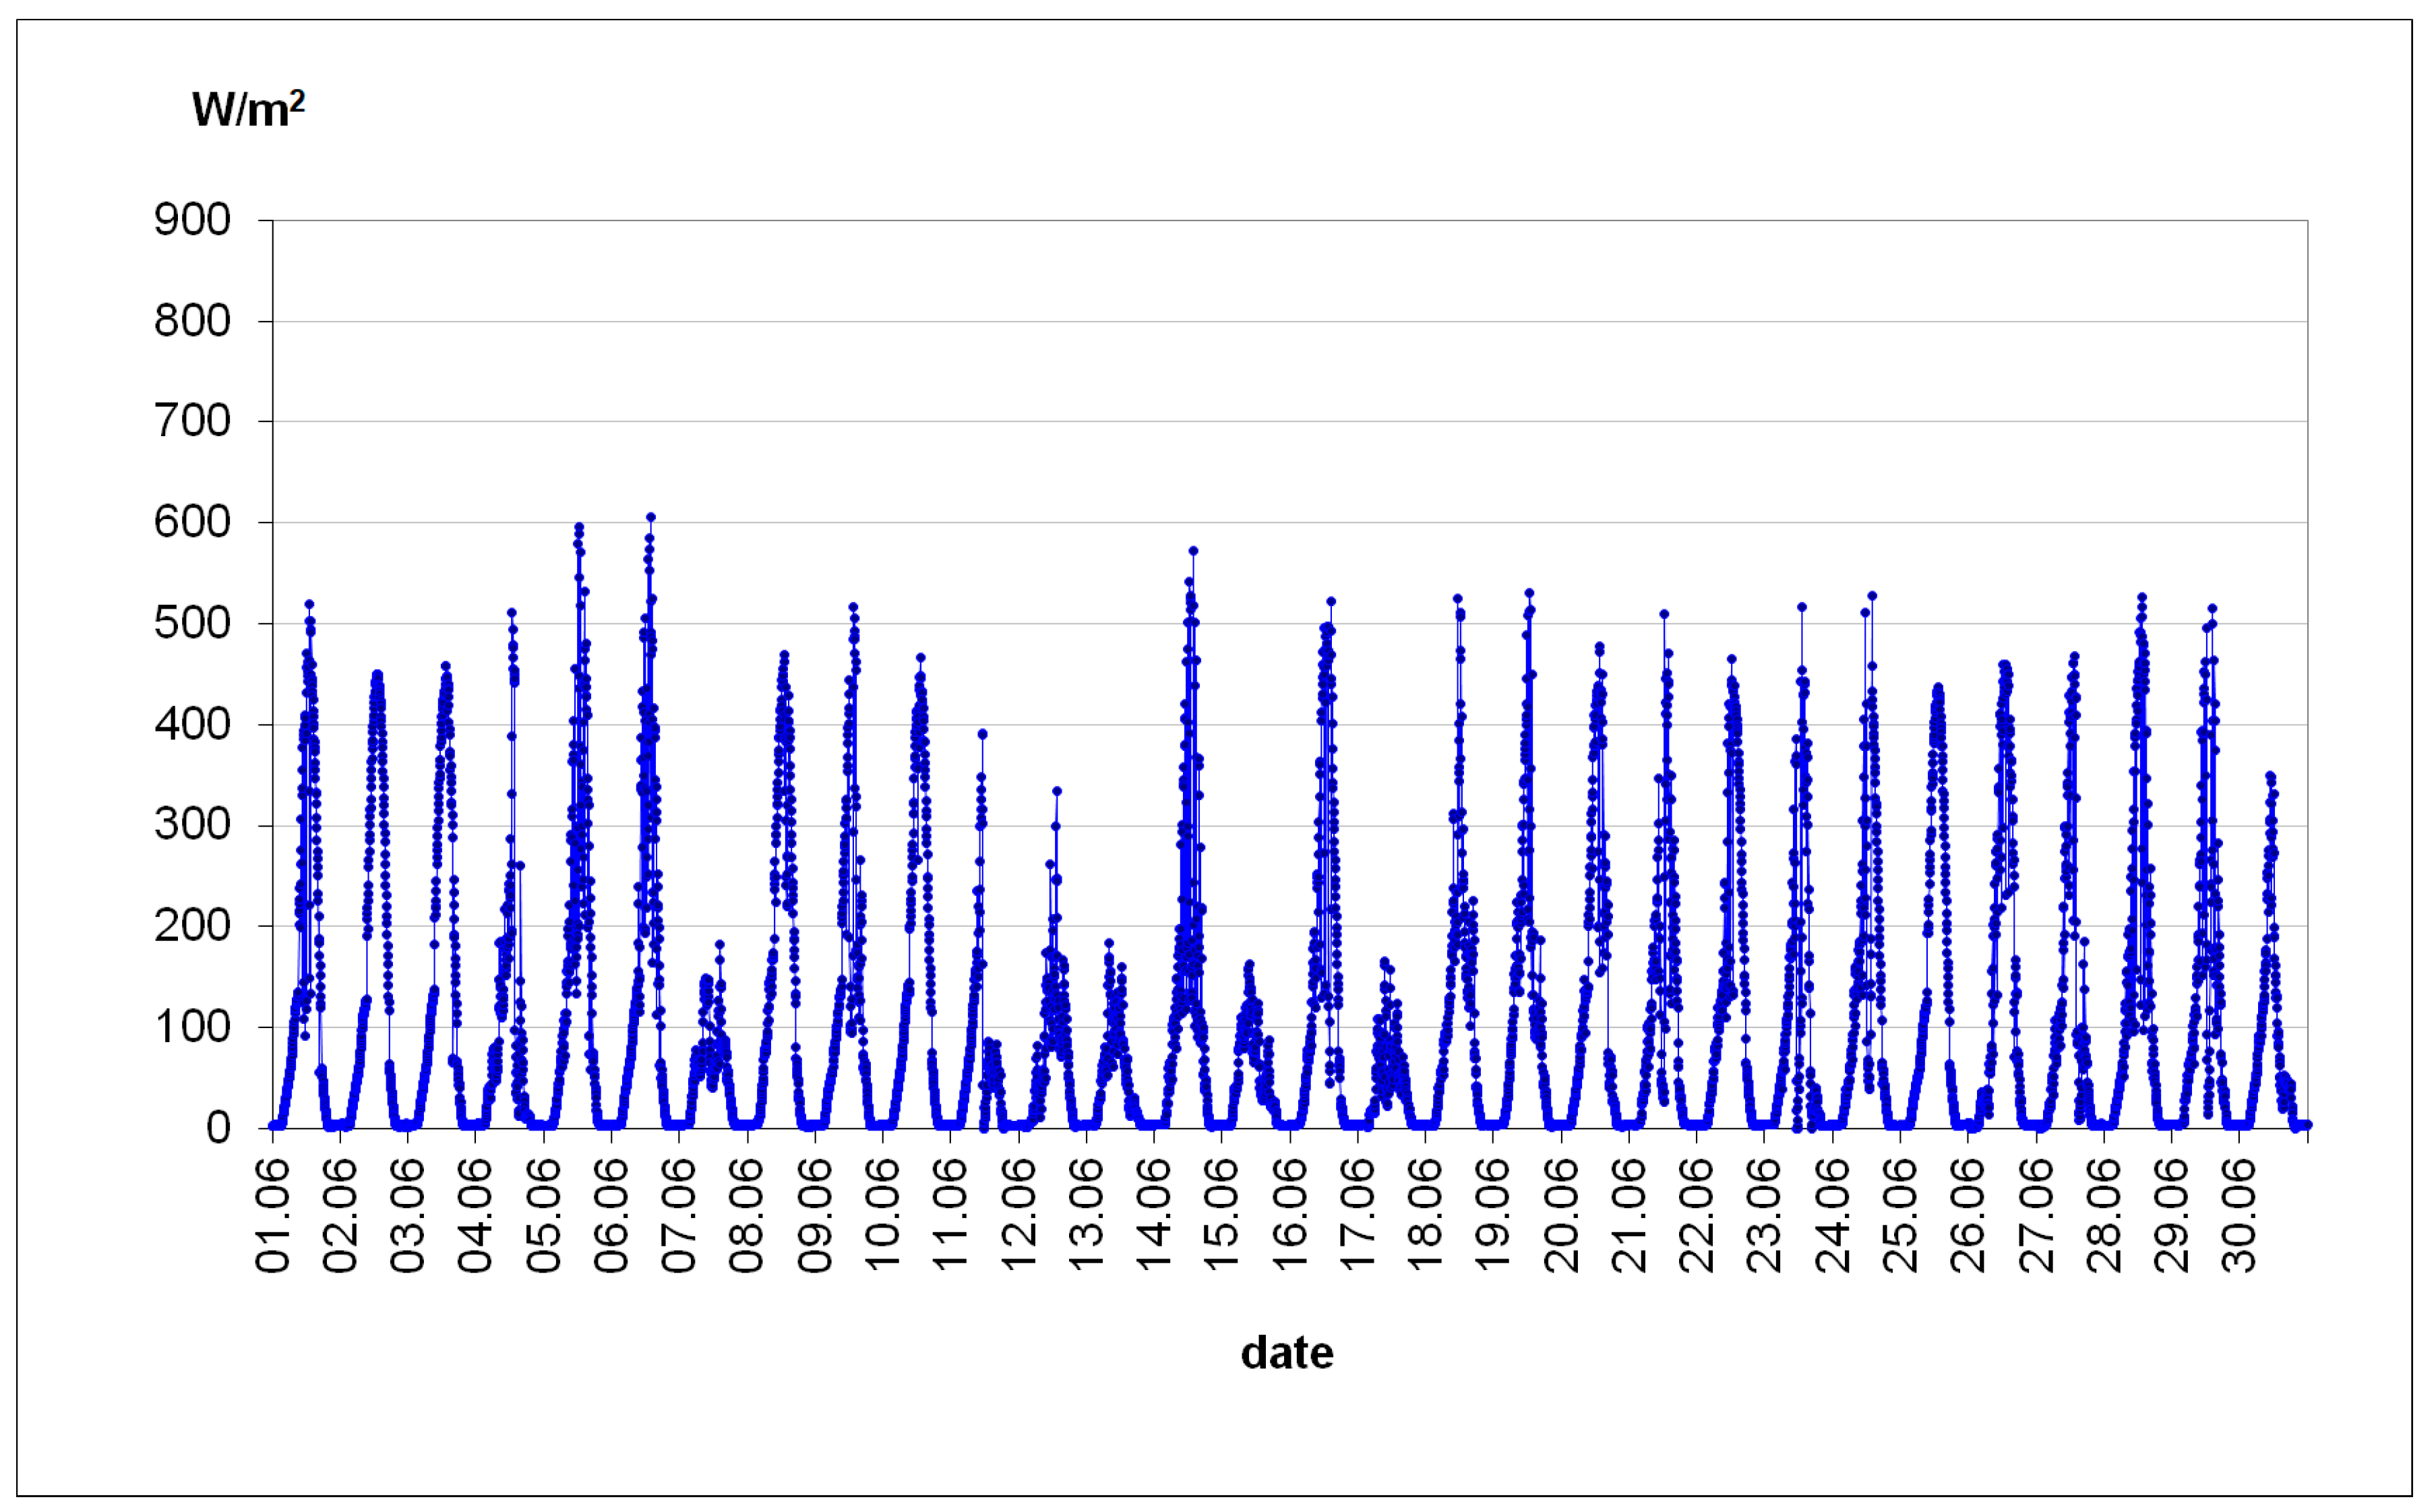
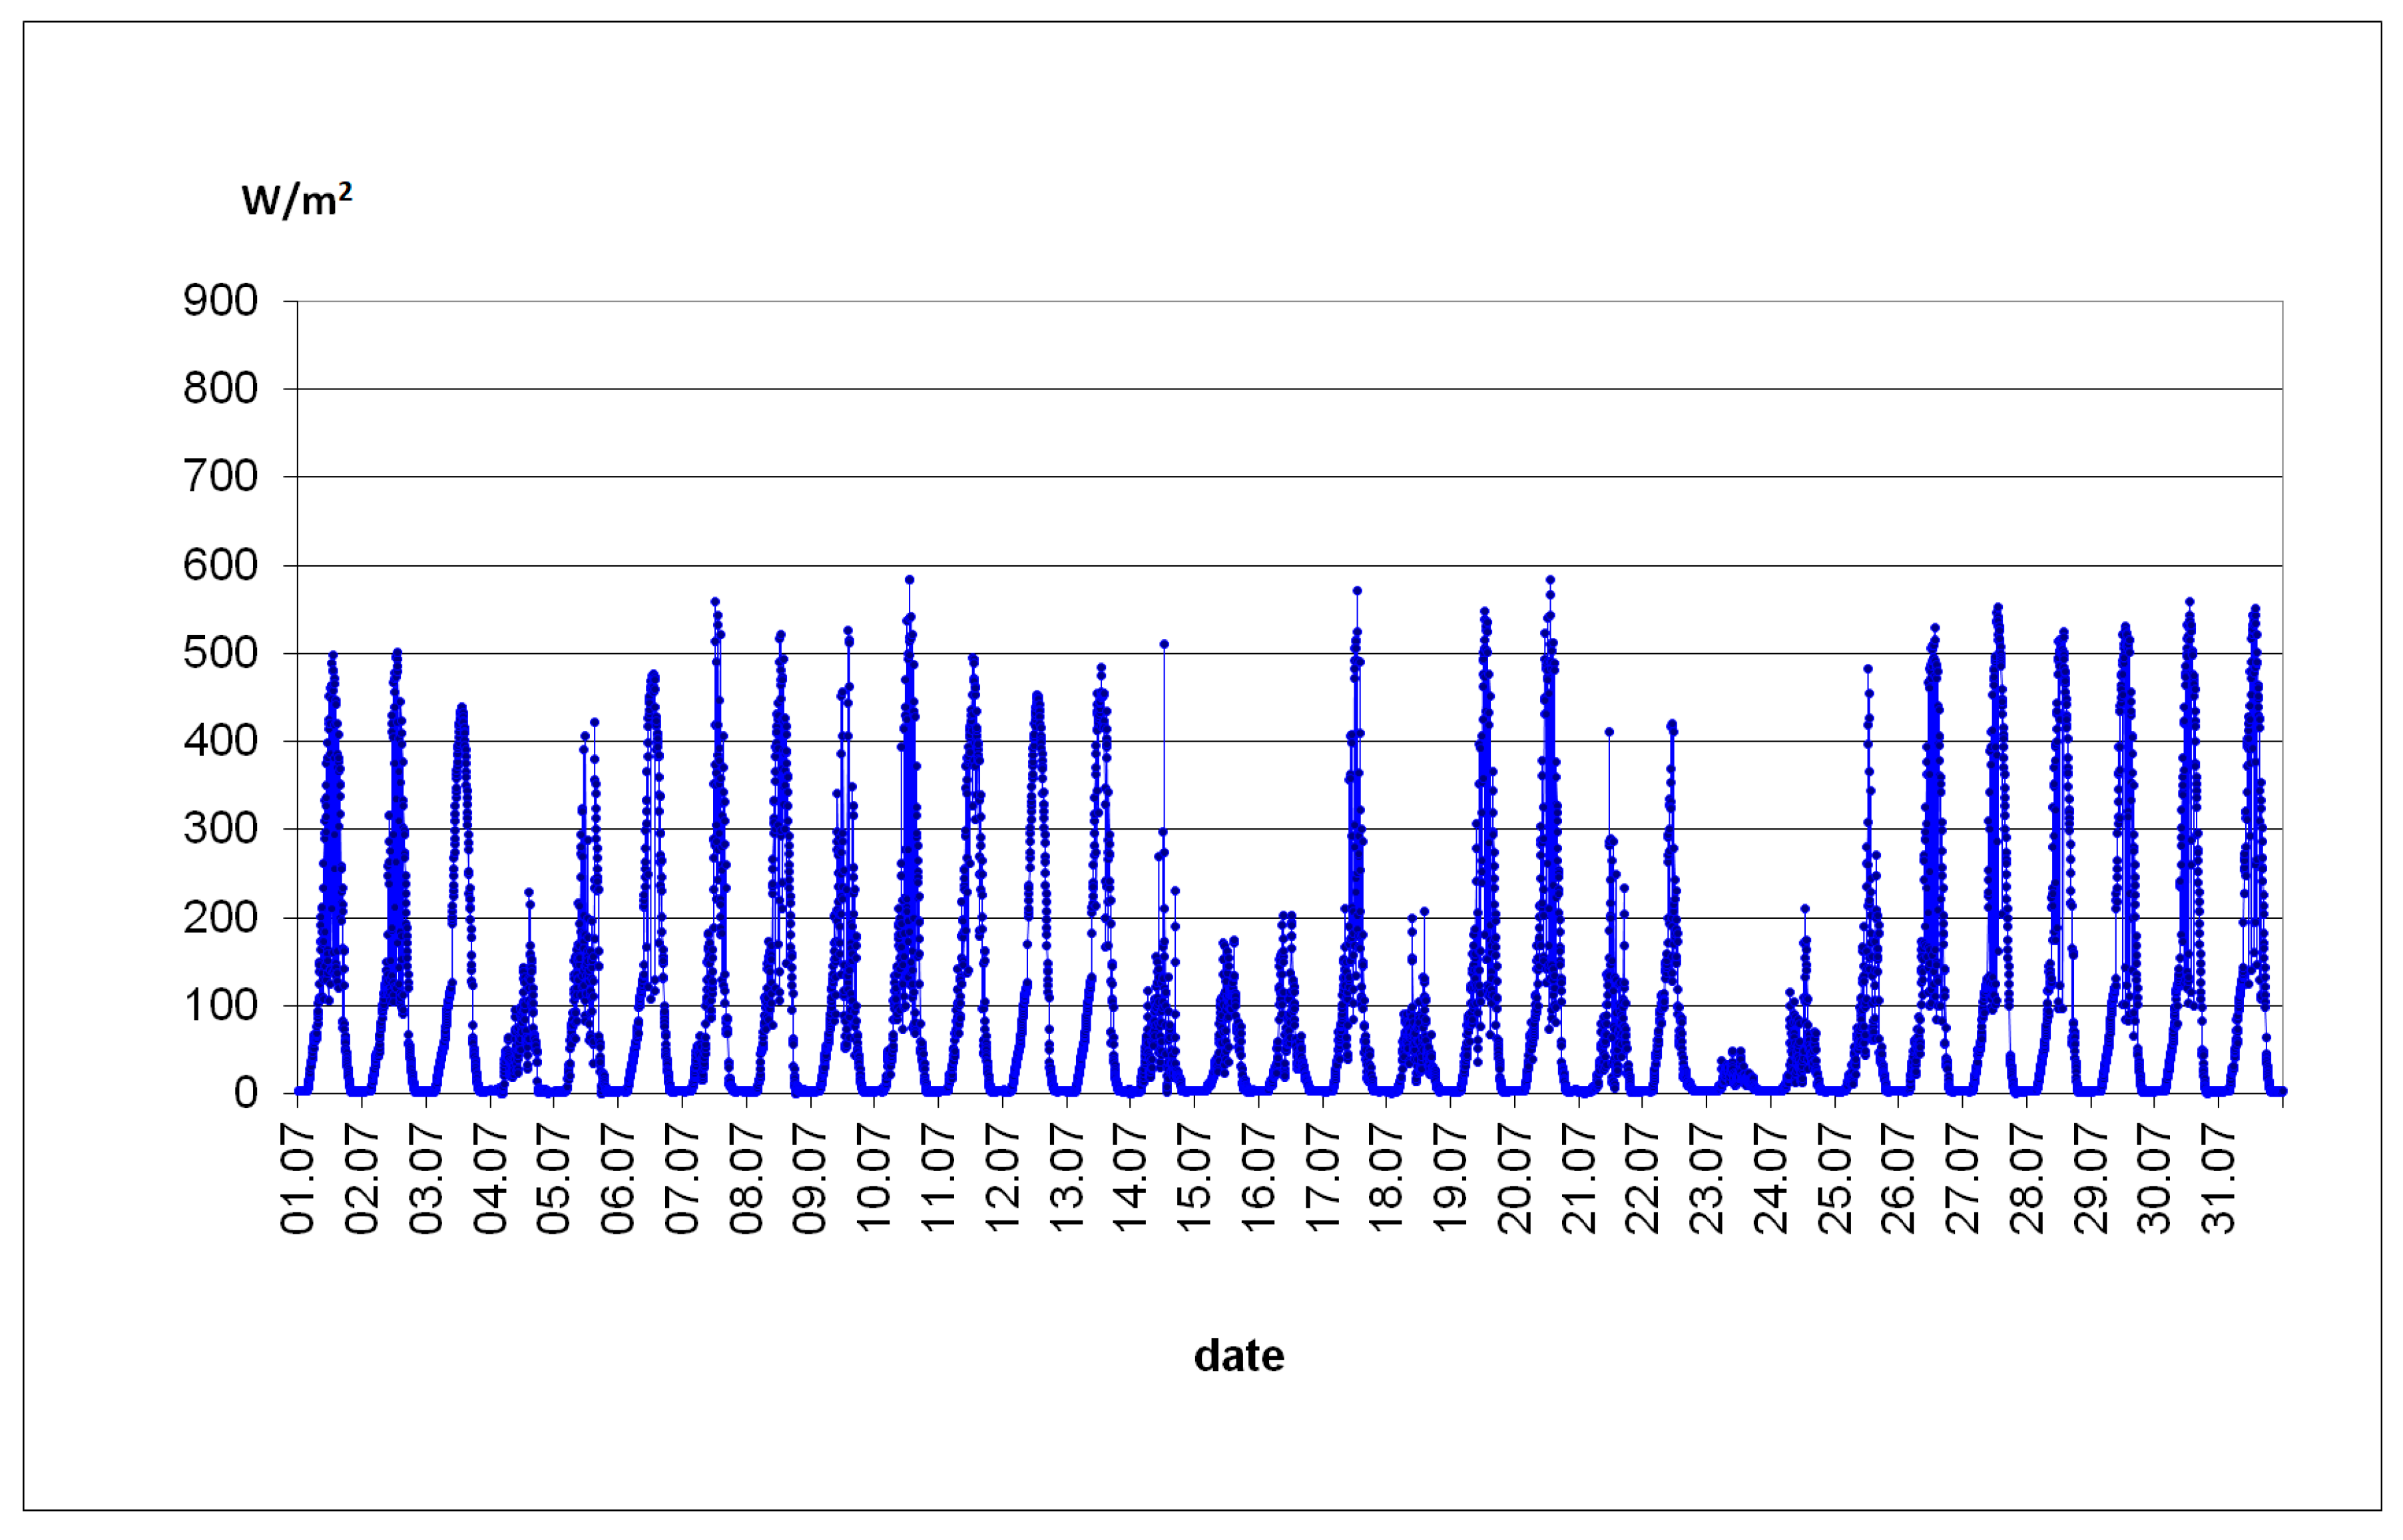
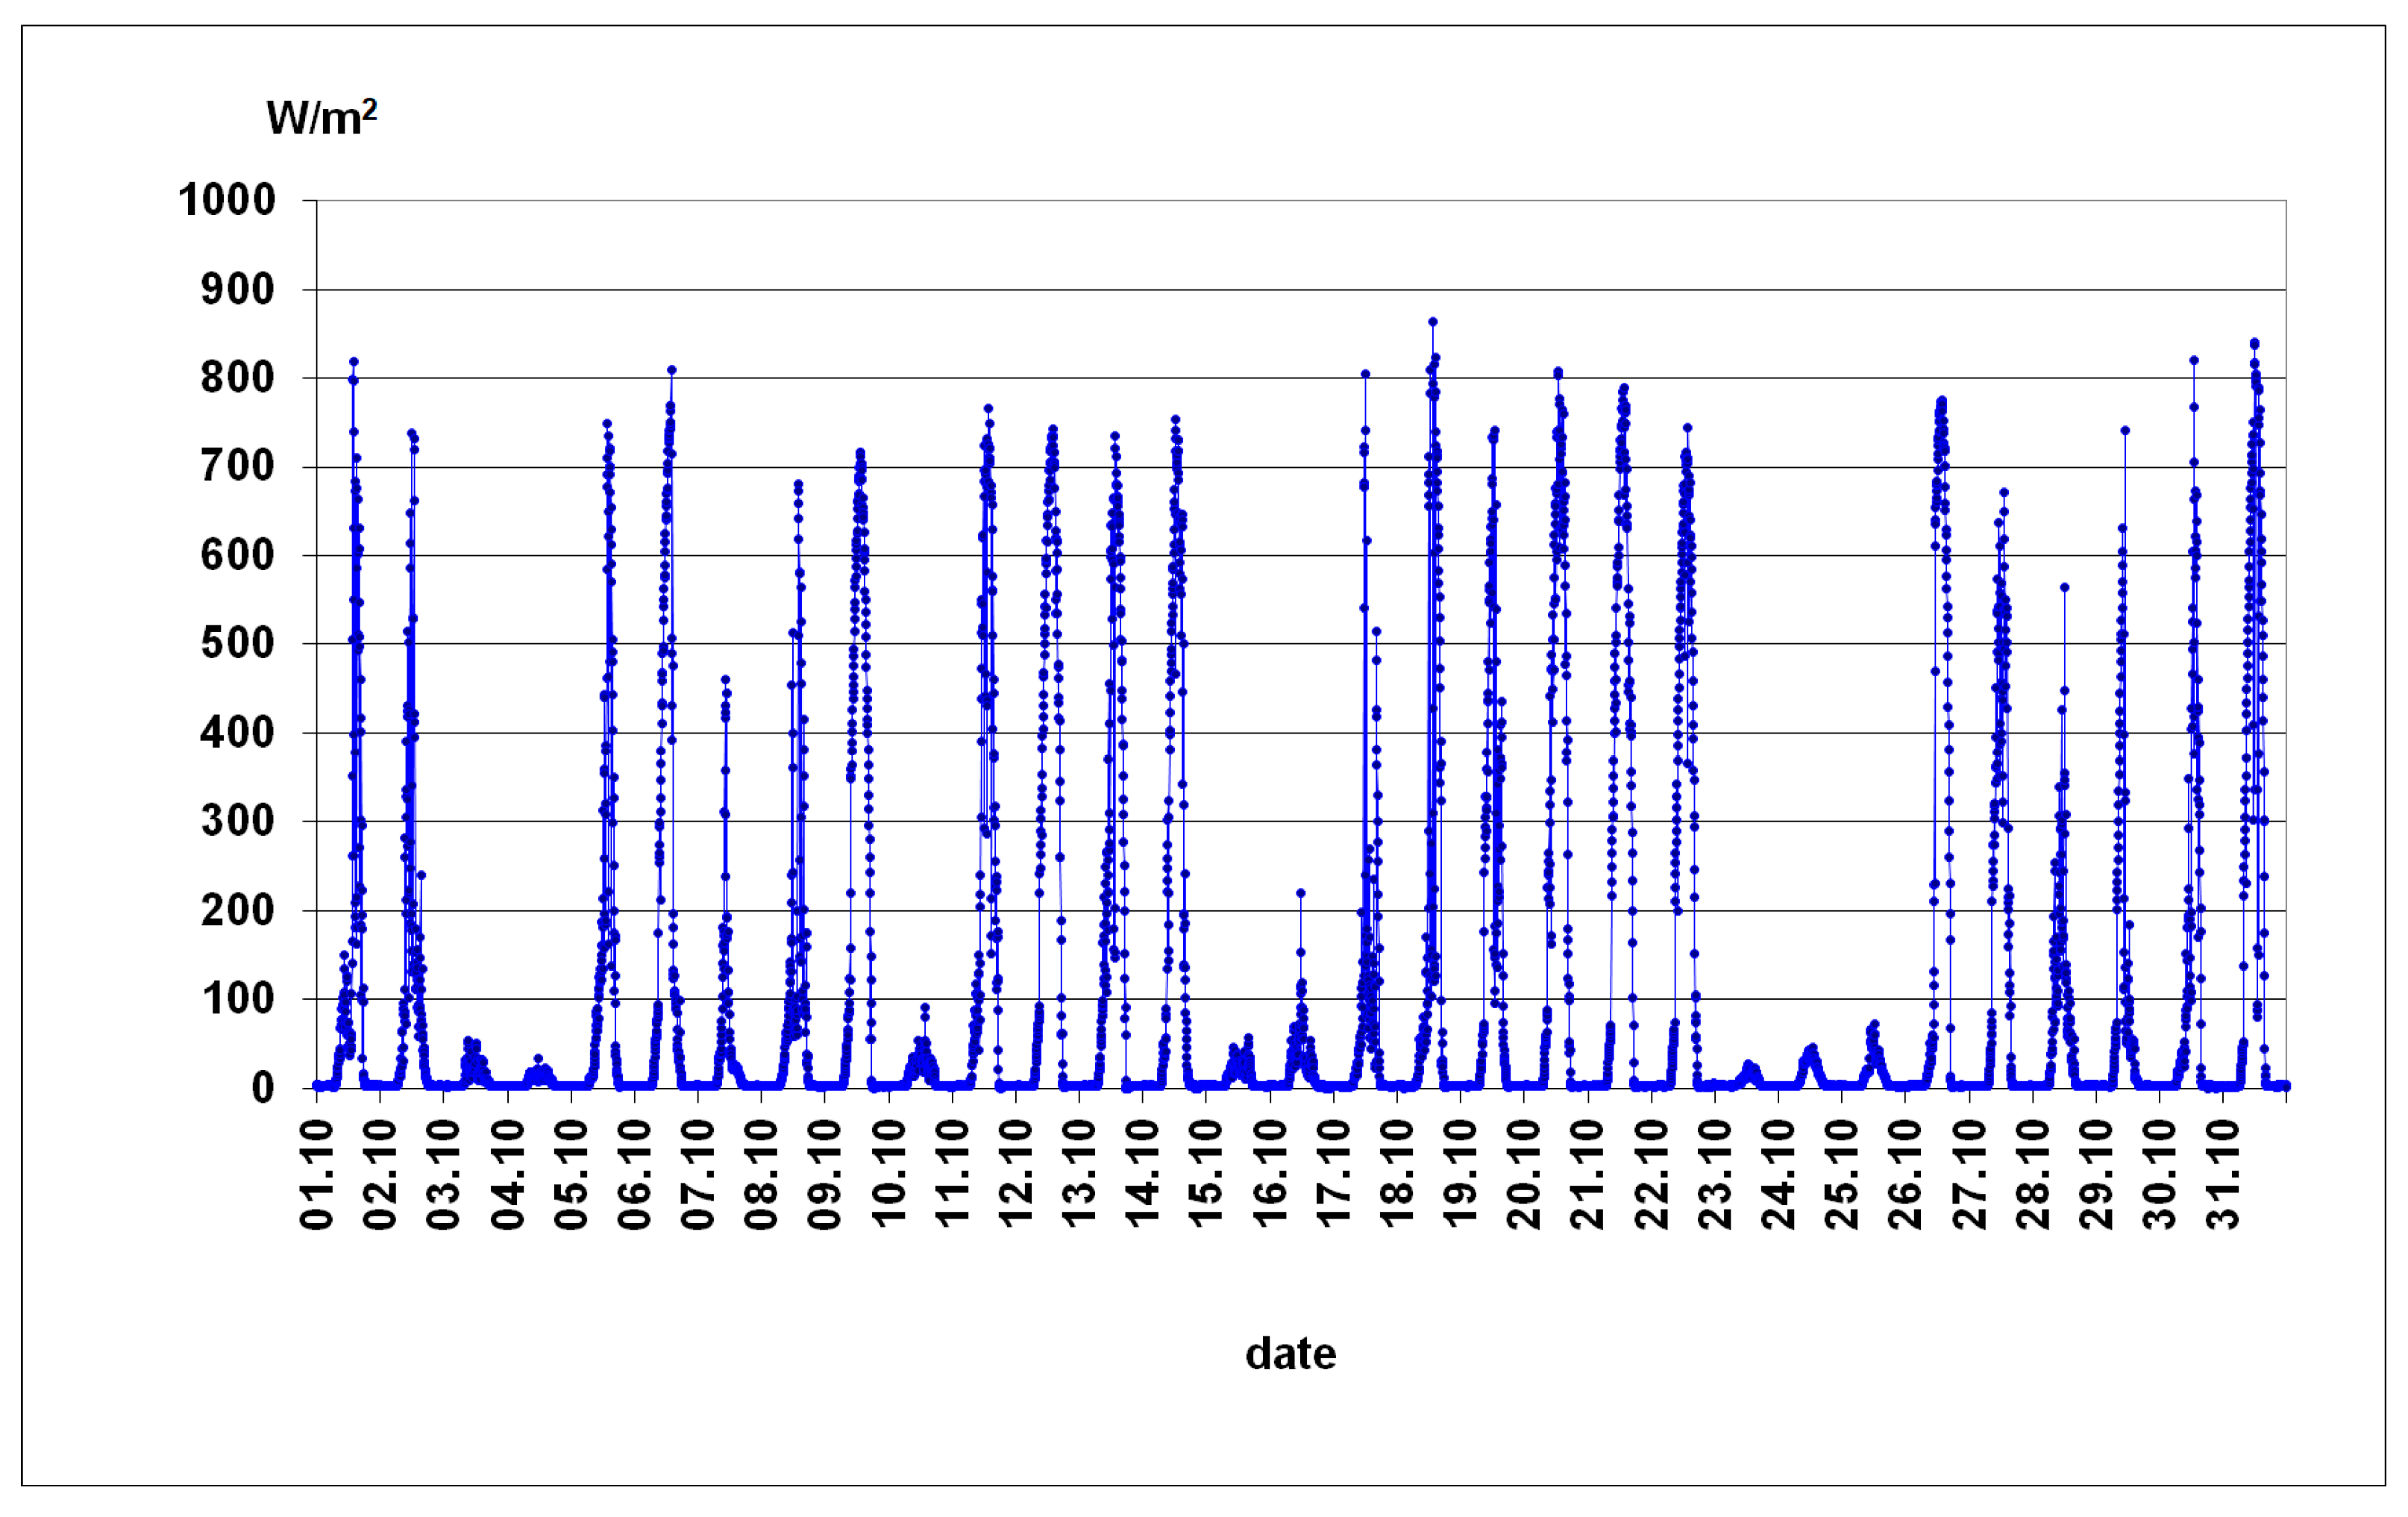
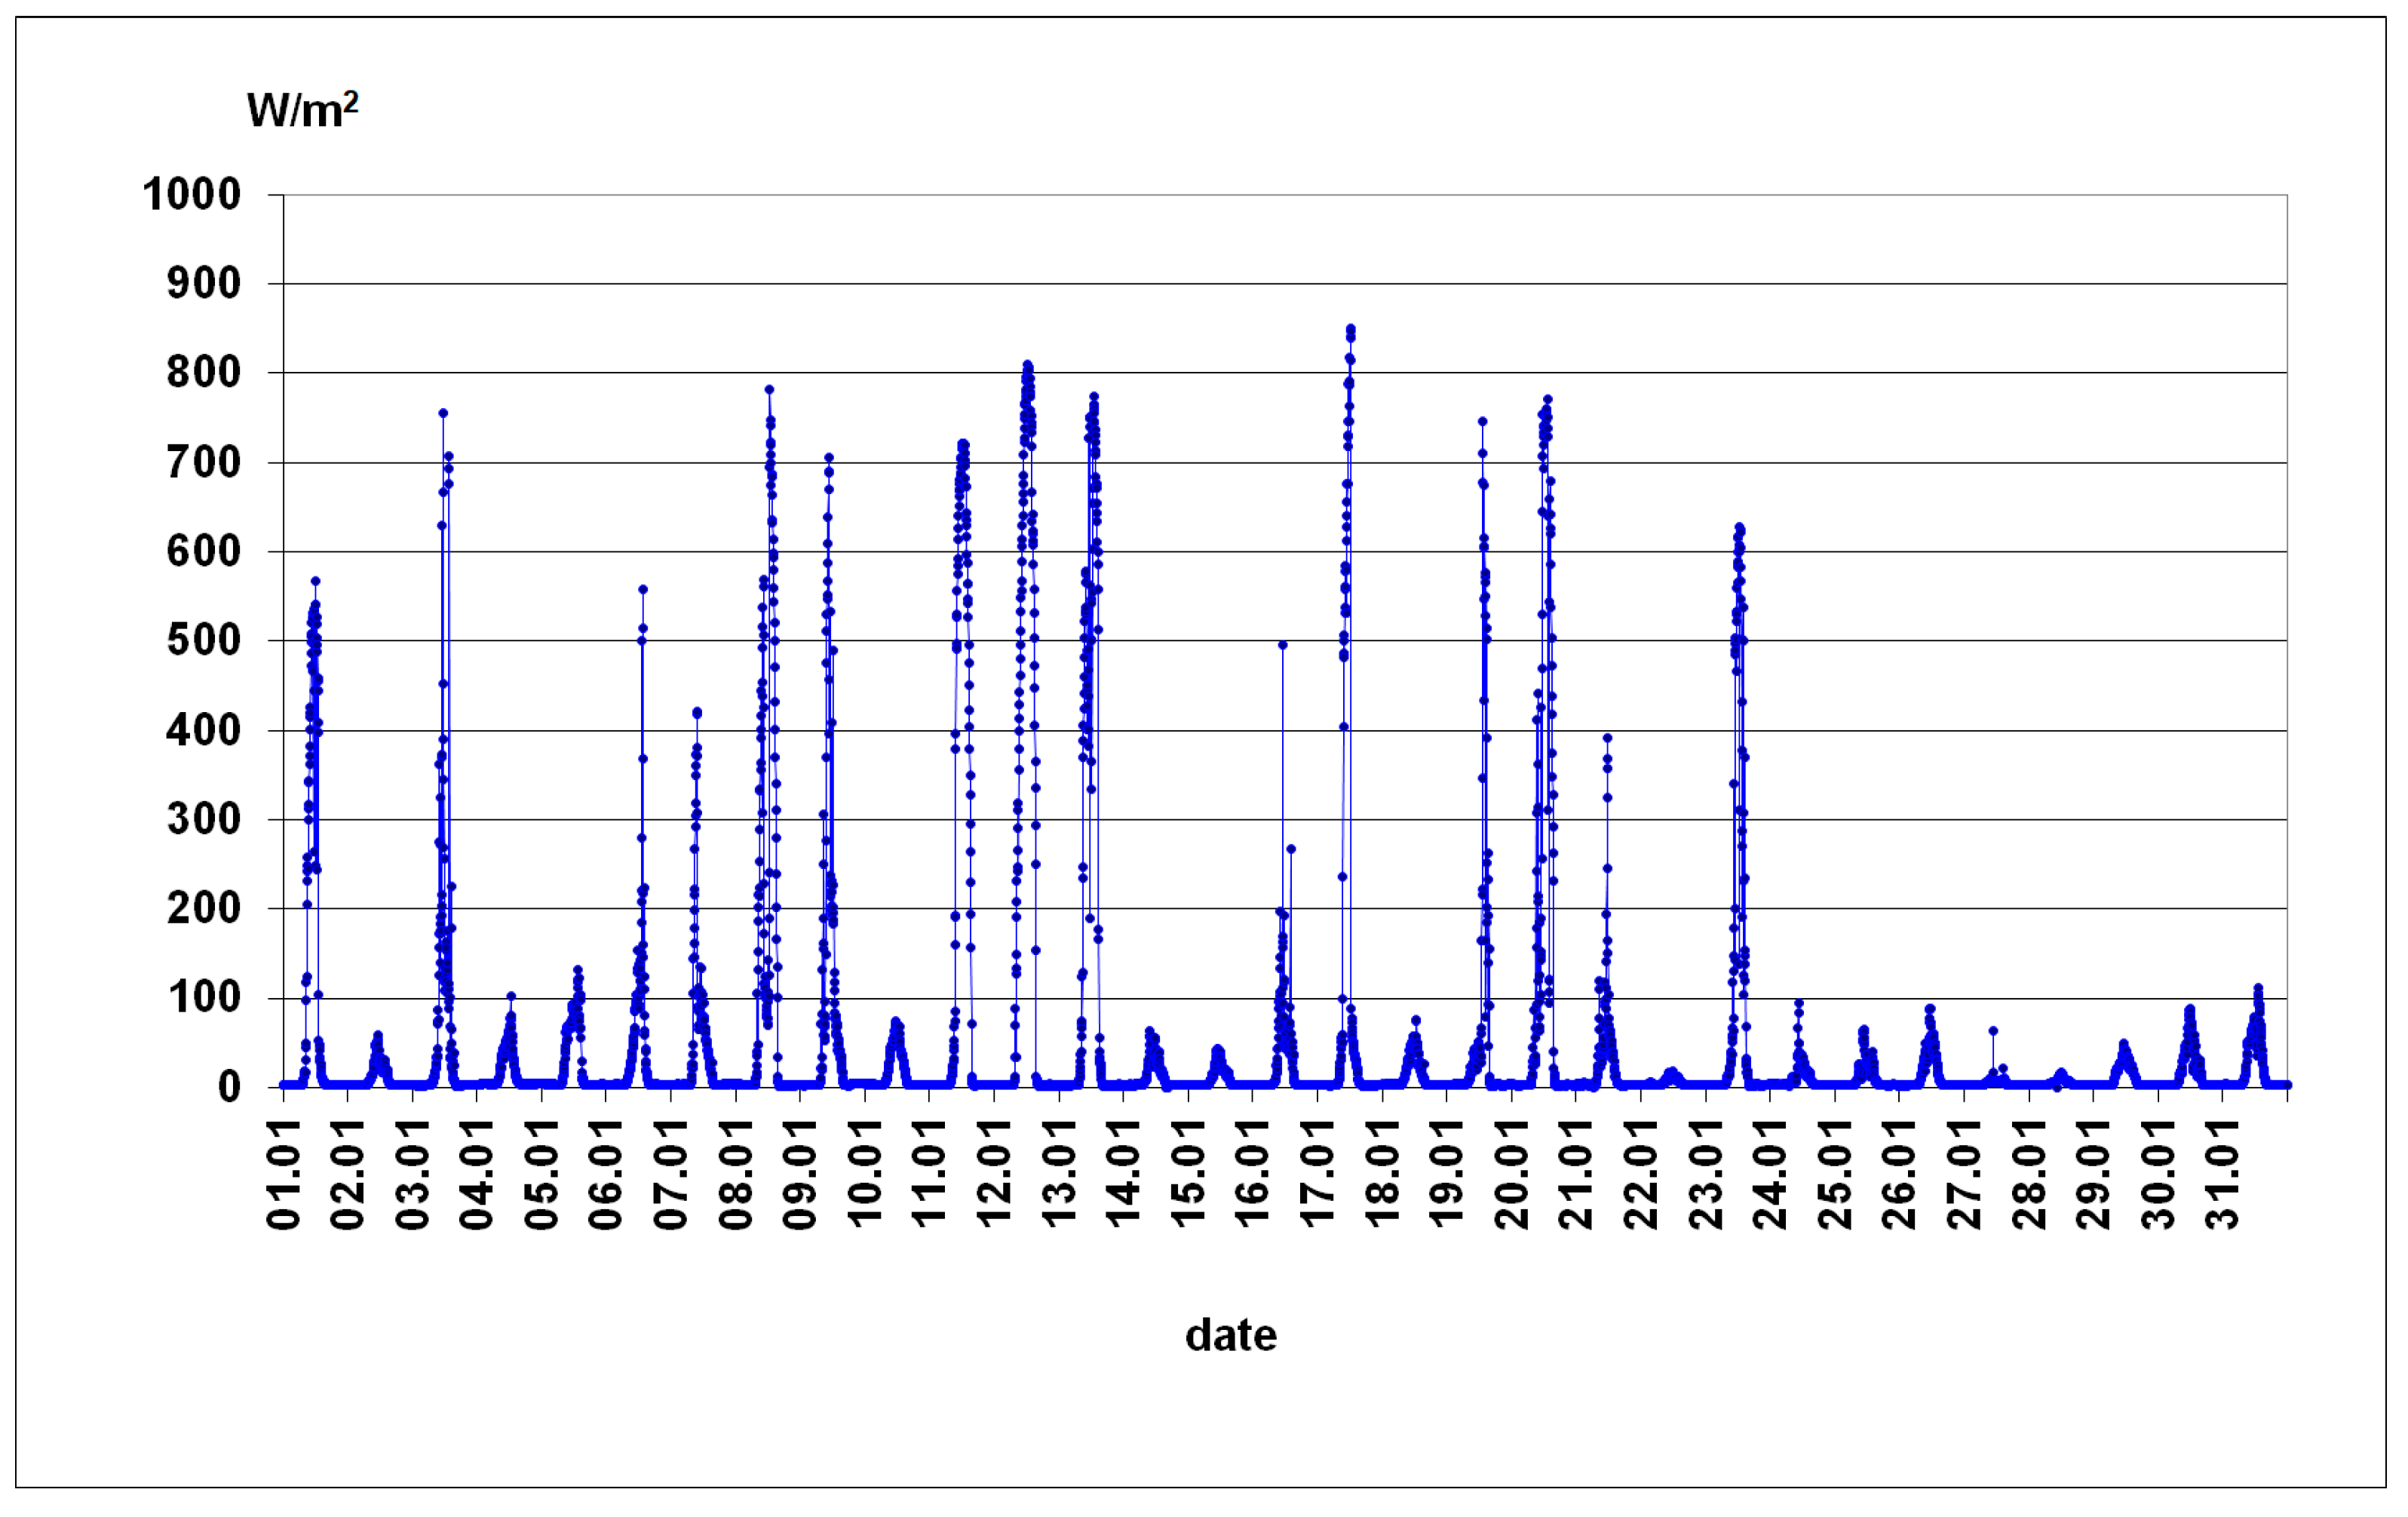
Values of the global solar irradiance incident on the southern vertical plane (W/m2);
-
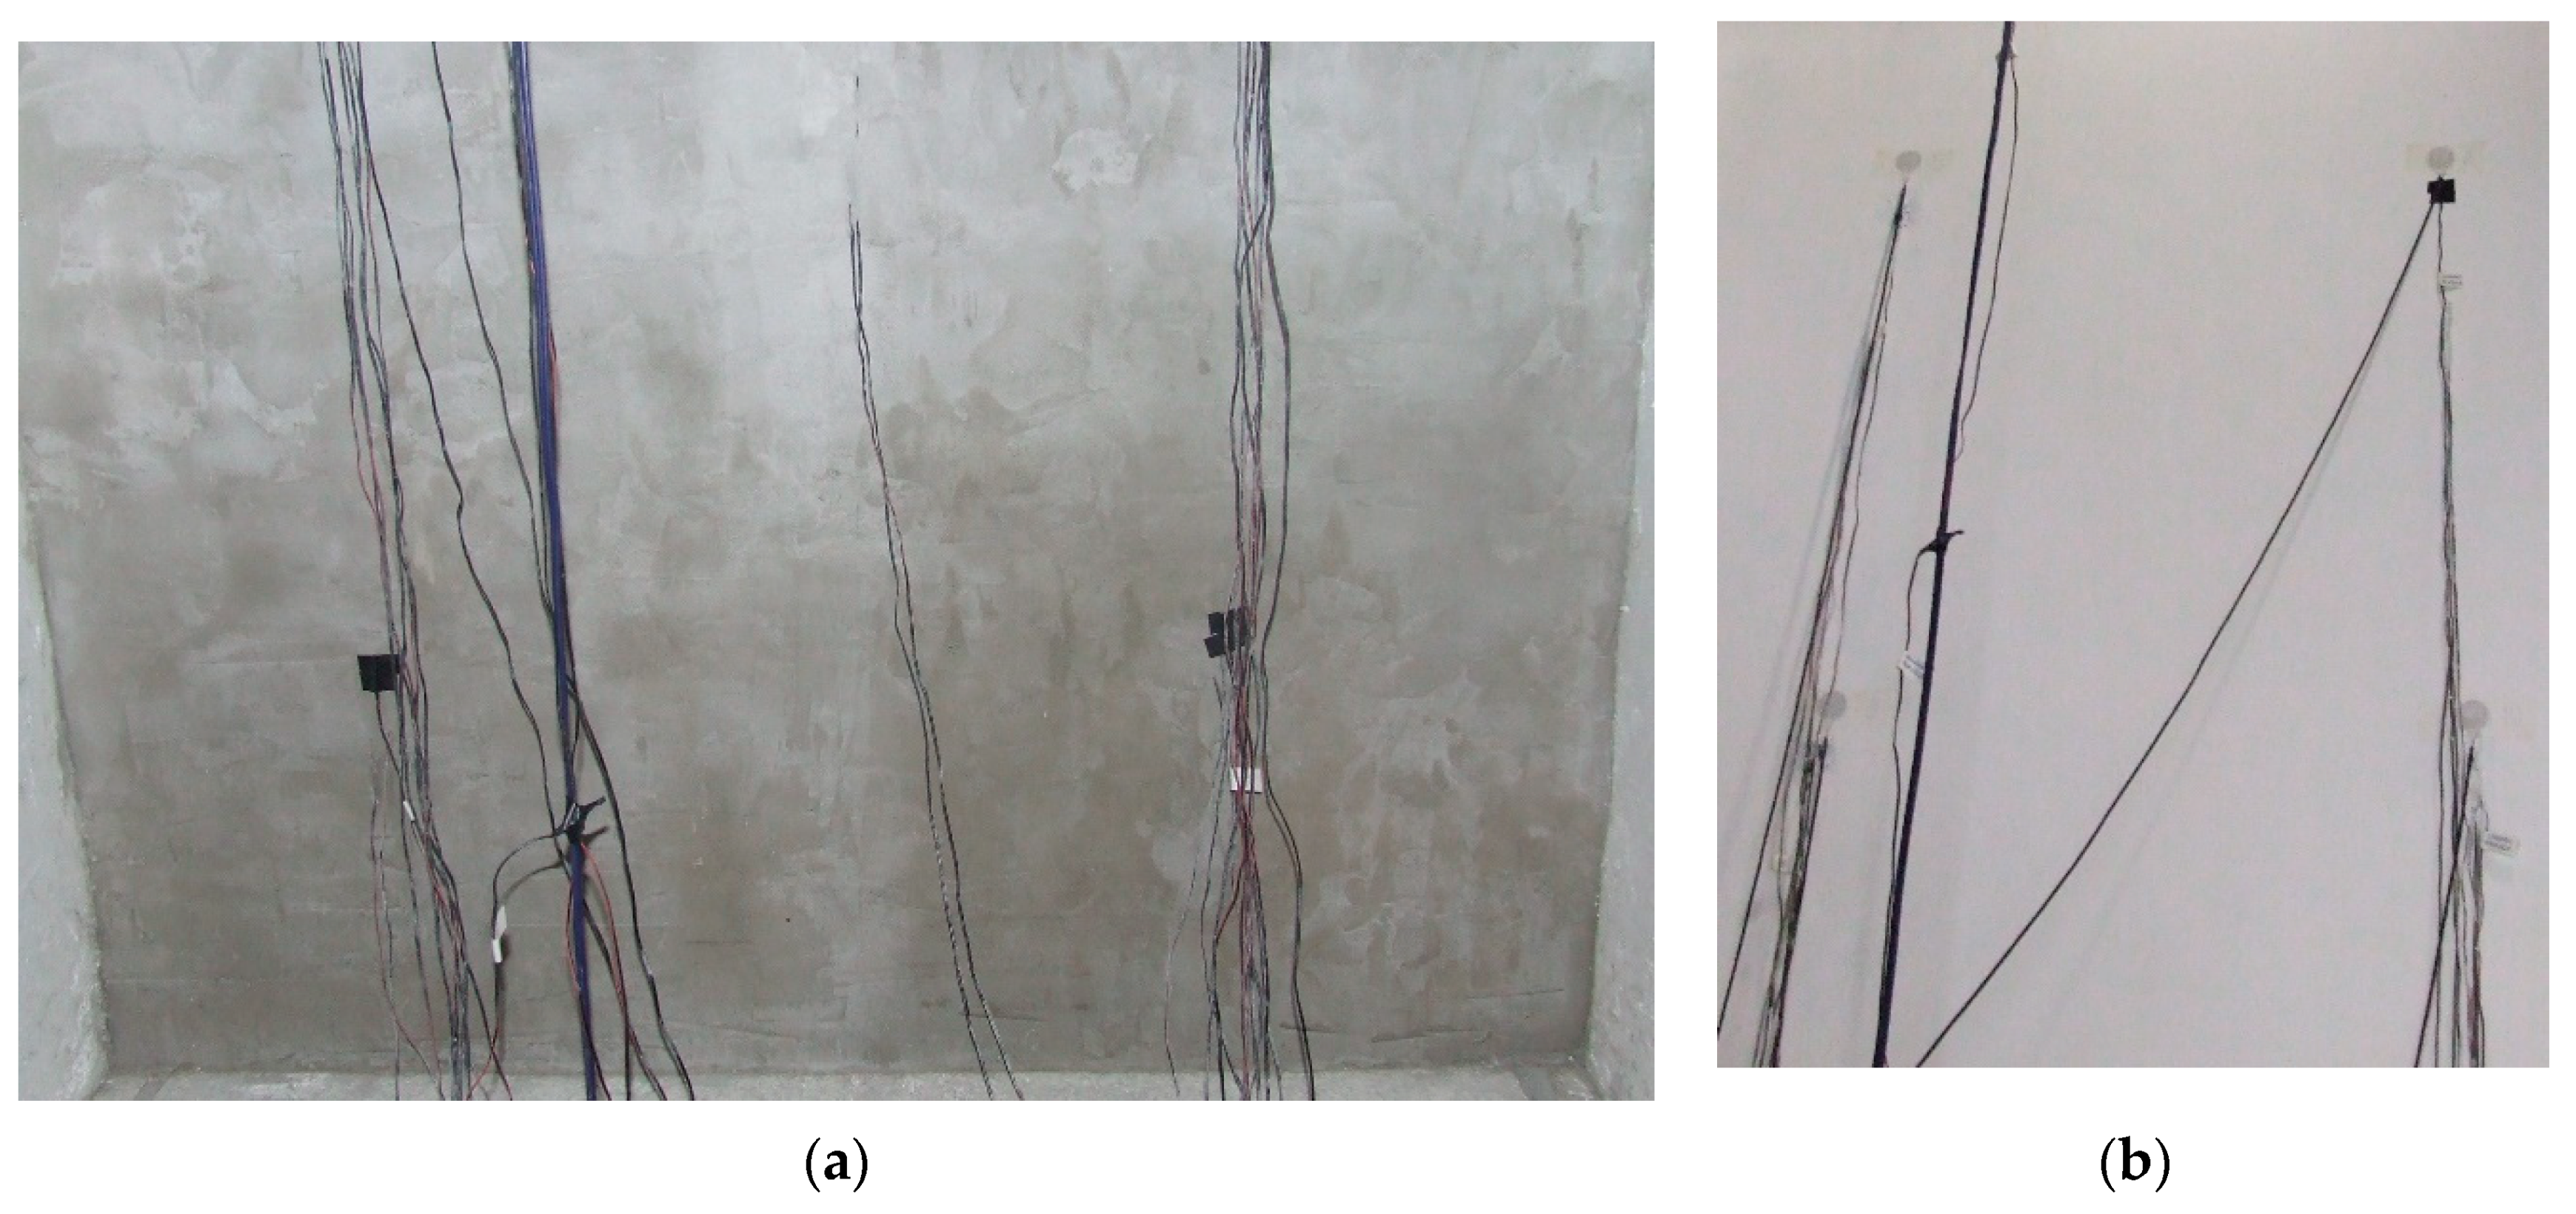
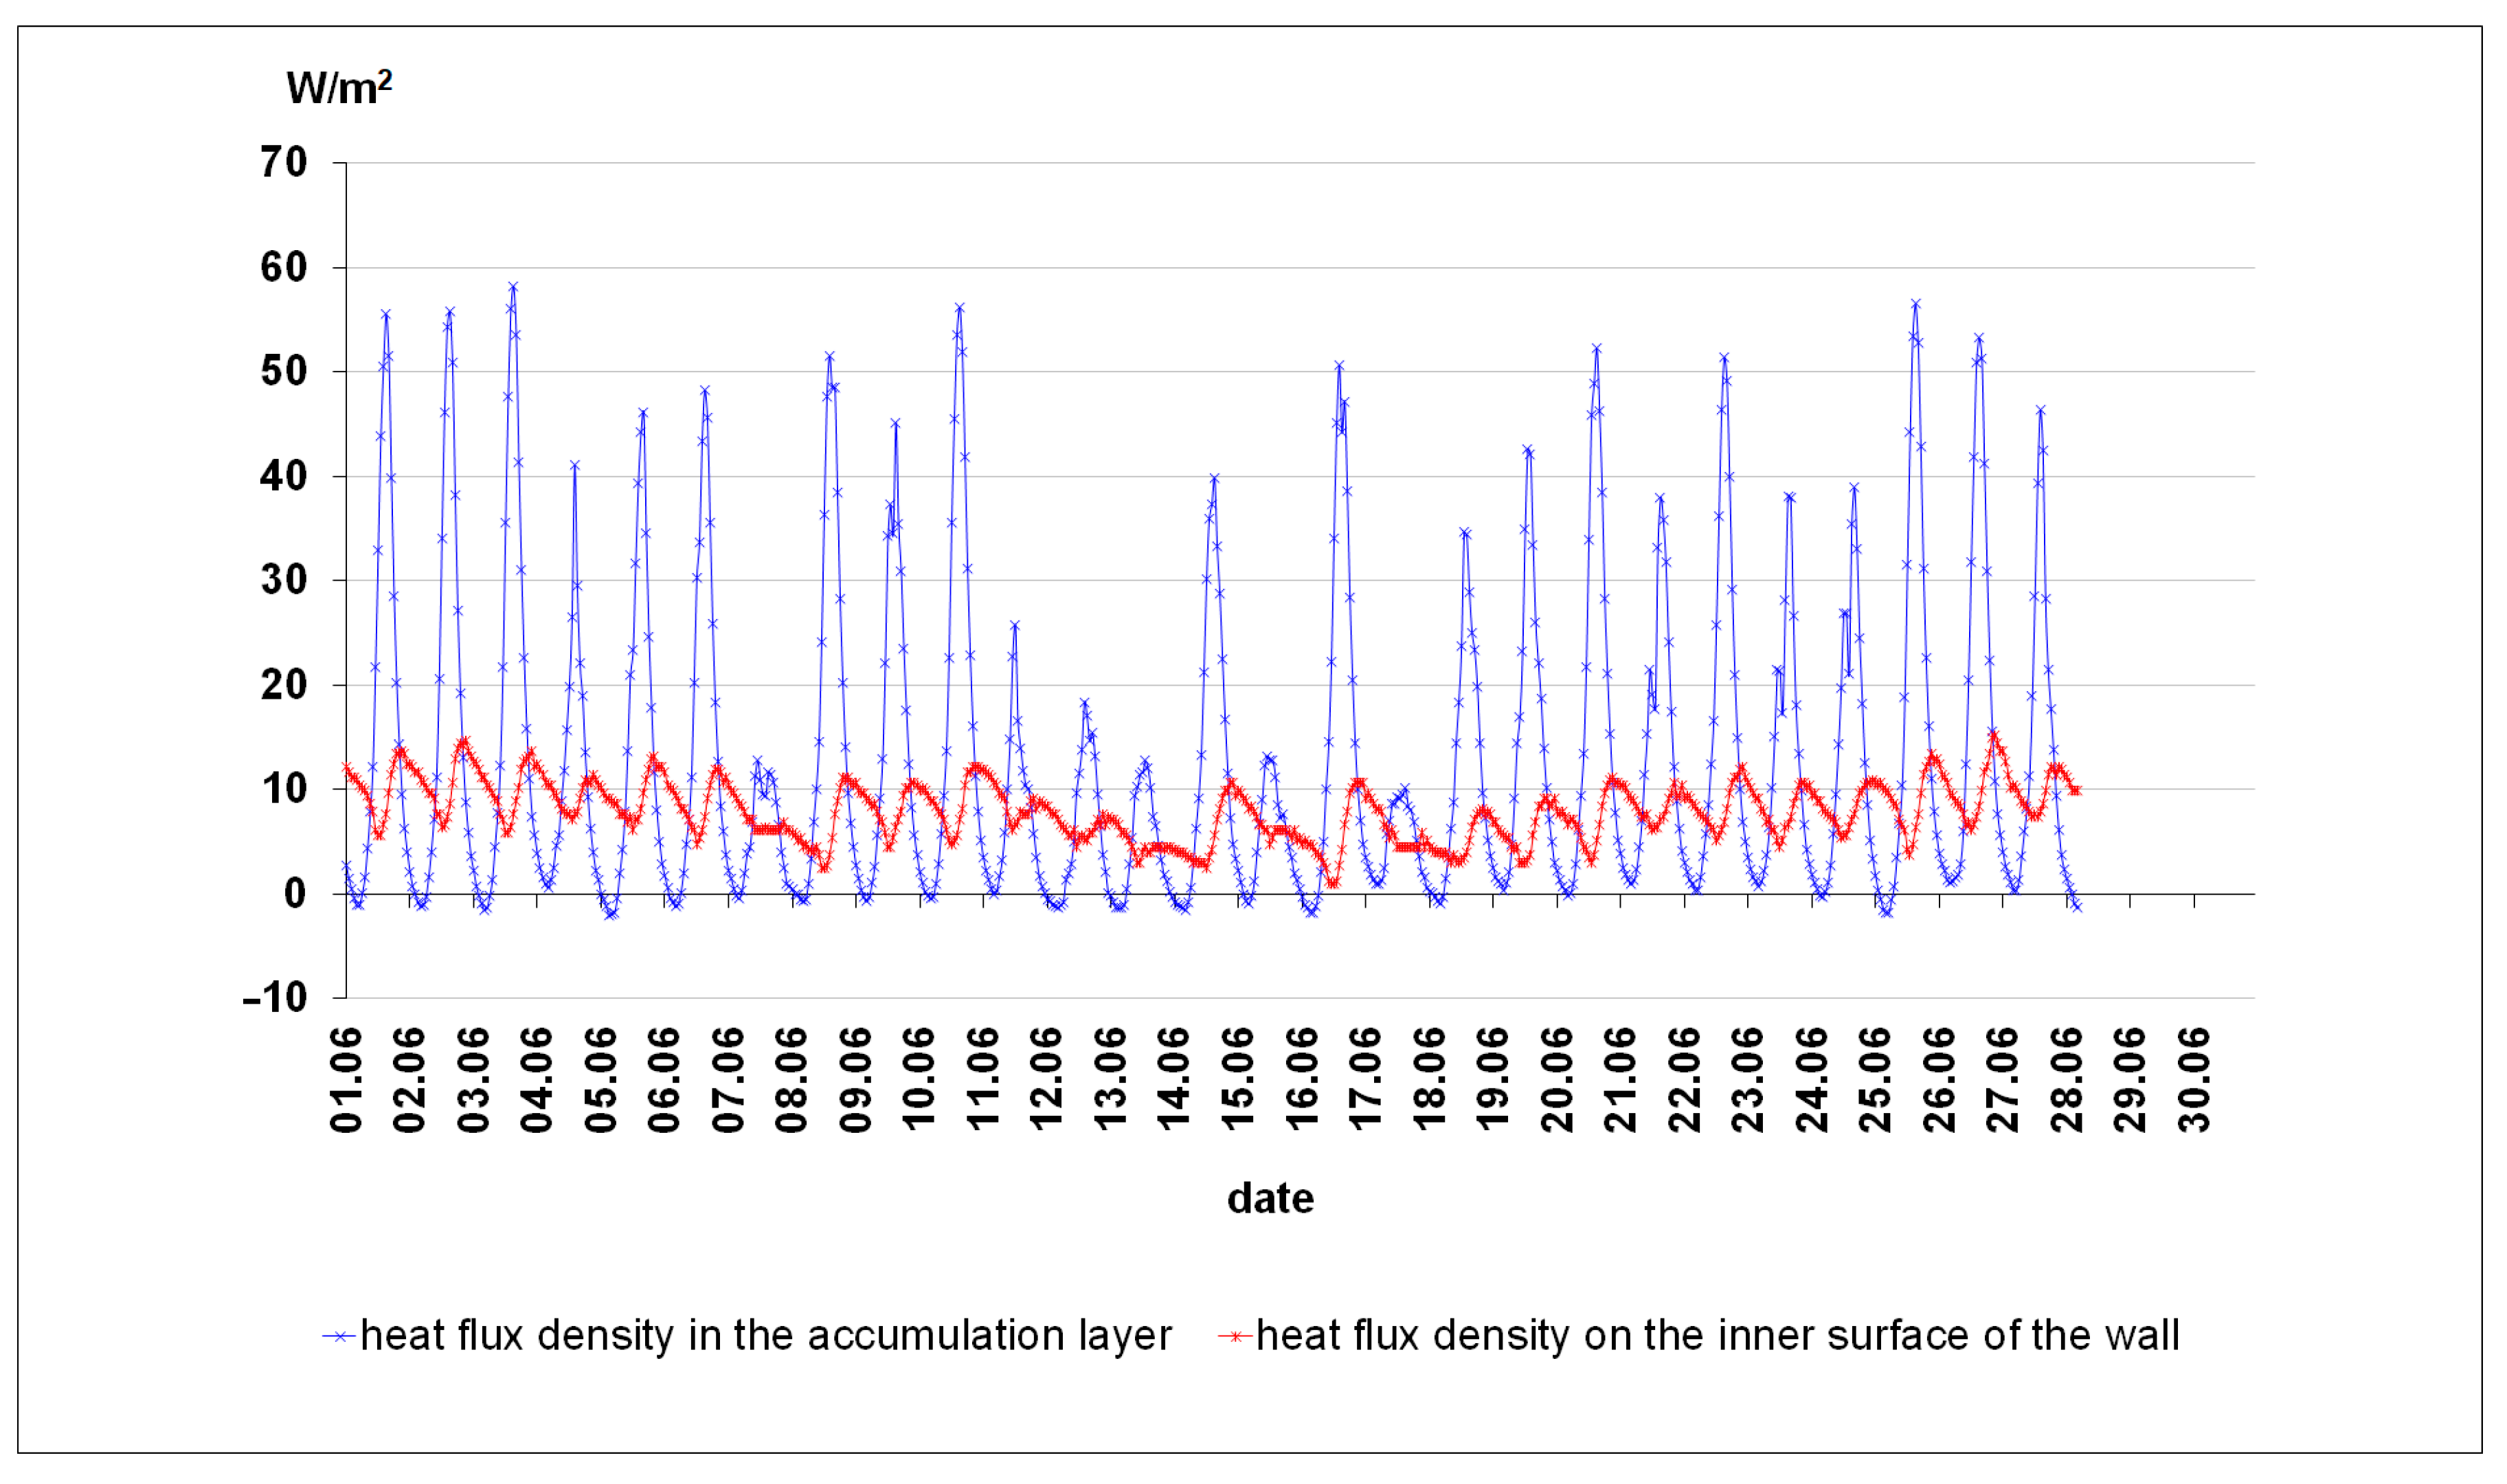
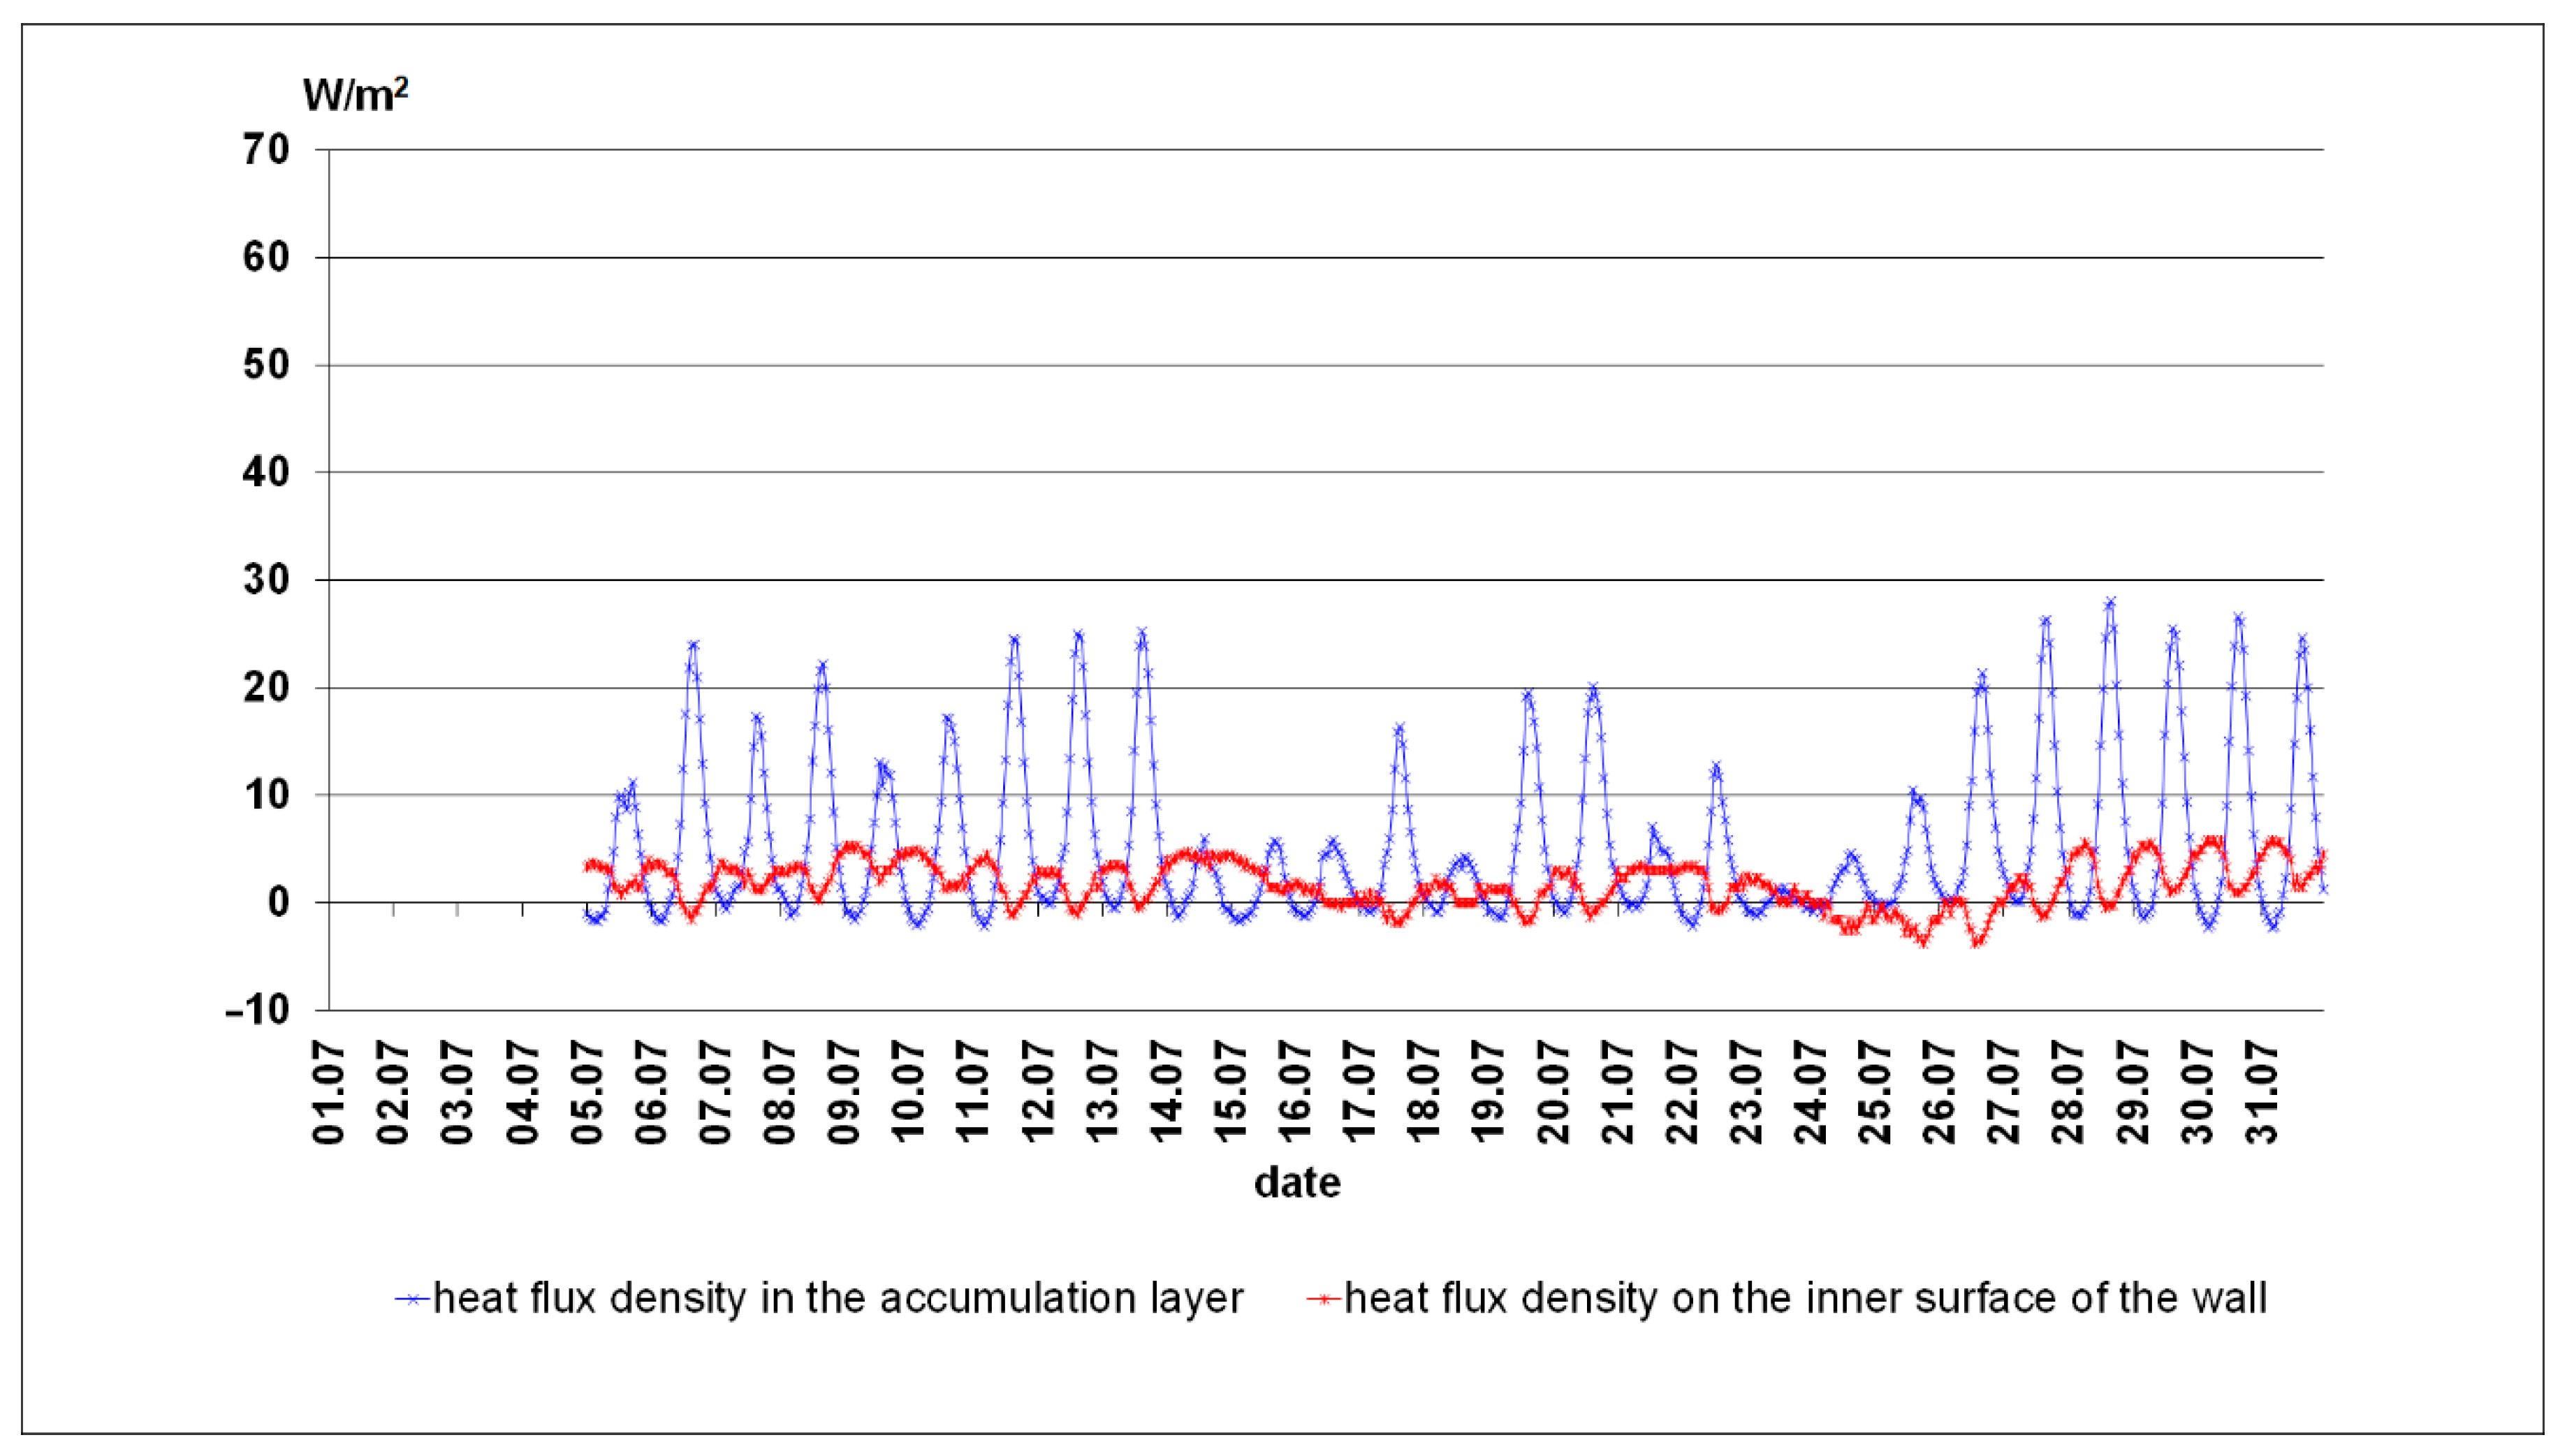
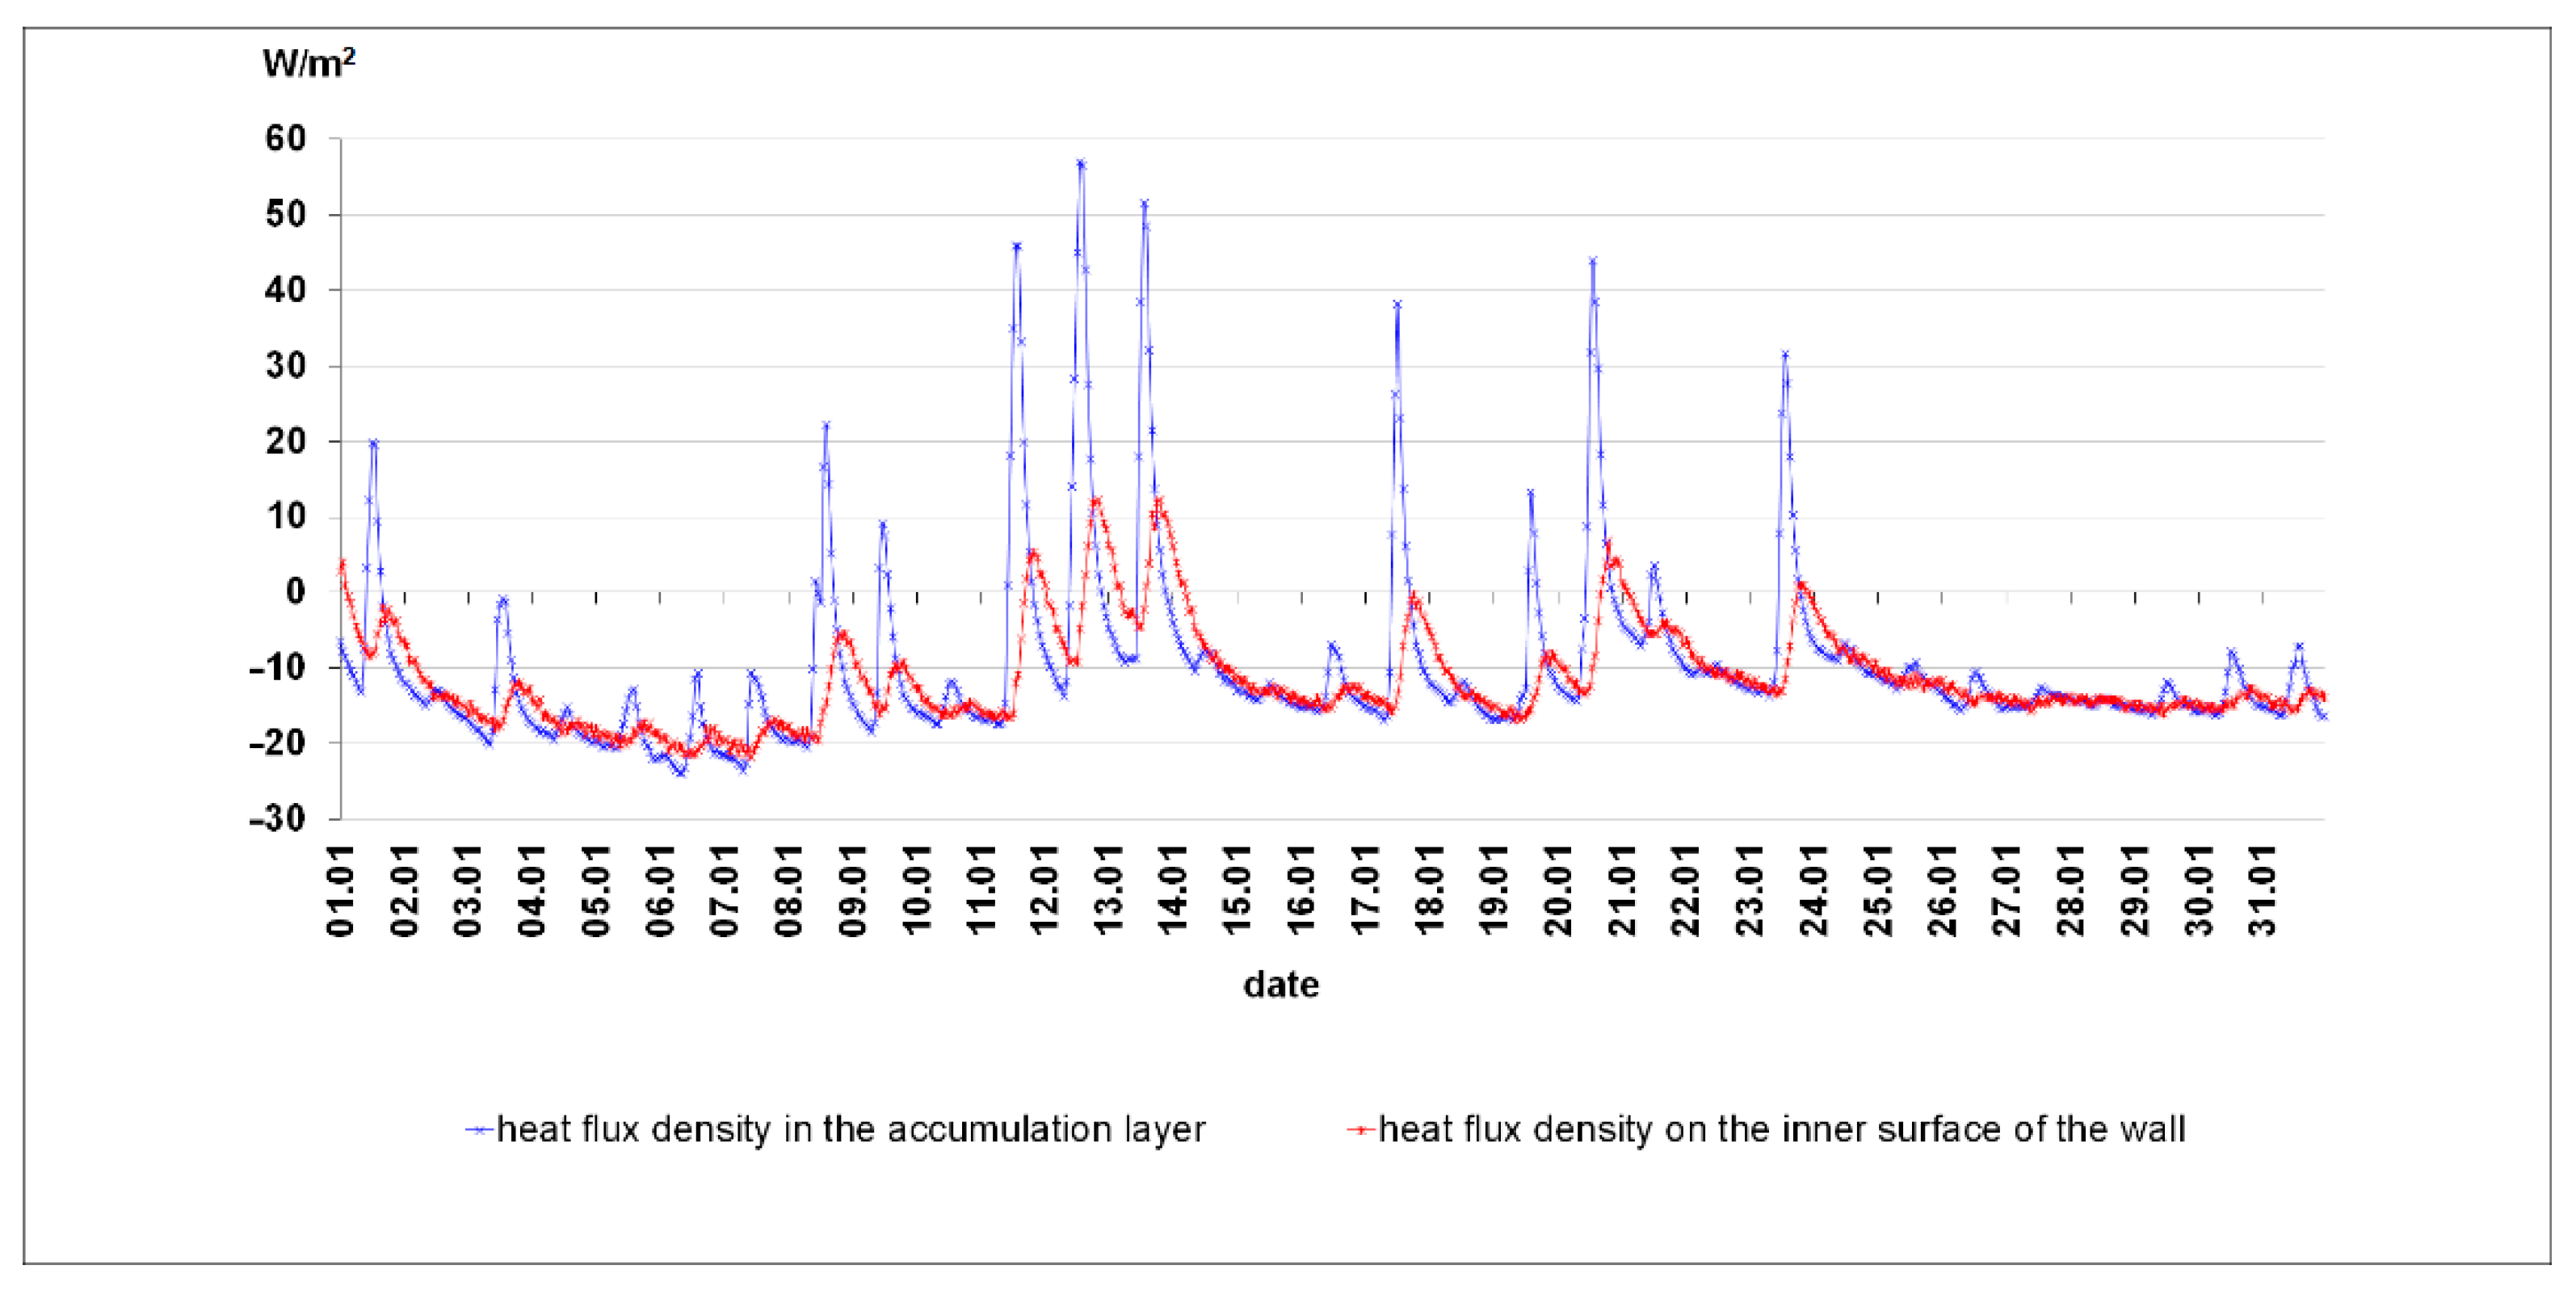
Values of the heat flux density flowing through the wall, measured on the inner surface of the wall (W/m2);
-
Temperature values of: external air, internal air in the chamber, on the surface of the absorber, on the inner surface of the wall and inside the storage layer (°C).
The following research equipment was used to record the test readings:
  • Pyranometer (Figure 7a): measurement range—(0 to 2000 W/m2), operating temperature range—(−40 to +80 °C), measurement accuracy—(0.1 W/m2);
  • Recorder saving measurement data from the pyranometer (Figure 7b).
  • Multi-channel recorders (Figure 8a) for recording data from the heat flux density sensors;
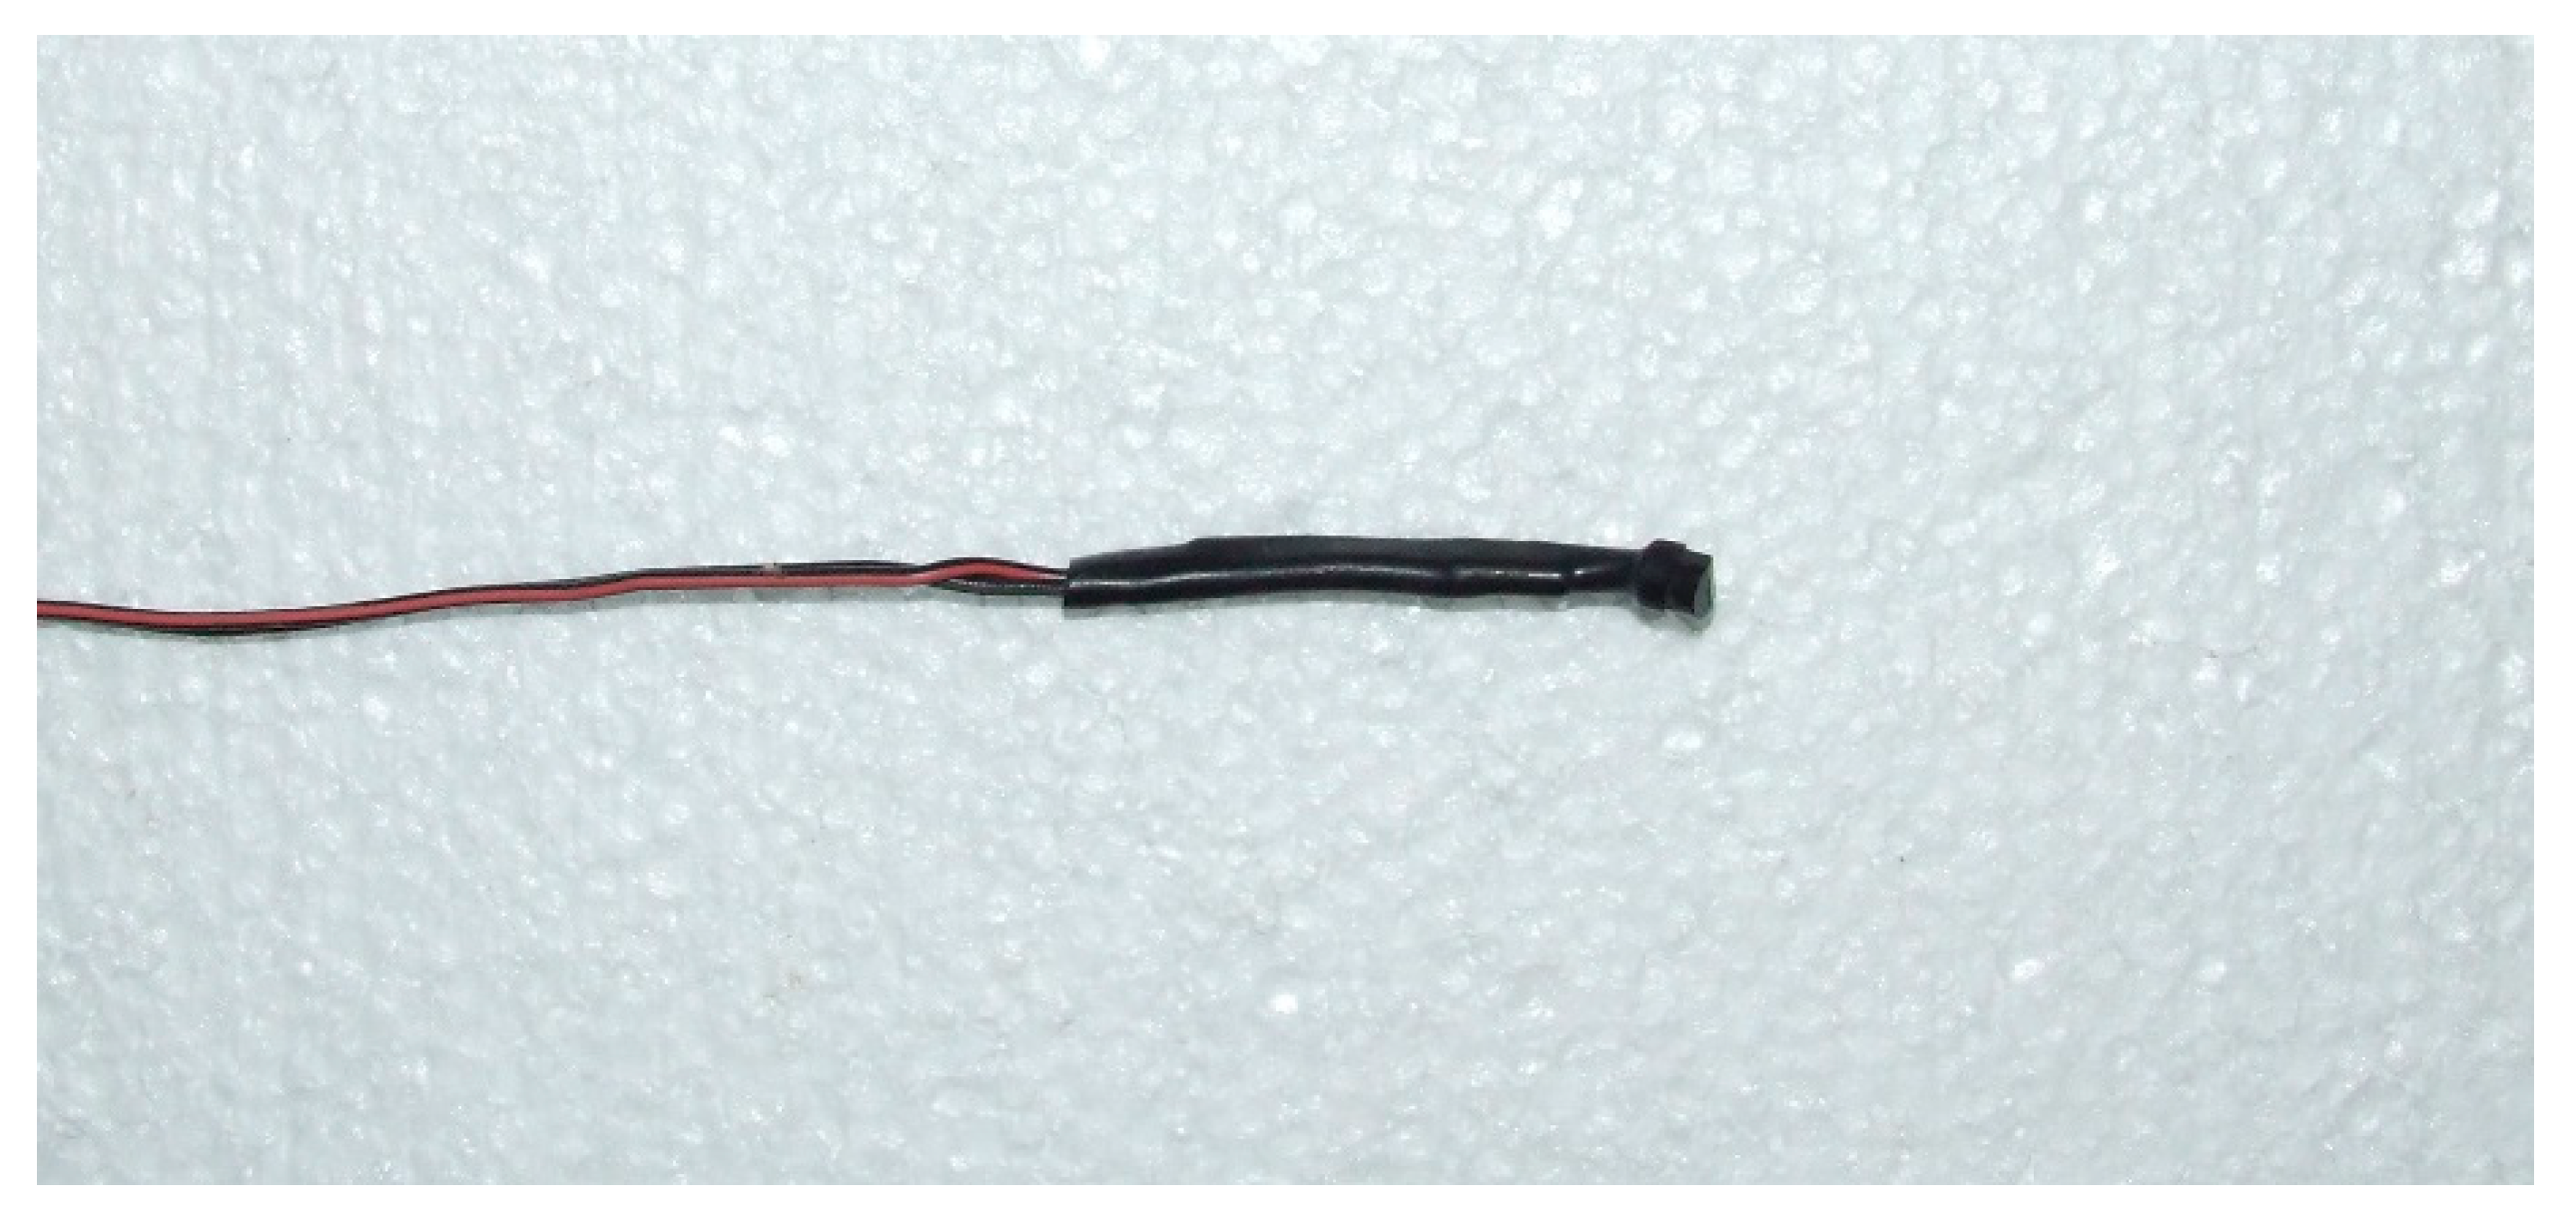
  • Probes for measuring the heat flux density (Figure 8b,c)—diameter 33 mm, measurement accuracy 6%;
  • Temperature measurement sensor (Figure 9)—measuring range (−55 °C to + 125 °C), measuring accuracy 0.5 °C;
  • Computer set recording data from temperature sensors.

2.4. Frequency of Data Recording from Experimental Tests

During the tests, data recording was adopted for short periods of time, which allowed for the precise determination of the working conditions of the wall. The global solar irradiance was recorded continuously, while the frequency of recording the readings was assumed to be 1 per 5 min. The results were saved in the recorder memory and exported to text files, in which the following were specified for each reading: date, time and global solar irradiance value, given in W/m2. The heat flux density on the inner surface of the wall was measured in each of six fields (3 sectors vertically, two fields horizontally in each sector). Continuous measurement was recorded with a frequency of 1 per minute. The results were saved in the recorder’s internal memory and exported to a computer in the format of text files, in which each reading contained: sensor number, date, time and heat flux density value, specified in W/m2. During the tests, the following temperatures were measured: external air, internal air in the climatic chamber (at the level of each of the three segments), on the surface of the absorber (6 fields), on the inner surface of the wall (6 fields) and inside the storage layer (12 fields). The recording was carried out continuously, the recording frequency was about 1 per second. Readings from each sensor were recorded in a separate file. Each of the files contained data from the period of 1 day. All of the files were archived in directories by date.

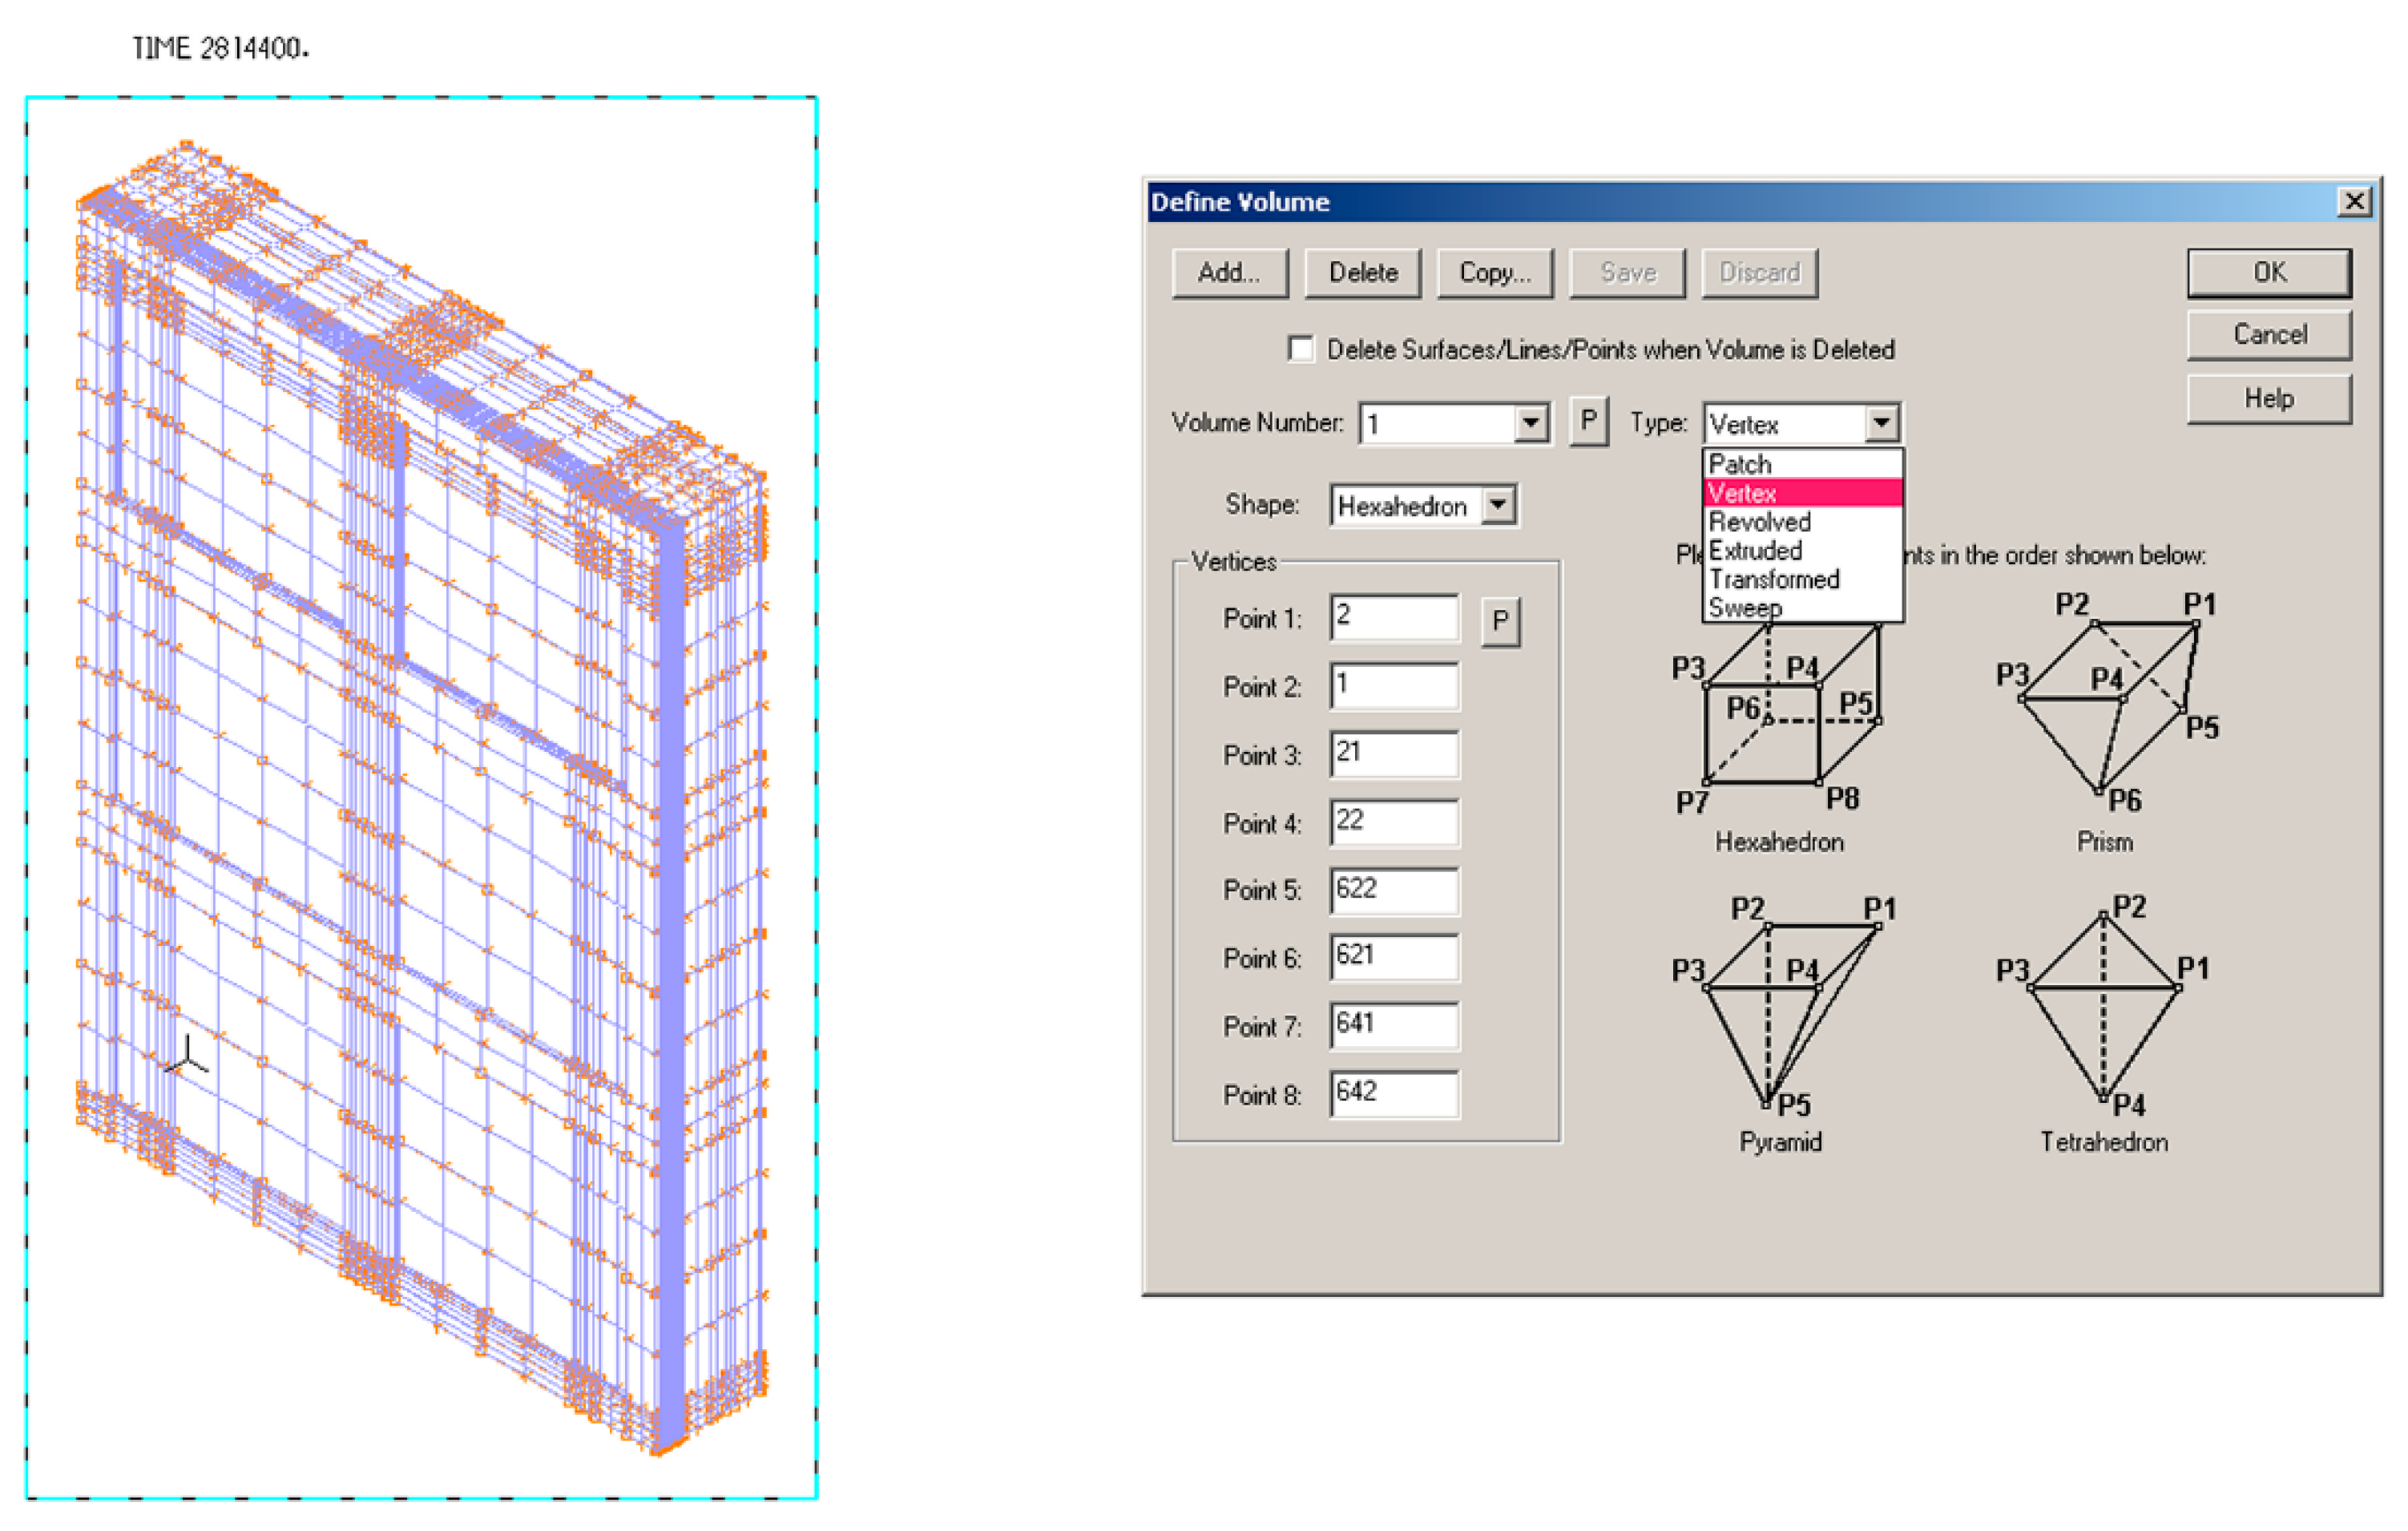
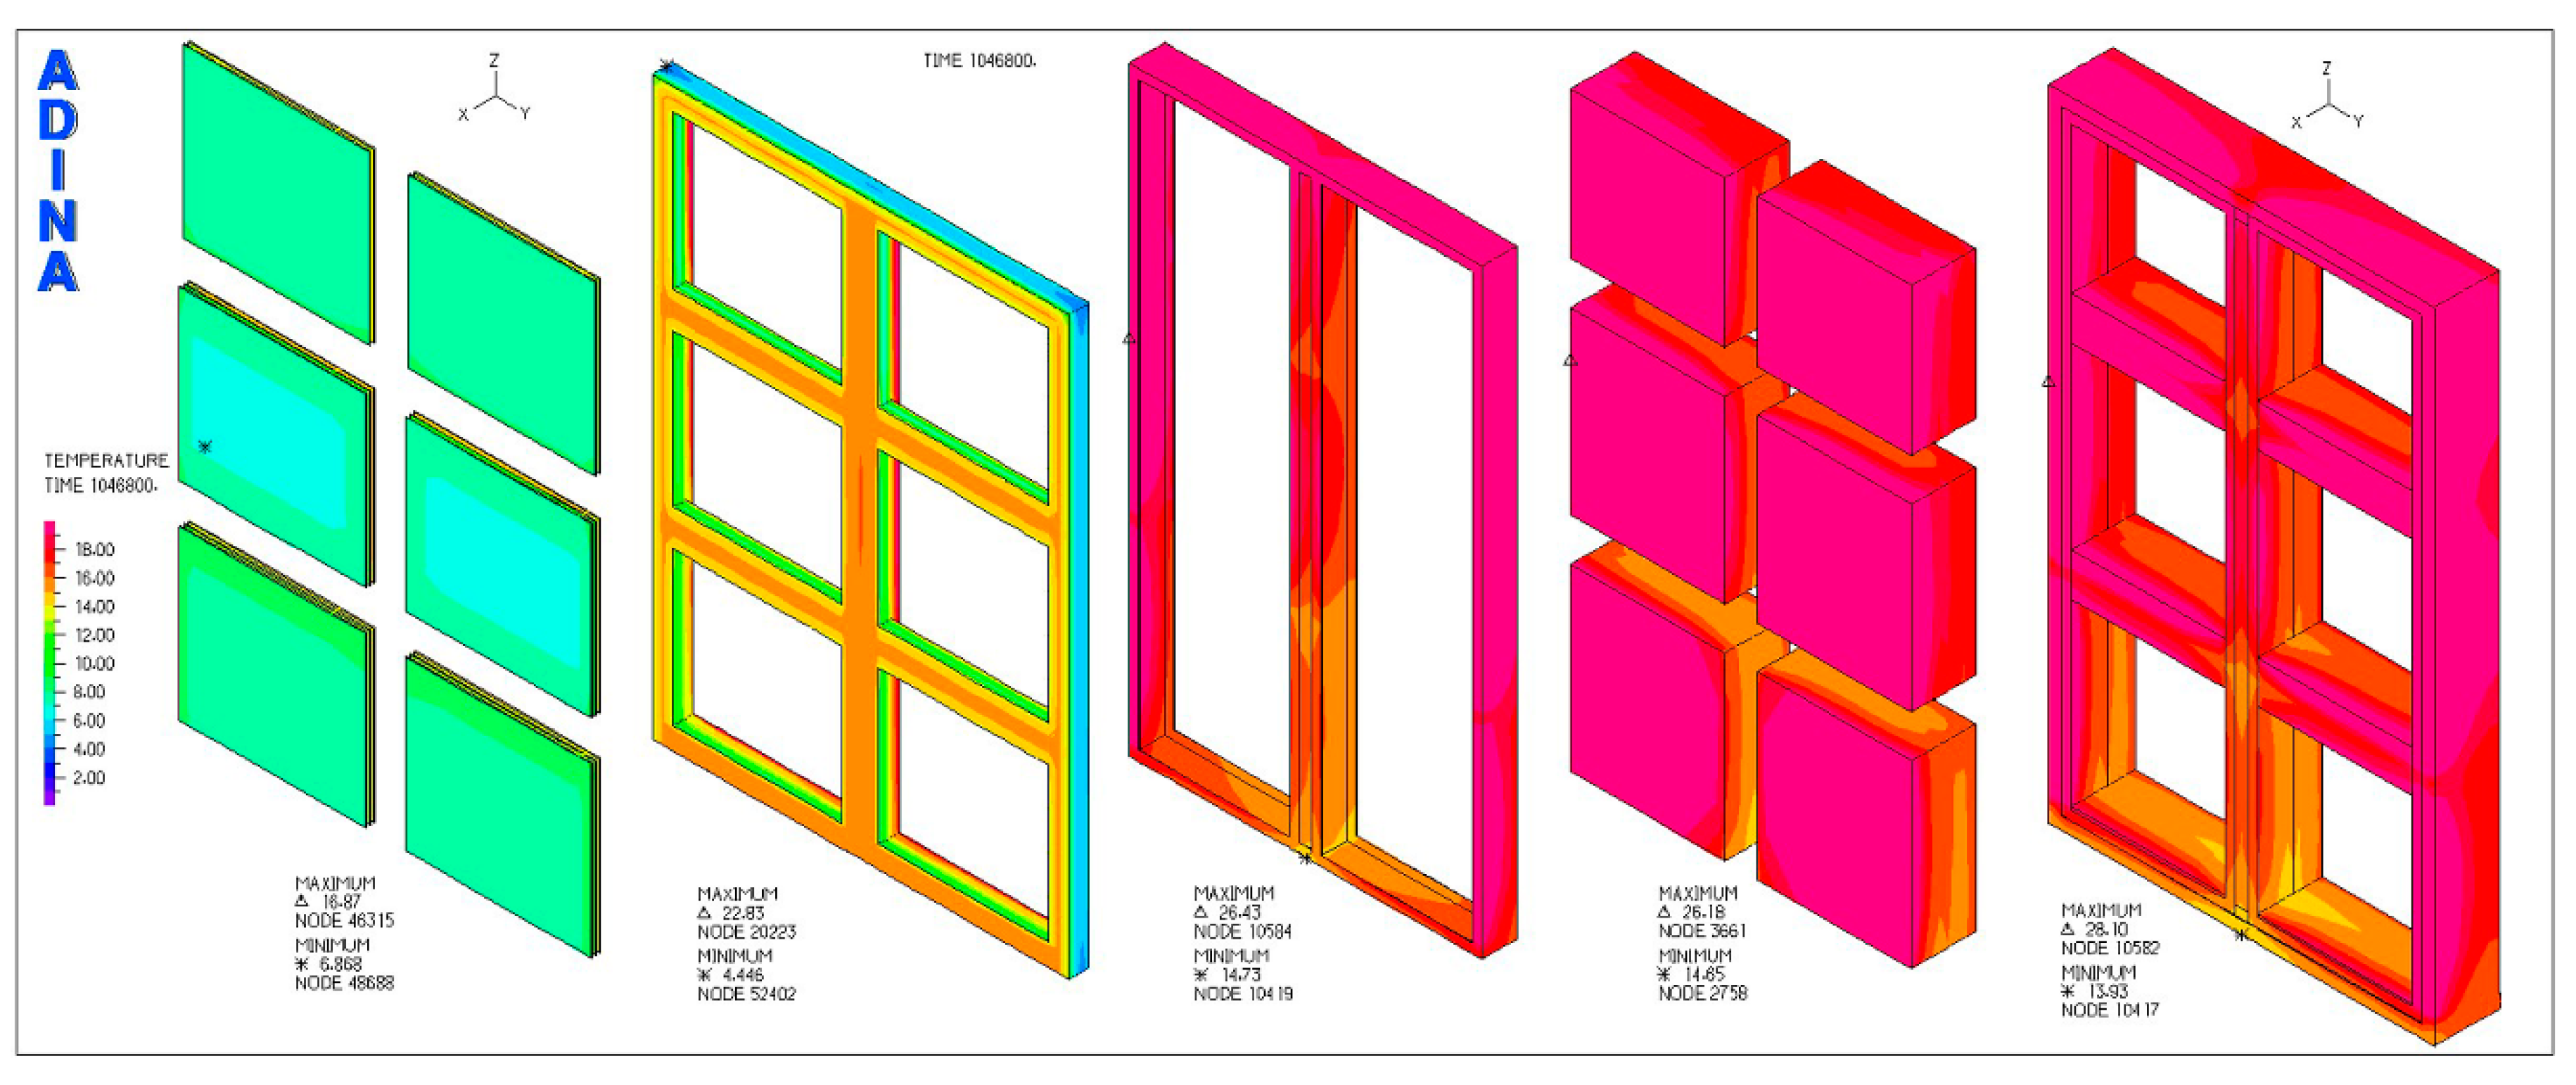
2.5. Numerical Simulations

Numerical simulations for the wall in question were performed using the finite element method (FEM). A three-dimensional model of a skeletal collector-storage wall was built in the ADINA program (Figure 10). ADINA is a multifunctional tool that allows you to perform both structure calculations (Structures Module) and thermal calculations (Thermal and Computer Fluid Dynamics (CFD) Modules) [47,48,49,50]. Thermal and CFD modules allow determination of the value of heat flux in an element or the whole barrier [32]. ADINA uses the finite element method in the computational process. We can choose from both static or dynamic analysis. The presented analysis uses the CFD module, used for dynamic analysis with the use of the fluids flow function. The dynamic analysis was used due to the non-stationary nature of the loads. Model geometry can be created in two or three-dimensional space. A three-dimensional model was used in the analysis.
The entire structure of the wall was divided into layers, the dimensions of which correspond to the actual dimensions of the wall components. In this way, 30 layers were separated along the width of the element, 19 layers in the vertical direction and 19 compartments in the direction of the wall thickness. Such an extensive model required proper preparation so that, in the process of programming the input file, there were no errors related to incorrect numbering of nodes, areas and volumes. Therefore, the geometry data was prepared in an Excel spreadsheet. Then they were saved along with the appropriate commands in the format of a text file with the extension “in”. This file was imported into ADINA. After the geometry of the model is created, the components are divided into smaller ones, connected by common nodes. Then, the characteristics of the materials used should be defined. Depending on the module used, specific material properties should be specified. The parameters of the constituent materials were assumed in accordance with the data given in Table 1. Then, the boundary conditions and the model loads were defined. In the case of heat transfer, ADINA uses Fourier’s law of conduction:
q = k θ x
where: q—heat flux (heat flow conducted per unit area), W/m2;
θ—temperature, K;
k—thermal conductivity (material property), W/m·K.
In the case of a three-dimensional body in the Cartesian system, the equation takes the form:
x ( k x θ x ) + y ( k y θ y ) + z ( k z θ z ) = q B
where: qB—is the rate of heat generated per unit volume, W/m2.
The following boundary conditions were defined:
-
convection boundary conditions:
q S = h ( θ e θ S )
where: h—convection coefficient, W/(m2·K);
θe—environmental (external) temperature, K;
θS—body surface temperature, K.
-
radiation boundary conditions:
q S = k ( θ r θ S )
where: θr—temperature of the external radiation source, K, and κ is the coefficient given by
k = h r ( θ r 2 + θ S 2 ) ( θ r + θ S )
where: hr is determined from the Stefan–Boltzmann constant, the emissivity of the radiant and absorbing materials and the geometric view factors.
The value of global solar irradiance incident on the southern vertical plane (the values of which were recorded during actual measurements) was adopted as the basic load for the numerical model. The values of the heat flux load of individual glass surfaces and the absorber were determined on the basis of the absorption, reflection and transmission coefficients provided by the glazing manufacturer. During the construction of the numerical model, the boundary conditions of heat transfer that define the thermal state of the body from the beginning of the heat flux phenomenon were used. The values of the air temperature in the room, obtained during the actual tests in the climatic chamber, were used to build the function of the boundary conditions of the numerical model. Therefore, in the defined model, the Fourier boundary condition was adopted for both the outer and inner sides of the wall. This approach comes closest to determining the actual thermal working conditions of the wall, resulting from its intended use. On the one hand, there is a requirement to provide thermal comfort inside the room (i.e., to maintain a stable temperature of internal air at about 20 °C); on the other hand, the external air temperature resulting from climatic conditions is determined. The Cauchy initial condition determines the thermal state of the test building at the initial moment (t = 0). As the starting point for the numerical analysis of the model, 00:00 on December 23 was selected. The decisive factor in the selection was the low value of global solar irradiance incident on the vertical plane in the period preceding the analysis, which allowed the model to assume the temperature distribution in the partition at the initial moment, corresponding to the stationary flow resulting from the difference between the external and internal air temperatures. After creating a complete mathematical model, calculations were performed. The aim of the numerical simulations was to compare the agreement of the results obtained with the numerical method with the results of real tests.

3. Results and Discussion

3.1. The Results of Empirical Research from the Summer Period

The aim of the research carried out in the summer period was to determine the influence of the thermal insulation roller shutters on the thermal work of the wall. The research in the summer months was divided into two stages. In the first part, during April, May and June, the shutters were in the upper position throughout the day, i.e., the impact of the shutters on the thermal work of the wall was not taken into account. In the second stage of the research, from July to September, the shield was lowered during sunrise and lifted up during sunset. The time of sunrise and sunset was determined for the location of Rzeszów and was programmed in the automatic controller of the roller shutter mechanism. The results obtained in June and July show the beneficial effect of the application of a thermal insulation roller shutter on the protection of the wall against overheating in the summer period. The average value of global solar irradiance for June was 97.37 W/m2. The average value of global solar irradiance for July was 89.06 W/m2, so it was lower by 8.53% compared to June (Figure 11 and Figure 12).
The graphs (Figure 13 and Figure 14) show the values of the heat flux density flowing through the storage layer and measured on the inner surface of the wall. A positive value in the heat flux density flow charts means that the wall gives off heat to the room, while a negative value means that the heat from the room is absorbed by the wall and transferred to the outside.
In June, the average value of the inner surface temperature of the wall was 28.60 °C (Table 2) and was higher by 3.18 °C than the average temperature value obtained in July, 25.42 °C (Table 3). The use of the heat-insulating shield in July during insolation resulted in a reduction in the average value of the energy stream by as much as 77.8% (from the value of 7.89 W/m2 in June according to Table 2 to the value of 1.75 W/m2 in July according to Table 3). The use of heat-insulating roller shutters resulted in a significant reduction in the value of the heat flux transmitted to the room through the wall. As a result, a temperature reduction was obtained in the room, which significantly increases the comfort of using the room in the summer.
The use of heat-insulating roller shutters as a shield for the absorber gave a positive effect in the form of limiting overheating of the wall and reducing the value of the heat flux that heats the air inside the chamber. The average value of the global solar incident on the vertical plane in the second stage of tests in the summer season (95.15 W/m2) was higher than in the first stage (93.61 W/m2), and the difference in the mean values of outdoor temperatures was even more significant (18.80 °C in the second stage compared to 15.17 °C in the first stage). Despite the much more unfavourable external conditions, the air temperature in the chamber during the second stage was definitely more favourable than during the first stage. The average value of the internal air temperature in the months when the thermal insulation was applied was 25.25 °C (Table 4). For comparison, in the first stage, during which the shield was not used, the average temperature value of the inner surface of the wall was 28.18 °C (Table 4).

3.2. Results of Empirical Research from the Winter Period

The aim of the research carried out in the winter period was to describe the non-stationary heat flux through the wall and to determine the heat gains from solar radiation, as well as to compare the thermal efficiency of the analysed wall with respect to a wall made in the traditional system. The results obtained during the winter period showed that, in a period of intense sunlight, the tested wall very positively meets the expectations regarding heat generation and energy savings. However, in a period during which there were conditions of high cloudiness and, additionally, unfavourable values of external temperature, the tests showed significant heat losses through the tested wall. The described dependencies can be seen in the example of two months: October and January, in which completely different external conditions were registered. In October, there were very favourable alternating periods of several sunny days and two- or three-day periods of cloudy days (Figure 15).
The energy gains from solar radiation collected during sunny days were used during cloudy days (Figure 16).
The internal air temperature was close to the optimal one, thanks to which the values of heat flux density measured on the inner surface of the wall corresponded to the actual values that would be recorded in ventilated utility rooms. It can be concluded that in such a system of sunny and cloudy days, the wall works best because the heat buffer is alternately charged and then gives off heat, thus stabilizing the temperature inside the room. At the same time, after the heat is transferred to the interior, the storage layer is again ready to receive the next dose of solar energy. Thanks to this, in the period of October, thermal gains were recorded (Table 5).
January was a month during which there was a lot of cloudiness; as a result, extremely low values of insolation of the wall were recorded (Figure 17). The result of this situation was significant energy losses through the wall (Figure 18).
The gains resulting from the application of a heat accumulating layer during insolation did not compensate for the losses resulting from the lack of thermal insulation. In January, a positive value of the heat flux on the inner surface of the wall was recorded during only 6 days. Therefore, it can be concluded that the wall did not work properly, because the potential of the heat-accumulating material was not fully used, while the lack of thermal insulation caused heat losses through the wall (Table 6).
In order to assess the energy efficiency of the adopted solution, the obtained results were compared to a wall made in the traditional system with a coefficient of U = 0.30 W/(m2K). The results are shown in Table 7.
When analysing the data for the entire heating period, it should be noted that the heat losses in the tested wall were comparable to a traditionally insulated wall, which is undoubtedly a favourable phenomenon. It is characteristic that energy gains were achieved compared to the traditional wall in the warmer months of the heating season: March, October and November. On the other hand, in the coldest months, during which solar radiation was not able to make up for the heat losses resulting from the lack of thermal insulation, energy losses occurred compared to the traditional solution.

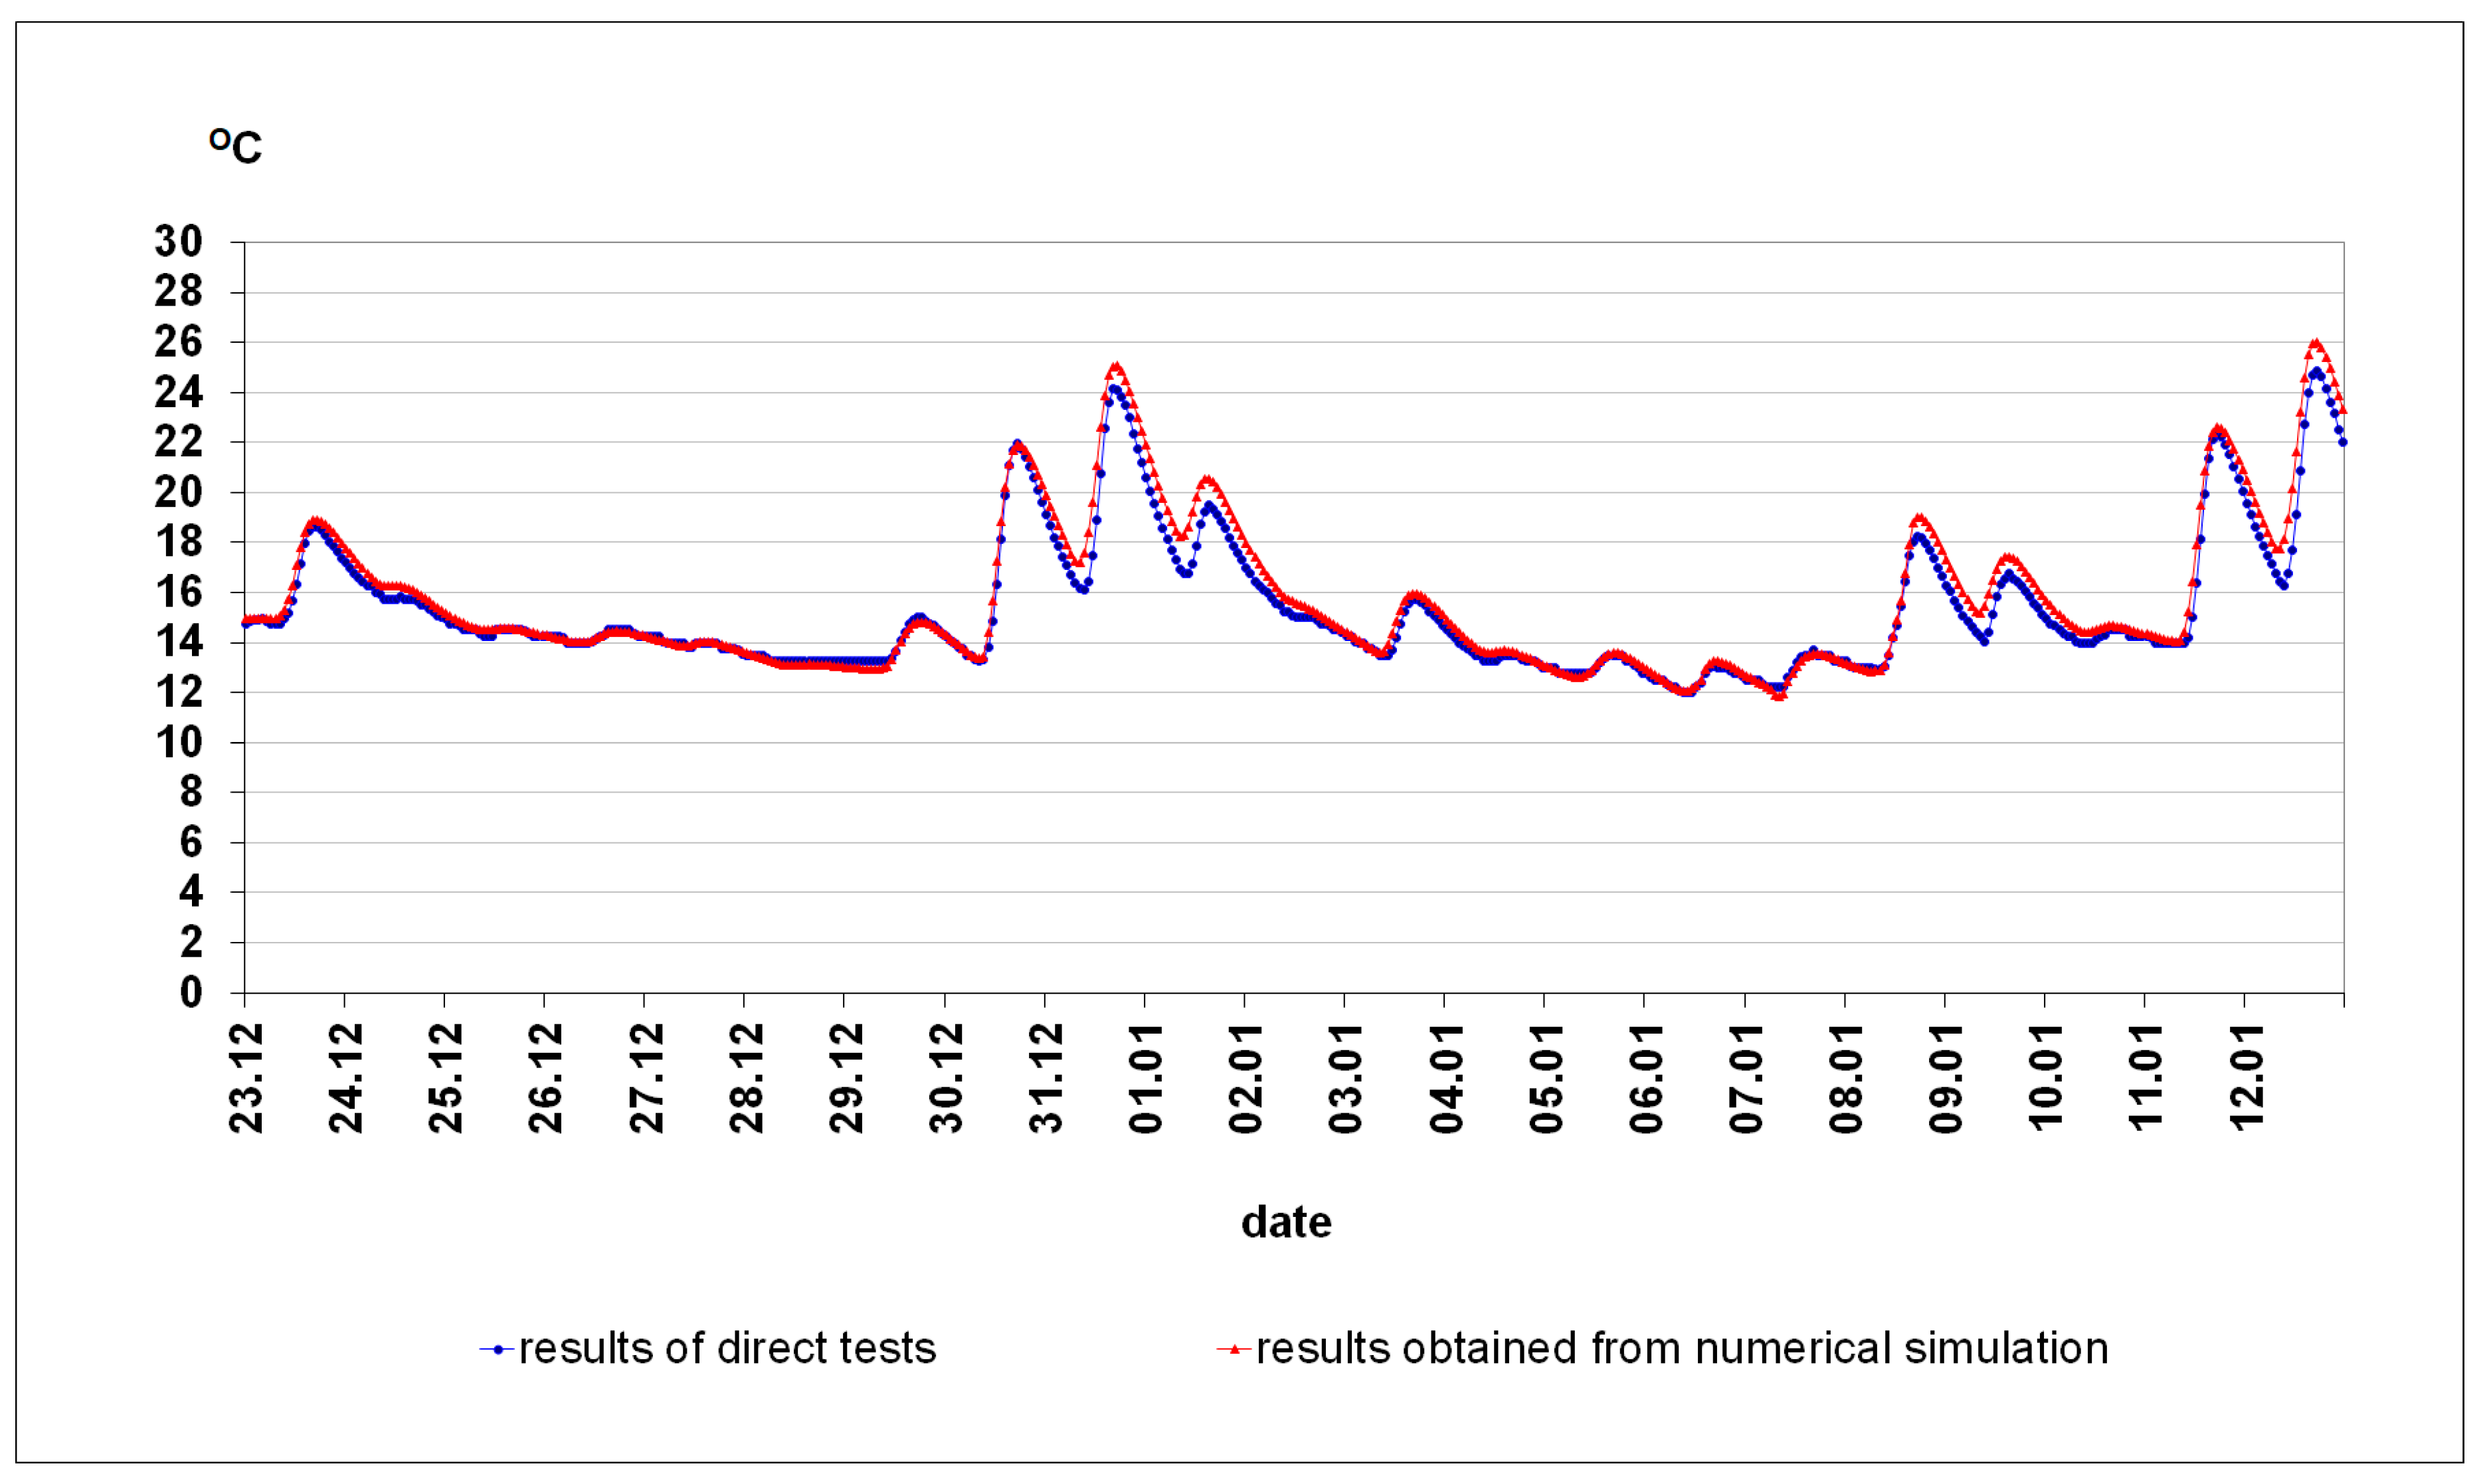
3.3. Comparison of the Results from the Numerical Model with the Empirical Results

Since in the situation of a non-stationary heat flux it is not possible to determine the exact temperature distribution at the initial moment for all elements of the model, effort should be made to achieve a situation where the temperature distribution in the wall is closest to the distribution resulting from the stationary heat flux (constant boundary conditions and loads). With such an assumption, December 23 was selected as the starting point for the numerical analysis of the model. The decisive factor in the selection was the low value of global solar irradiance incident on the vertical plane in the period preceding the analysis, which limited the influence of solar radiation on heat flux fluctuations and stabilized the temperature distribution in the wall to a state close to that corresponding to the stationary flow. In the period of 14–22 December, the average value of the intensity of global solar irradiance incident on the vertical plane was 14.837 W/m2, while in the period immediately preceding the numerical analysis period (18–22 December) the average value was only 6.736 W/m2. This situation allowed the model to assume a temperature distribution in the wall at the initial moment corresponding to the stationary flow resulting from the difference of external and internal air temperatures and from the geometric and material solutions adopted in the construction of the wall. The numerical simulation was performed for a period of 21 days in the time interval from December 23 to January 13. Thanks to the calculations, an accurate temperature distribution was obtained as well as information on the value and direction of the heat flux in the wall for a given period of time. The results of the numerical simulation gave satisfactory agreement in comparison to the experimental tests (Figure 19 and Figure 20). The value of the standard deviation at individual points did not exceed 6% and is comparable with the accuracy of the measuring equipment used during the experimental tests.
The results obtained during the numerical simulation showed that it is possible to determine both the value and direction of the heat flux flowing through the wall, and to determine the temperature value at any point on the wall (Figure 21).
The next stages of the research will consist in carrying out numerical simulations for various configurations of the collector-storage wall in order to improve the energy balance of the wall. For the solution selected from the group that was numerically analysed, verification will be carried out in the form of direct tests.

4. Conclusions

Adaptation of a collector-storage wall to the southern facade of a frame building is justified and is an alternative solution to a traditional structure made in a light cladding system. In order to limit heat losses through the wall in the winter season, it is important to choose the right configuration of the wall layers, adapted to local climatic conditions determined according to long-term observations of weather data. In order to limit the unfavourable overheating of the wall in the summer period, appropriate protection of the wall surface against insolation should be applied in the form of external roller shutters, awnings, canopies, etc. The presented research results prove that the use of a Trombe wall in the southern facades of frame-based buildings is justified. The high storage of the wall has a positive effect on the air temperature in the room, by making it more stable. This is especially important in the summer when rooms tend to overheat. In order to prevent the wall from overheating, the room’s external covers should be used in summer. At the same time, the obtaining of energy from solar radiation in the winter and transitional periods compensates for the lack of a thermal insulation layer in the structure of the barriers. The high agreement of the numerical simulation results with the results of direct tests allows for the conclusion that properly planned numerical simulations can be used for forecasting the thermal behaviour of the complex structure of a building wall under various conditions of climatic loads without the need to conduct time-consuming and costly experimental tests. The possibility of predicting the functioning of a wall for any thermal inputs from the environment will largely allow for the adoption of the best solutions for designed structures and will reduce errors at the design stage.

Author Contributions

Conceptualization, P.M.; methodology, P.M.; software, P.M., J.K.; validation, P.M., J.K.; formal analysis, P.M., J.K.; investigation, P.M., J.K.; resources, P.M., J.K.; data curation, P.M.; writing—original draft preparation, P.M.; writing—review and editing, P.M., J.K.; visualization, P.M.; supervision, P.M.; project administration, P.M., J.K.; funding acquisition, P.M., J.K. All authors have read and agreed to the published version of the manuscript.

Funding

This research received no external funding.

Institutional Review Board Statement

Not applicable.

Informed Consent Statement

Not applicable.

Data Availability Statement

Not applicable.

Conflicts of Interest

The authors declare no conflict of interest. The funders had no role in the design of the study; in the collection, analyses, or interpretation of data; in the writing of the manuscript, or in the decision to publish the results.

Nomenclature

Gglobal solar irradiance (W/m2)
Ssurface (m2)
Ttemperature (°C)
Uheat transfer coefficient (W/(m2·K))
gtotal energy transmittance of solar radiation (%)
hconvection coefficient (W/(m2·K))
hrradiation heat transfer coefficient (W/(m2·K))
kthermal conductivity (W/(m·K))
qheat flux density (W/m2)
qBthe rate of heat generated per unit volume (W/m3)
qSheat transfer due to surface convection (W/m2)
Greek symbol
θtemperature (K)
θeenvironmental (external) temperature (K)
θSbody surface temperature (K)
θrtemperature of the external radiation source (K)
ρdensity (kg/m3)

References

  1. Saleh, M.A.; Kaseb, S.; El-Refaie, M.F. Glass–azimuth modification to reform direct solar heat gain. Build. Environ. 2004, 39, 653–659. [Google Scholar] [CrossRef]
  2. Barea, G.; Ganem, C.; Esteves, A. The multi-azimuthal window as a passive solar system: A study of heat gain for the rational use of energy. Energy Build. 2017, 144, 251–261. [Google Scholar] [CrossRef]
  3. Miąsik, P.; Krasoń, J. Thermal functioning of a transparent barrier equipped with a system of external thermal insulation shields. E3s Web. Conf. 2018, 49, 00071. [Google Scholar] [CrossRef]
  4. Saadatian, O.; Sopian, K.; Lim, C.H.; Asim, N.; Sulaiman, M.Y. Trombe walls: A review of opportunities and challenges in research and development. Renew. Sustain. Energy Rev. 2012, 16, 6340–6351. [Google Scholar] [CrossRef]
  5. Hu, Z.; He, W.; Ji, J.; Zhang, S. A review on the application of Trombe wall system in buildings. Renew. Sustain. Energy Rev. 2017, 70, 976–987. [Google Scholar] [CrossRef]
  6. Dabaieh, M.; Serageldin, A.A. Earth air heat exchanger, Trombe wall and green wall for passive heating and cooling in premium passive refugee house in Sweden. Energy Convers. Manag. 2020, 209, 112555. [Google Scholar] [CrossRef]
  7. Quesada, G.; Rousse, D.; Dutil, Y.; Badache, M.; Hallé, S. A comprehensive review of solar facades. Opaque solar facades. Renew. Sustain. Energy Rev. 2012, 16, 2820–2832. [Google Scholar] [CrossRef]
  8. Bojica, M.; Johannes, K.; Kuznik, F. Optimizing energy and environmental performance of passive Trombe wall. Energy Build. 2014, 70, 279–286. [Google Scholar] [CrossRef]
  9. Kostikov, S.; Chao, S.; Yiqiang, J. A review of the current work potential of a trombe wall. Renew. Sustain. Energy Rev. 2020, 130, 109947. [Google Scholar] [CrossRef]
  10. Wang, D.; Hu, L.; Du, H.; Liu, Y.; Huang, J.; Xu, Y.; Liu, J. Classification, experimental assessment, modeling methods and evaluation metrics of Trombe walls. Renew. Sustain. Energy Rev. 2020, 124, 109772. [Google Scholar] [CrossRef]
  11. Viegas, G.M.; Jodra, J.I.; Juan, G.A.S.; Díscoli, C.A. Heat storage wall made of concrete and encapsulated water applied to mass construction social housing in temperate climates. Energy Build. 2018, 159, 346–356. [Google Scholar] [CrossRef] [Green Version]
  12. Al-Tamimi, A.S.; Al-Amoudi, O.S.B.; Al-Osta, M.A.; Ali, M.R.; Ahmad, A. Effect of insulation materials and cavity layout on heat transfer of concrete masonry hollow blocks. Constr. Build. Mater. 2020, 254, 119300. [Google Scholar] [CrossRef]
  13. Rafidiarison, H.; Remond, R.; Mougel, E. Dataset for validating 1-D heat and mass transfer models within building walls with hygroscopic materials. Build. Environ. 2015, 89, 356–368. [Google Scholar] [CrossRef]
  14. Simo-Tagne, M.; Ndukwu, M.C.H.; Rogaume, Y. Modelling and numerical simulation of hygrothermal transfer through a building wall for locations subjected to outdoor conditions in Sub-Saharan Africa. J. Build. Eng. 2019, 26, 100901. [Google Scholar] [CrossRef]
  15. Simo-Tagne, M.; Remond, R.; Kharchi, R.; Bennamoun, L.; Ndukwu, M.C.; Rogaume, Y. Modeling, numerical simulation and validation of the hygrothermal transfer through a wooden building wall in Nancy, France. Sci. Eng. Prog. 2021, 22, 100808. [Google Scholar] [CrossRef]
  16. Szyszka, J.; Bevilacqua, P.; Bruno, R. An Innovative Trombe Wall for Winter Use: The Thermo-Diode Trombe Wall. Energies 2020, 13, 2188. [Google Scholar] [CrossRef]
  17. Duan, S.; Jing, C.; Zhao, Z. Energy and exergy analysis of different Trombe walls. Energy Build. 2016, 126, 517–523. [Google Scholar] [CrossRef]
  18. Corasaniti, S.; Manni, L.; Russo, F.; Gori, F. Numerical simulation of modified Trombe-Michel Walls with exergy and energy analysis. Int. Commun. Heat Mass Transf. 2017, 88, 269–276. [Google Scholar] [CrossRef]
  19. Briga-Sá, A.; Boaventura-Cunha, J.; Lanzinha, J.-C.; Paiva, A. Experimental and analytical approach on the Trombe wall thermal performance parameters characterization. Energy Build. 2017, 150, 262–280. [Google Scholar] [CrossRef]
  20. Mohamad, A.; Taler, J.; Ocłoń, P. Trombe Wall Utilization for Cold and Hot Climate Conditions. Energies 2019, 12, 285. [Google Scholar] [CrossRef] [Green Version]
  21. He, W.; Hong, X.; Wu, X.; Pei, G.; Hu, Z.; Tang, W.; Shen, Z.; Ji, J. Thermal and hydraulic analysis on a novel Trombe wall with venetian blind structure. Energy Build. 2016, 123, 50–58. [Google Scholar] [CrossRef]
  22. Yu, B.; Li, N.; Ji, J. Performance analysis of a purified Trombe wall with ventilation blinds based on photo-thermal driven purification. Appl. Energy 2019, 255, 113846. [Google Scholar] [CrossRef]
  23. Gracia de, A.; Navarro, L.; Castell, A.; Ruiz-Pardo, A.; Alvárez, S.; Cabeza, L.F. Experimental study of a ventilated facade with PCM during winter period. Energy Build. 2013, 58, 324–332. [Google Scholar] [CrossRef]
  24. Rabani, M.; Kalantar, V.; Rabani, M. Heat transfer analysis of a Trombe wall with a projecting channel design. Energy 2017, 134, 943–950. [Google Scholar] [CrossRef]
  25. Stazi, F.; Mastrucci, A.; di Perna, C. Trombe wall management in summer conditions: An experimental study. Sol. Energy 2012, 86, 2839–2851. [Google Scholar] [CrossRef]
  26. Jaber, S.; Ajib, S. Optimum design of Trombe wall system in mediterranean region. Sol. Energy 2011, 85, 1891–1898. [Google Scholar] [CrossRef]
  27. Ruiz-Pardo, A.; Dominguez, S.A.; Fernandez, J.A.S. Revision of the Trombe wall calculation method proposed by UNE-EN ISO 13790. Energy Build. 2010, 42, 763–773. [Google Scholar] [CrossRef]
  28. Fiorito, F. Trombe walls for lightweight buildings in temperate and hot climates. Exploring the use of phase-change materials for performances improvement. Energy Procedia 2012, 30, 1110–1119. [Google Scholar] [CrossRef] [Green Version]
  29. Szyszka, J.; Kogut, J.; Skrzypczak, I.; Kokoszka, W. Selective Internal Heat Distribution in Modified Trombe Wall. Iop Conf. Ser. Earth Environ. Sci. 2017, 95, 042018. [Google Scholar] [CrossRef]
  30. Krasoń, J.; Lichołai, L. Thermal efficiency of a modified thermal storage wall containing phase change material in comparative test periods. E3s Web Conf. 2018, 49, 00059. [Google Scholar] [CrossRef] [Green Version]
  31. Sun, D.; Wang, L. Research on heat transfer performance of passive solar collector-storage wall system with phase change materials. Energy Build. 2016, 119, 183–188. [Google Scholar] [CrossRef]
  32. Krasoń, J.; Miąsik, P.; Lichołai, L.; Dębska, B.; Starakiewicz, A. Analysis of the Thermal Characteristics of a Composite Ceramic Product Filled with Phase Change Material. Buildings 2019, 9, 217. [Google Scholar] [CrossRef] [Green Version]
  33. Zhou, G.; Pang, M. Experimental investigations on thermal performance of phase change material e Trombe wall system enhanced by delta winglet vortex generators. Energy 2015, 93, 758–769. [Google Scholar] [CrossRef]
  34. Kara, Y.A. Diurnal performance analysis of phase change material walls. Appl. Eng. 2016, 102, 1–8. [Google Scholar] [CrossRef]
  35. Liu, Y.; Hou, L.; Yang, Y.; Feng, Y.; Yang, L.; Gao, Q. Effects of external insulation component on thermal performance of a Trombe wall with phase change materials. Sol. Energy 2020, 204, 115–133. [Google Scholar] [CrossRef]
  36. Li, S.; Zhu, N.; Hu, P.; Lei, F.; Deng, R. Numerical study on thermal performance of PCM Trombe Wall. Energy Procedia 2019, 158, 2441–2447. [Google Scholar] [CrossRef]
  37. Piotrowski, J.Z.; Stroy, A.; Olenets, M. Mathematical modelling of the steady state heat transfer processes in the convectional elements of passive solar heating systems. Arch. Civil. Mech. Eng. 2013, 13, 394–400. [Google Scholar] [CrossRef]
  38. Abbassi, F.; Dehmani, L. Experimental and numerical study on thermal performance of an unvented Trombe wall associated with internal thermal fins. Energy Build. 2015, 105, 119–128. [Google Scholar] [CrossRef]
  39. Leang, E.; Tittelein, P.; Zalewski, L.; Lassue, S. Numerical study of a composite Trombe solar wall integrating microencapsulated PCM. Energy Procedia 2017, 122, 1009–1014. [Google Scholar] [CrossRef]
  40. Abdeen, A.; Serageldin, A.A.; Ibrahim, M.G.E.; El-Zafarany, A.; Ookawara, S.; Murata, R. Experimental, analytical, and numerical investigation into the feasibility of integrating a passive Trombe wall into a single room. Appl. Eng. 2019, 154, 751–768. [Google Scholar] [CrossRef]
  41. Chwieduk, D. Impact of solar energy on the energy balance of attic rooms in high latitude countries. Appl. Eng. 2018, 136, 548–559. [Google Scholar] [CrossRef]
  42. Wieprzkowicz, A.; Heim, D. Modelling of thermal processes in a glazing structure with temperature dependent optical properties—An example of PCM-window. Renew. Energy 2020, 160, 653–662. [Google Scholar] [CrossRef]
  43. Hoes, P.; Hensen, J.L.M. The potential of lightweight low-energy houses with hybrid adaptable thermal storage: Comparing the performance of promising concepts. Energy Build. 2016, 110, 79–93. [Google Scholar] [CrossRef]
  44. Soares, N.; Santos, P.; Gervásio, H.; Costa, J.J.; Simões da Silva, L. Energy efficiency and thermal performance of lightweight steel-framed(LSF) construction: A review. Renew. Sustain. Energy Rev. 2017, 78, 194–209. [Google Scholar] [CrossRef]
  45. Lohmann, V.; Santos, P. Trombe Wall Thermal Behavior and Energy Efficiency of a Light Steel Frame Compartment: Experimental and Numerical Assessments. Energies 2020, 13, 2744. [Google Scholar] [CrossRef]
  46. PN-EN ISO 6946 Building Components and Building Elements—Thermal Resistance and Thermal Transmittance—Calculation Methods; Polish Committee for Standardization: Warsaw, Poland, 2017. (In Polish)
  47. Moore, W.I.; Donovan, E.S.; Powers, C.H.R. Thermal analysis of automotive lamps using the ADINA-F coupled specular radiation and natural convection model. Comput. Struct. 1999, 72, 17–30. [Google Scholar] [CrossRef]
  48. Adamus, J.; Pomada, M. Analysis of heat flow in composite structures used in window installation. Compos. Struct. 2018, 202, 127–135. [Google Scholar] [CrossRef]
  49. Dębska, B.; Lichołai, L.; Miąsik, P. Assessment of the Applicability of Sustainable Epoxy Composites Containing Waste Rubber Aggregates in Buildings. Buildings 2019, 9, 31. [Google Scholar] [CrossRef] [Green Version]
  50. Lichołai, L.; Miąsik, P.; Starakiewicz, A.; Krasoń, J. Analysis of the thermal characteristics of anti-icing driveway plates. Iop Conf. Ser. Earth Environ. Sci. 2019, 214, 012040. [Google Scholar] [CrossRef]
Figure 1. View of the test chamber after completing the wall.
Energies 14 00580 g001
Figure 2. Horizontal cross-section through the tested wall.
Energies 14 00580 g002
Figure 3. View of the steel structure and the absorber: (a) from the inside of the chamber; (b) from the outside.
Energies 14 00580 g003
Figure 4. View of the finished inner surface of the wall with the measuring sensors installed: (a) before painting; (b) after painting and installation of surface sensors.
Energies 14 00580 g004
Figure 5. Thermal insulation shield located outside the absorber.
Energies 14 00580 g005
Figure 6. View of the tested wall: (a) in its entirety after installation of glazing; (b) single segment after opening and mounting of the temperature sensors.
Energies 14 00580 g006
Figure 7. Measuring devices: (a) pyranometer for measuring the solar irradiance; (b) data recorder.
Energies 14 00580 g007
Figure 8. Measurement devices: (a) multi-channel recorder for saving measurement results; (b) sensor for measuring the heat flux density and temperature; (c) sensor plug with compensation system.
Energies 14 00580 g008
Figure 9. Temperature measurement sensor.
Energies 14 00580 g009
Figure 10. View of the numerical model of the wall.
Energies 14 00580 g010
Figure 11. Graph of the global solar irradiance incident on the southern vertical plane in June.
Energies 14 00580 g011
Figure 12. Graph of global solar irradiance incident on the southern vertical plane in July.
Energies 14 00580 g012
Figure 13. Graph of heat flux density flowing through the storage layer and on the inner surface of the wall in June.
Energies 14 00580 g013
Figure 14. Graph of heat flux density flowing through the storage layer and on the inner surface of the wall in July.
Energies 14 00580 g014
Figure 15. Graph of the global solar irradiance incident on the southern vertical plane in October.
Energies 14 00580 g015
Figure 16. Graph of heat flux density flowing through the storage layer and on the inner surface of the wall in October.
Energies 14 00580 g016
Figure 17. Graph of the global solar irradiance incident on the southern vertical plane in January.
Energies 14 00580 g017
Figure 18. Graph of heat flux density flowing through the storage layer and on the inner surface of the wall in January.
Energies 14 00580 g018
Figure 19. Graph of temperature of the absorber based on direct tests and numerical simulations.
Energies 14 00580 g019
Figure 20. Graph of temperature of the storage layer at a point located at a distance from the absorber equal to 2/3 of the width of the storage layer.
Energies 14 00580 g020
Figure 21. Graphic temperature distribution in the components of the wall at 1:00 p.m. on 23 December. From the left: collector glass, collector frame, steel frame, storage layer, housing polystyrene.
Energies 14 00580 g021
Table 1. Technical properties of the barrier’s components [46].
Bulk Density
kg/m3
Thermal Conductivity
W/(m·K)
Heat Transfer Coefficient
W/(mK)
Total Energy Transmittance of Solar Radiation
%
Glazing--1.161
Steel skeleton + absorber785058--
Silicate brick wall19000.9--
Thermal insulation300.045--
Table 2. Summary of the results of the tests carried out in June.
Time Interval hAverage Value of the Global Solar Irradiance Incident on the Vertical Plane
W/m2
Heat Flux Density on the Inner Wall Surface W/m2Average Temperature Value
°C
External AirAbsorberat a Distance from the Absorber Equal to 1/3 of the Width of the Storage Layerat a Distance from the Absorber Equal to 2/3 of the Width of the Storage Layeron the Inner Surface of the WallAir Inside the Chamber
0:00–3:003.339.3616.1728.1931.0531.0429.6428.10
3:00–6:0024.598.3214.9826.7229.6329.8028.6327.26
6:00–9:0095.547.2317.1827.5928.5728.6027.5526.36
9:00–12:00227.475.8922.8232.8828.7328.0526.9525.98
12:00–15:00279.665.2524.5741.1630.8728.7827.2426.38
15:00–18:00133.437.6324.5241.5933.7630.8428.5827.33
18:00–21:0012.229.9821.5934.4433.9032.2229.9728.33
21:00–24:003.2710.2018.1630.5232.4531.9630.2128.54
average value97.447.9820.0032.8931.1230.1628.6027.29
Table 3. Summary of the results of the tests carried out in July.
Time Interval,
h
Average Value of the Global Solar Irradiance Incident on the Vertical Plane
W/m2
Heat Flux Density on the Inner Wall Surface W/m2Average Temperature Value
°C
External AirAbsorberat a Distance from the Absorber Equal to 1/3 of the Width of the Storage Layerat a Distance from the Absorber Equal to 2/3 of the Width of the Storage Layeron the Inner Surface of the WallAir Inside the Chamber
0:00–3:003.26−0.0617.0025.3526.6626.7126.1025.66
3:00–6:0017.84−0.9515.8224.4525.9326.1125.5525.07
6:00–9:0075.570.2617.3524.5525.2825.4424.9124.44
9:00–12:00202.964.3022.2026.4625.0724.9724.4424.15
12:00–15:00276.5512.4524.9730.4225.8425.0924.5124.46
15:00–18:00144.9515.2825.0131.7427.2826.0225.2025.16
18:00–21:009.418.7822.1629.1027.8926.9826.1125.93
21:00–24:003.312.5218.8526.7427.5227.2226.5126.17
average value91.735.3220.4227.3526.4326.0725.4225.13
Table 4. Tabular summary of results for the summer period.
MonthAverage Value of the Global Solar Irradiance Incident on the Vertical Plane
W/m2
Average Value of the External Air Temperature
°C
Average Temperature Value on the Surface of the Absorber
°C
Average Value of the Internal Air Temperature °C
April89.0510.6627.3528.05
May94.3214.8728.4929.17
June97.4420.0032.8927.29
July91.7320.4227.3525.13
August116.5021.2530.8527.80
September76.6214.5824.4022.74
first stage93.6115.1729.5728.18
second stage95.1518.8027.5725.25
Table 5. Summary of the results of the tests carried out in October—the middle sector of the wall.
Time Interval,
h
Average Value of the Global Solar Irradiance Incident on the Vertical Plane,
W/m2
Heat Flux Density on the Inner Wall Surface, W/m2Average Temperature Value,
°C
External AirAbsorberat a Distance from the Absorber Equal to 1/3 of the Width of the Storage Layerat a Distance from the Absorber Equal to 2/3 of the Width of the Storage Layeron the Inner Surface of the WallAir Inside the Chamber
0:00–3:003.047.5210.5022.2224.4424.3823.4722.24
3:00–6:003.046.2610.0121.0523.2523.3322.7121.68
6:00–9:0032.134.6910.2320.6622.2122.3421.9721.20
9:00–12:00240.253.3713.7628.0922.1621.7021.3520.79
12:00–15:00342.143.5416.3237.9124.9522.6021.5620.98
15:00–18:00131.096.6014.8933.5527.8624.9122.9221.84
18:00–21:002.899.2612.3426.2627.3125.9524.0522.53
21:00–24:002.989.2011.2223.7225.7625.3624.0022.49
average value94.706.3112.4126.6824.7423.8222.7521.72
Table 6. Summary of the results of the tests carried out in January—the middle sector of the wall.
Time Interval,
h
Average Value of the Global Solar Irradiance Incident on the Vertical Plane,
W/m2
Heat Flux Density on the Inner Wall Surface, W/m2Average Temperature Value,
°C,
External AirAbsorberat a Distance from the Absorber Equal to 1/3 of the Width of the Storage Layerat a Distance from the Absorber Equal to 2/3 of the Width of the Storage Layeron the Inner Surface of the WallAir Inside the Chamber
0:00–3:003.16−10.56−1.7411.8714.8915.9117.5519.28
3:00–6:003.18−11.89−1.6211.4014.3315.4317.2719.22
6:00–9:0017.54−12.94−1.4411.0713.9015.0517.0619.18
9:00–12:00164.22−13.750.1815.7714.0214.8616.8919.14
12:00–15:00166.97−12.911.1619.9015.8115.5617.0819.20
15:00–18:0012.6−10.21−0.2215.2116.6616.6417.6819.33
18:00–21:003.00−8.96−1.2413.2116.0016.6817.8719.34
21:00-24:003.11−9.78−1.5812.2615.2716.2317.6919.30
average value46.73−11.37−0.8113.8415.1115.8017.3919.25
Table 7. Comparison of heat flux for the tested wall and for a wall designed in the traditional system with the coefficient U = 0.30 W/(m2K).
MonthMonthly Average Value of the Heat Flux DensityThermal Energy Consumption during the Heating Season
for the Tested Wallfor a Traditional Wall with a Heat Transfer Coefficient U = 0.30
W/(m2K)
for the Tested Wallfor a Traditional Wall with a Heat Transfer Coefficient U = 0.30
W/(m2K)
October6.31−2.79−4.692.08
November−0.26−3.630.192.61
December−10.60−5.147.893.82
January−11.37−6.028.464.48
February−8.73−5.595.863.75
March−3.76−5.462.804.06
−28.42−28.6220.5120.81
Publisher’s Note: MDPI stays neutral with regard to jurisdictional claims in published maps and institutional affiliations.

