Abstract
The electrification of loader designs can utilise several power motor types. Hence, this study investigates the operational performance of pure electric-powered loaders matched with three types of motors. Firstly, for the ZL08 loader, it is proposed that a pure electric-powered loader structure adopts two motors to drive the walking and hydraulic systems separately. Secondly, the dynamic parameters of the two motors were matched, and then, a joint vehicle dynamics model of the control system, the Multi-Body Dynamics (MBD) module and the material Discrete Element Method (DEM) module, was established. Finally, the performance of the walking system with three motors was tested by inserting three materials and using accelerating and climbing methods. The operating performance of the hydraulic system was tested by shovelling and unloading three materials. Results show that when inserting difficult materials, the loader’s walking system with switched reluctance motors is 9.74–21.2% deeper than that with the other two motors and 11.7–56.2% faster at the same depth. The hydraulic system consumes 3–15.7% less energy when matched with a permanent magnet synchronous motor than the other two motors. Pure electric loaders have the best operating performance when the walking system is matched with a switched reluctance motor, and the hydraulic system is matched with a permanent magnet synchronous motor.
1. Introduction
Wheel loaders are widely used for earth-moving work in construction projects, such as roads, buildings, ports and mines, and are important machines, that are in construction in large numbers [1]. With air pollution and oil shortages becoming increasingly serious, traditional diesel-powered loaders have gradually attracted attention due to their weak emissions, high-energy consumption and low efficiency during operation. Electric-powered drive technology is an effective energy-saving and emission-reduction technology. Electric construction vehicles such as loaders using high-efficiency motors as power units can effectively reduce energy consumption [2,3,4]. With reference to the types of electric-powered vehicles [5], three routes are available if the loader is to be electrified according to their different power sources, i.e., hybrid-electric loaders, battery-electric loaders and fuel cell loaders. Of these, battery-electric and fuel cell loaders can be classified as purely electric-powered loaders. Most researches have focused on hybrid-electric loaders. However, hybrid systems still use the engine as the power source, leaving the problems of oil consumption and pollutant emissions unresolved. Pure electric technology has the advantages of a wide range of power sources, less pollution, low noise and high efficiency [6,7], making this source become the primary choice for energy saving and emission reduction [8].
The motor is one of the core components of all three types of electric loaders. Different types of power motors have a special performance, and different choices will directly lead to different working performances of the electric-powered loaders. Jin, Shi and Bian [9] designed and tested a power-distributed wheel loader with the travel and braking system using two permanent magnet synchronous hub motors and the hydraulic system driven by using an induction motor. Li, Liu, Zhao and Wang [10] designed a fuel-cell hybrid loader with two AC synchronous motors to drive the walking system and the hydraulic system respectively. Moreover, Liu, Liu and Chen [11] studied the application of switched reluctance motors (SRM) in heavy-duty vehicles, such as loaders, and showed that SRM can effectively improve the performance and reliability of heavy-duty vehicles. The above-mentioned studies showed that permanent magnet synchronous motors (PMSM), induction motors (IM) and SRM are all available options for electric loaders. However, previous researchers did not quantitatively consider the impact of the motor type on loader performances when designing the electric loader. They only summarise the advantages of the selected motor and consider that the selected motor can meet the basic work requirements of the loader. Currently, no literature investigates the most suitable motor for a loader’s operational performance.
Therefore, this study examines the operating performance of a ZL08 electric-powered loader under three types of motor drive, aiming to provide a theoretical basis for the design of electric-powered loaders. The contribution of this paper is summarised as follows. (1) The pure electrification of construction vehicles is currently in its infancy, and this paper provides a feasible solution for the selection of motor types and parameters for pure electric loaders. (2) Based on the “Matlab/Simulink-MBD-DEM” combined method, this paper proposes a set of accurate and complete loader performance simulation test plan. The vehicle performance can be known in advance before the actual vehicle manufacturing of the loader. Compared with previous studies, the model established in this paper comprehensively considers mechanical assembly, hydraulic system, multi-body dynamics, material dynamics, etc., and the degree of simulation is more higher than before. Based on this approach, key technologies such as parameter matching and control strategies can also be further investigated to reduce the time-consuming and costly development of pure electric engineering vehicles.
This paper consists of eight parts. Section 2 takes a ZL08 pure electric-powered loader as the object of the study and makes a configuration design of the loader. Section 3 is a parameter matching of the power components of the pure electric loader which is different from the traditional loader. Section 4 develops a simulation model based on “Matlab/Simulink-MBD-DEM”. Section 5 designs several operating conditions, in which the loader performance can be evaluated. Section 6 analyses the distinctions in the loader performance among the different types of motor drives. Section 7 discusses the application of the joint simulation approach proposed in this paper and the challenges faced by pure electric loaders. Section 8 provides a summary of the study.
2. Drive Structure for Pure Electric Loaders
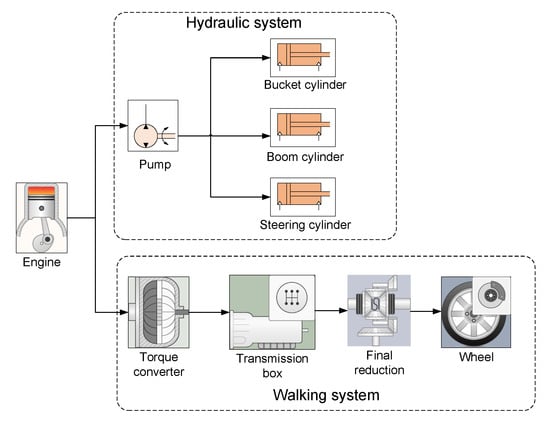
In this study, the diesel-powered ZL08 loader is used as a model to obtain the required pure electric loader. The diesel-powered loader has a single engine as the power source. Figure 1 shows its power transfer route. The hydraulics share engine speed with the travel system, and the driver cannot independently control one of the two through the throttle, gear change, brake and others [12]. However, the operating characteristics of the loader walking system and the hydraulic system are quite different. It is unreasonable for them to use the same input speed in working conditions such as shovelling and the transportation between loading and unloading points. The driver’s efforts to meet the demands of the loader driving system can indirectly lead to a mismatch between the actual and the required flow in the hydraulic system, resulting in additional energy losses.
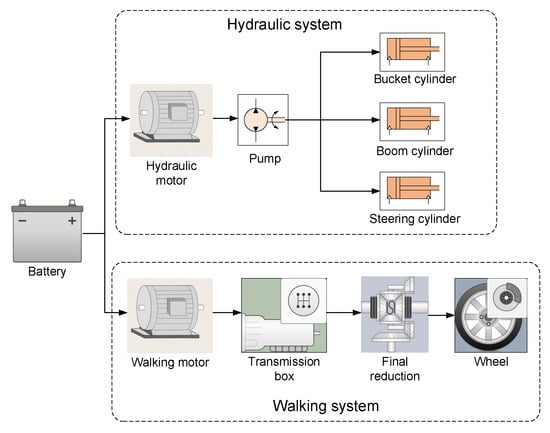
The power components of pure electric loaders mainly include power batteries, walking motors, transmission box, drive axles, hydraulic motors, hydraulic pumps, hydraulic cylinders and others, as shown in Figure 2. The walking motor realises four-wheel walking by driving the gearbox, axle and tires, whereas the hydraulic motor drives the hydraulic system for work device movement and articulated body steering. This configuration decouples the hydraulic system from the travel system so that separate drive control strategies can be designed for each system according to the loader’s working characteristics and conditions, thereby improving performance.
3. Dynamic Parameter Matching
Considering the different drive configurations from diesel-powered loaders, matching the parameters of each of the two components of an electric loader is an important part of the design. The right power parameters can avoid the degradation of the loader’s performance due to under-power or the waste of energy due to over-power. In addition, the right power parameters can keep the components working at high efficiency for as long as possible. Parametric matching of the loader’s transmission system and hydraulic system improves one or more indicators of dynamics and economy, including system efficiency and performance [13]. The parameters of the same components of the electric and diesel-powered loaders are kept as constant as possible during the parameter matching process to reduce the cost and difficulty of retrofitting.
3.1. Loader Parameters
The vehicle parameters of the loader are the basis for parameter matching of the power system. Table 1 shows the vehicle parameters of the ZL08 pure electric loader examined in this study. The data is based on the ZL08 diesel-loader provided by the partner manufacturer.
3.2. Parameter Matching of the Walking Motor
The main parameters of the motor include peak power, rated power, peak speed, rated speed, peak torque and rated torque. The walking motor converts electrical into mechanical energy and applies the output torque to the wheels through the transmission system to drive the vehicle forward and backward. Selecting the correct motor rating parameters is important, as too much will cause the motor to run underload, reducing operating efficiency and increasing the weight and capacity of the battery. Moreover, small parameters will cause the motor to run in an overload state for a long time and reduce the service life. When matching motor parameters, the main consideration is to meet the dynamic requirements of the loader.
3.2.1. Power Matching
When a wheel loader is inserted into a material pile by the power of the walking system, the loader is subjected to the largest resistance and demands the greatest power. The traction force acting on the wheels after the power and drive trains may reach the maximum traction force that can be provided by the ground. The peak power of the walking motor for the material insertion condition is calculated according to Equation (1).
where is the peak power of the walking motor, kW; G is the loader’s gravity, N; is the adhesion coefficient of the tyres to the ground; is the operating speed of the loader when inserting material, taking 1 m/s [14]; is the efficiency of the mechanical drive system in first gear.
The ratio of the motor’s peak power to its rated power is called the motor overload factor. If the coefficient is large, then greater torque can be obtained at a certain speed, but too much will increase the volume and cost of the motor. The motor overload coefficient for electric passenger vehicles is generally 2–3. As loaders often operate with short loading cycles and require frequent high-power operations, such as insertion of material, the overload coefficient should be at a lower value. The rated power of the motor is calculated based on the motor’s peak power and the overload factor.
where is the rated power of the motor, kW; is the motor overload coefficient, which is 1.85.
According to Equations (1) and (2), the motor can be selected with a rated power of 13.5 kW and a peak power of 25 kW.
3.2.2. Speed Matching
The peak motor speed is required to meet the maximum speed requirements of the loader. The formula for calculating the maximum speed of the motor is as follows.
where is the peak rotational speed of the motor, r/min; is the reduction ratio of the gearbox in the forward second gear; is the main reduction ratio; is the maximum speed of the loader, km/h; r is the wheel’s rolling radius, m.
According to Equation (3), the peak speed of the motor can be calculated to be ≥3332 r/min. The rated engine speed of the original diesel-powered loader is 1800 r/min, which has been chosen as the rated speed of the travel motor in this document.
3.2.3. Torque Matching
The peak torque of the walking motor needs to meet the requirement for maximum traction when the loader is inserted into the pile. The peak torque of the motor is calculated according to Equation (4).
where is the peak torque of the motor, N·m; is the first gear reduction ratio of the gearbox.
The rated torque of the motor shall be calculated according to the rated power and rated speed of the motor, as shown in Equation (5).
The peak torque of the walking motor is calculated to be ≥225 N·m, and the rated torque is 72 N·m.
Based on the above calculations, three commonly used motors, SRM, PMSM and IM, are selected for comparison in this study, with the parameters shown in Table 2. The basic requirement of selecting a walking motor is to meet the power demand of the loader. The peak power, peak torque, peak speed and overload coefficient should be identical for the three motors selected. However, the characteristics of the SRM differ significantly from those of the other two motors. The maximum output torque at lower than the rated speed varies with speed, resulting in a peak torque of 34.78% higher than that of the other two motors.
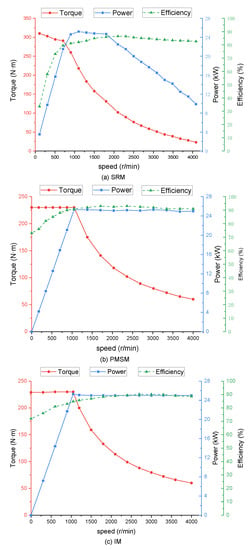
As the walking motors work almost constantly on the outer characteristic curves in the conditions set out later, the peak torque, peak power and efficiency curves for each motor at 100% openness of the accelerator pedal are plotted, as shown in Figure 3. When the speed is lower than the rated speed, PMSM and IM output constant torque (also the maximum torque). Above the rated speed, the output power of PMSM and IM remains constant. Under the rated speed, the maximum output torque of SRM increases as the speed decreases. At speeds between 1000 and 1800 r/min, the utmost output power remains almost constant. Moreover, at above 1800 r/min, the peak power decreases as the speed increases. In terms of efficiency, PMSM can reach up to 93%, IM 90% and SRM approximately 87%. At speeds below 500 r/min, SRM’s efficiency is much lower than the other two motors, with a minimum of 30%.
3.3. Parameter Matching of the Hydraulic Motor
The hydraulic motor is selected according to the relevant parameters of the hydraulic pump (Table 4). The motor’s rated speed is equal to that of the hydraulic pump, and the motor’s rated power is calculated according to Equation (6).
where is the matching coefficient, take 1.15; is the rated power of the hydraulic motor, kW; q is the pump displacement, L/r; n is the pump rated speed, r/min; H is the pump rated pressure, MPa; is the total pump efficiency, take 0.85.
The rated torque is calculated from the rated power and rated speed of the hydraulic motor, as shown in Equation (7).
The rated power of the hydraulic motor has been calculated to be ≥13 kW, and the rated speed is 1800 r/min. Similar to the walking motor, one motor each with suitable parameters from the SRM, PMSM and IM was selected as an alternative. Three hydraulic motors with the same rated speed, rated power, rated torque and overload coefficient were selected, as shown in Table 3.
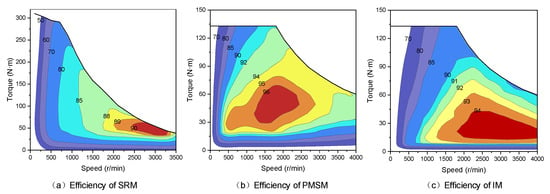
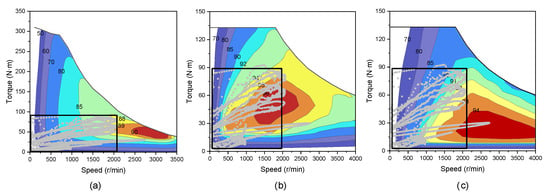
Figure 4 shows the efficiency map of the three hydraulic motors, where the efficiency characteristics of the different motors vary considerably. The dark-red areas in the diagram represent the top efficiency areas of the three motors. The SRM has a peak efficiency of 90%, concentrated between 2500 and 3200 r/min, with a low percentage of the high-efficiency area. The IM has largest efficiency of 94%, concentrated above 2000 r/min, with a moderate percentage of the high-efficiency area. Furthermore, the PMSM has the tallest efficiency, with a maximum efficiency of 96%. The range is between 1200 and 2200 r/min with the highest percentage of high-efficiency area.
4. Dynamical Models
The loader, as an engineering vehicle with operating and transport functions, is more complex and difficult to develop than a passenger vehicle, specifically with regard to the selection of the motor. The development process would be costly and time-consuming if to be conducted directly through real vehicle tests. Using virtual computer technology to simulate the operational performance of loaders to optimise component parameters can significantly reduce development time and costs. Simulation models of wheel loaders include aspects of mechanical assembly, MBD, hydraulic systems and pile dynamics with a high degree of complexity [15]. The bucket and pile are modelled as a 3-D rigid body, non-linear contact multi-body system, making the development of accurate mathematical simulation models difficult [16]. With the development of computer simulation technology, MBD-DEM provides the basis for accurate simulation of loader scooping and unloading processes [17].
The dynamics model of an electric loader is divided into four parts: the walking module, the hydraulic module, the body dynamics module and the material discrete element module. This article builds the walking system module through the Powertrain Blockset and Vehicle Dynamics Blockset in Matlab/Simulink, and the hydraulic system module with Simscape. This paper adopts the form of forward simulation. The torque output by the walking motor is amplified by the gearbox, final drive and other components and then acts on the wheels. The hydraulic motor drives the hydraulic pump to rotate, and the oil through the control function of the valve drives the hydraulic cylinder to extend or contract. In addition, Simulink transmits information such as four-wheel-drive torque and hydraulic cylinder displacement to the body MBD module. The MBD module built in RecurDyn controls vehicle walking and work device movements after receiving control information. The working device will make non-linear contact with the material DEM module built in EDEM. The vehicle MBD module updates the loader’s force state according to the resistance of the material from the EDEM and provides feedback to the travel and hydraulic systems in Simulink. Figure 5 shows the framework for the joint simulation model of a pure electric loader.
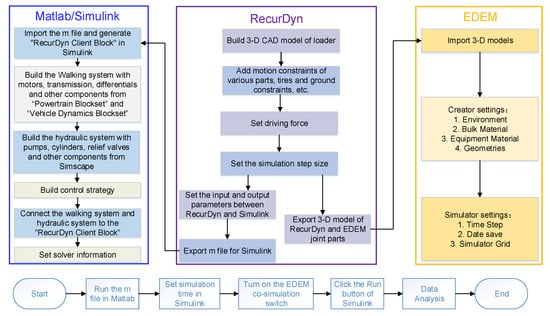
Figure 6 describes the process of the three software combination of Matlab/Simulink, RecurDyn, and EDEM. The joint simulation process includes the following four steps: building loader RecurDyn model, building walking system and hydraulic system in Simulink, building material DEM model and simulation calculation. When the simulation is coupled, the three software run simultaneously, and RecurDyn transfers data bi-directionally with Simulink and EDEM, respectively. RecurDyn will transfer the bucket’s translation and rotation information to the bucket geometry in EDEM in each time step. The movement of the geometry in EDEM will cause the position of the material particles to change. At the same time, EDEM will calculate the force and moment of the bucket, and transmit it to RecurDyn. A load of hydraulic cylinder calculated in RecurDyn and the wheel’s movement information are transmitted to Simulink in real-time. The hydraulic system calculates the hydraulic cylinder’s displacement based on information such as the valve’s state and the load on the hydraulic cylinder. The walking system updates the accelerator pedal and brake pedal openings and gearbox positions based on the loader’s actual vehicle speed. Finally, Simulink transmits wheel torque and hydraulic cylinder displacement to Recurdyn. As the next time step begins, Recurdyn will combine the drive and load information to calculate the new speed, wheel status, and bucket motion. The information is transmitted between RecurDyn and Simulink, RecurDyn and EDEM in order to complete the coupling of the three softwares by the end of the simulation.
4.1. Walking System Model
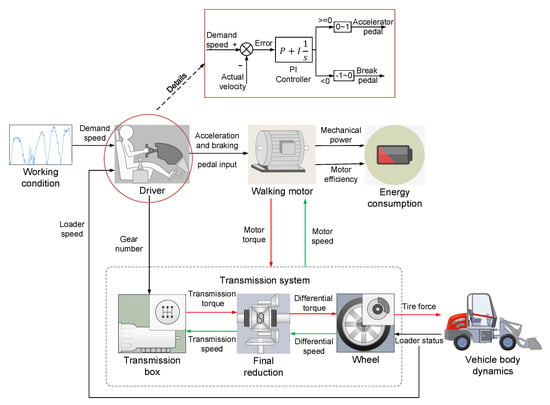
Figure 7 depicts the walking system model built on the MATLAB/Simulink simulation platform. The driver module obtains the target speed from the input conditions and the actual vehicle speed from the dynamics model. According to the difference of speed, the openness of the accelerator and brake pedals are obtained through PI control. In the PI controller, the parameters P and I are 5 and 20, respectively. The shift strategy set out in this document is to shift into the second gear at maximum motor speed in the first gear [18]. As the shifting strategy is not the focus of this study, this strategy is not optimal but does not have a significant impact on motor selection and will therefore be further discussed in subsequent studies. The motor determines the output torque based on acceleration or braking information and the current speed, which is transmitted to the drive system. The motor torque is amplified by the gearbox and the main reducer and is applied to the wheels. The driving torque acts together with the frictional braking torque on the wheel, and the resultant force is transmitted to the vehicle MBD in RecurDyn to drive the loader forward or backward. Finally, based on the current mechanical power output of the motor and its efficiency, the energy consumption for the entire working condition is calculated. The torque flow of the components of the mechanical assembly is from the front to the rear, and the speed flow is from the rear to the front, as shown in Figure 7.
4.2. Hydraulic System Model
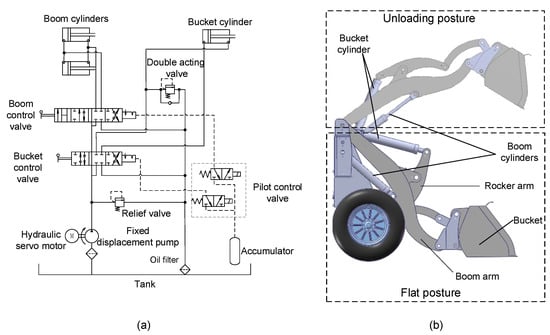
Figure 8a shows the principle of the hydraulic system of a pure electric loader. The system mainly consists of a fixed displacement pump, a bucket cylinder, a boom cylinder, an accumulator and some control valves. Table 4 presents the main parameters of these components. As the steering was not involved in the subsequent analysis of the scenarios, the hydraulic model of the steering part was not established. The driver controls the opening and closing of the bucket and boom valves by manipulating the bucket handle and the boom handle. When the loader works, the output flow rate of the fixed displacement pump is controlled by adjusting the motor speed, which drives the specified hydraulic cylinder under the action of a control valve to produce the corresponding movement. When the bucket valve is turned on to the right, the large chamber of the bucket hydraulic cylinder is filled with oil and the bucket cylinder extends outwards, turning the bucket upwards; conversely, the bucket turns downwards. Similarly, when the arm valve is turned on to the right, the large chamber of the arm cylinder is filled with oil, and the arm is lifted; conversely, the arm is lowered. Figure 8b shows the structure of the working device and two different postures of laying and unloading.
Figure 8.
Working principle of hydraulic system. (a) Schematic diagram of the hydraulic system. (b) Working device structure.
4.3. Discrete Element Model
Loaders often work with bulk materials, such as sand and gravel. To assess the performance of loaders, excavation tests on different materials are an essential part of the process, but real-life testing methods can be labour-intensive and inefficient. Discrete elements allow the behaviour of bulk materials to be simulated more realistically and provide the force acting on the equipment. The DEM is a practical solution for simulating the contact of the loader bucket with the material and changes in the shape of the pile [19,20].
To assess the performance of pure electric loaders, three materials with widely varying parameters have been selected for operation according to the literature [19,21]: coal briquettes, limestone pellets and iron ore, where Table 5 shows their properties. To simplify the study, the material particles were modelled as triple spheres with a particle size of 72 mm, ignoring the differences in particle size and shape. To speed up the simulation, the material is stacked in the simulation environment in bins of 2 m in length, width and height. Then, the baffle facing the loader is removed, allowing the material to slide freely and eventually reach a stable state with three sides stacked against the wall.
5. Simulation Working Condition Setting
Wheel loaders have unique operating characteristics that distinguish them from passenger cars, and the performance of the loader can only be analysed if the simulation is properly set up. The loader operating process can be divided into three parts: scooping, unloading and transport. The scooping stage has the biggest wear and tear on the loader tires, with the tallest energy consumption and the highest demands on the loader performance [21]. Increasing the efficiency of the shovelling section is one of the main ways to reduce cycle times. Therefore, the shovelling section is the aspect of a loader’s operational performance that is most evident. The shovelling phase can be subdivided into the insertion of the material by the walking system and the lifting of the bucket by the hydraulic system. The loaders encounter the greatest resistance when inserting material, which rises as the depth of insertion increases. As a result, high demands are placed on the dynamics of the loader, requiring the walking motor to output high torque at low speeds to reach the required depth of insertion as quickly as possible.
During the operation of the loader hydraulic system, the hydraulic motor does not operate at its peak torque due to the protection of devices, such as relief valves. The electric-hydraulics of loaders place less emphasis on power performance and more on the economy. The electric-hydraulic system design mainly aims to reduce the energy consumption of hydraulic systems and increase energy efficiency [22,23]. The hydraulic system of the loader mainly operates during shovelling and unloading, which are the chief conditions for determining the economic characteristics of the hydraulic system.
Acceleration and climbing ability are also important aspects of the dynamics of a loader’s travel system. The short distance between the pile and the truck in a short loading cycle makes transportation less challenging for the loader. Meanwhile, the widely used long loading cycle involves two 400 m transport stages and even requires the loader to climb steep gradients [24].
Therefore, in this study, three conditions have been set up to test the performance of the travel system: insertion of material, acceleration and climbing, and the shovelling and unloading conditions to test the performance of the hydraulic system. The following conditions are sorted according to importance.
5.1. Insert Material Conditions
The insertion conditions are simulated by working with the three materials established in Table 5. On the asphalt road surface, the shovel bucket is parallel to the ground and slightly pressed down. The loader is inserted into the material pile at an initial speed of 1 m/s and continues to go deeper. During this process, no power is provided by the hydraulic motor until the loader can hardly move forward. The performance of the loader with different motor drives is compared by the maximum depth of insertion of the loader, the duration of insertion and others, which is calculated from the moment the bucket makes contact with the pile.
5.2. Shovelling and Unloading Conditions
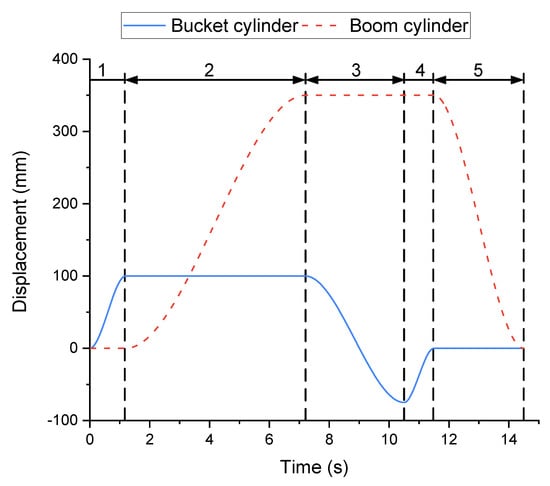
The scooping and unloading conditions also operate for the three materials mentioned above. To prevent a shallow insertion of the loader into the pile and a low fill rate, the particle shape of the material is modified to a single sphere, and the other parameters remain unchanged. The resistance of the hydraulic system is greatest during the revolving and lifting phases of the shovel, which is related to the material and the shovelling trajectory. Depending on the trajectory of the bucket tip, the loader’s scooping methods can generally be divided into one-time scooping, segregated scooping and compound scooping, with the one-time scooping method having the highest resistance and energy consumption [21]. The extreme performance of hydraulic systems can be fully reflected, which is why the one-time scooping method is used in the shovelling condition. In this study, the performance of the hydraulic system is tested by combining shovelling and unloading into one condition, which is divided into five stages. After the loader has been fully inserted into the pile, stage 1 turns the bucket to dig, stage 2 lifts, stage 3 turns the bucket to unload, stage 4 retracts the bucket and stage 5 lowers the arm. Figure 9 shows the actual action of the hydraulic cylinders.
5.3. Accelerated Conditions
This article tests the acceleration performance of the pure electric loader driven by each of three travel motors. The setup is as follows: on a level, hard-packed field, the loader starts in primary gear and shifts to the second gear when a maximum speed is reached under the first gear. Uebel, Raduenz, Krus and Negri [25] noted that the maximum speed recorded during the transport of loaders with long loading cycles is close to 25 km/h. However, due to the short distance between loading and unloading locations in most cases, loaders rarely work at a speed of 25 km/h. Therefore, this paper takes the acceleration time of the loader to 15 km/h as one of the evaluation criteria.
5.4. Climbing Conditions
The loader is in the lowest gear with no load, approaches the starting point of the climb at the lowest possible speed and then quickly presses the accelerator to a maximum until the end of the experiment. The ramp length is 20 m, the initial gradient is 23° and the gradient is gradually increased until the loader can hardly climb the slope. The climbing performance of the loader with the three motors is evaluated by comparing the loader’s climbing time, the travel motor’s power consumption and the maximum climbing degree.
6. Result Analysis
6.1. Insert Material Experiment Results
Table 6 shows the performance of the loader with three motors when inserting three materials. The maximum insertion depth, insertion time of 0.5 m and insertion time of 1 m have been chosen as criteria for determining insertion performance. The fill rate is the main indicator of a loader’s ability to dig. High fill rates are difficult to achieve if the loader has a low depth of insertion into the pile, so the maximum depth of insertion is the primary evaluation indicator for this condition. The other two factors represent the speed of the loader’s insertion into the pile, and a reduction in the time required for continuous insertion can improve excavation efficiency and reduce energy consumption. As the particle density increases, the difficulty of insertion increases and the maximum depth of insertion decreases. When inserting lumps of coal, the buckets of all three motor-driven loaders are fully inserted into the pile to the largest depth of 1.320 m. For the other two materials, the SRM-driven loader has the greatest depth of insertion, that is, 12.2% and 17.3% deeper than the PMSM and 9.74% and 21.2% deeper than the IM, respectively. The SRM is slightly faster than the other two motors due to the low difficulty of inserting coal blocks, but the difference is within 5%. For limestone with medium insertion difficulty, a slight difference exists between the three motors at 0.5-m insertion, but as the insertion depth increases, the advantages of the SRM become more apparent. At an insertion depth of 1 m, the SRM takes 23% less time than the IM, whereas the PMSM is unable to insert to a depth of 1 m. For the most difficult iron ore, the SRM is 11.7% faster than the PMSM and 56.2% quicker than the IM. The SRM-driven loader, therefore, performs better in this condition. The reason is that as the depth of insertion increases, the insertion resistance from the material pile becomes greater. Moreover, the motor speed decreases with loader speed, and the maximum output torque of the SRM is greater than that of the other two motors.
6.2. Results of Shovelling and Unloading Experiment
Pure electric-powered loaders are powered by a power battery, and the electrical energy is converted to mechanical energy by a hydraulic motor and then to hydraulic energy by a hydraulic pump. If the motor is highly efficient, then the energy lost from the motor is less and the loader will last long in operation under the same conditions. The loader’s hydraulic system works mainly during shovelling and unloading. Figure 10 shows the relationship between motor operating points and efficiency when shovelling and unloading three types of material. The motor operating points are predominantly in the area below 2000 rpm and below 90 N·m torque, which is the most closely matched to the tall efficiency area of the PMSM. The high-efficiency areas of SRM and IM are biased towards the area above 2000 rpm. Even in most areas where the torque of SRM is above 100 N·m, the hydraulic system of the loader is difficult to fully utilise.
Figure 10.
Three motor efficiency maps with hydraulic motor operating points. (a) Position of hydraulic motor operating point in SRM. (b) Position of hydraulic motor operating point in PMSM. (c) Position of hydraulic motor operating point in IM.
Table 7 shows the energy consumption of the three motor-driven hydraulic systems for shovelling and unloading three materials. The PMSM consumes the least energy, and the SRM uses the most. The PMSM saves between 3% and 4% additional energy than the IM, and between 10% and 15.7% more energy than the SRM. Therefore, the loader’s hydraulic system is the most economical when matched with the PMSM.
6.3. Accelerated Experiment Results
Table 8 shows the results of the loader accelerating to 15 and 25 km/h in the shortest time. When the loader is equipped with three kinds of motors, the acceleration time to 15 km/h is approximately 1.3 s, having a difference of less than 3%. In terms of energy consumption, the energy consumption of the SRM-driven loader accelerating to 15 km/h is 29.10 kJ, which is 8% and 11.4% less than the PMSM and IM, respectively. When accelerating to 25 km/h, the SRM-driven loader takes 3.46 s, which is 8.8% and 7.8% slower than a loader matching PMSM and IM, respectively. The reason is that at high speeds, the maximum output torque of SRM at the same speed is lower than the other two motors. The SRM consumes 90.47 kJ when accelerating to 25 km/h, which is 8.7% and 3.1% more energy than the PMSM and IM, respectively.
The loader’s operating cycle is mainly a short loading cycle, which only switches to long loading conditions when the distance between the shovelling and unloading locations is far, so its speed rarely reaches 25 km/h. Therefore, additional attention should be paid to the acceleration performance up to 15 km/h. During the loader’s acceleration to 15 km/h, a slight difference is observed between the three motors’ acceleration times. Therefore, a slight difference may exist in their acceleration performance, with the SRM’s acceleration performance being slightly stronger in comparison.
6.4. Results of the Climbing Experiment
Table 9 gives the results of the loader climbing a to slope with each of the three motor drives. At a gradient of , the steady speed of all three motor-driven loaders was approximately 1.07 m/s. The SRM was 19.49 s for a climb length of 20 m, which is 9.9% and 10.9% faster than the PMSM and IM, respectively. The reason is the high-output torque of the SRM at low speeds and the short time that the loader takes to reach the constant speed from the start. In terms of energy consumption, the SRM-driven loader uses 590.31 kJ for a 20-m climb, which is 10.5% additional energy than the PMSM and 4.1% more energy than the IM. The reason is that the SRM is slightly less efficient than the other two motors at the same speed. The SRM-driven loaders can climb steadily on slopes of and , whereas the PMSM and IM drive loaders cannot do so. This case is because the SRM has a higher maximum output torque at low speeds than the other two motors. The overall climbing performance of all three motors is thus better and worse, with the stable speed on the identical gradient being almost the same, and the SRM being less efficient but capable of handling larger slopes.
7. Discussion
The loader performance test method based on co-simulation proposed in this paper has the following application scenarios:
- Motor selection for pure electric engineering vehicles. In the case that the parameters of the whole component are known, the motor is selected by studying the influence of different motors on vehicle performance.
- Performance tests. This paper provides a complete simulation-based vehicle performance testing process for highly complex construction vehicles, such as loaders.
- Parameter matching and strategy validation. This method can be used for the detailed design and dynamic simulation of the basic components before the real vehicle system is assembled. Under the guidance of the corresponding control strategy, the design parameters of the corresponding components can be suitably improved to make the overall vehicle performance meet the design requirements.
The design of pure electric loaders is still in its early stages and faces the following challenges:
- Reliability. The pure electric loader in this paper uses a battery, an SRM and a PMSM. However, batteries and PMSM are more sensitive to external conditions such as temperature, and PMSM is also at risk of demagnetization. In operating environments above 40 °C and below 0 °C, the reliability of purely electric loaders is challenged.
- Energy storage equipment. The subject of this paper is a small tonnage loader where the battery can be used as the sole power source. If this system is applied to a large-tonnage loader, a large-capacity battery that can support the loader for a long-term operation will be expensive, and there are also challenges in terms of volume and weight. Mixing energy storage devices, such as batteries and super-capacitors, may extend the working hours of the loader, and the development of associated energy management strategy is also challenged.
- Hydraulic system. The hydraulic system of a diesel loader shares engine speed. However, the hydraulic system of the pure electric loader in this paper is driven by an independent motor. There are still challenges in controlling the motor speed of the hydraulic system. This paper still uses the same parameters as the original ZL08 diesel loader, and the matching characteristics of the hydraulic component parameters to the motor are worthy of further study.
8. Conclusions
In this study, the dual-motor ZL08 pure electric loader is taken as the research object. Through joint simulation, the material insertion characteristics, acceleration and hill-climbing characteristics of the walking system with three motors, including the shovelling and unloading performance of the hydraulic system with three motors, are analysed. The following conclusions are drawn:
- The SRM-driven walking system provides the loader with greater material insertion capability than either of the other two types of motors, in terms of speed and depth of insertion. This conclusion validates the findings of Liu, Liu and Chen [11] that SRM torque at low speed and low currents is higher than that of AC motors and SRM is more suitable for heavy vehicles.
- When SRM is used, the walking system of the loader has a higher climbing grade, and the acceleration is no less than the other two kinds of motors.
- The PMSM-driven hydraulic system can effectively utilise the high-efficiency area of the motor, which enables the loader to have good economic performance when shovelling and unloading.
Currently, the development of electrification of construction vehicles such as loaders is dominated by oil-electric hybrids. In recent years, the development goal of hybrid construction machinery is to improve fuel utilization and reduce pollutant emissions through energy management strategies, optimized control strategies and other methods [26,27]. However, the zero-pollution pure electric drive system based on large-capacity batteries or FC may be the best choice for future construction machinery [26]. The development of purely electric engineering vehicles is also limited by various key technologies such as variable-speed control strategies, new electric drive hydraulic control strategies and dynamic arm energy recovery [28]. This study provides a reference for the electrification of construction vehicles, such as loaders. In the future, we will conduct corresponding experimental validation and carry out the following studies to further improve the operational performance of loaders and reduce energy losses.
- Optimize the component parameters of the loader’s walking system and the hydraulic system to reduce the power loss of the loader while still meeting the power requirements.
- As the hydraulic system is driven independently, future research in the control strategy of the hydraulic motor is essential to further improve the performance of the loader.
Author Contributions
Conceptualization, X.L.; Data curation, C.D.; Formal analysis, C.D.; Funding acquisition, X.L.; Investigation, C.D.; Methodology, X.L.; Project administration, Z.Y.; Resources, X.L.; Software, C.D.; Supervision, Z.Y.; Validation, C.D. and K.B.; Writing—original draft, C.D. and K.B.; Writing—review and editing, C.D. and Z.Y. All authors have read and agreed to the published version of the manuscript.
Funding
This study is funded by the National Natural Science Foundation of China (Grant No. 51875233 and Grant No. 51875232) and Postdoctoral Science Foundation of China (Grant No. 2019T120237).
Institutional Review Board Statement
Not applicable.
Informed Consent Statement
Not applicable.
Data Availability Statement
Not applicable.
Acknowledgments
The financial support of this research by the National Natural Science Foundation of China (Grant No. 51875233 and Grant No. 51875232) and Postdoctoral Science Foundation of China (Grant No. 2019T120237) is gratefully acknowledged.
Conflicts of Interest
The authors declare no conflict of interest.
Abbreviations
The following abbreviations are used in this manuscript:
| Walking motor overload factor | |
| G | Gravity of the loader (N) |
| Total efficiency of the hydraulic pump | |
| Drive train efficiency in first gear | |
| H | Rated pressure of the hydraulic pump (MPa) |
| Final reduction ratio | |
| Reduction ratio of the gearbox in first gear | |
| Reduction ratio of the gearbox in second gear | |
| Rated speed of the walking motor (r/min) | |
| Rated speed of the hydraulic motor (r/min) | |
| Peak speed of the walking motor (r/min) | |
| Rated power of the walking motor (kW) | |
| Rated power of the hydraulic motor (kW) | |
| Peak power of the walking motor (kW) | |
| q | Rated displacement of the hydraulic pump (L/r) |
| r | Wheel rolling radius (m) |
| Rated torque of the walking motor (N·m) | |
| Rated torque of the hydraulic motor (N·m) | |
| Peak torque of the walking motor (N·m) | |
| Matching factors for the hydraulic motor | |
| Maximum speed of the loader (km/h) | |
| Speed of the loader when inserting material (m/s) | |
| Coefficient of adhesion between wheel and ground |
References
- Dadhich, S.; Bodin, U.; Andersson, U. Key challenges in automation of earth-moving machines. Autom. Constr. 2016, 68, 212–222. [Google Scholar] [CrossRef]
- Chen, Q.; Lin, T.; Ren, H. Parameters optimization and control strategy of power train systems in hybrid hydraulic excavators. Mechatronics 2018, 56, 16–25. [Google Scholar] [CrossRef]
- Wang, Y.; Zhao, D.X.; Wang, Z.L.; Hu, Y.J. The Trend and Actuality of Hybrid Power Loaders. Key Eng. Mater. 2014, 621, 649–654. [Google Scholar] [CrossRef]
- Wang, J.; Yang, Z.; Liu, S.; Zhang, Q.; Han, Y. A comprehensive overview of hybrid construction machinery. Adv. Mech. Eng. 2016, 8. [Google Scholar] [CrossRef]
- Zhu, Z.Q.; Howe, D. Electrical Machines and Drives for Electric, Hybrid, and Fuel Cell Vehicles. Proc. IEEE 2007, 95, 746–765. [Google Scholar] [CrossRef]
- Pollet, B.G.; Staffell, I.; Shang, J.L. Current status of hybrid, battery and fuel cell electric vehicles: From electrochemistry to market prospects. Electrochim. Acta 2012, 84, 235–249. [Google Scholar] [CrossRef]
- Lipman, T.E.; Elke, M.; Lidicker, J. Hydrogen fuel cell electric vehicle performance and user-response assessment: Results of an extended driver study. Int. J. Hydrogen Energy 2018, 43, 12442–12454. [Google Scholar] [CrossRef]
- Tanç, B.; Arat, H.T.; Baltacıoğlu, E.; Aydın, K. Overview of the next quarter century vision of hydrogen fuel cell electric vehicles. Int. J. Hydrogen Energy 2019, 44, 10120–10128. [Google Scholar] [CrossRef]
- Jin, X.; Shi, L.; Bian, Y. Design and performance tests of a distributed power-driven wheel loader. In Fourth International Conference on Experimental Mechanics; Quan, C., Qian, K., Asundi, A.K., Chau, F.S., Eds.; International Society for Optics and Photonics, SPIE: Singapore, 2010; Volume 7522, pp. 1525–1532. [Google Scholar] [CrossRef]
- Li, T.; Liu, H.; Zhao, D.; Wang, L. Design and analysis of a fuel cell supercapacitor hybrid construction vehicle. Int. J. Hydrogen Energy 2016, 41, 12307–12319. [Google Scholar] [CrossRef]
- Liu, G.; Liu, L.; Chen, S.X. The study of switched reluctance motor drive system for heavy vehicles. In Proceedings of the 2014 IEEE Transportation Electrification Conference and Expo, ITEC Asia-Pacific, Beijing, China, 31 August–3 September 2014. [Google Scholar] [CrossRef]
- Filla, R.; Obermayr, M.; Frank, B. A Study to Compare Trajectory Generation Algorithms for Automatic Bucket Filling in Wheel Loaders. In Proceedings of the CVT 2014 Commercial Vehicle Technology Symposium, Kaiseralutern, Germany, 11–13 March 2014. [Google Scholar] [CrossRef]
- You, Y.; Sun, D.; Qin, D.; Wu, B.; Feng, J. A new continuously variable transmission system parameters matching and optimization based on wheel loader. Mech. Mach. Theory 2020, 150, 103876. [Google Scholar] [CrossRef]
- Almqvist, H. Automatic Bucket Fill. Master’s Thesis, Linköping University, Linköping, Sweden, 2009. [Google Scholar]
- Kim, H.; Oh, K.; Ko, K.; Kim, P.; Yi, K. Modeling, validation and energy flow analysis of a wheel loader. J. Mech. Ence Technol. 2016, 30, 603–610. [Google Scholar] [CrossRef]
- Lindmark, D.M.; Servin, M. Computational exploration of robotic rock loading. Robot. Auton. Syst. 2018, 106, 117–129. [Google Scholar] [CrossRef]
- Curry, D.R.; Deng, Y. Optimizing Heavy Equipment for Handling Bulk Materials with Adams-EDEM Co-simulation. In Proceedings of the 7th International Conference on Discrete Element Methods; Li, X., Feng, Y., Mustoe, G., Eds.; Springer: Singapore, 2017; pp. 1219–1224. [Google Scholar]
- You, Y.; Sun, D.; Qin, D. Shift strategy of a new continuously variable transmission based wheel loader. Mech. Mach. Theory 2018, 130, 313–329. [Google Scholar] [CrossRef]
- Meng, Y.; Fang, H.; Liang, G.; Gu, Q.; Liu, L. Bucket Trajectory Optimization under the Automatic Scooping of LHD. Energies 2019, 12, 3919. [Google Scholar] [CrossRef]
- Filla, R. Evaluating the Efficiency of Wheel Loader Bucket Designs and Bucket Filling Strategies with Non-Coupled DEM Simulations and Simple Performance Indicators. In Proceedings of the Fachtagung Baumaschinentechnik 2015, Dresden, Germany, 17–18 September 2015. [Google Scholar] [CrossRef]
- Chen, Y.H.; Wang, J.Z.; Zheng, T. Simulation Study on the Scooping Trajectories of Loader Based on EDEM. IOP Conf. Ser. Mater. Sci. Eng. 2018, 382, 42016. [Google Scholar] [CrossRef]
- Cetinkunt, S.; Pinsopon, U.; Chen, C.; Egelja, A.; Anwar, S. Positive flow control of closed-center electrohydraulic implement-by-wire systems for mobile equipment applications. Mechatronics 2004, 14, 403–420. [Google Scholar] [CrossRef]
- Quan, Z.; Quan, L.; Zhang, J. Review of energy efficient direct pump controlled cylinder electro-hydraulic technology. Renew. Sustain. Energy Rev. 2014, 35, 336–346. [Google Scholar] [CrossRef]
- Filla, R. Quantifying Operability of Working Machines. Ph.D. Thesis, Linköping University, Linköping, Sweden, 2011. [Google Scholar] [CrossRef]
- Uebel, K.; Raduenz, H.; Krus, P.; De Negri, V. Design Optimisation Strategies for a Hydraulic Hybrid Wheel Loader. Fluid Power Syst. Technol. 2018, 1–11. [Google Scholar] [CrossRef]
- He, X.; Jiang, Y. Review of hybrid electric systems for construction machinery. Autom. Constr. 2018, 92, 286–296. [Google Scholar] [CrossRef]
- Wen, Q.; Wang, F.; Bing, X.; Sun, Z. Improving the Fuel Efficiency of Compact Wheel Loader with a Series Hydraulic Hybrid Powertrain. IEEE Trans. Veh. Technol. 2020. [Google Scholar] [CrossRef]
- Lin, T.; Lin, Y.; Ren, H.; Chen, H.; Chen, Q.; Li, Z. Development and key technologies of pure electric construction machinery. Renew. Sustain. Energy Rev. 2020, 132, 110080. [Google Scholar] [CrossRef]
Publisher’s Note: MDPI stays neutral with regard to jurisdictional claims in published maps and institutional affiliations. |
© 2021 by the authors. Licensee MDPI, Basel, Switzerland. This article is an open access article distributed under the terms and conditions of the Creative Commons Attribution (CC BY) license (http://creativecommons.org/licenses/by/4.0/).
