Article

Role of Monovalent and Divalent Ions in Low-Salinity Water Flood in Carbonate Reservoirs: An Integrated Analysis through Zeta Potentiometric and Simulation Studies

1
Chemical and Petroleum Engineering Department, University of Calgary, Calgary, AB T2N 1N4, Canada
2
Oil & Natural Gas Corporation Ltd., Ahmedabad 380005, India
*
Author to whom correspondence should be addressed.
Energies 2021, 14(3), 729; https://doi.org/10.3390/en14030729
Submission received: 10 December 2020 / Revised: 3 January 2021 / Accepted: 22 January 2021 / Published: 30 January 2021
(This article belongs to the Section L: Energy Sources)

Abstract

:
The presence of principal ions in the water injected is essential for enhanced oil recovery by formation of water-wet state in carbonates. This study reaffirms this and presents an evaluation of the positive influence of both divalent as wells as monovalent ions on wettability alteration mechanisms during low salinity waterflooding using brines of varying ionic composition, referred to as “smart brines”. Zeta potentiometric analysis and reservoir simulation studies were conducted with diluted and smart brines that were prepared by varying the composition of principal ions. Surface charge of oil-saturated whole core samples of rock in the presence of various diluted and smart brines was estimated by zeta potential measurements. A comprehensive analysis of zeta potentiometric and reservoir simulation studies was done to establish and investigate the linkage between the recovery mechanism and the incremental recovery achieved. It is noted that zeta potential increases with the increasing level of dilution and it can be attributed to electric double-layer mechanism. On the contrary, simulation studies implied a different mechanism where an increase in effluent’s pH and Ca2+ mole fraction along with decrease in moles of minerals and saturation index implied rock dissolution was dominant mechanism. Moreover, the effect of mineral dissolution beyond the injection block is highly doubtful. This study demonstrates that an integrated approach from both zeta potentiometric and simulation studies can be used to provide insights into the underlying science of interactions at pore scale during a low salinity waterflood using smart brines. With the aid of an adequately designed upscaling procedure and protocol, the laboratory results can be further used towards developing field-scale models to obtain with realistic recovery factors with optimized brine composition and salinity.

1. Introduction

In the past decade, we have seen many researchers working towards the idea of smart waterflooding [1] where modified brine having different ionic composition and reduced salinity as compared to the formation water is employed for injection purposes. This is also known as low-salinity waterflooding (LSWF) when the sole focus is on reduction in salinity. It is believed that the reduction in salinity alone leads to a better incremental recovery [2,3] and is enhanced when the same water has optimum concentration of potential-determining ions (PDIs) i.e., SO42−, Ca2+ and Mg2+ [4,5]. This modified brine is known as smart brine owing to its different ionic chemistry than seawater and formation water. Moreover, studies have shown that by selectively increasing the concentration of specific ions, the surface ionic chemistry between carbonates and water results in altering the wetting state of rock to lesser oil wet, producing more oil and less water [6]. The underlying mechanisms behind the incremental recovery produced by smart waterflooding are rock dissolution, surface ion exchange, and electrical double layer.
According to the theory of rock dissolution, an introduction of a new brine into the system leads to the dissolution of minerals containing major PDIs like CaCO3, CaMg(CO3)2 and CaSO4. This is caused by the natural tendency of rock-brine system to re-establish the ionic equilibrium disturbed when any new brine enters the system. Hiorth et al., 2010 observed a correlation between amount of calcite dissolved and incremental oil recovery by thermodynamic modelling of the electrostatic attractions [7]. They reasoned that the calcite becomes thermodynamically unstable on introduction of new brine possibly a diluted/smart-brine and leads to more incremental oil recovery as calcite dissolves to compensate for the lack of Ca2+ ion in the aqueous phase. On the other hand, Austad et al. [8] strongly argued that rock dissolution contradicts the experimental results published in literature where an increase in Ca2+ ion leads to enhanced oil recovery by inhibits the rock dissolution and implied that lower dissolution can also lead to higher recovery. Moreover, the applicability of rock dissolution at reservoir scale was also questioned by several researchers [6,7,9] that rock dissolution may be dominant in regions near to the injector and may not propagate further.
During the ongoing debate of rock dissolution, many researchers have been looking at the estimation of electrostatic interactions at calcite surface based on zeta potentiometric analysis in screening underlying mechanisms of wettability alteration from low-salinity waterflooding. The zeta potential is defined as the magnitude of surface potential at the diffuse layer of an electrical double layer formed near the rock surface in the presence of an electrolyte solution [10]. Jackson et al. reported a correlation between the determined zeta potential study using diluted brines and incremental oil recovery [11]. They proposed that smart brine will result in improved oil recovery only when zeta potential or surface charge at interfaces, oil-brine and rock-brine is of same polarity. Awolayo and Sarma also observed the wettability alteration mechanism by low-salinity waterflooding from a thermodynamic modelling study on carbonate-oil-brine system [1]. The stability of water film was studied by determining the disjoining pressure which is the sum of three forces, Van der Waals forces, structural forces, and electrostatic forces. The greater the magnitude of disjoining pressure more is the electrostatic repulsion between the interfaces accounted by the expansion of the double layer.
The zeta potential of a calcite surface is affected by brine properties such as concentration of PDIs, pH and ionic strength. Al-Hashim et al. found that favorable wettability state i.e., water-wetness can be achieved by addition of SO42 and Mg2+ ions in diluted seawater from carbonate rocks [12]. The increasing concentration of divalent anions such as sulfate and phosphate causes the zeta potential to become more negative while divalent cations results in polarity reversal at the rock surface [13].
There seems to be no consensus on the accepted underlying mechanism to be rock dissolution or electrical interactions involving electric double layer. As it is important to better understand the interactive mechanisms to lower the risk of LSWF mechanisms before field implementation, this paper aims to assess the effect of ionic chemistry and reduced salinity to evaluate different mechanism of wettability alteration. Zeta potentiometric study has been carried out using oil, water and rock samples collected from field. Moreover, a simulation model developed to further study laboratory corefloods of carbonate rocks with various brines has been conducted and various parameters such as pH change, mineral variation of the moles of calcite, change in ionic concentration in aqueous phase has been critically analysed to assess each underlying mechanism.

2. Materials and Methods

2.1. Preparation of Samples for Zeta Potentiometric Study
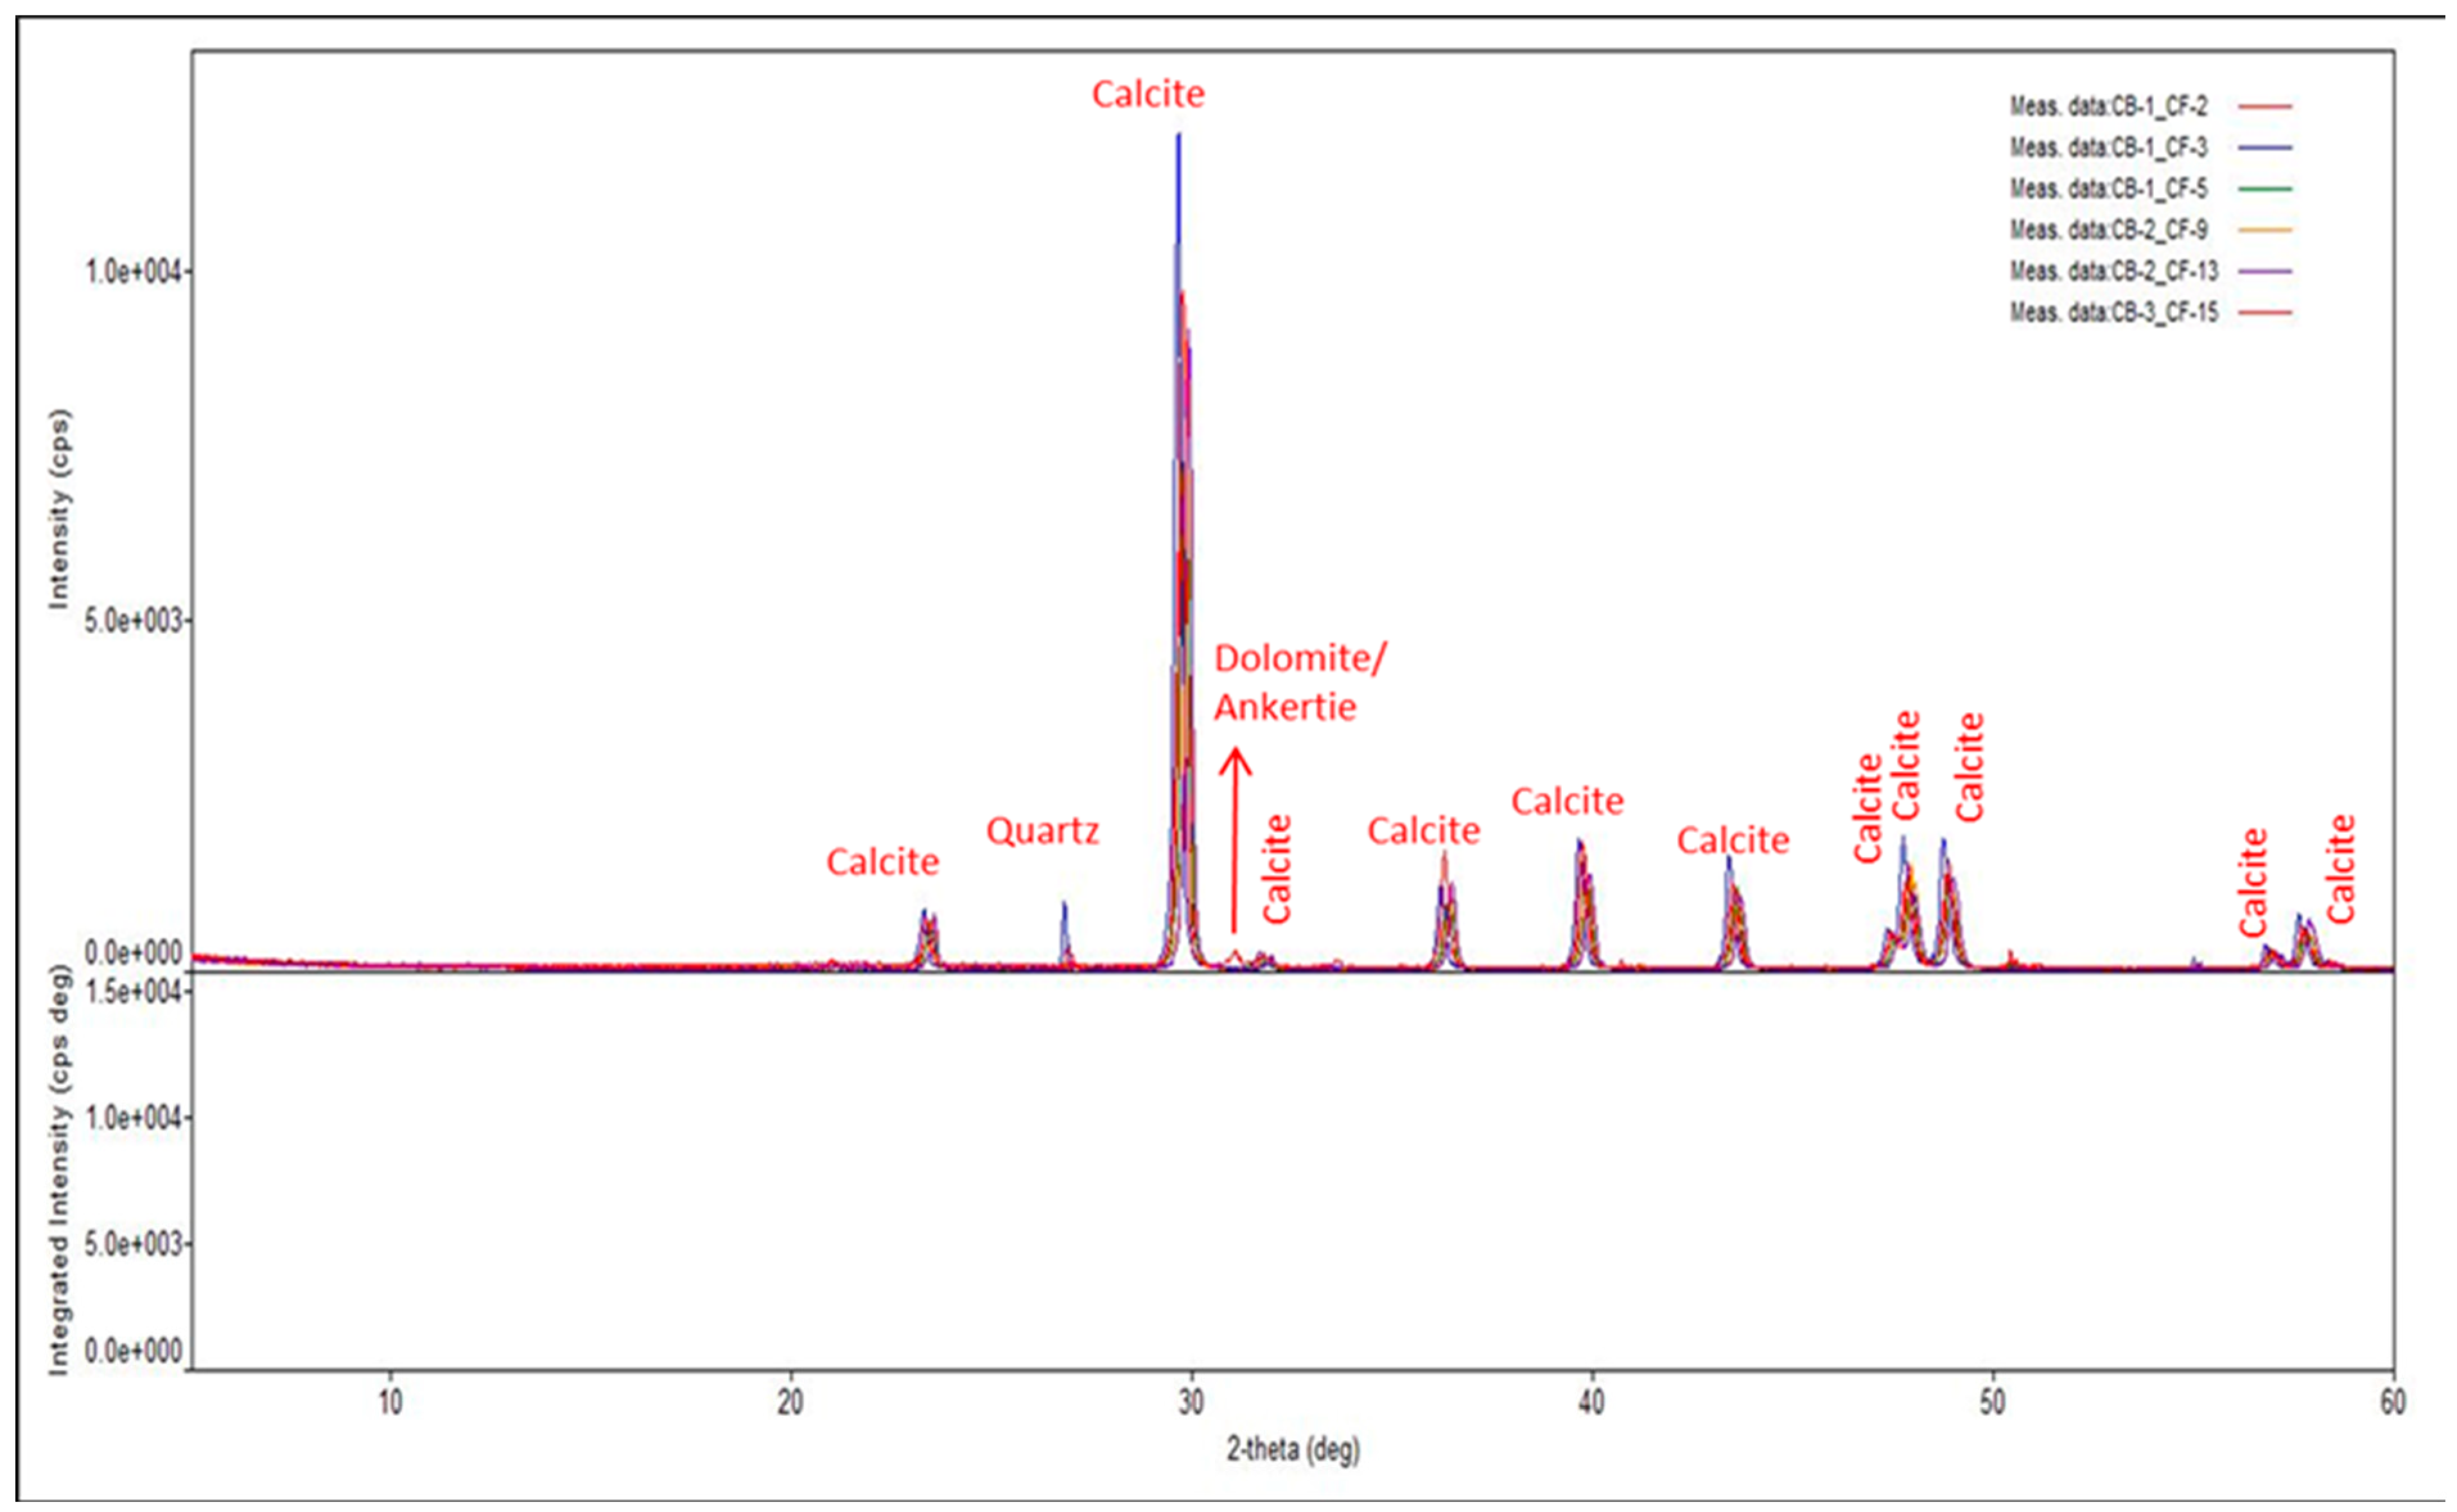
2.1.1. Rock Samples

Whole core samples of carbonate rock were drilled to produce one-inch core plugs and saturated in clean oil for 3–4 weeks. The plug ends were square-cut and polished using a grinder. An x-ray diffraction and x-ray fluorescence analysis were conducted on pulverized rock samples. The results, as shown in Figure 1, suggest that the primary mineralogy of the rock is calcite with trace amounts of quartz and dolomite.

2.1.2. Fluid Samples

Oil and sea water samples collected from a field location in an offshore basin off the west coast of India were shipped to the laboratory in separate canisters. The important properties of these samples were analyzed using various instruments which measured the pH, salinity, ionic strength, and ionic composition of water. Ion chromatography (930 Compact IC Flex, Metrohm, Calgary, AB, Canada) was used to analyze the brines’ ionic chemistry including the concentrations of anions and cations using appropriate solvents. Nitric acid and bicarbonate solutions were used for cationic and anionic ion chromatography. Different levels of dilution were studied for both zeta potentiometric and reservoir simulation study. Dilution was carried out from 50% up to 1% by successive addition of deionized water.
Table 1 shows the important properties of sea water and its diluted versions used in this study and similar properties of modified-brines are shown in Table 2. As shown in Table 2, a modified-brine is prepared by selectively changing the concentration of PDIs in sea water such that individual variation as wells as combined variation of PDIs can be studied. Salts such as sodium sulfate, calcium chloride and magnesium chloride were added in appropriate amounts to raise the concentration of individual PDI.

2.2. Experimental Design for Zeta Potential Analysis

This section describes the experimental design for zeta potentiometer and reservoir simulation adopted to study the mechanism of low-salinity waterflooding. In order to estimate zeta potential at rock surface, an estimation of classical streaming potential or a classical streaming current is required in the presence of flowing electrolyte solution across a portion of rock surface.
One-inch diameter core plugs were drilled from whole core samples and were used for zeta potentiometric analysis capable of holding up to four-inch core samples. A mixture of organic solvents such as 2-propanol, dichloromethane, toluene and xylene were used to clean core plugs via a Soxhlet extraction apparatus. Cleaning of core plugs was done to ensure that any high molecular weight hydrocarbons present in the core were removed as they can plug the porous channels and cause unrepresentative estimations of zeta potential.
Helmholtz-Smoluchowski (HS) gave the equation for estimating zeta potential (ζ) by a streaming current approach as shown in Equation (1) [14]:
ζ = d I d p × η ε   ×   ε 0 × L A
where, dI/dp is the measured streaming current coefficient, η is the viscosity of electrolyte solution, ε0 is the permittivity of the vacuum/free space taken as 8.85 × 10⁻¹² F/m, ε is the dielectric constant of the electrolyte solution, L/A is the cell constant of the streaming channel (the gap between adjacent solid samples where L, defines the length of the rectangular-shaped slit channel formed between two planar surfaces and A, its cross-sectional area.
Although the streaming potential technique can also be used to determine zeta potential, it does require the determination of an additional parameter i.e., electric resistance across the streaming channel. On the contrary, streaming current equation given in Equation (1) does not require the measurement of electric resistance which in turn reduces the measurement error associated with it. Moreover, due to porous nature of our rock sample, electrical resistance measured is not representative due to addition of electrical resistance of pore fluid. Therefore, streaming current technique was used for current study.
A zeta potentiometer (Model: SurPASSTM 3) apparatus designed by Anton Paar (Calgary, AB, Canada) equipped with a special mechanism to hold cylindrical rock samples was used to measure streaming current coefficient where the required streaming channel can be developed for this study. Special care was taken in handling of rock and fluid samples during each measurement as the value of streaming current is very small and highly sensitive to small disturbances. Intake of any size of air bubble needs to be accounted for as it can lead to a completely unrepresentative estimation of zeta potential.

2.3. Simulation Model and Properties

The equation-of-state compositional simulator (GEMTM CMG 2019, Calgary, AB, Canada) used in this study has been developed by Dang et al. [15] where an ion exchange model capable of incorporating geochemical reactions including both the aqueous phase reaction and mineral reactions. The results from the low salinity flooding model were validated with experimental data and ion-exchange model results from geochemistry software PHREEQC.

2.3.1. Aqueous and Mineral Reactions

The aqueous and mineral reaction used in the simulation study are shown in Table 3.
The simulator works by moving the above reactions either forward or backward to re-establish the equilibrium that gets disturbed when a new brine is injected. Following condition is satisfied for any reaction at its equilibrium state [15]:
Qα − Keq, α = 0, α = 1, …, Raq
Q α =   k = 1 n aq ( a k ) v k α
where, Qα and Keq are the activity product and the chemical equilibrium constant for any reaction respectively, R is the universal gas constant, Raq is the number of aqueous phase reactions, naq is the number of specific ions in the aqueous reaction, ak is the activity of particular ion, v is the stoichiometric coefficient of a component in any chemical reaction, and T is the temperature.
In a solution, activity of each ionic species (αk) is given by their effective concentration in a solution. Activity for ith ionic species is given below:
αi = ƴi × mi        i = 1,2,3,…, naq
where, ƴi is the activity coefficient of the ionic species which is taken approximately equal to its concentration in molalities and mi is the concentration of the ionic species in molalities.
The equilibrium constant for various aqueous reactions as a function of temperature is calculated and reported by various researchers [1,16,17] in the literature. Awolayo et al., used the following expression to calculate the value of equilibrium constant using following equation at various temperatures:
log   K eq   =   A 0   +   A 1 T   +   A 2 T +   A 3 log T +   A 4 T 2
where, T is the temperature in Kelvin and A0, A1, A2, A3, and A4 are the empirical parameters found in multiple databases for a particular chemical reaction.
In case of mineral reactions which are kinetically controlled in a reservoir, the consequence of any mineral reaction will be either dissolution or precipitation until the state of ionic equilibrium with the aqueous phase is achieved. The rate of reaction and the reaction rate constant as a function of temperature are given by following equations [15]:
r β = A β k β ( 1 Q β K eq , β ) ,   β = 1 , . , R mn
k β = k 0 , β exp ( E a R ( 1 T 1 T 0 ) ) ,   β = 1 , . , R mn
where, Âβ is the reactive surface area of mineral (β) per unit bulk volume (BV) of porous medium (m2/m3), kβ is the rate constant of mineral reaction (mol/m2 s), Keq,β is the chemical equilibrium constant of mineral reaction, Qβ is the activity product of mineral (β) dissolution reaction, rβ is the dissolution/precipitation rate per unit BV of porous medium [mol/(m3·s)], Rmn is the number of mineral reactions, Ea is the activation energy of any reaction (J/mol), k0,β is the reaction-rate constant at a reference temperature for a reaction, R is the universal gas constant (8.314 J/(mol K)), and T and T0 are the temperature (K) and reference temperature (K) respectively.
Dang et al. [15] also used the ratio of ratio of number of moles of mineral per grid block volume at current time to time zero to find the change the reactive surface area of a mineral in their CMG GEMTM model.

2.3.2. Grid Model and Petrophysical Properties

A single porosity model as illustrated in Figure 2 was prepared to simulate coreflooding with a 12 × 1 × 1 inch composite core. The dimensions of the core were representative of the actual dimensions of composite core used in laboratory experiments. The grid model implemented a 50 × 1 × 50 grid blocks in each direction. The direction along the x-axis was used to represent direction of coreflood. The fluid property and PVT simulator package (WinProp) developed by Computer Modelling Group (CMG) was used to prepare a fluid model for this simulation study (Table 4). It is necessary to emphasize here that the actual fluid and rock properties measured in lab were used to prepare the model as shown in Table 5 and Table 6, respectively.
The component analysis of oil samples was analyzed from ASTM D2887 simulated distillation. The C7+ hydrocarbon component proportions obtained from the analyses were combined into one component as given in Table 5. The acid number of the oil is ~0.6 mg KOH as reported by Kakati et al. [18]. For same set of rock and oil samples, Singh et al. [19] had conducted a contact angle measurement using sessile drop method which showed a very weak water-wet state with seawater (contact angle of ~102°). This also correlates with the high acid number of oil.
The injector has been placed in the left-end block and the producer in the right-end block as shown in Figure 2. Flow rate in the injection well is kept at a constant value of 0.1 mL/min while the simulation run-time period is two days. Several simulations in secondary recovery mode with diluted and smart brines have been conducted to understand the wettability altering mechanisms such as rock dissolution, electric double layer and surface ion exchange. Parameters such as pH, number of moles of ionic species and mineral, have been studied as a function of distance from injector to producer and pore volume injected. Further discussions are done on results obtained from zeta potential experiments and their integration with simulation study.

3. Results and Discussions

3.1. Zeta Potentiometric Analysis

The zeta potential measurements using streaming potential methodology was conducted for various diluted as well as smart brines. The plot of zeta potential vs. pH for various brines is illustrated in Figure 3. The range of pH observed in our study is observed to be between 6.3 and 7.9. It has been reported that in the pH range of 6.5–7.5, a carbonate rock surface exhibits a net positive charge which binds with the polar components of oil that are predominantly negatively charged [1,20]. As majority of the brine used in our study falls under the pH range, we have assumed that the rock surface is net negatively charged. Further analysis on zeta potential with diluted as well as smart brines is discussed.

3.1.1. Diluted Brines

The surface charge analysis of reduction in salinity of injection water by zeta potentiometric analysis is reported in Figure 4. The implications drawn from the figure imply that as the brine salinity is lowered from 25% to 1% dSW, zeta potential consecutively increases (becomes more negative). A more negative zeta potential implies a more negative rock surface charge. As the oil molecules are adhered to the rock surface due to the presence of negatively charged carboxylate functional groups (-COOH-), negative charge on the rock surface will be beneficial in detaching oil molecules by greater repulsive forces between oil-brine and rock-brine interfaces. As more oil gets detached, wettability of rock surface will tend towards more water-wet. This type of wettability alteration mechanism is proposed by several researchers [1,20]. Alroudhan and Vinogradov observed that diluted seawater leads to an increase in negative charge on rock surface by the mechanism of double layer expansion [21].
In a rock-oil-brine system, electrostatic interactions occurring between the interfaces - oil-brine and rock-brine leads to the formation of an electric double layer (EDL) very close to the rock surface. In an oil-wet system, the proportion of oil adhered to the rock surface is present in the immobile stern layer due to attraction between the two interfaces, rock-brine and oil-brine. Surrounding the stern layer, a diffuse layer is present consisting of co-ions and counter-ions from the brine which are under constant thermal and electrostatic forces. In the context of observed zeta potential measurements with diluted brines, it appears that as the brine get more diluted the cloud of ions surrounding the rock become less dense. This causes the forces leading to repulsion between oil-brine and rock-brine interfaces to increase which eventually will aid the oil droplets to detach faster.

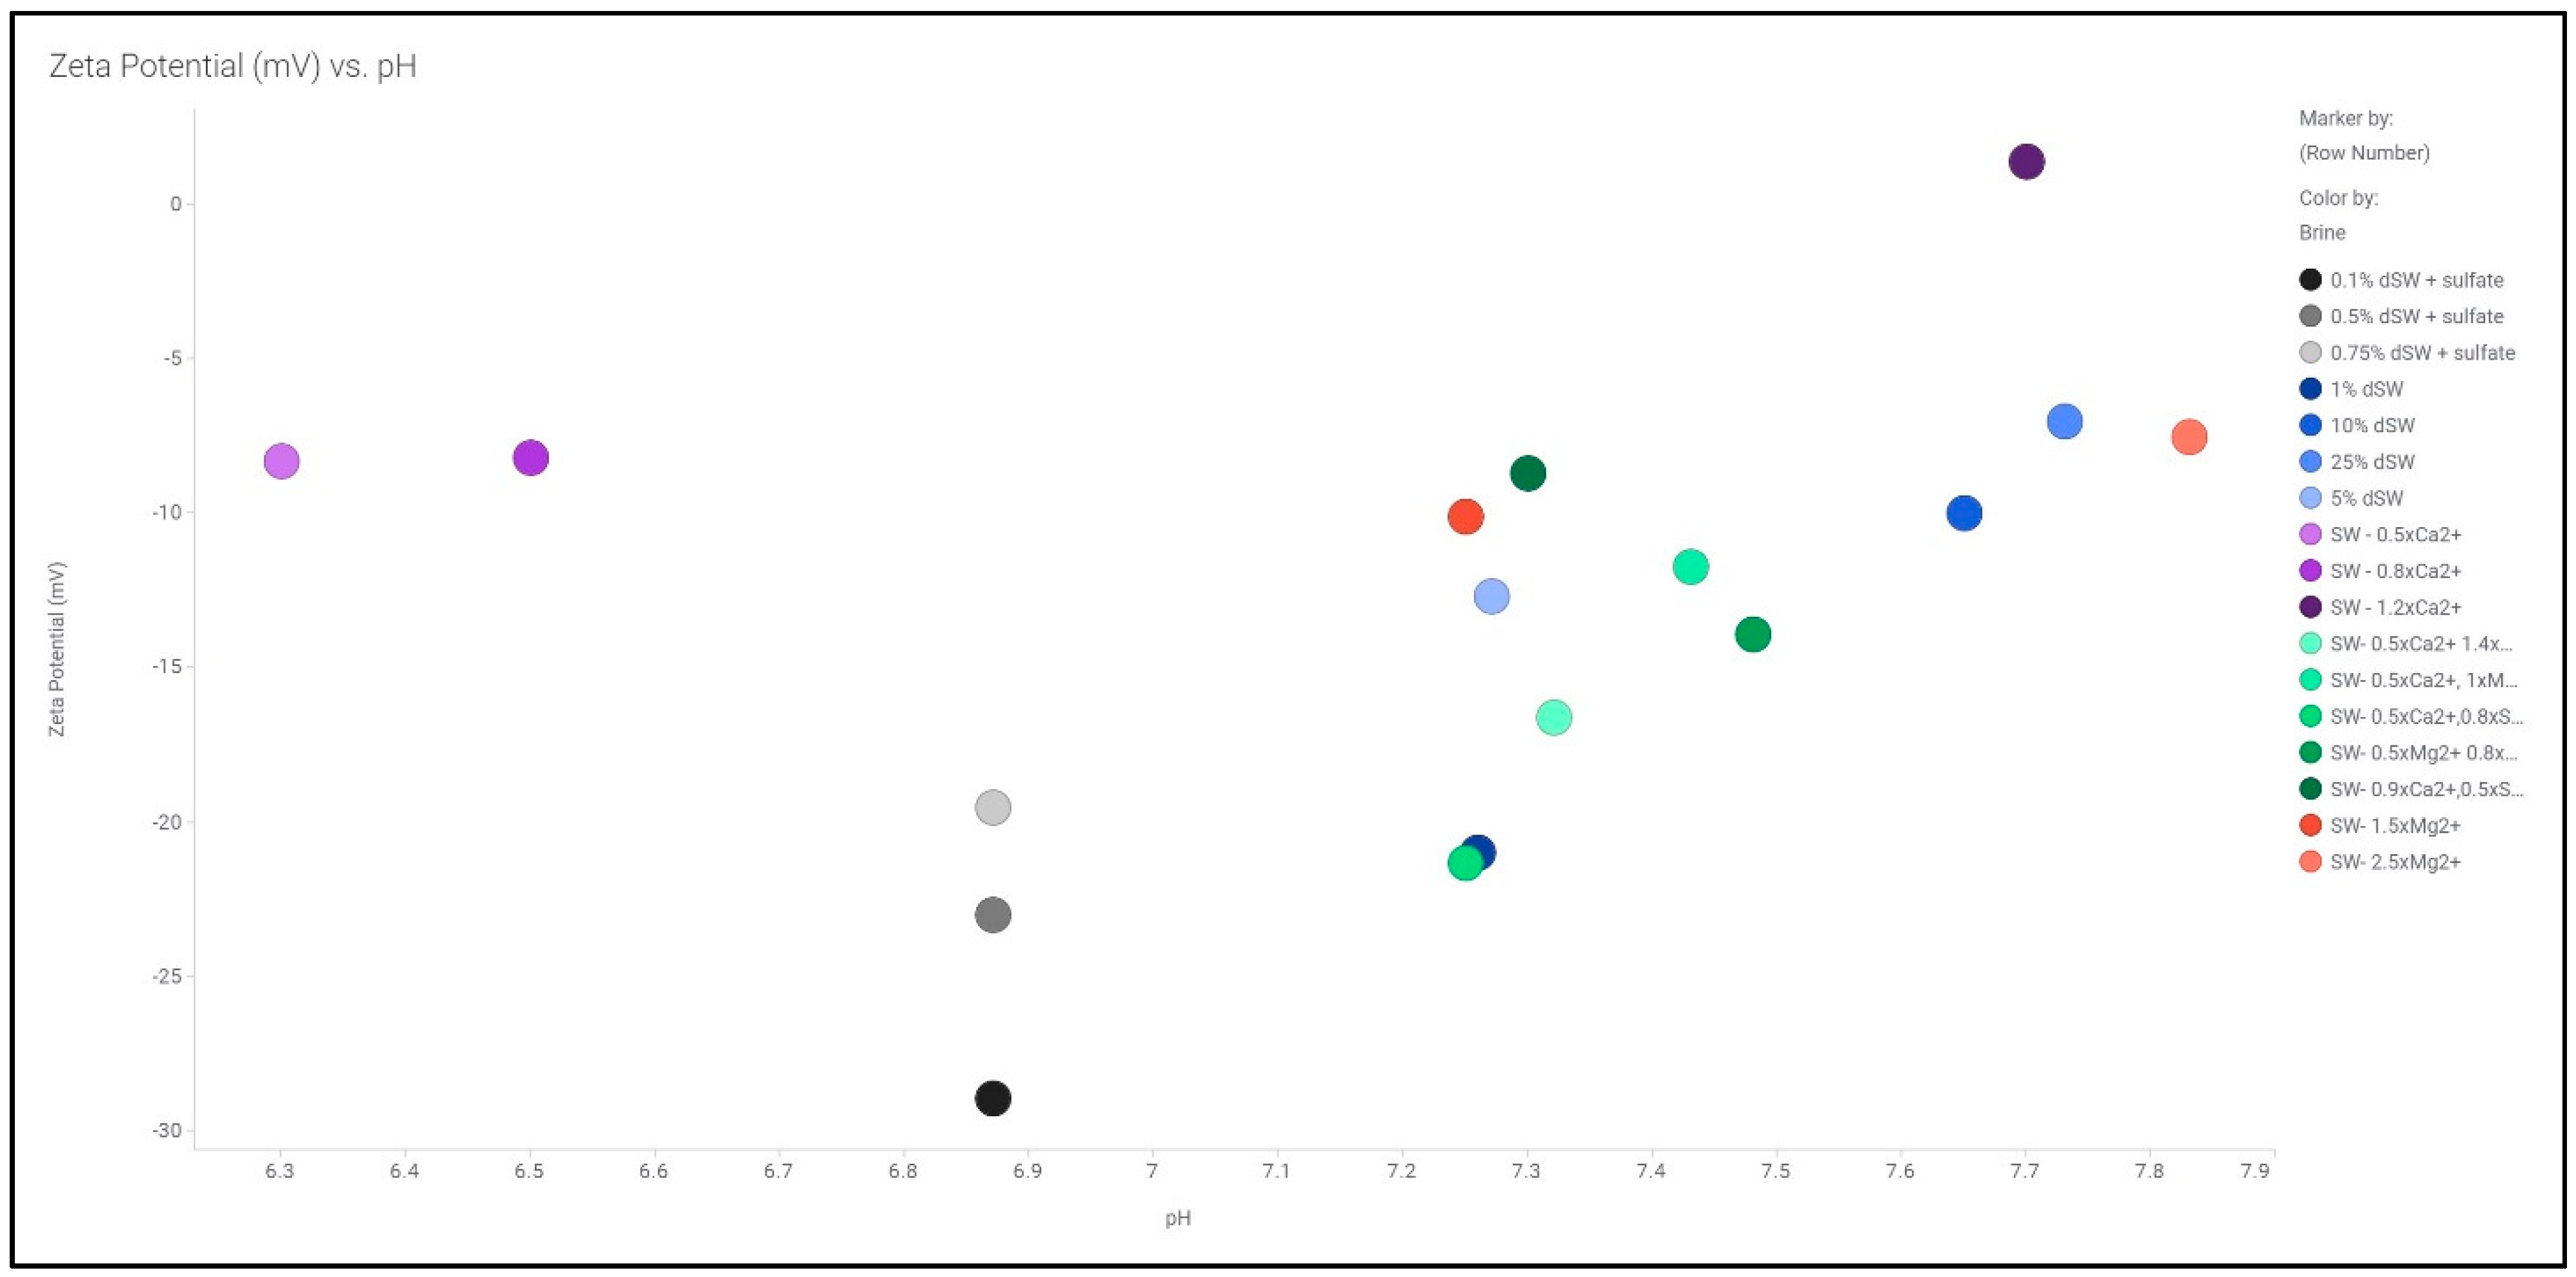
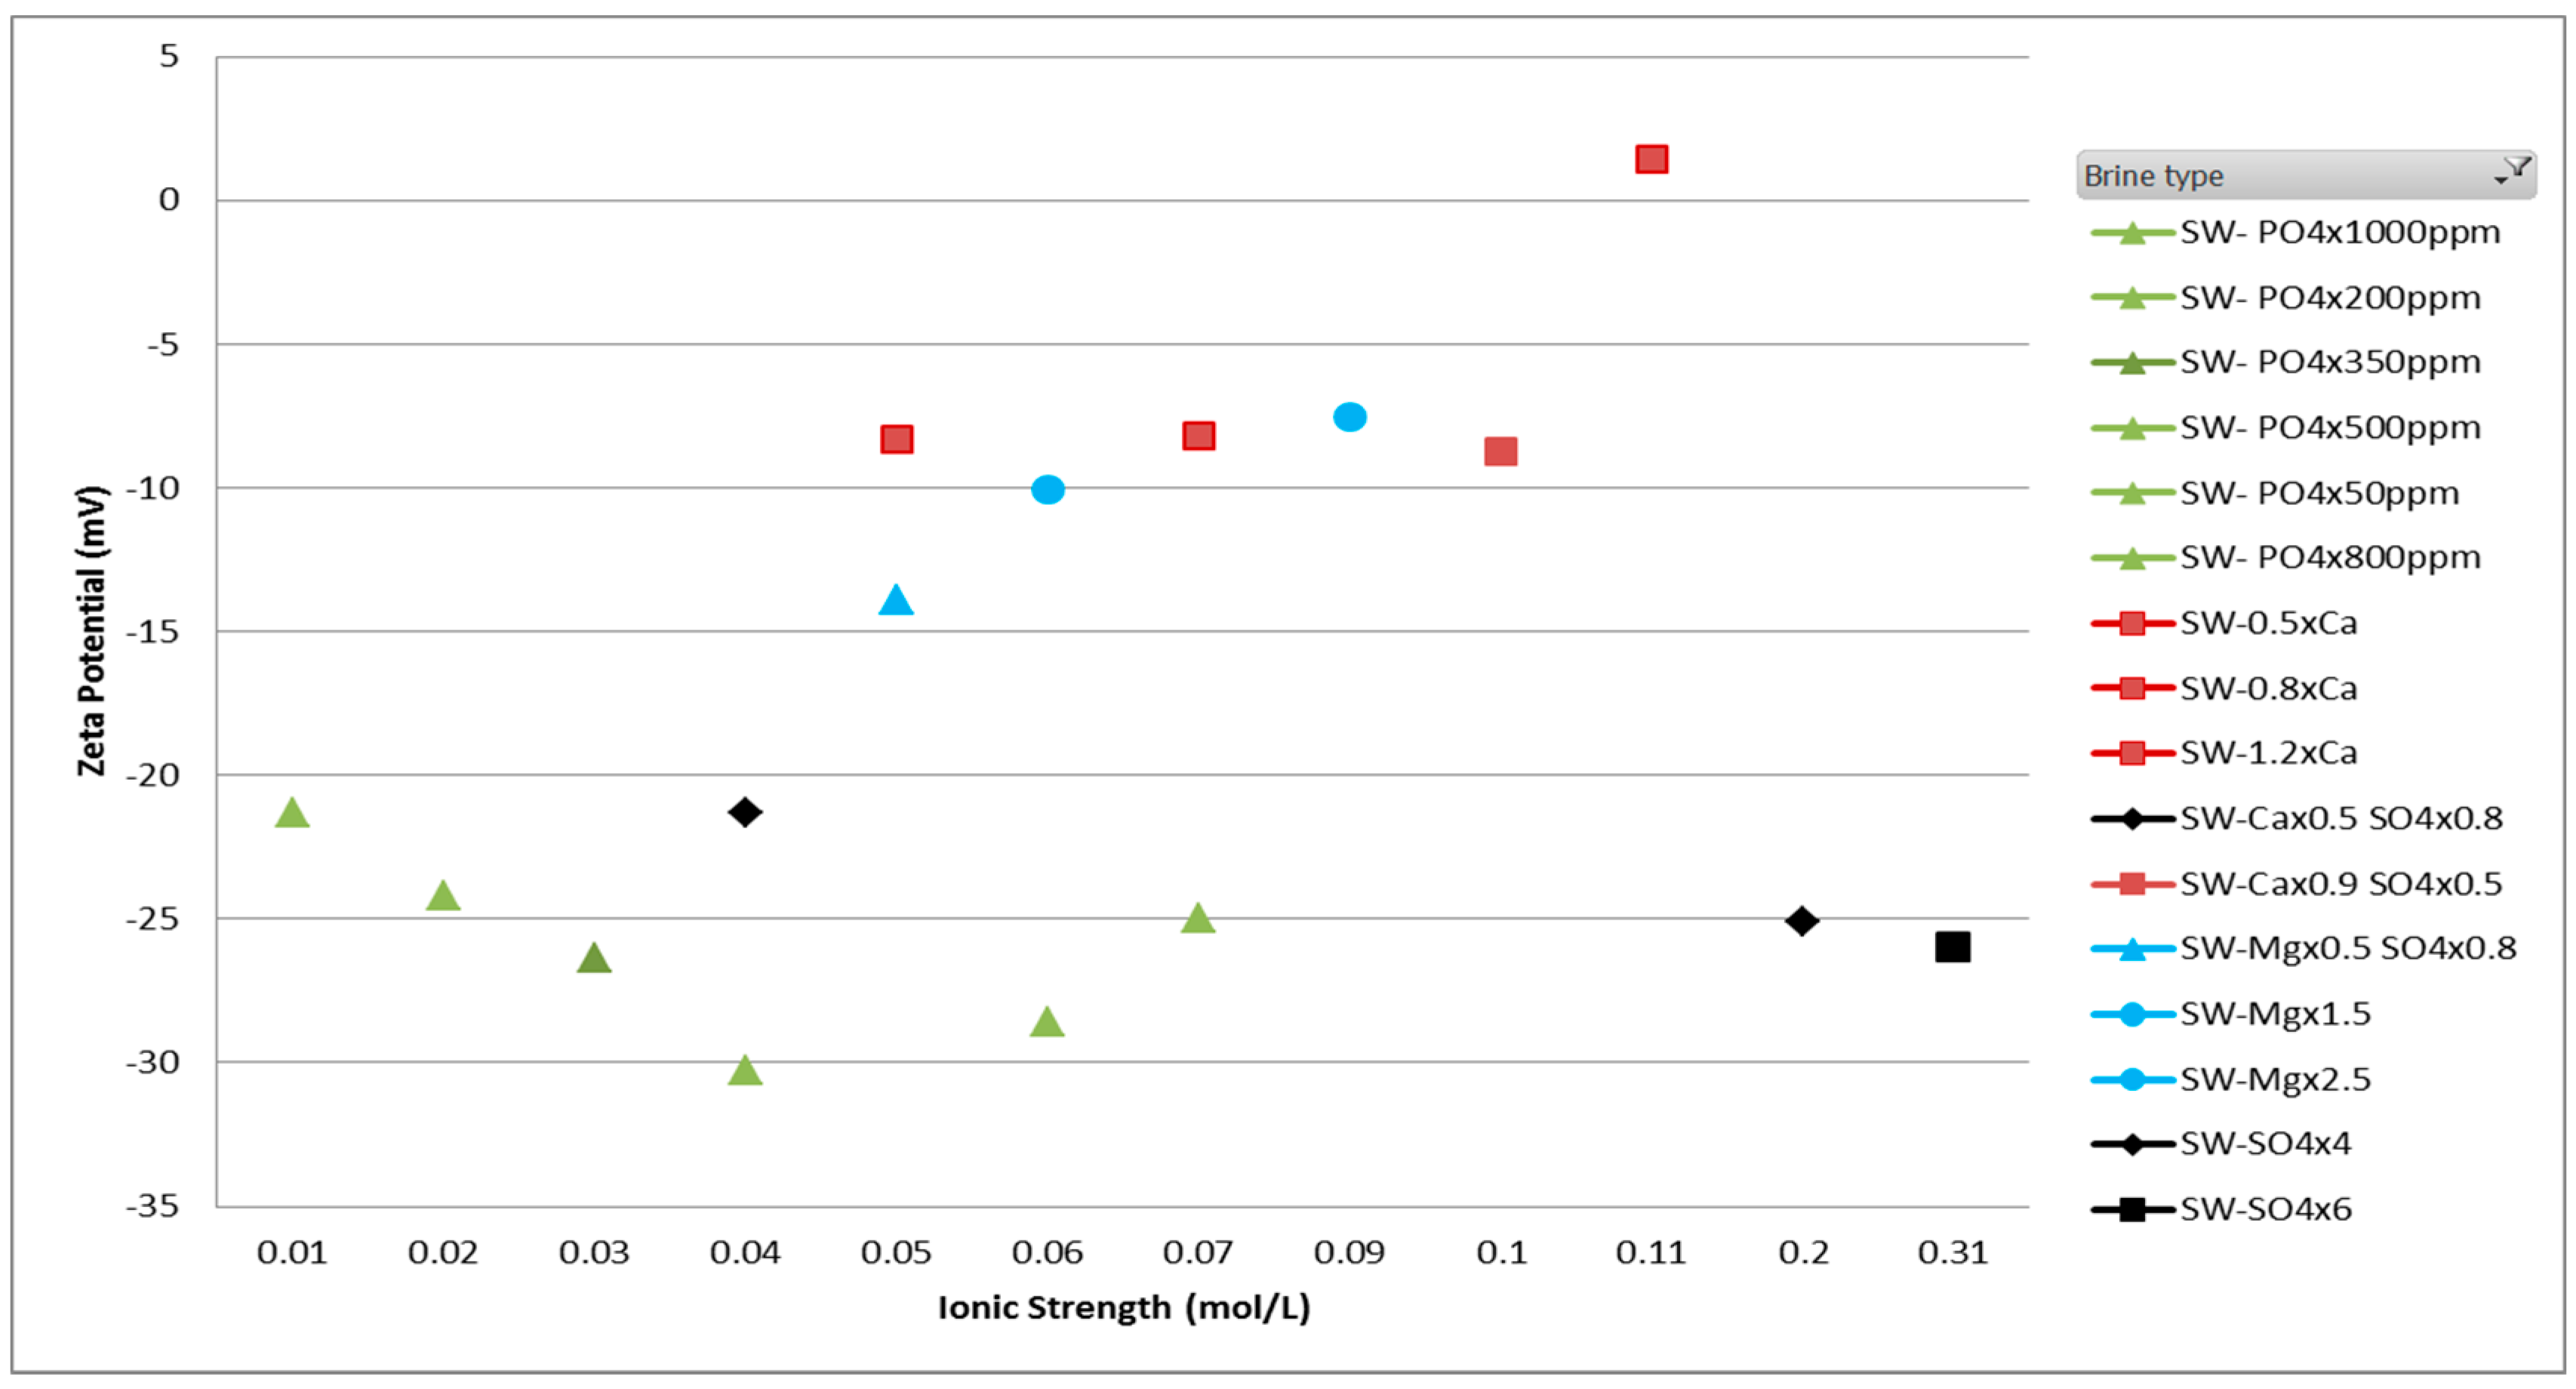
3.1.2. Smart/Modified Brines

Smart brine can also be termed as “modified-brine” owing to its different ionic chemistry as compared to formation or sea water. The injection of modified brine during a waterflood disturbs the existing equilibrium state at the rock-oil-brine interface which then tends to achieve a new equilibrium state between rock, oil and brine. This shift in existing equilibrium can also be described by a simultaneous change in zeta potential at the rock surface which may change the wettability to a more favorable state.
The results from smart brine study using zeta potentiometer are reported in Figure 5. A set of smart brines prepared by varying the concentration of specific PDIs were used to measure zeta potential using the using streaming current measurement. The different trend lines marked in different colors - red, blue, black and green depicts the zeta potential trend with calcium, magnesium, black and green, respectively.
The individual ion’s contribution can be inferred from the scatter plot. By the addition of calcium and magnesium ions to the smart brine, a more positive value of zeta potential is observed whereas by addition of sulfate and phosphate ion to the smart brine, a more negative value of zeta potential is observed. A detailed analysis of results has been done by Gopani et al. where it is reported that in order to separate adhered oil molecules from the rock surface, the zeta potential should be made either more negative or near zero [13]. A near zero value of zeta potential suggests a decrease in attractive forces keeping oil adhered to the rock surface and a more negative zeta potential suggests an increase in forces of repulsion between negatively charged oil and rock surface. Both the mechanisms can result in a more favorable wettability state.
As shown in Figure 5, the relationship of divalent cations and anions with zeta potential follows an opposite trend. An increase in concentration of Ca2+ and Mg2+ ions leads to more positive zeta potential while an increase in SO42+ and PO43− ion concentration causes an increase or more negative value of zeta potential. As discussed in the section of EDL theory, electrostatic repulsion between oil-brine and rock-brine leads to enhanced oil detachment.
The increase of negative rock surface charge due to sulfate spiking can be attributed to adsorption of sulfate ions due to its chemical affinity to form CaSO4 precipitates. This adsorption leads to an increase in forces of repulsion between two interfaces. Moreover, similar trend of zeta potential is observed with smart brines with varying PO4 ion concentration. It is important to note here that an increase in SO42+ and PO43− ions will not increase zeta potential indefinitely, instead will decrease after the concentration of precipitates such as CaSO4 and Ca3(PO4)2 has increased significantly to obstruct SO42+ and PO43− ions from rock surface.
For divalent ions, a chemical deposition of cations Ca2+ and Mg2+ ions are occur resulting from attraction to the negatively charged rock surface. However, as more cations get deposited, the rock surface moves to a point where the electrostatic force between two interfaces is minimum. Therefore, the net effect is detachment of oil molecules. It is interesting to note here that impact of Mg2+ ion is significantly lower than Ca2+ ion which correlates with published literature [22], where it was reported that Mg ions replace Ca2+ ions above temperature of 90 °C. Moreover, due to less solubility of MgSO4 than CaSO4, the activity of Mg2+ ions are further reduced.

3.2. Simulation Results

The results from core-scale simulation of corefloods from diluted as well as modified brines conducted to understand the specific role of ions, pH and the wettability altering mechanisms such as rock dissolution and EDL has been discussed in this section.

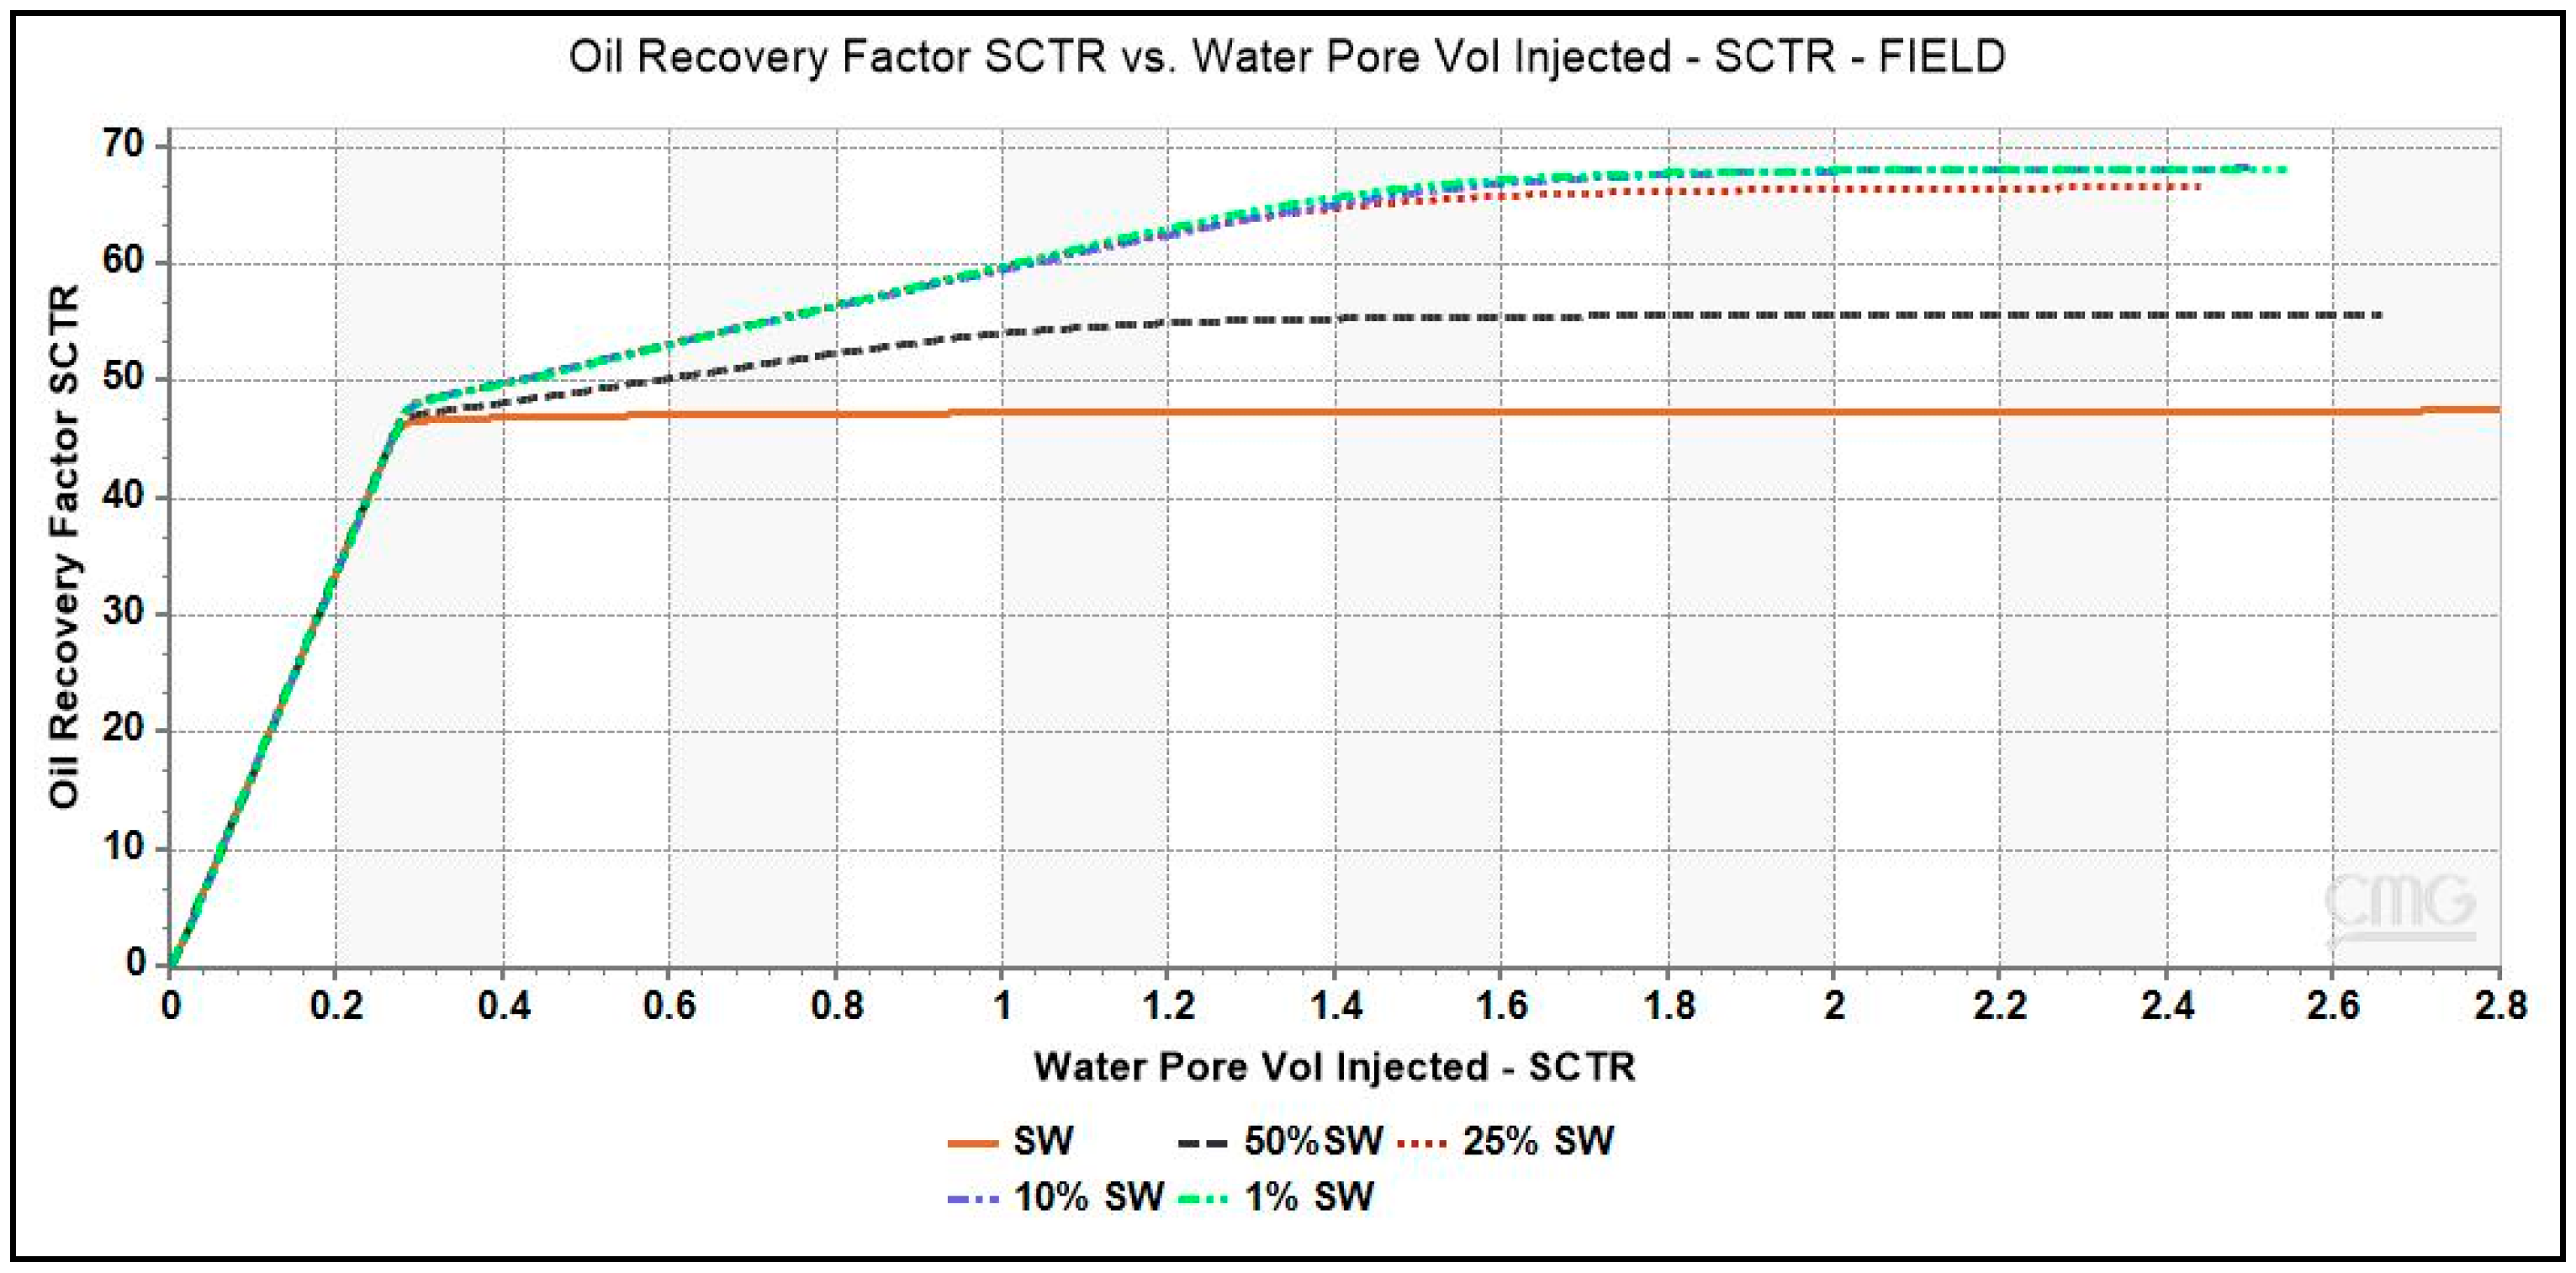
3.2.1. Diluted Brines and Underlying Mechanism

The plots of oil recovery factor as a function of brine pore volume injected for low-salinity brines simulated in a single porosity model illustrated in Figure 6. The simulation with seawater reported an oil recovery factor of 47.5%. An incremental oil recovery of 8.5% and 20.5% is seen with 50% dSW and 25% dSW brines respectively. It is interesting to note that both the brines namely, 10% dSW and 1% dSW reported similar incremental recovery of 21.5% which is also the maximum value obtained from our simulation study with diluted brines. Several parameters such as pH, moles of Ca2+ ions and mineral calcite present in the core during the injection period have been analyzed to understand the underlying mechanism of LSWF.
The pH variation as a function of lateral distance from injector to producer at the end of simulation runs and for block is shown in Figure 7. The initial pH of the brine inside the core was kept as 8.0. The plot shows that there is a systematic increase in the pH or basicity as level of dilution is increased from SW to 1% dSW. The plot of aqueous solution’s pH inside the core during the injection cycle of each diluted brine is also shown in Figure 7. This increase in pH is also reflected in this plot where pH of the brine increases to as high as ~9.4 during 1% dSW flooding.
The increase in basic nature of water can be attributed to the dissolution of calcite (CaCO3) mineral by injected water which produces HCO3 compound by the reaction presented in Equation (1) [23]. This equation has been modeled in the simulator as shown in Table 3 under Section 2.3.2 of this paper:
CaCO3 + CO2 + H2O → Ca2+ 2 HCO3
This equation has been modeled in the simulator as shown in Table 3 under Section 2.3.2 of this paper. The comparison of profiles of Ca2+ ions across the core at the end of coreflood with seawater and other diluted brines is given in Figure 7. The increase in the concentration of calcite is evidenced by the increase in values of Ca2+ ion concentration near the injector. In order to find reason behind the increase in Ca2+ ion, plot of the amount of mineral calcite in the injection well block – {1 1 1} against injection time is depicted in Figure 8. The negative values of mineral calcite imply that there has been significant dissolution of calcite mineral after injection of LS brine. Moreover, the dissolution seems to be more pronounced for 1% dSW than SW which directly correlated with the higher incremental oil recovery observed for 1% dSW.
The saturation index given by the ratio of activity product (Qα) to the equilibrium constant (Keq) for any chemical reaction was plotted for different diluted brines as shown in Figure 8. It clearly indicates that the mineral reaction given in Equation (1) has progressed forward and calcite dissolution has occurred. It is important to note here that mineral dissolution took place but only in block – {1 1 1} where the injection well was placed and did not propagate further towards the production well. This is seen from the Ca2+ ion concentration profile across the core in Figure 7. The simulation model also gave an output parameter, ‘Del Por Mineral’ to account for porosity change because of mineral dissolution/precipitation. A negative value indicates dissolution while positive value indicates precipitation. Figure 8 also shows this parameter plotted as a function of distance at the end of LS corefloods. A negative value indicating dissolution of calcite is evidenced from Figure 8, but it is only observed in first block of the grid model which throws doubt on the propagation of dissolution away from the first block.
Therefore, the underlying mechanism for low-salinity water flooding from simulation results could be rock dissolution but it needs to be verified by ionic analysis of effluent from coreflooding experiments in lab. Moreover, it is difficult to comment on the propagation of mineral dissolution away from the injection well at field scale.

3.2.2. Smart/Modified Brines and Underlying Mechanism

Simulation runs with different smart brines were conducted and the oil recovery factor was plotted against injection time were plotted. To understand the effect of monovalent and divalent ions in LSWF in carbonates, brines depleted in Na+ and Cl ions, and Ca2+ ion were used in the simulation run. As shown in Figure 9, oil recovery obtained from the smart brine, SW- 0 × Na, 0 × Ca amounting to ~68% is greater than that of SW. This recovery is equivalent to an incremental recovery of 20.5%.
The increase in recovery from the removal of Na+ and Cl ions from the injection brine can be attributed to an expansion of double layer resulting in an enhanced electrostatic repulsion between oil-brine and rock-brine interfaces. Some studies [24,25] have reported that the monovalent ions especially Na+ and Cl do not interact with the carbonate surface within the stern layer. Instead, they control the admittance of PDIs onto the rock surface by staying in the outer diffuse layer. The high saline seawater due to its high concentration of Na+ and Cl ions will obstruct the PDIs from interacting with the rock surface, causing no change to the electrostatic attraction between two interfaces, oil-brine and rock-brine interfaces. The state at the rock surface will be overall positive charge and oil-wet. Due to depletion of monovalent ions in brine, SW-0 × Na, 0 × Cl as compared to SW, an expansion of double layer occurred resulting in an electrostatic repulsion or a higher or positive disjoining pressure between the two interfaces. This leads to a more stable water film which is comparatively thicker leaving the rock slightly more water-wet than before [1].
It is intriguing to note here that no additional recovery is obtained from smart brine, SW-0 × Ca. Comparing the concentration of both smart brines, brine with higher recovery had greater concentration of Ca2+ ion than the smart brine with depleted Ca2+ ion concentration. Therefore, the presence of Ca2+ ion in injection brine composition becomes vital for screening of LSWF technology to carbonate reservoir.

4. Conclusions

In this paper, a critical analysis of the wettability alteration mechanism mainly rock dissolution and electric double layer are presented by a combined study of zeta potential estimation and lab-scale simulation studies. Considering the experimental limitations and the assumptions made during the study, the following conclusions are drawn from our observations and analyses:
(1)
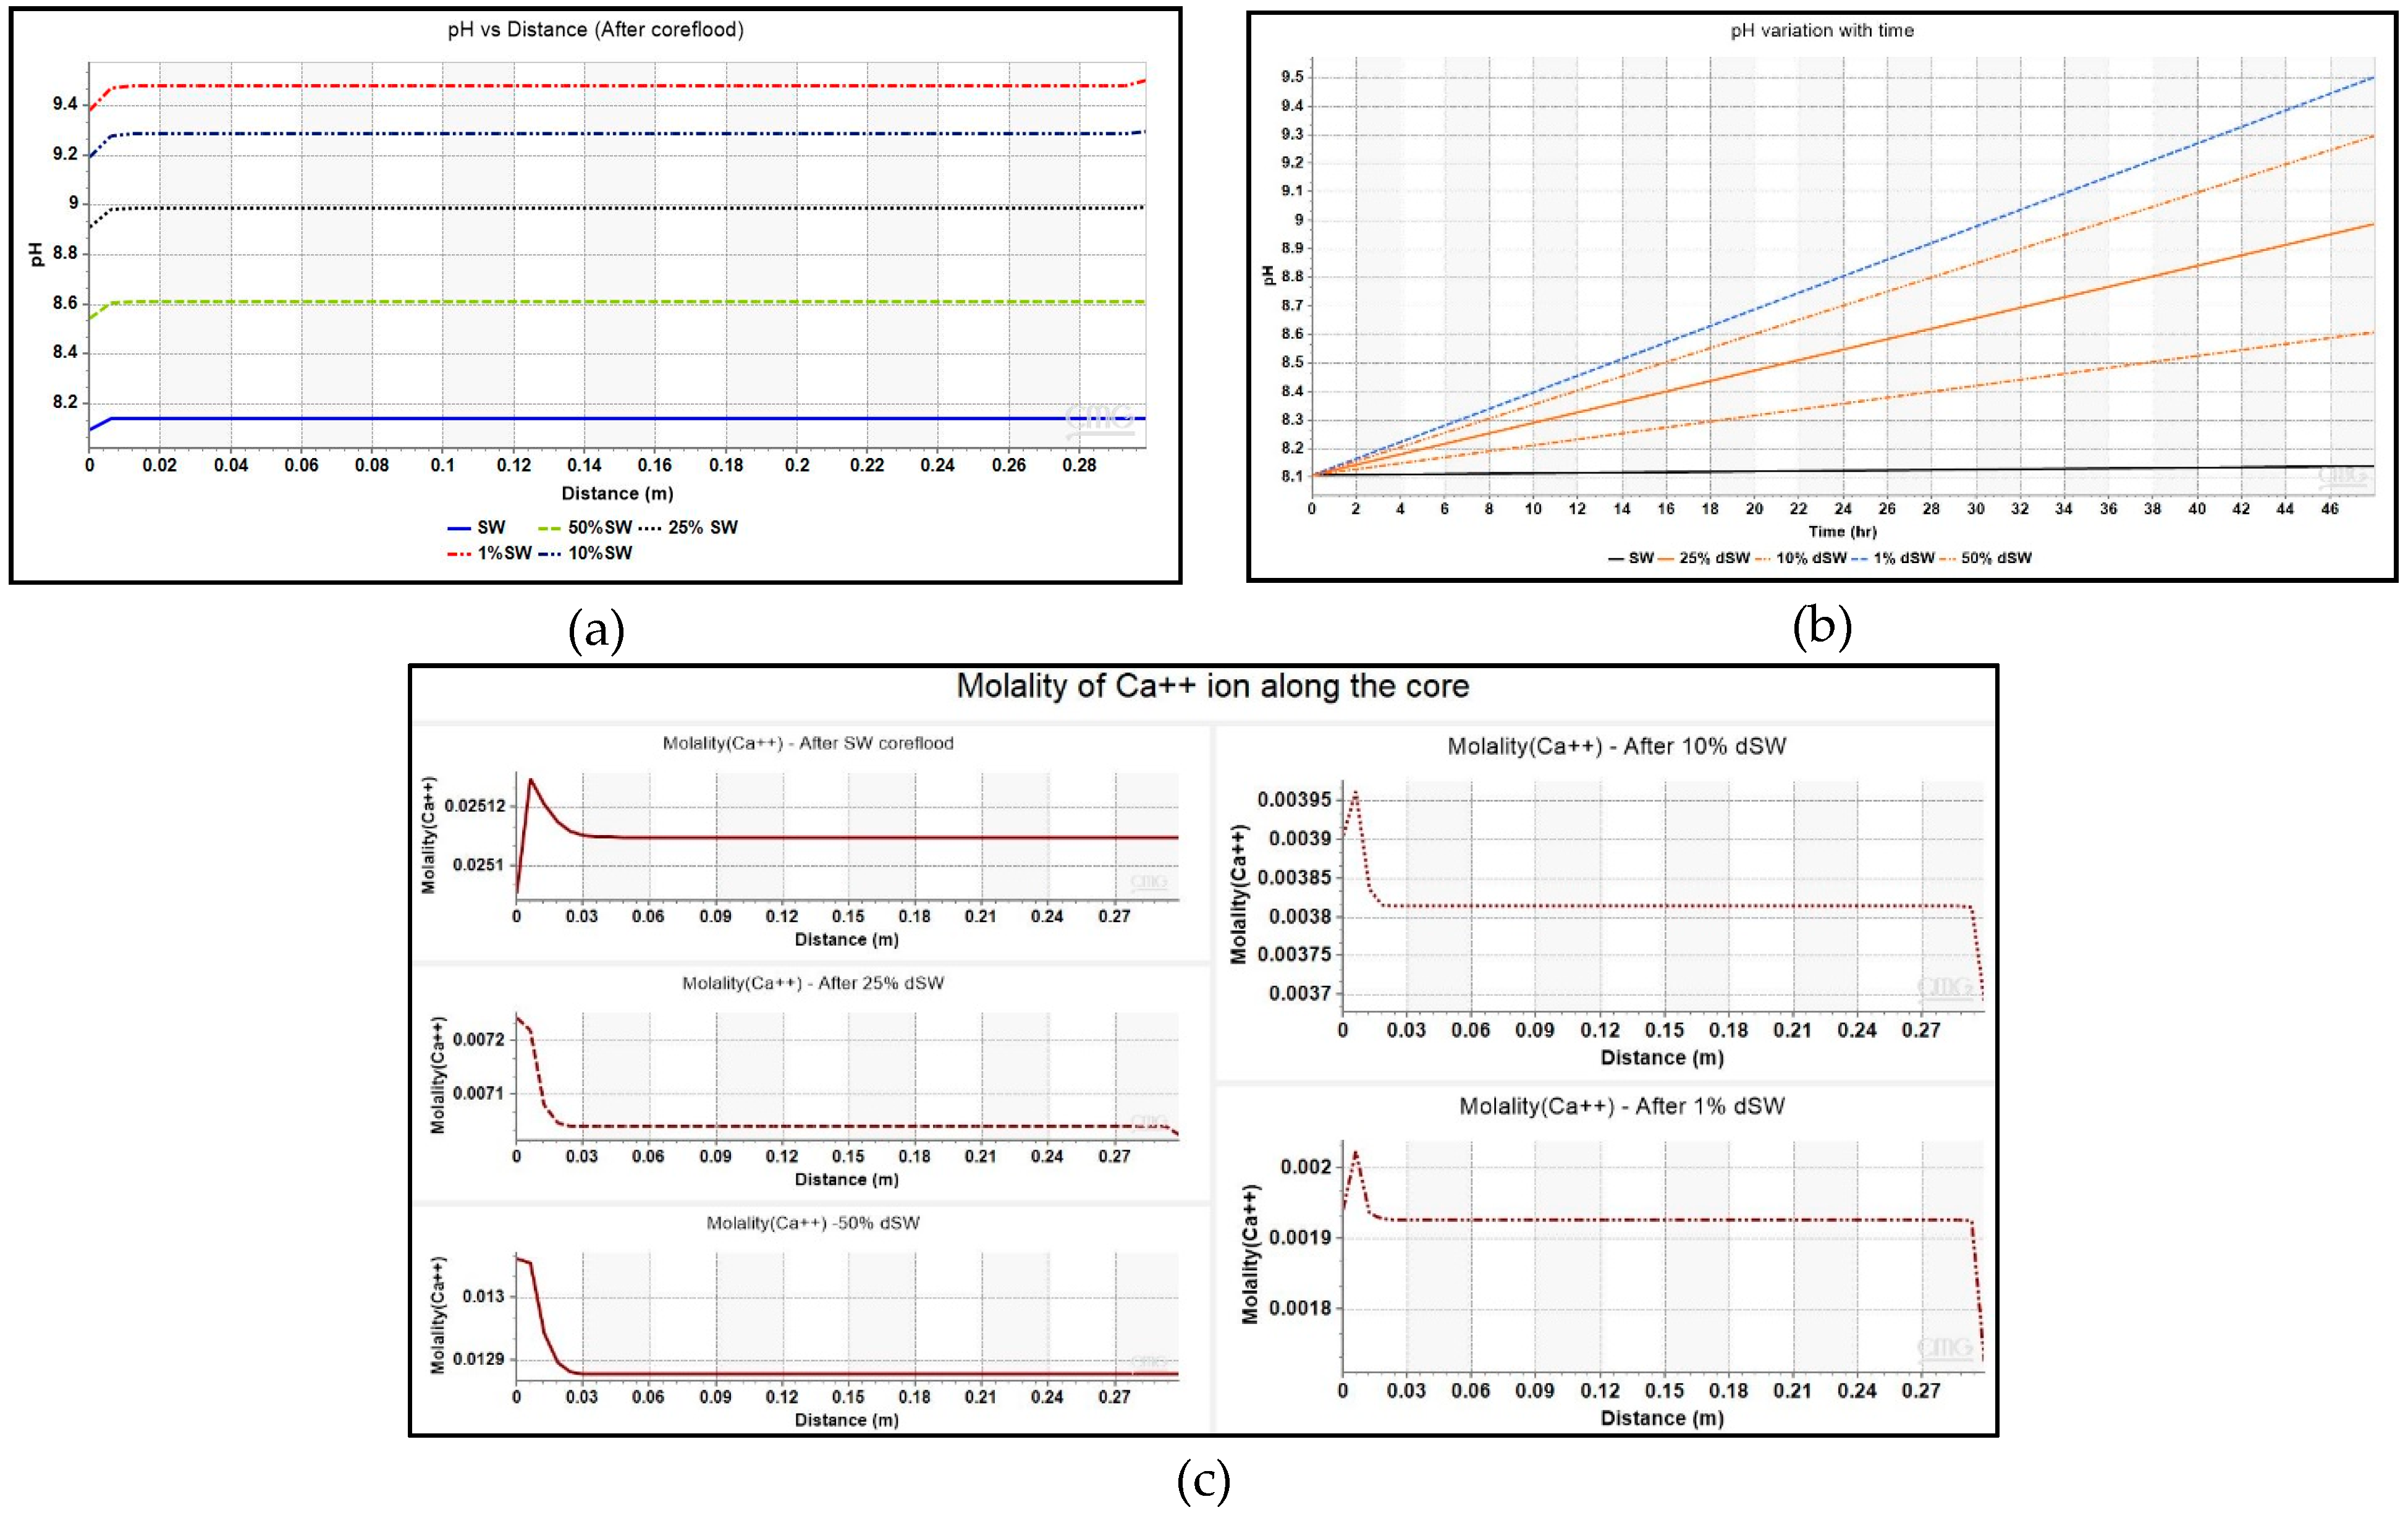
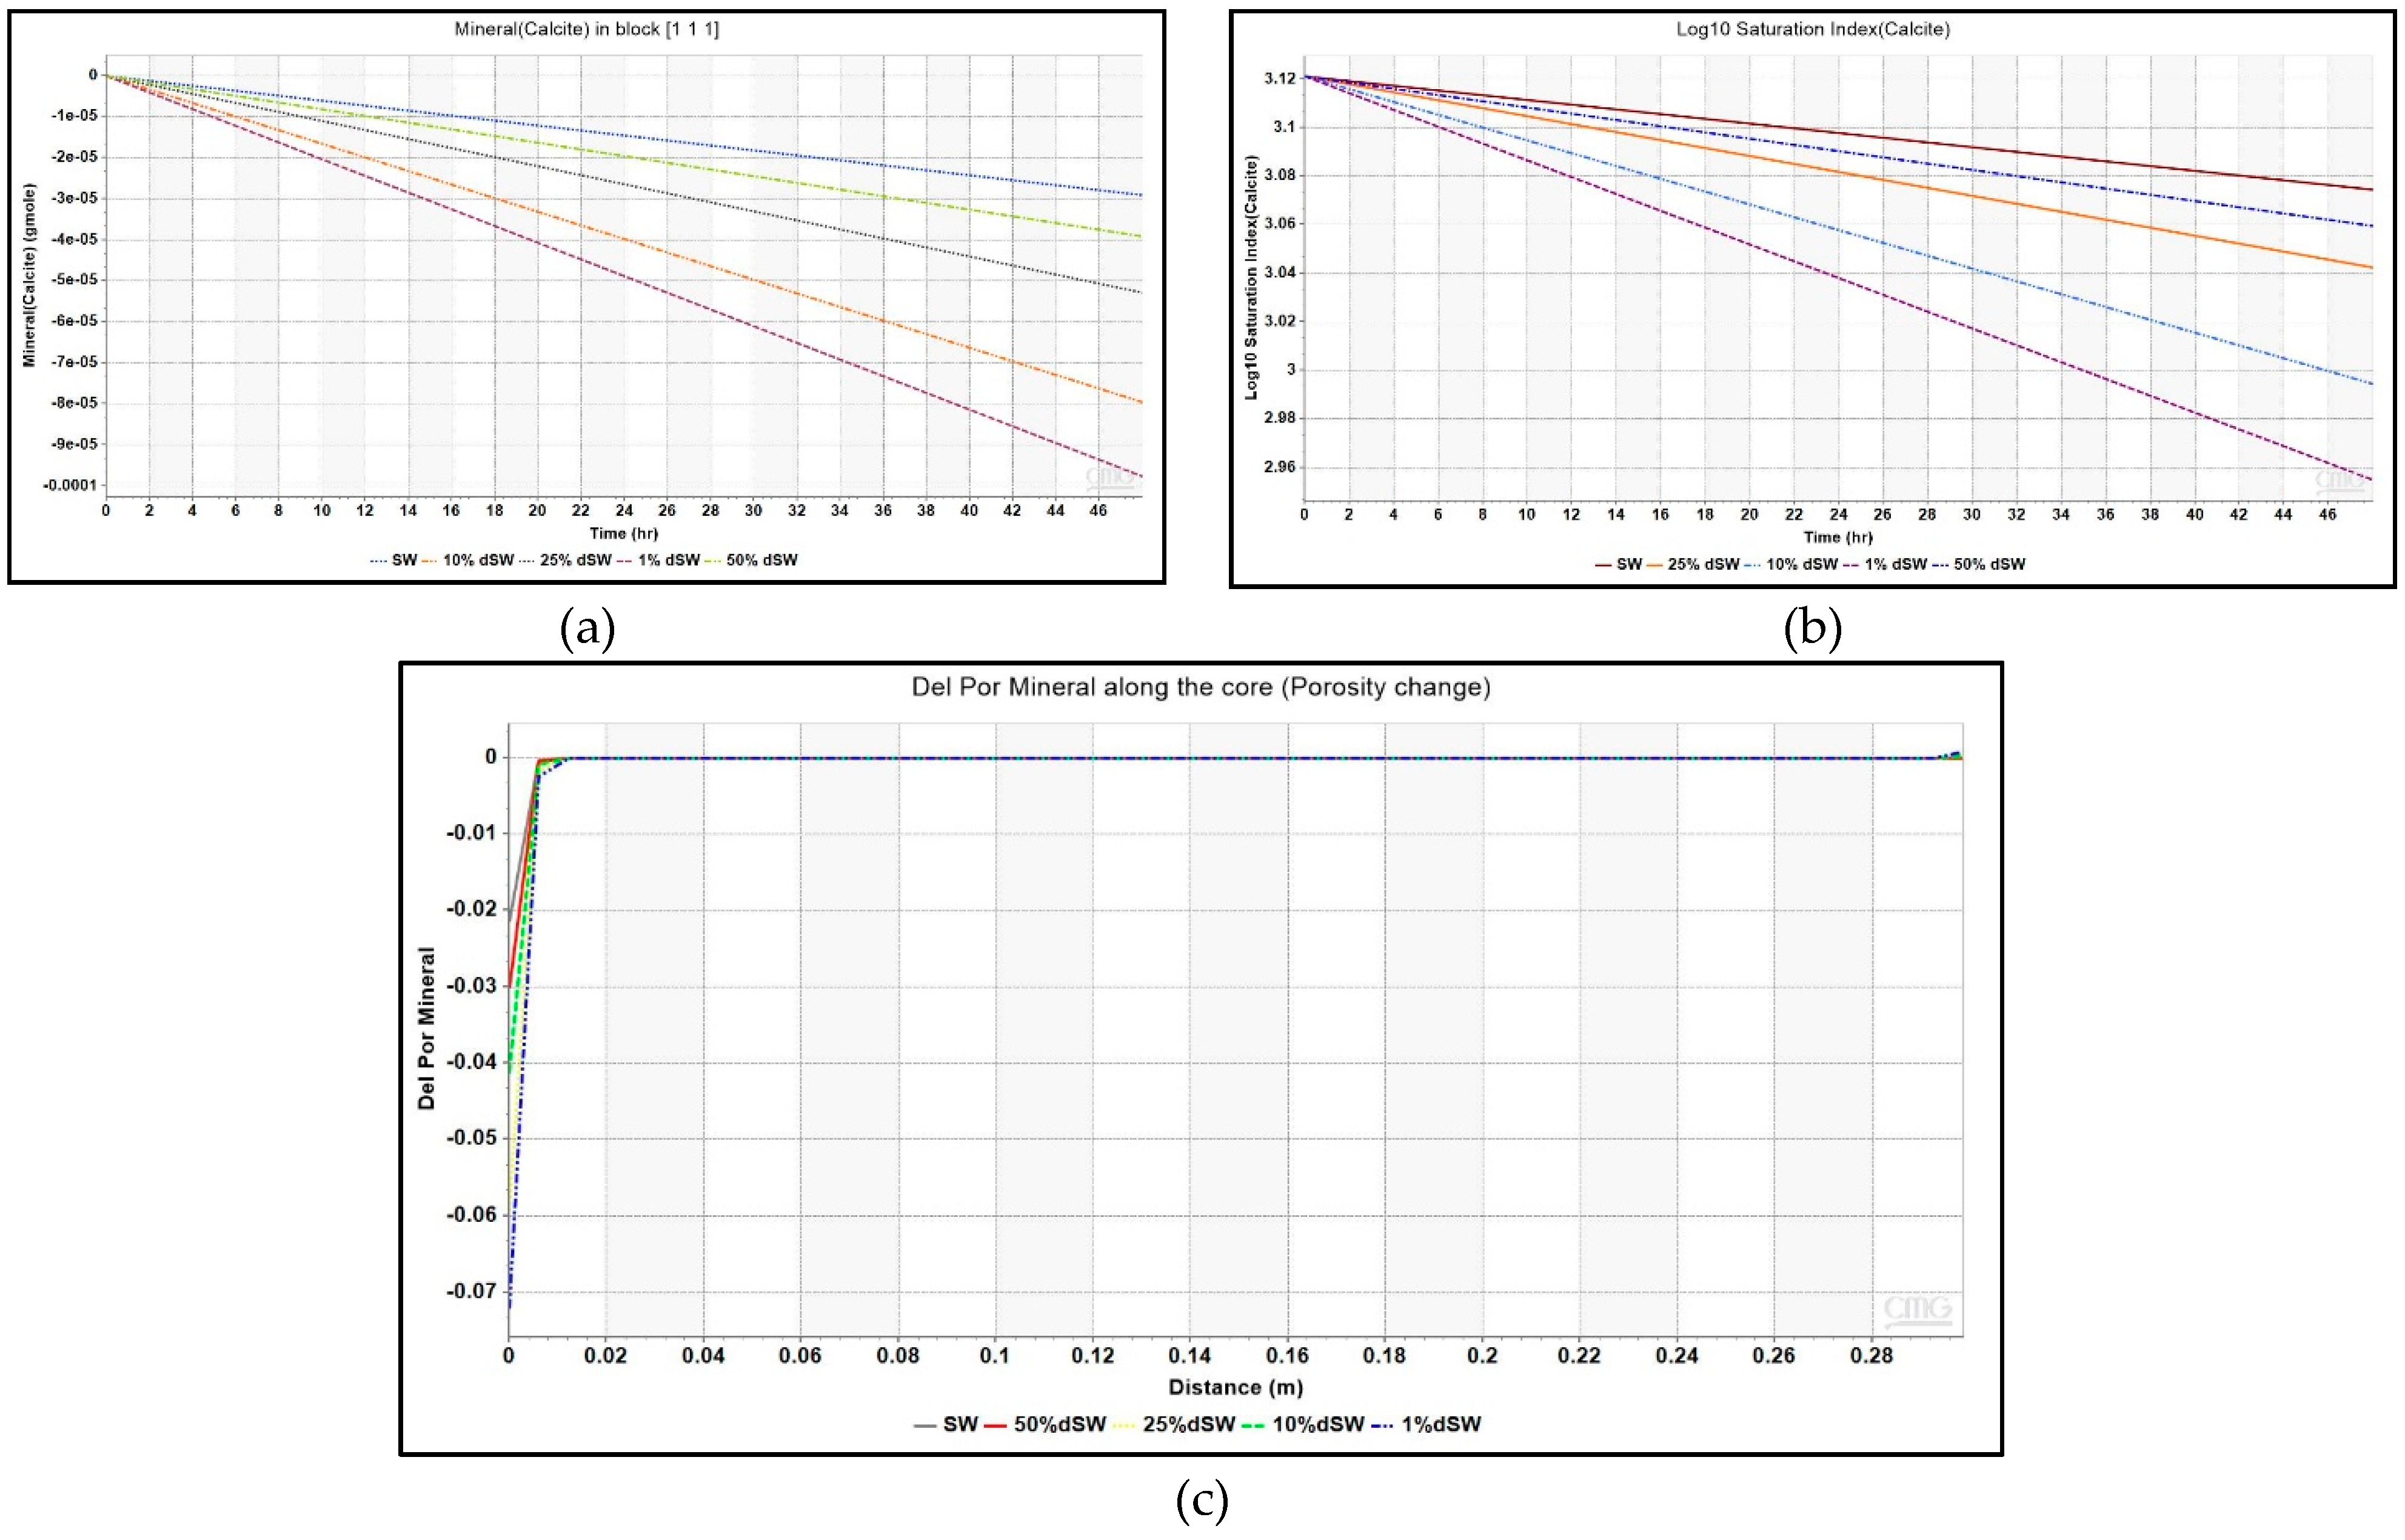
Additional oil recovery is obtained from low-salinity waterflooding as observed from the increasing trend of zeta potential and oil recovery. Maximum incremental oil recovery is given by 1% dSW which correlated with the analysis of pH, moles of calcite, saturation index and Ca2+ ion profiles presented in this paper showed that rock dissolution as the underlying mechanism.
(2)
The impact of PDIs has been studied in this paper and following conclusions can be drawn from it: (a) For enhanced oil recovery, brine spiked with Ca2+ ion is preferred such that the magnitude of zeta potential is close to zero which ensures minimum attractive forces between adhered oil molecules and the rock surface. (b) Less active role is observed for Mg ion as compared to Ca ion due to the relatively lower solubility of MgSO4 in brine at ambient conditions. (c) Brines can also be spiked with divalent anions, SO42+ and PO43− owing to the oil detachment from repulsive forces due to their adsorption.
(3)
Additional oil recovery of 20.5% resulted from seawater depleted of Na+ and Cl ions from sea water whereas seawater depleted of only Ca2+ ions gave no additional oil. The underlying mechanism is explained by the resultant increase in electrostatic repulsive forces from expansion of electrical double layer but needs to be further confirmed by surface complexation modeling of surface and electrostatic interactions.
(4)
As seen from simulation study, only the injection gridblock had evidence of calcite dissolution taking place. Therefore, the applicability of rock dissolution mechanism in field conditions is highly doubtful as it may not propagate further into the reservoir.
The work conducted in this study can be further extended by developing a surface complexation model to study wettability alteration mechanism by predicting disjoining pressure and zeta potential for various LS and smart brines. Furthermore, a field-scale simulation model can also be developed using geochemical reactions to optimize concentration of PDIs in injection brine at field scale.

Author Contributions

P.H.G. was involved in experimental study, analysis of results, manuscript preparation. N.S. was involved in experimental study and analysis. H.K.S. was involved in the development of grant proposal, developing research plan to meet study objectives, analysis of research results and conclusions presented and the overall supervision and project administration. P.M. and V.R.S. provided technical input towards data analysis and manuscript preparation. All authors have read and agreed to the published version of the manuscript.

Funding

Authors thankfully acknowledge the primary funding provided for this study by Oil and Natural Gas Corporation Limited (ONGCL) of India, and partial funding through an NSERC Discovery Grant.

Institutional Review Board Statement

Not applicable.

Informed Consent Statement

Not applicable.

Data Availability Statement

Restrictions apply to the availability of these data. Data was obtained from funding sponsor and is bound by the confidentiality agreement.

Acknowledgments

Authors also thank ONGCL and University of Calgary for the permission to publish this paper, Digamber S. Negi of ONGCL for his input during the study and Thomas Luxbacher of Anton Paar for his contributions in the Zeta potentiometric studies.

Conflicts of Interest

The authors declare that they have no known competing interests.

References

  1. Awolayo, A.N.; Sarma, H.K.; Nghiem, L.X. Brine-Dependent Recovery Processes in Carbonate and Sandstone Petroleum Reservoirs: Review of Laboratory-Field Studies, Interfacial Mechanisms and Modeling Attempts. Energies 2018, 11, 3020. [Google Scholar] [CrossRef] [Green Version]
  2. Awolayo, A.N. Impact of Multi-ion Interactions on Oil Mobilization by Smart Waterflooding in Carbonate Reservoirs. J. Pet. Environ. Biotechnol. 2016, 7, 1–8. [Google Scholar] [CrossRef]
  3. Al-Shalabi, E.W.; Sepehrnoori, K. A Comprehensive Review of Low Salinity/engineered Water Injections and Their Applications in Sandstone and Carbonate Rocks. J. Pet. Sci. Eng. 2016, 139, 137–161. [Google Scholar] [CrossRef]
  4. Dehaghani, A.H.S.; Badizad, M.H. Impact of ionic composition on modulating wetting preference of calcite surface: Implication for chemically tuned water flooding. Colloids Surfaces A Physicochem. Eng. Asp. 2019, 568, 470–480. [Google Scholar] [CrossRef]
  5. Fathi, S.J.; Austad, T.; Strand, S. Water-Based Enhanced Oil Recovery (EOR) by “Smart Water”: Optimal Ionic Composition for EOR in Carbonates. Energy Fuels 2011, 25, 5173–5179. [Google Scholar] [CrossRef] [Green Version]
  6. Mahani, H.; Keya, A.L.; Berg, S.; Bartels, W.-B.; Nasralla, R.A.; Rossen, W.R. Insights into the Mechanism of Wettability Alteration by Low-Salinity Flooding (LSF) in Carbonates. Energy Fuels 2015, 29, 1352–1367. [Google Scholar] [CrossRef]
  7. Hiorth, A.; Cathles, L.M.; Madland, M.V. The Impact of Pore Water Chemistry on Carbonate Surface Charge and Oil Wettability. Transp. Porous Media 2010, 85, 1–21. [Google Scholar] [CrossRef]
  8. Austad, T.; Strand, S.; Puntervold, T. Is Wettability Alteration of Carbonates by Seawater Caused by Rock Dissolution. In Paper SCA2009-43 presented at the International Symposium of the Society of Core Analysts, Noordwijk, The Netherlands, 27–30 September 2009; pp. 27–30. [Google Scholar]
  9. Mahani, H.; Keya, A.L.; Berg, S.; Nasralla, R. Electrokinetics of Carbonate/Brine Interface in Low-Salinity Waterflooding: Effect of Brine Salinity, Composition, Rock Type, and pH on ζ-Potential and a Surface-Complexation Model. SPE J. 2017, 22, 053–068. [Google Scholar] [CrossRef]
  10. Glover, P. Geophysical Properties of the Near Surface Earth: Electrical Properties. In Treatise on Geophysics; Elsevier: Amsterdam, The Netherlands, 2015; Volume 11, pp. 89–137. [Google Scholar]
  11. Jackson, M.D.; Al-Mahrouqi, D.; Vinogradov, J. Zeta potential in oil-water-carbonate systems and its impact on oil recovery during controlled salinity water-flooding. Sci. Rep. 2016, 6, 37363. [Google Scholar] [CrossRef] [PubMed] [Green Version]
  12. Al-Hashim, H.; Kasha, A.A.; Abdallah, W.A.; Sauerer, B. Impact of Modified Seawater on Zeta Potential and Morphology of Calcite and Dolomite Aged with Stearic Acid. Energy Fuels 2018, 32, 1644–1656. [Google Scholar] [CrossRef]
  13. Gopani, P.H.; Singh, N.; Sarma, H.K.; Mattey, P.S.; Negi, D.S. A Zeta Potentiometric Study On Effects of Ionic Composition And Rock-Saturation On Surface-Charge Interactions In Low-Salinity Water Flooding For Carbonate Formation. In Proceedings of the SPE-200804-MS at the 2020 SPE Western Regional Meeting, Bakersfield, CA, USA. (Meeting Postponed to a Later Date due to Pandemic).
  14. Luxbacher, T. The Streaming Potential Technique. In The Zeta Guide—Principles of the Streaming Potential Technique, 1st ed.; Chapter 4.1; Anton Paar GmbH: Austria, Europe, 2014; pp. 27–30. [Google Scholar]
  15. Dang, C.T.Q.; Nghiem, L.X.; Chen, Z.; Nguyen, Q.P. Modeling Low Salinity Waterflooding: Ion Exchange, Geochemistry and Wettability Alteration. In Proceedings of the SPE Annual Technical Conference and Exhibition, Society of Petroleum Engineers (SPE), New Orleans, LA, USA, 30 September–2 October 2013. [Google Scholar]
  16. Kharaka, Y.; Gunter, W.; Aggarwal, P.; Perkins, E.; DeBraal, J. SOLMINEQ.88; A Computer Program for Geochemical Modeling of Water-Rock Interactions; US Geological Survey: Reston, VA, USA, 1988.
  17. Rollinson, H. CM Bethke Geochemical Reaction Modeling. New York, Oxford (Oxford University Press). 1996, xvii+ 397 pp. Price£ 37.95. ISBN 0-19-509475-1. Mineral. Mag. 1997, 61, 611–612. [Google Scholar] [CrossRef]
  18. Kakati, A.; Jha, N.K.; Kumar, G.; Sangwai, J.S. Application of Low Salinity Water Flooding for Light Paraffinic Crude Oil Reservoir. In Proceedings of the SPE Symposium: Production Enhancement and Cost Optimisation, Kuala Lumpur, Malaysia, 7–8 November 2017; Society of Petroleum Engineers (SPE), 2017. [Google Scholar] [CrossRef]
  19. Singh, N.; Gopani, P.H.; Sarma, H.K.; Mattey, P.S.; Negi, D.S. Characterization of Rock and Fluid Properties for Low-Salinity Water Flooding of Highly Paraffinic Oil in a Deep Low-Permeability High-Pressure High-Temperature Offshore Carbonate Reservoir. In International Conference on Offshore Mechanics and Arctic Engineering; American Society of Mechanical Engineers, 2020; Volume 84430, p. V011T11A008. [Google Scholar]
  20. Strand, S.; Austad, T.; Puntervold, T.; Høgnesen, E.J.; Olsen, M.; Barstad, S.M.F. “Smart water” for oil recovery from fractured limestone: A preliminary study. Energy Fuels 2008, 22, 3126–3133. [Google Scholar] [CrossRef] [Green Version]
  21. Alroudhan, A.; Vinogradov, J.; Jackson, M. Zeta potential of intact natural limestone: Impact of potential-determining ions Ca, Mg and SO4. Colloids Surfaces A Physicochem. Eng. Asp. 2016, 493, 83–98. [Google Scholar] [CrossRef] [Green Version]
  22. Zhang, P.; Tweheyo, M.T.; Austad, T. Wettability alteration and improved oil recovery by spontaneous imbibition of seawater into chalk: Impact of the potential determining ions Ca2+, Mg2+, and SO42−. Colloids Surfaces A Physicochem. Eng. Asp. 2007, 301, 199–208. [Google Scholar] [CrossRef]
  23. Montenegro, A.; Brovkin, V.; Eby, M.; Archer, D.; Weaver, A.J. Long term fate of anthropogenic carbon. Geophys. Res. Lett. 2007, 34. [Google Scholar] [CrossRef]
  24. Fathi, S.J.; Austad, T.; Strand, S. “Smart Water” as a Wettability Modifier in Chalk: The Effect of Salinity and Ionic Composition. Energy Fuels 2010, 24, 2514–2519. [Google Scholar] [CrossRef] [Green Version]
  25. Shariatpanahi, S.F.; Strand, S.; Austad, T. Evaluation of Water-Based Enhanced Oil Recovery (EOR) by Wettability Alteration in a Low-Permeable Fractured Limestone Oil Reservoir. Energy Fuels 2010, 24, 5997–6008. [Google Scholar] [CrossRef]
Figure 1. Results of XRD analysis of six different rock samples which shows that the rock is composed of dominantly calcite with traces of dolomite and quartz.
Energies 14 00729 g001
Figure 2. Single porosity reservoir model used in the simulation study.
Energies 14 00729 g002
Figure 3. Zeta potential of various brines as a function of pH measurement of each brine.
Energies 14 00729 g003
Figure 4. Zeta potential results of Diluted Brines with Ionic strength. The arrow direction depicts the trend of increasing zeta potential.
Energies 14 00729 g004
Figure 5. Zeta potential results of smart brines with ionic strength to show the effect of PDIs—SO42−, Ca2+ and Mg2+. Trend lines with arrows indicate the zeta potential trend with increasing concentration of each ion.
Energies 14 00729 g005
Figure 6. Oil Recovery factor vs. brine pore volume injected for various diluted brines. LS brines, 1% dSW and 10% dSW showed maximum incremental oil recovery.
Energies 14 00729 g006
Figure 7. (a)Trend of pH variation with distance (injector to producer) for coreflooding with different low-salinity brines, (b) pH change of brine inside the core as a function of injection time, and (c) Molality of Ca2+ ion as a function of lateral distance along the core for various diluted brines.
Energies 14 00729 g007
Figure 8. (a) Mineral moles of calcite for various brines as a function of injection time, (b) Saturation index for various diluted brines as a function of injection time for injection block – {1 1 1}, and (c) Change in porosity given by the parameter – Del Por Mineral due to mineral deposition against lateral distance along the core.
Energies 14 00729 g008
Figure 9. Oil Recovery factor vs. brine pore volume injected for different smart brines from simulation results. Depleting SW of monovalent ions, Na+ and Cl ions have more dominant effect than removing the divalent Ca2+ ions from SW.
Energies 14 00729 g009
Table 1. Ionic concentrations, TDS, pH, and Ionic strength of diluted brines.
IonsSW50%SW25%SW10%SW1%SW
Na+ (ppm)11,638.00 58192909.51163.8116.38
Ca2+ (ppm)1101550.5275.25110.111.01
Mg2+ (ppm)265132.566.2526.52.65
Cl (ppm)20,913.00 10,456.50 5228.252091.3209.13
SO42− (ppm)1198599299.5119.811.98
HCO3 (ppm)857428.5214.2585.78.57
Sr (ppm)502512.550.5
Total Dissolved Solids (ppm) 36,022.00 18,011.00 9005.53602.2360.22
Ionic Strength (mol/L)0.660.330.170.070.01
pH87.87.737.657.26
x%SW—concentration reduced to x%.
Table 2. Ionic concentrations, TDS, pH, and ionic strength of modified brines.
Modified-BrinesNa (ppm)Ca2+ (ppm)Mg2+ (ppm)Cl (ppm)SO42− (ppm)HCO3 (ppm)Sr+ (ppm)Total Dissolved Solids (ppm)Ionic Strength (mol/L)
SW—Sea Water11,638110126520,91311988575036,0220.66
SW—1.5 × Mg2+116.411400.21368.4128.60.519170.06
SW—2.5 × Mg2+116.411665.22141.3128.60.52954.90.09
SW—0.9 × Ca2+, 0.5 × SO42−403.41001.92.71963.86118.60.53991.80.1
SW—0.5 × Ca2+, 0.8 × SO42−575.6143.52.7443.8970.48.60.521450.05
SW—0.5 × Ca2+, 1 × Mg2+, 0.8 × SO42−575.6143.5267.71216.6970.48.60.53182.90.08
SW—0.5 × Ca2+, 1.4 × SO42−920143.52.7443.81689.28.60.53208.20.07
SW—0.5 × Mg2+, 0.8 × SO42−575.611135.2595.6970.48.60.52296.80.05
SW—4 × SO42−2412.5112.7209.148048.60.57448.40.16
SW—6 × SO42−3560.6112.7209.172008.60.510,992.50.23
SW—1.2 × Ca2+116.41332.22.72548.7128.60.540210.11
SW—0.8 × Ca2+116.4891.82.71768.8128.60.528010.07
SW—0.5 × Ca2+116.4561.52.71183.9128.60.518860.05
All brines are prepared with 1%dSW as base brine. The concentration of ions is spiked relative to the corresponding concentration in sea water.
Table 3. Geochemical reactions used in modeling low-salinity waterflooding using CMG’s GEM module.
Aqueous Reactions
1‘H+’ + ‘OH’ = ‘H2O’
2‘H+’ + ‘CO3’ = ‘HCO3
3‘CaSO4’ = ‘Ca++’ + ‘SO4
4‘MgSO4’ = ‘Ca++’ + ‘SO4
Mineral reactions
6‘Calcite’ + ‘H+’ = ‘Ca++’ + ‘HCO3
7‘Dolomite’ + ‘H+’ = ‘Ca++’ + ‘Mg++’ + 2 ‘HCO3
Table 4. Composition of the oil used in fluid model.
ComponentProportion (%)
C53.6
C65.3
C7+91.1
Table 5. Oil properties used to prepare fluid model.
Properties of the Crude Oil
Specific gravity0.85
API gravity36
Pour point33 °C
Wax Appearance Temperature55 °C
Wax Content (% wt)20
Viscosity @ 40 °C (cP)4–8
Table 6. Basic rock and petrophysical properties.
PropertyValue
Porosity (%)15.8
Porosity TypeSingle
kx (mD)0.14
ky (mD)0.14
kz (mD)0.05
Swirr (%)42
Length (inch)12
Width (inch)1
Height (inch)1
Number of grids in × dir.50
Publisher’s Note: MDPI stays neutral with regard to jurisdictional claims in published maps and institutional affiliations.

