
Theoretical and Experimental Analysis of Aerodynamic Noise in Small Wind Turbines

 , ,
, ,  ,
,  , , , , and
Abstract
:1. Introduction
2. Methods
- Turbulent-Boundary-Layer-Trailing-Edge (TBL-TE) Noise. It is the noise that occurred due to the formation of turbulence and wakes around the trailing edge of the airfoil.
- Laminar-Boundary-Layer Vortex-Shedding (LBL-VS) Noise. It occurs when a laminar boundary layer exists on any side of an airfoil.
- Separation-Stall Noise. This noise exists where the flow is separated around the airfoil.
- Trailing-Edge-Bluntness Vortex-Shedding (TEB-VS) Noise. It is the noise that is formed due to the vortex shedding caused by the bluntness of the trailing edge.
- Tip Vortex Formation Noise.
- Turbulent inflow noise is due to the characteristics of the incoming flow.
2.1. Noise Caused by the Turbulent Boundary Layer at the Trailing Edge and by the Flow Detachment
2.2. Noise Caused by Laminar Boundary Layer and Vortex Shedding (LBL-VS)
2.3. Noise Caused by Vortexes at the Tip of the Blade
2.4. Propagation Model
3. Case of Study
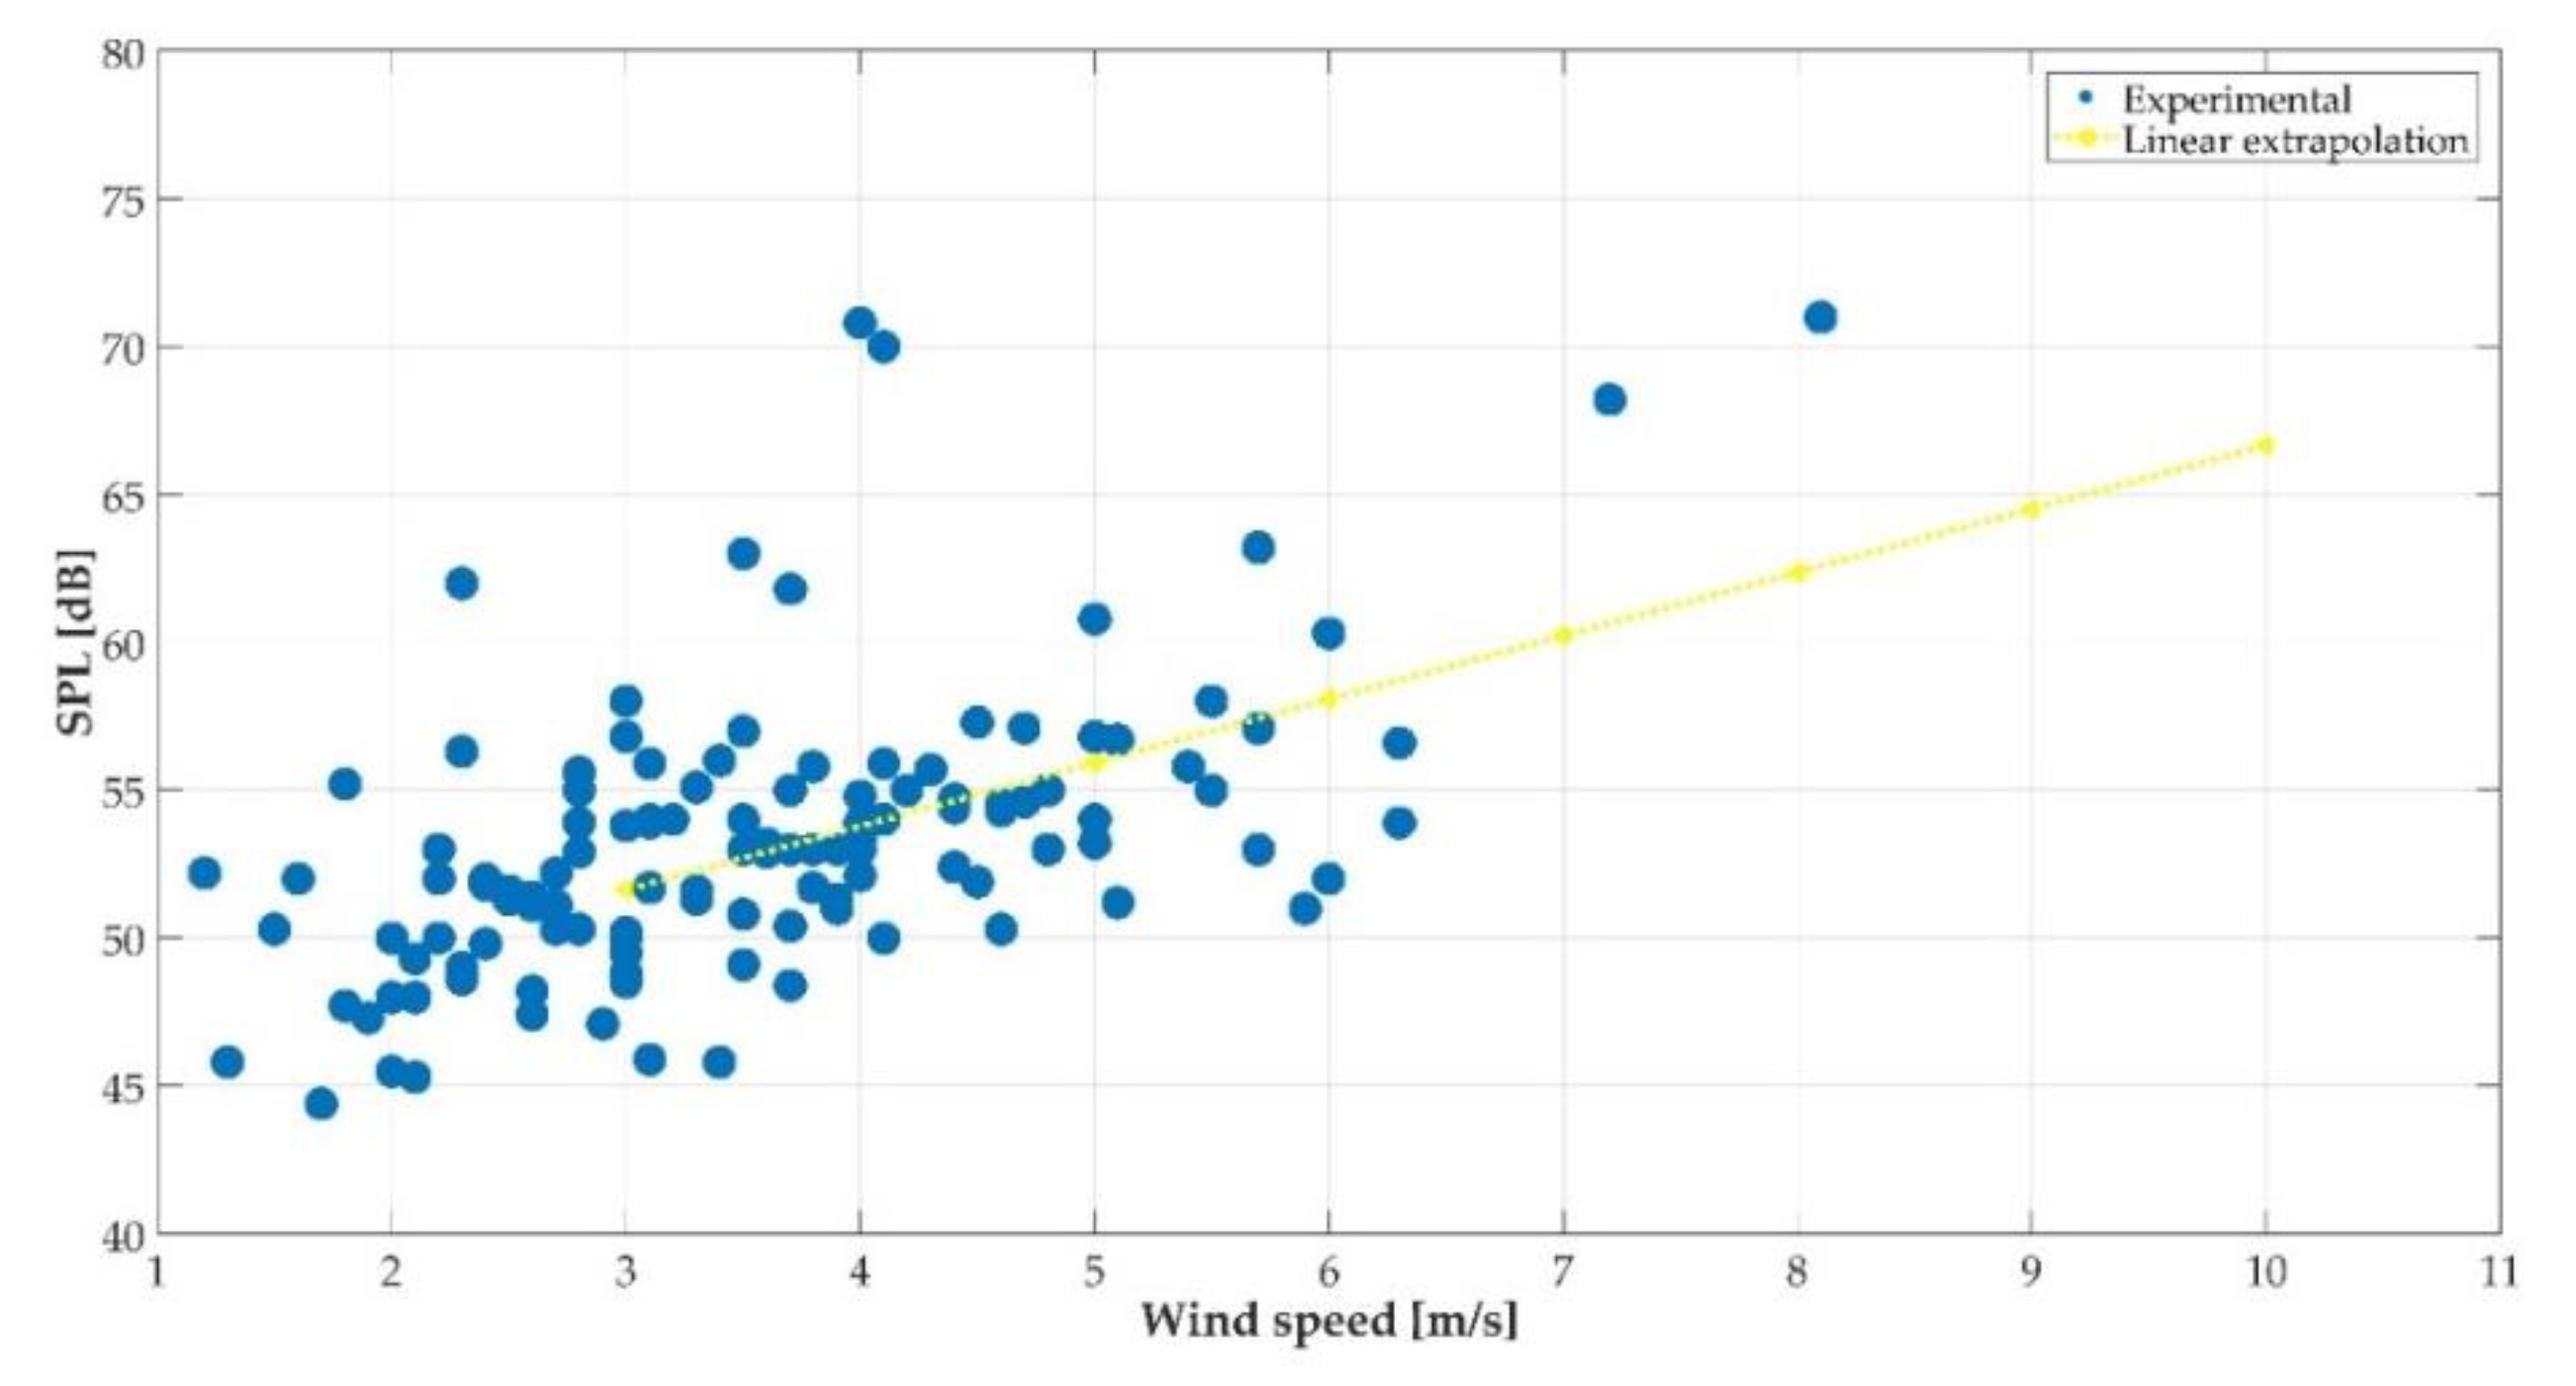
3.1. Field Measurements of Wind Turbine Noise
- The appropriate measurement site was selected where the presence of obstacles was minimal.
- Subsequently, instantaneous data were captured every 5 min, namely: Background sound pressure level () and sound pressure levels of the wind turbine in operation and the background (); wind speed; temperature; pressure; relative humidity; and the time of measurement. These measurements were made during approximately one month in a daytime schedule. The measurements were made at a height of 3 meters and at 8 meters from the wind turbine.
- Finally, databases were generated with the information collected. As an example, Table 1 shows the field measured data of the background sound pressure level over a period of approximately three hours. Table 2 shows as an example the field measured data of the sound pressure level of the wind turbine in operation and the background.
3.2. Implementation of Aeroacoustic Models
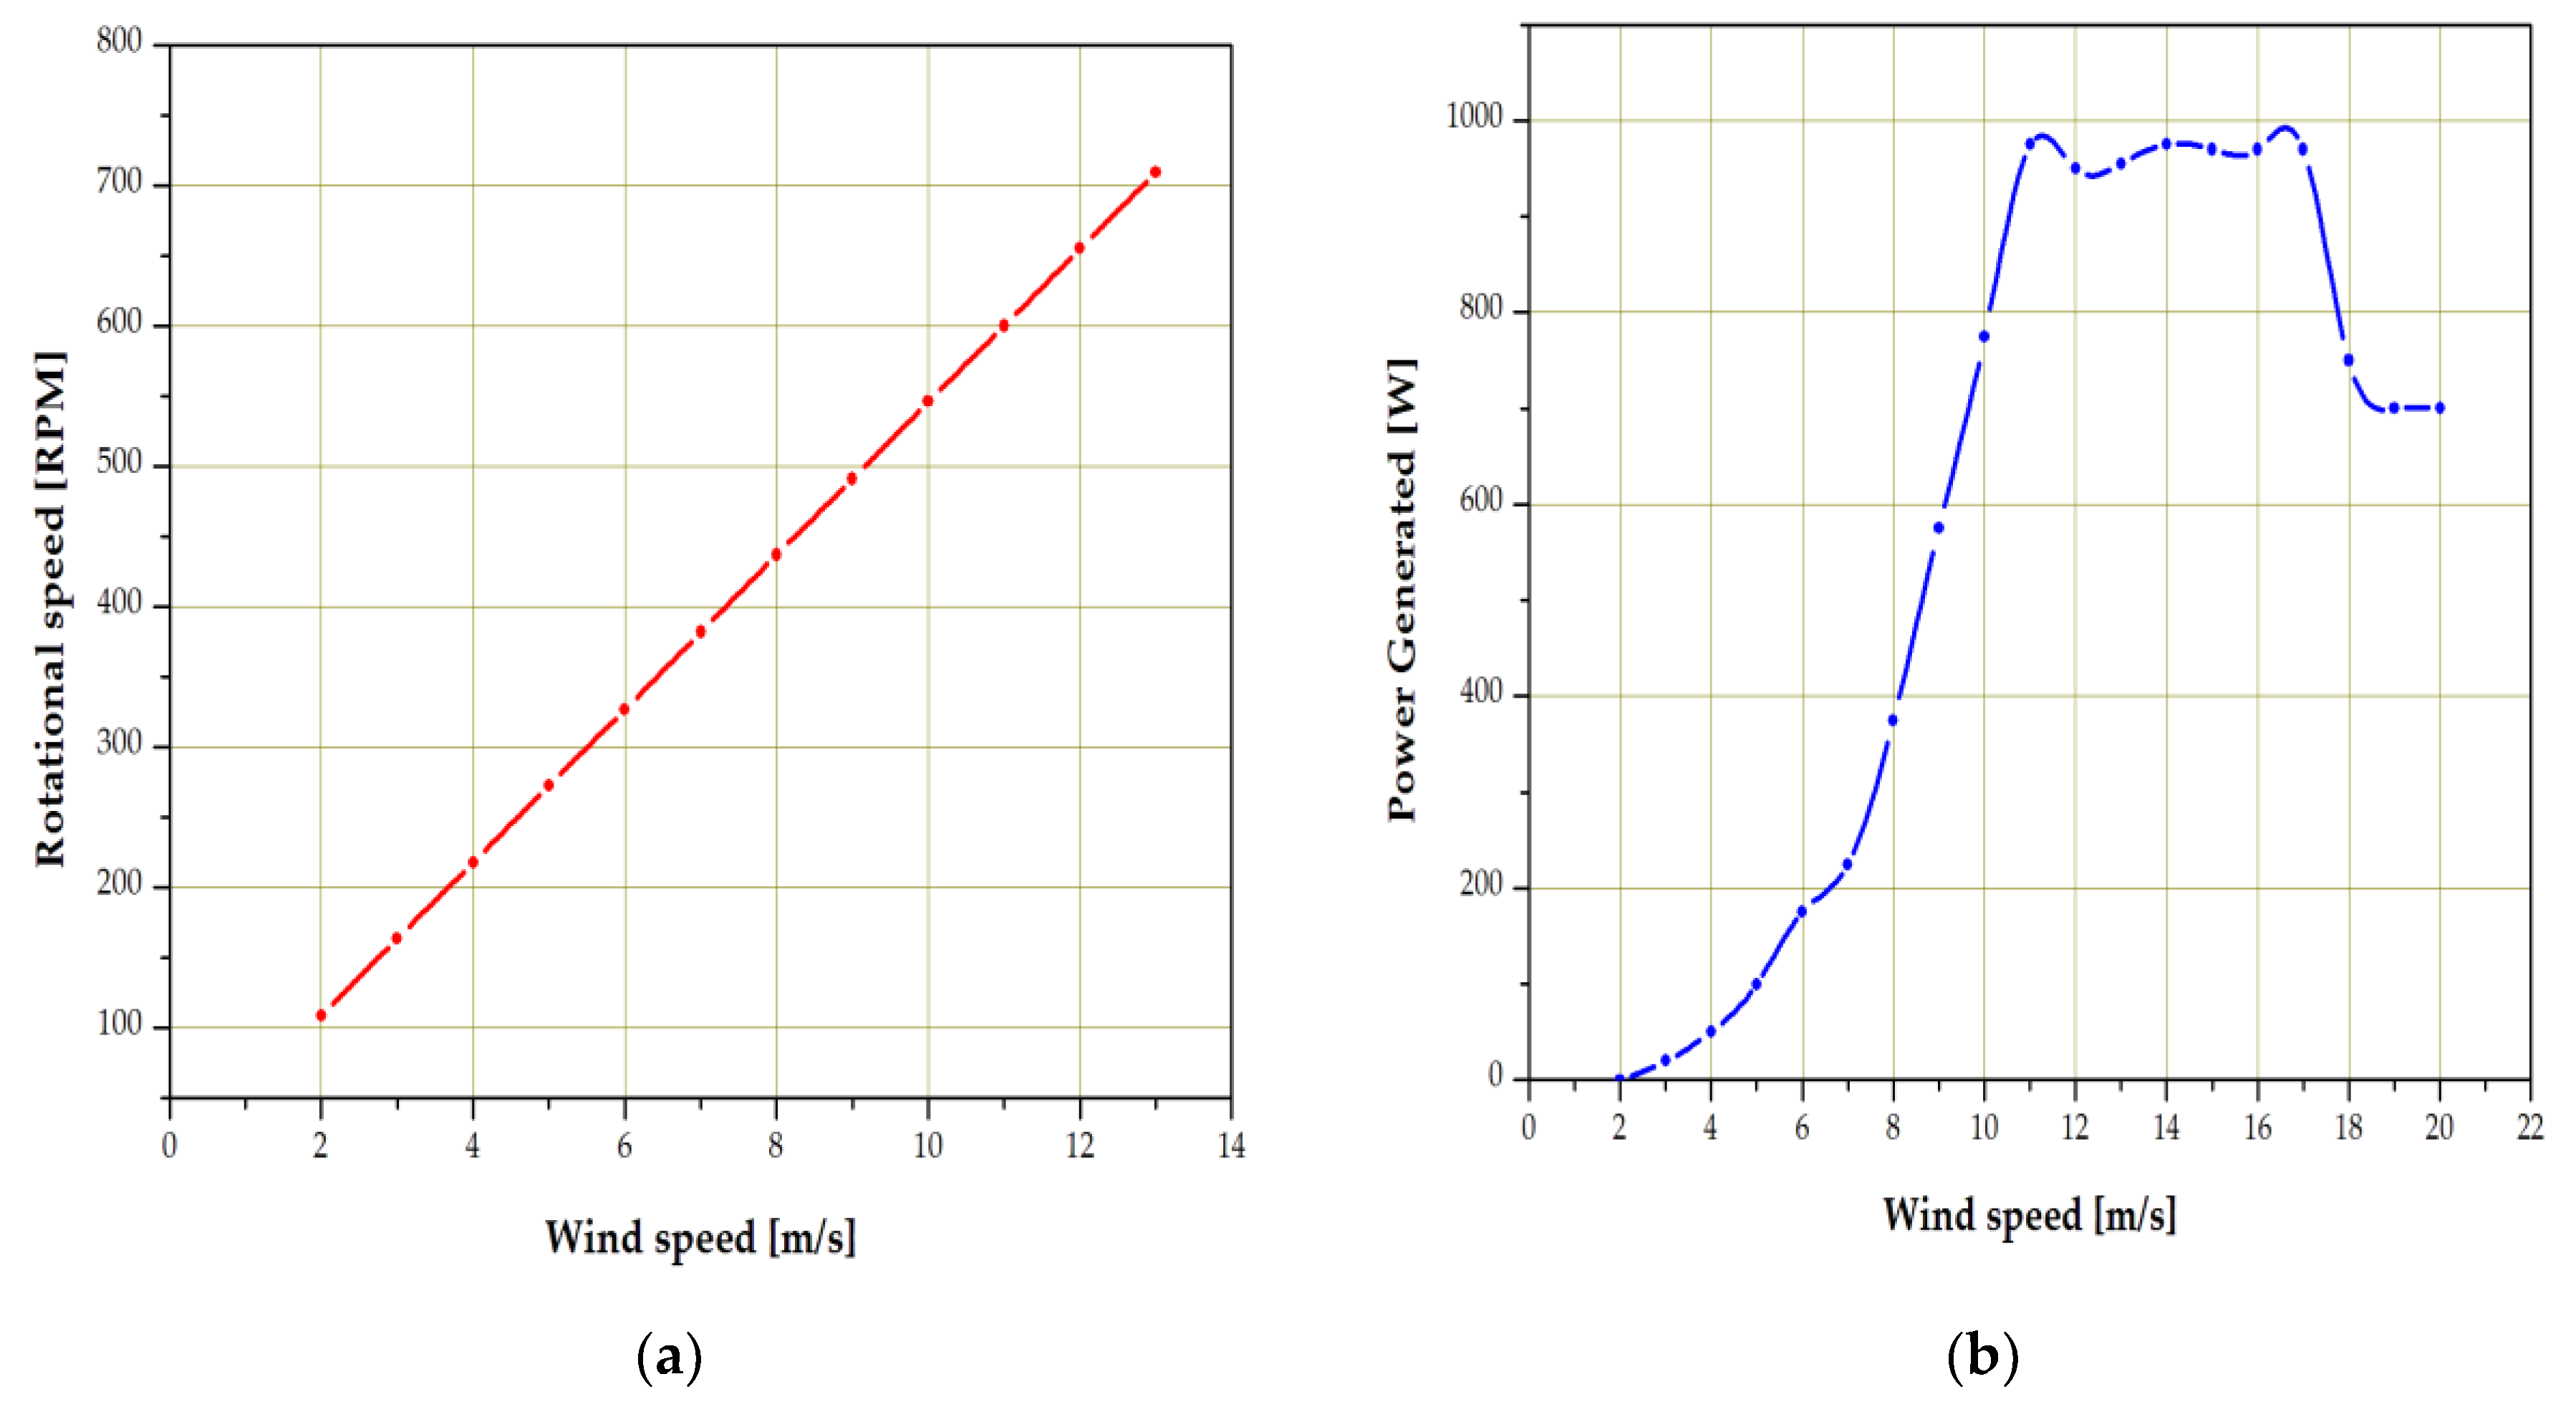
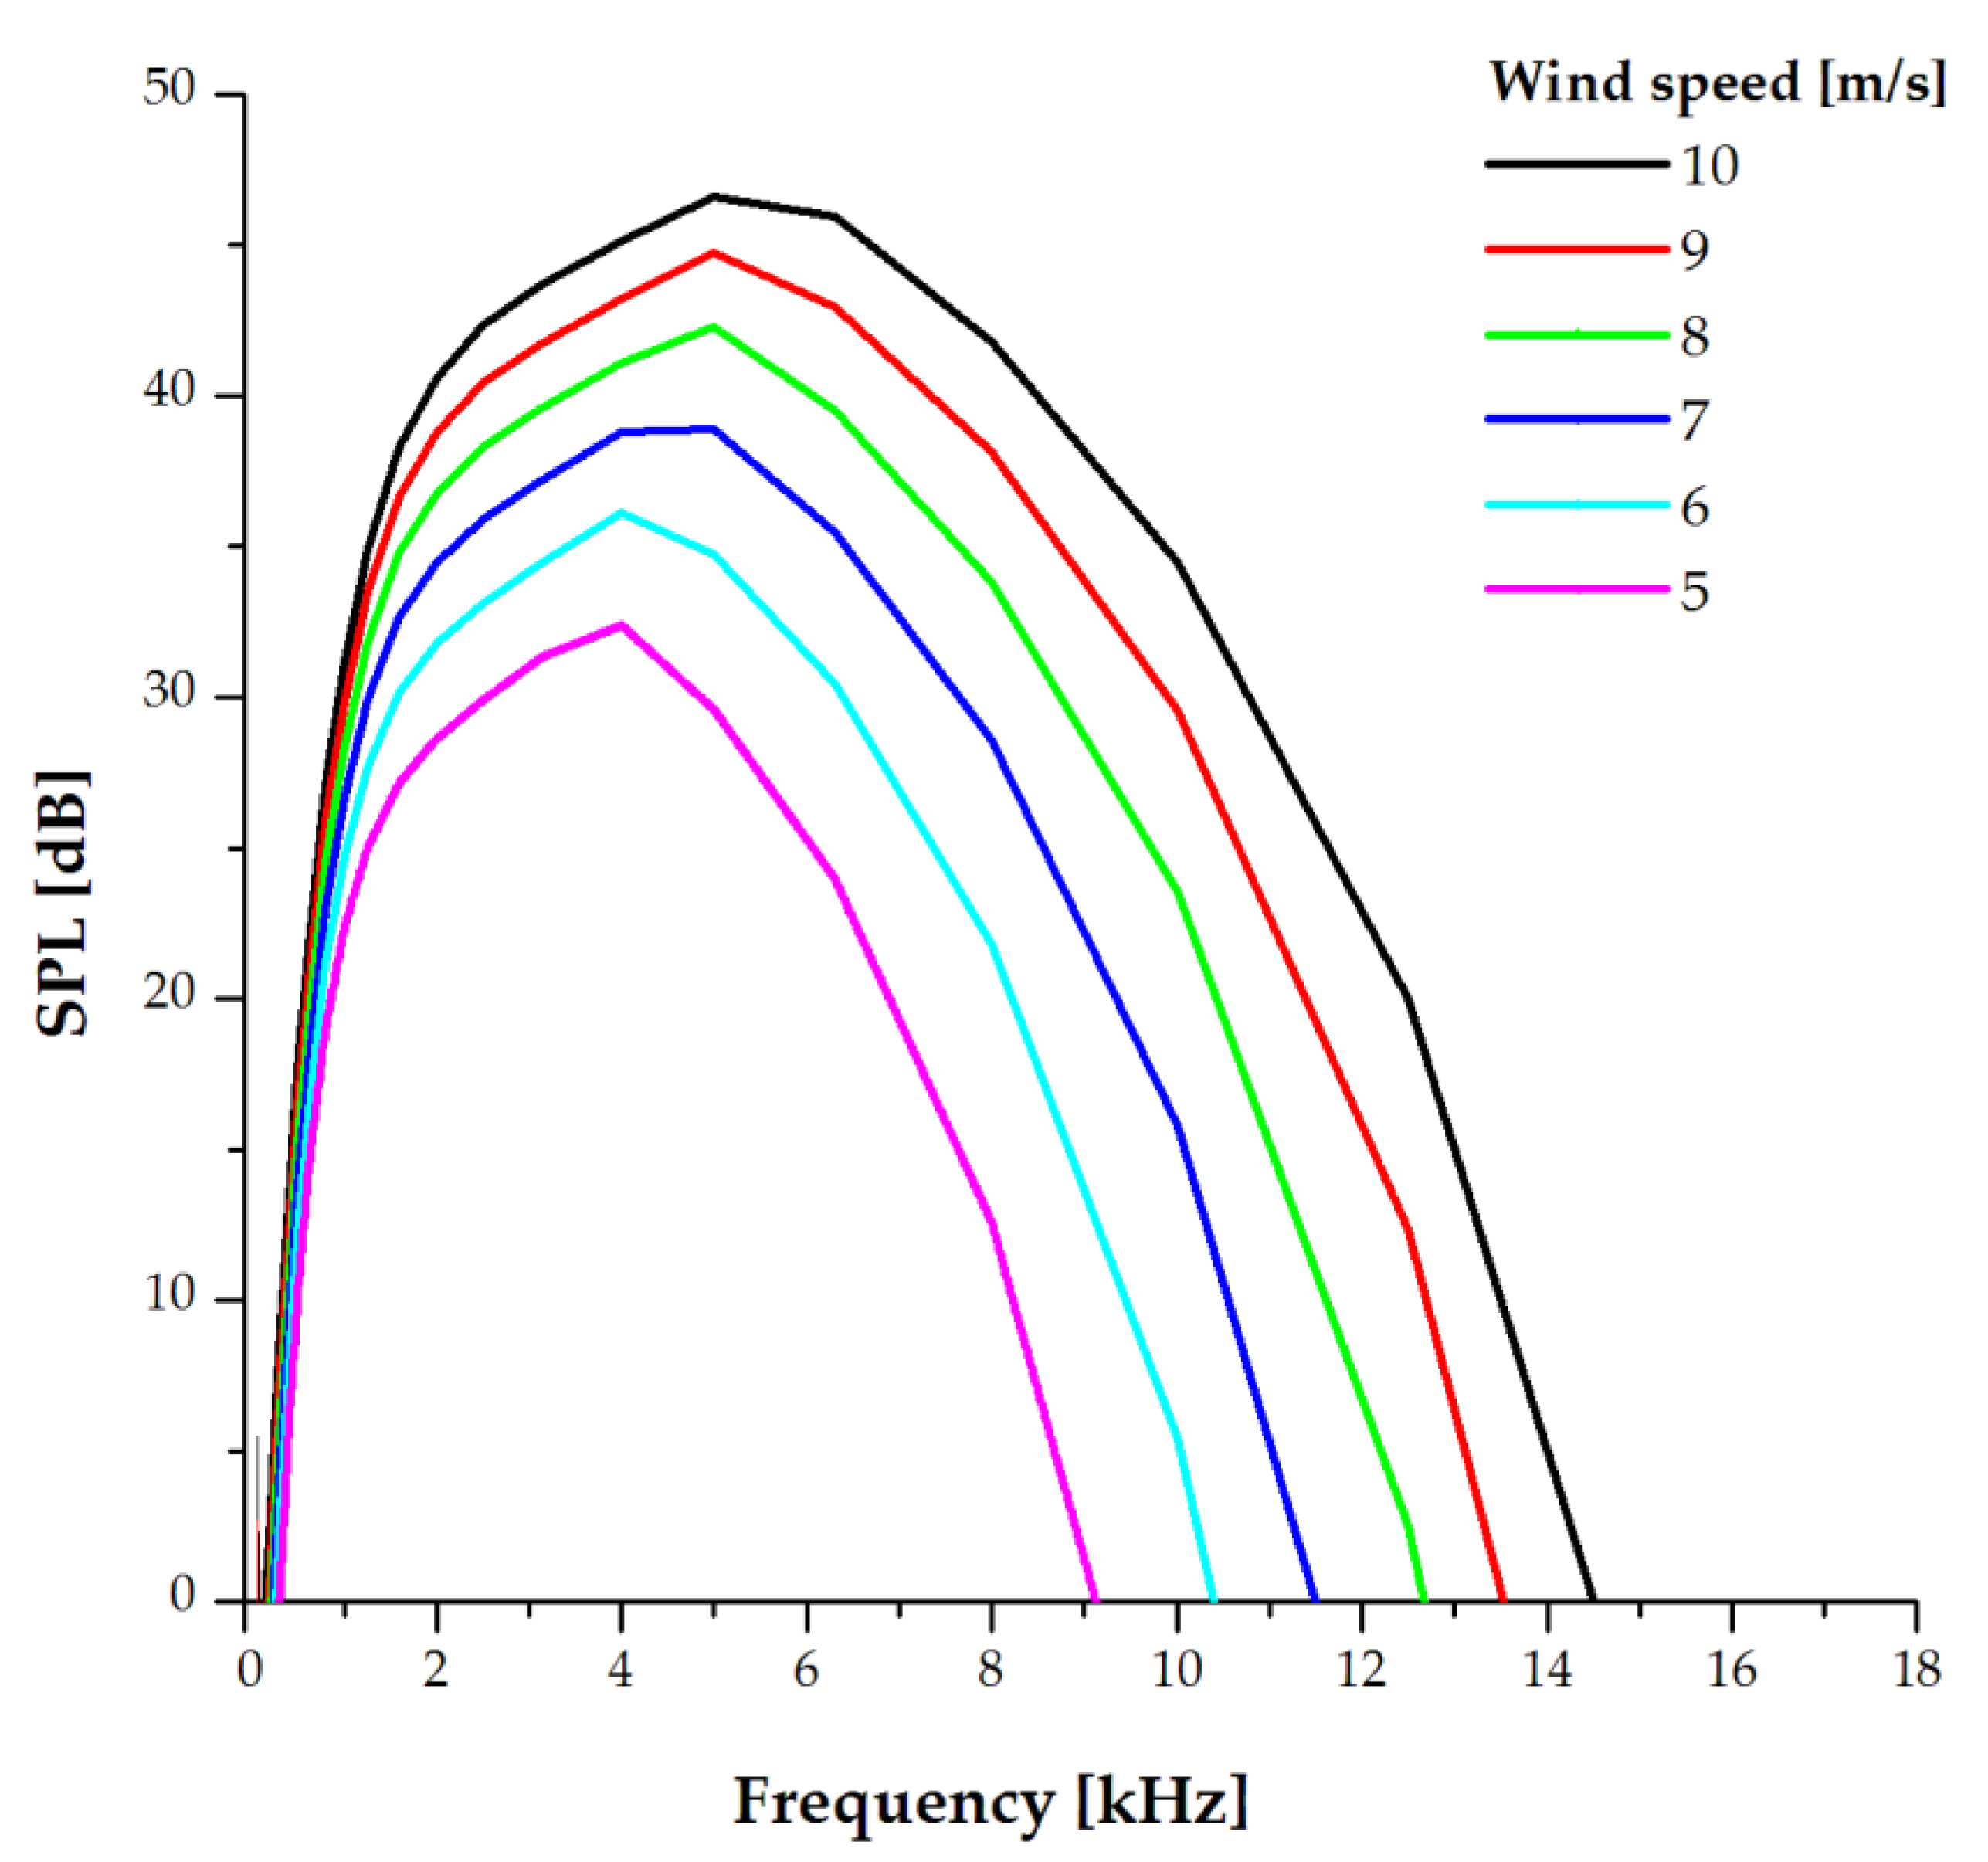
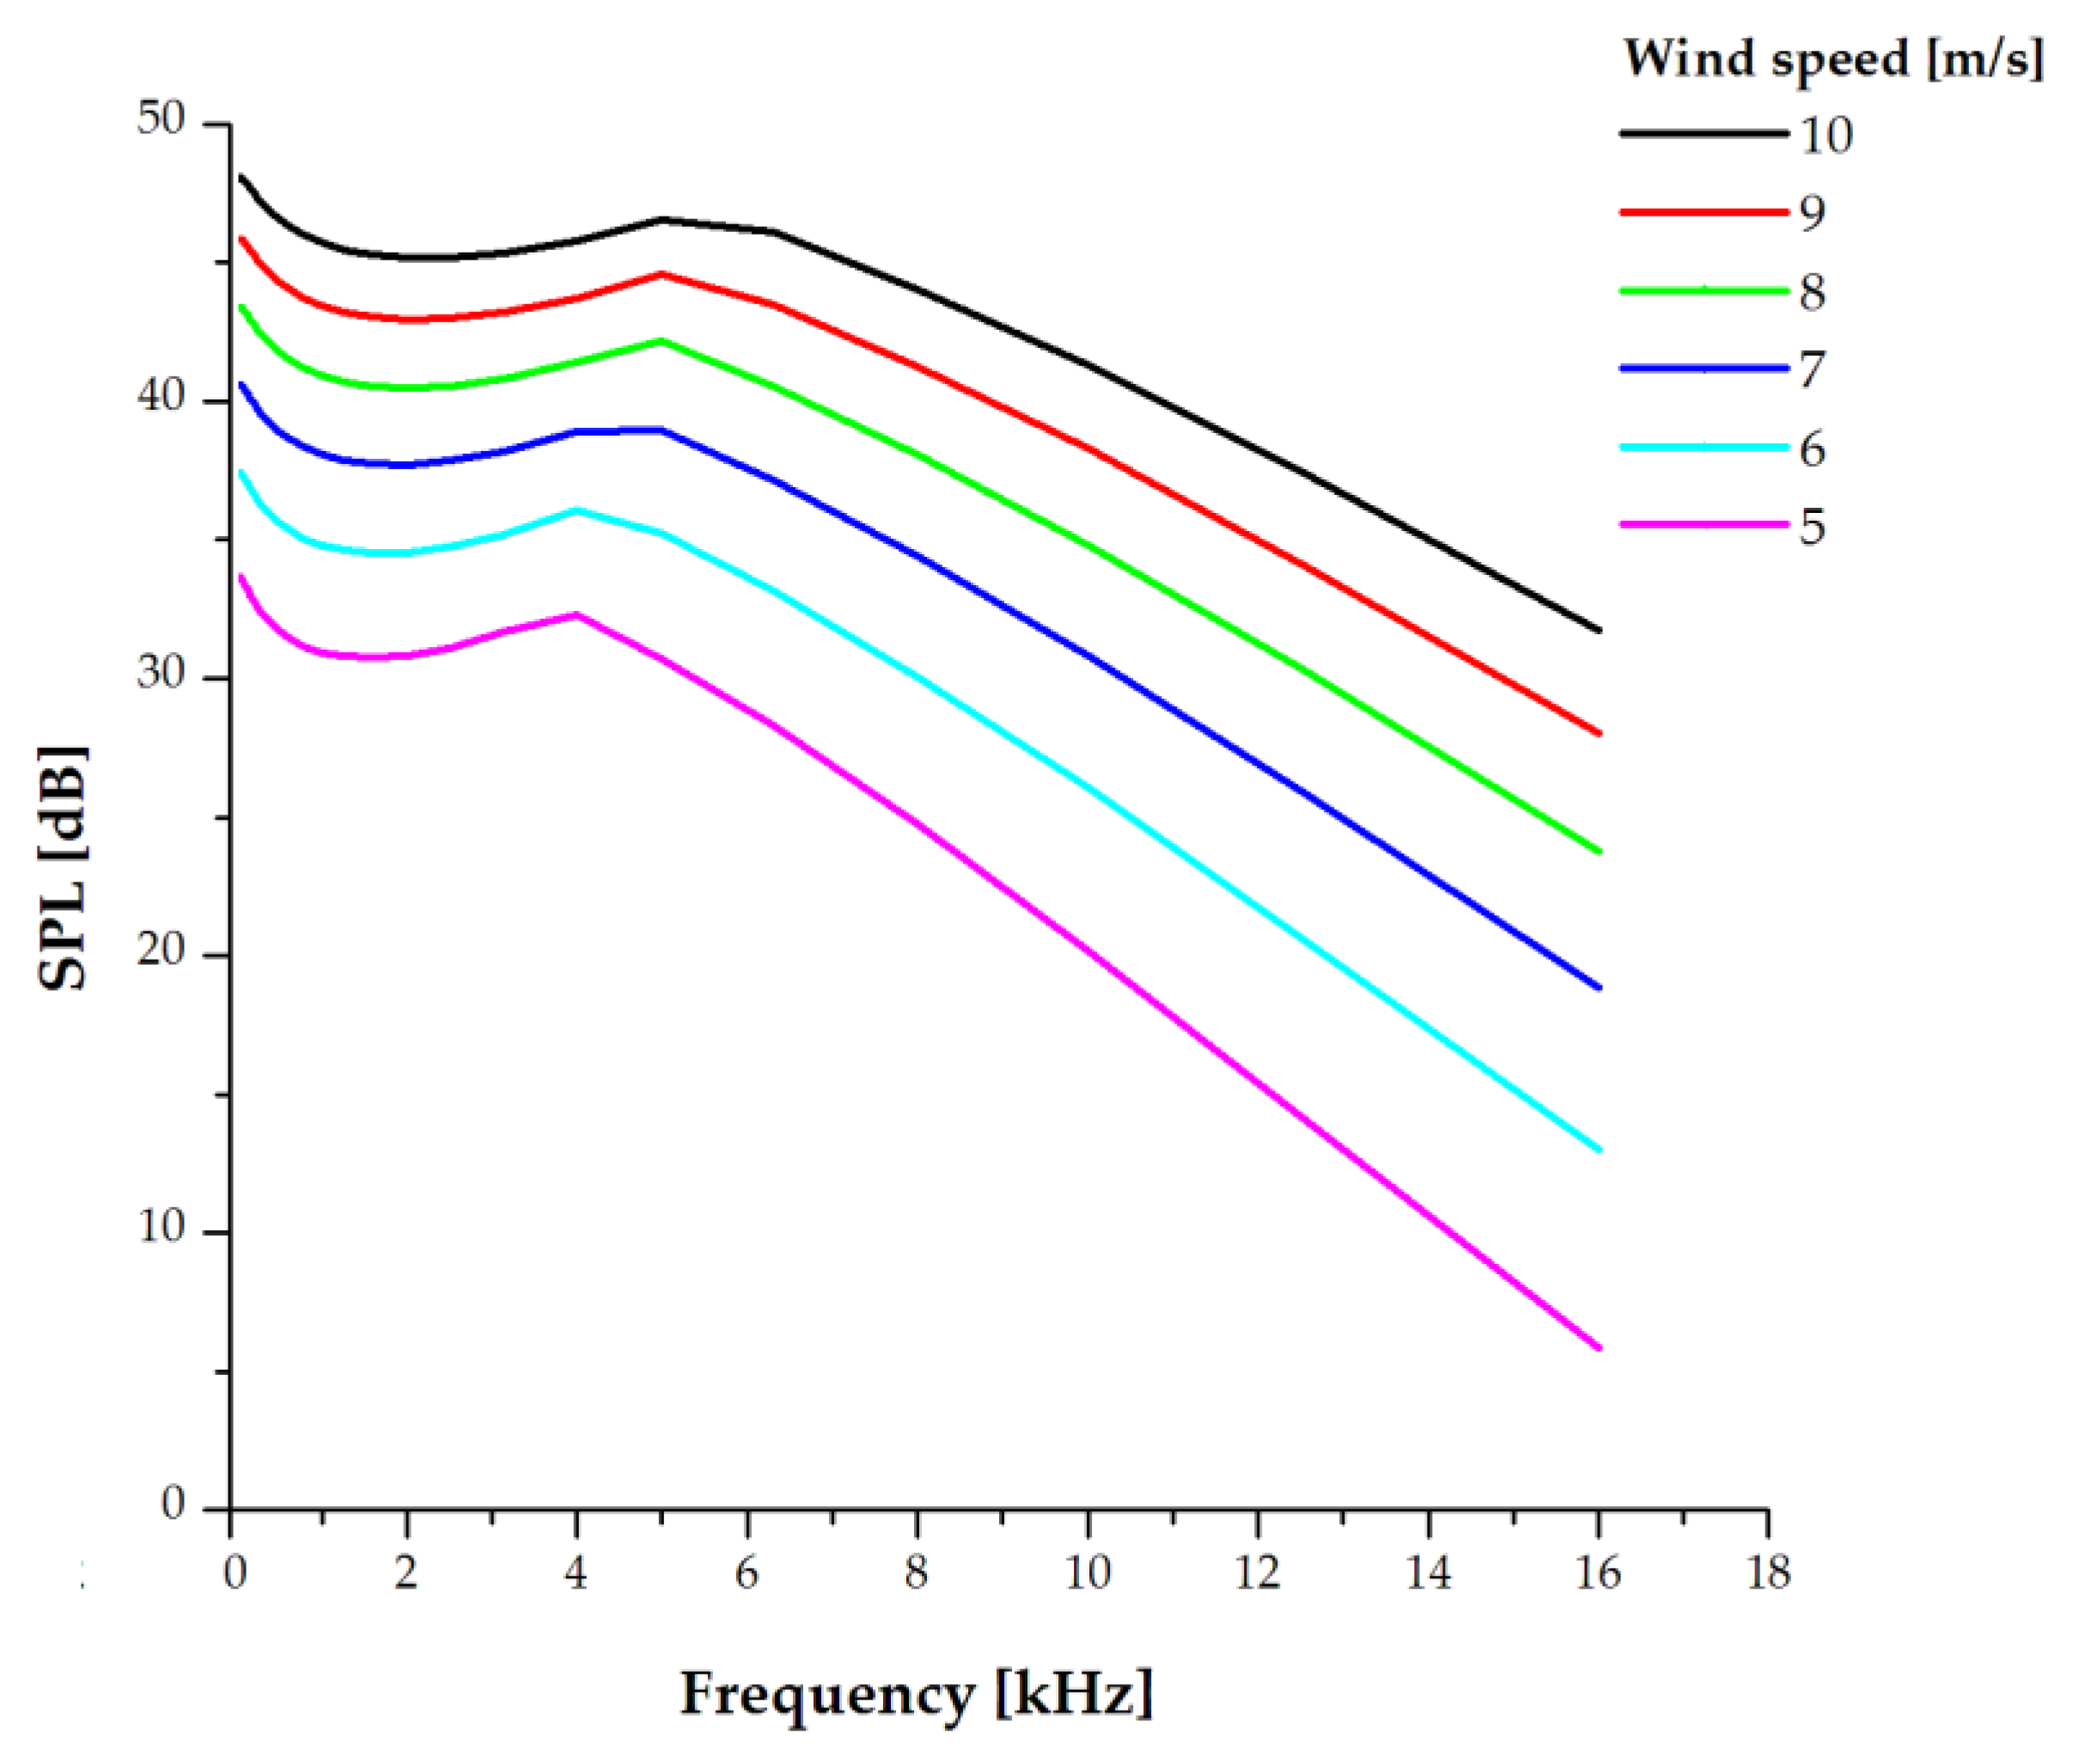
- First, the wind speeds to be evaluated are limited in this case to 5 to 10 m/s.
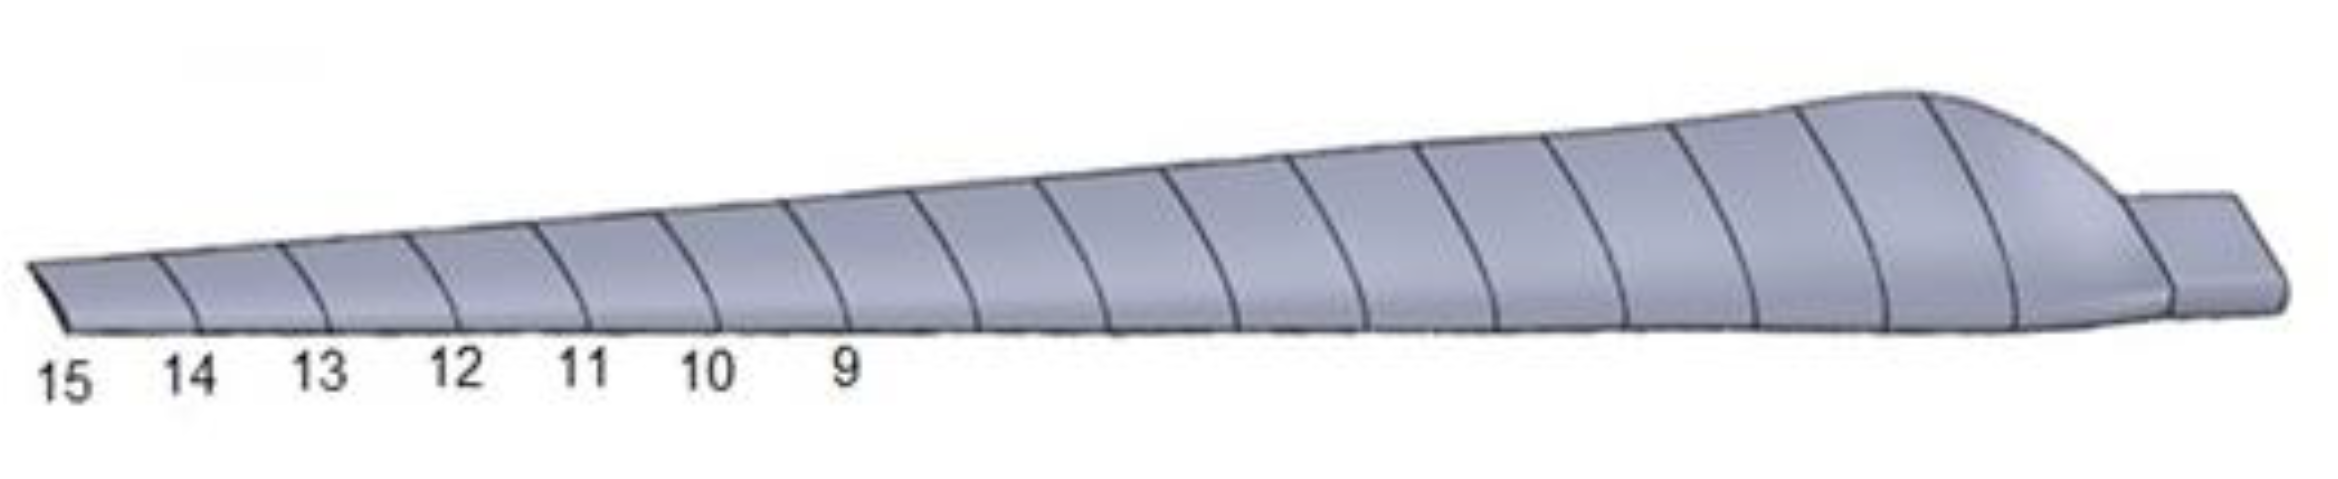
- The geometry is studied, and the blade is divided into segments, selecting those closest to the tip.
- Depending on the length of the segment to be evaluated, the relative speed at which the wind-driven segment moves is calculated.
- Given the relative speeds and length of rope of each segment, the Reynolds numbers and Mach numbers are calculated.
- Given this information, the thickness of the boundary layers on the suction and pressure side and their noise contribution are calculated.
- By adding these boundary layers, the sound contribution of the selected segment is calculated.
- Depending on the number of segments, they are added to when evaluating the sound emission of the blade.
- Finally, to know the sound emission of the wind turbine, the number of blades of the wind turbine are added together, so we know the sound emission at the selected wind speeds.
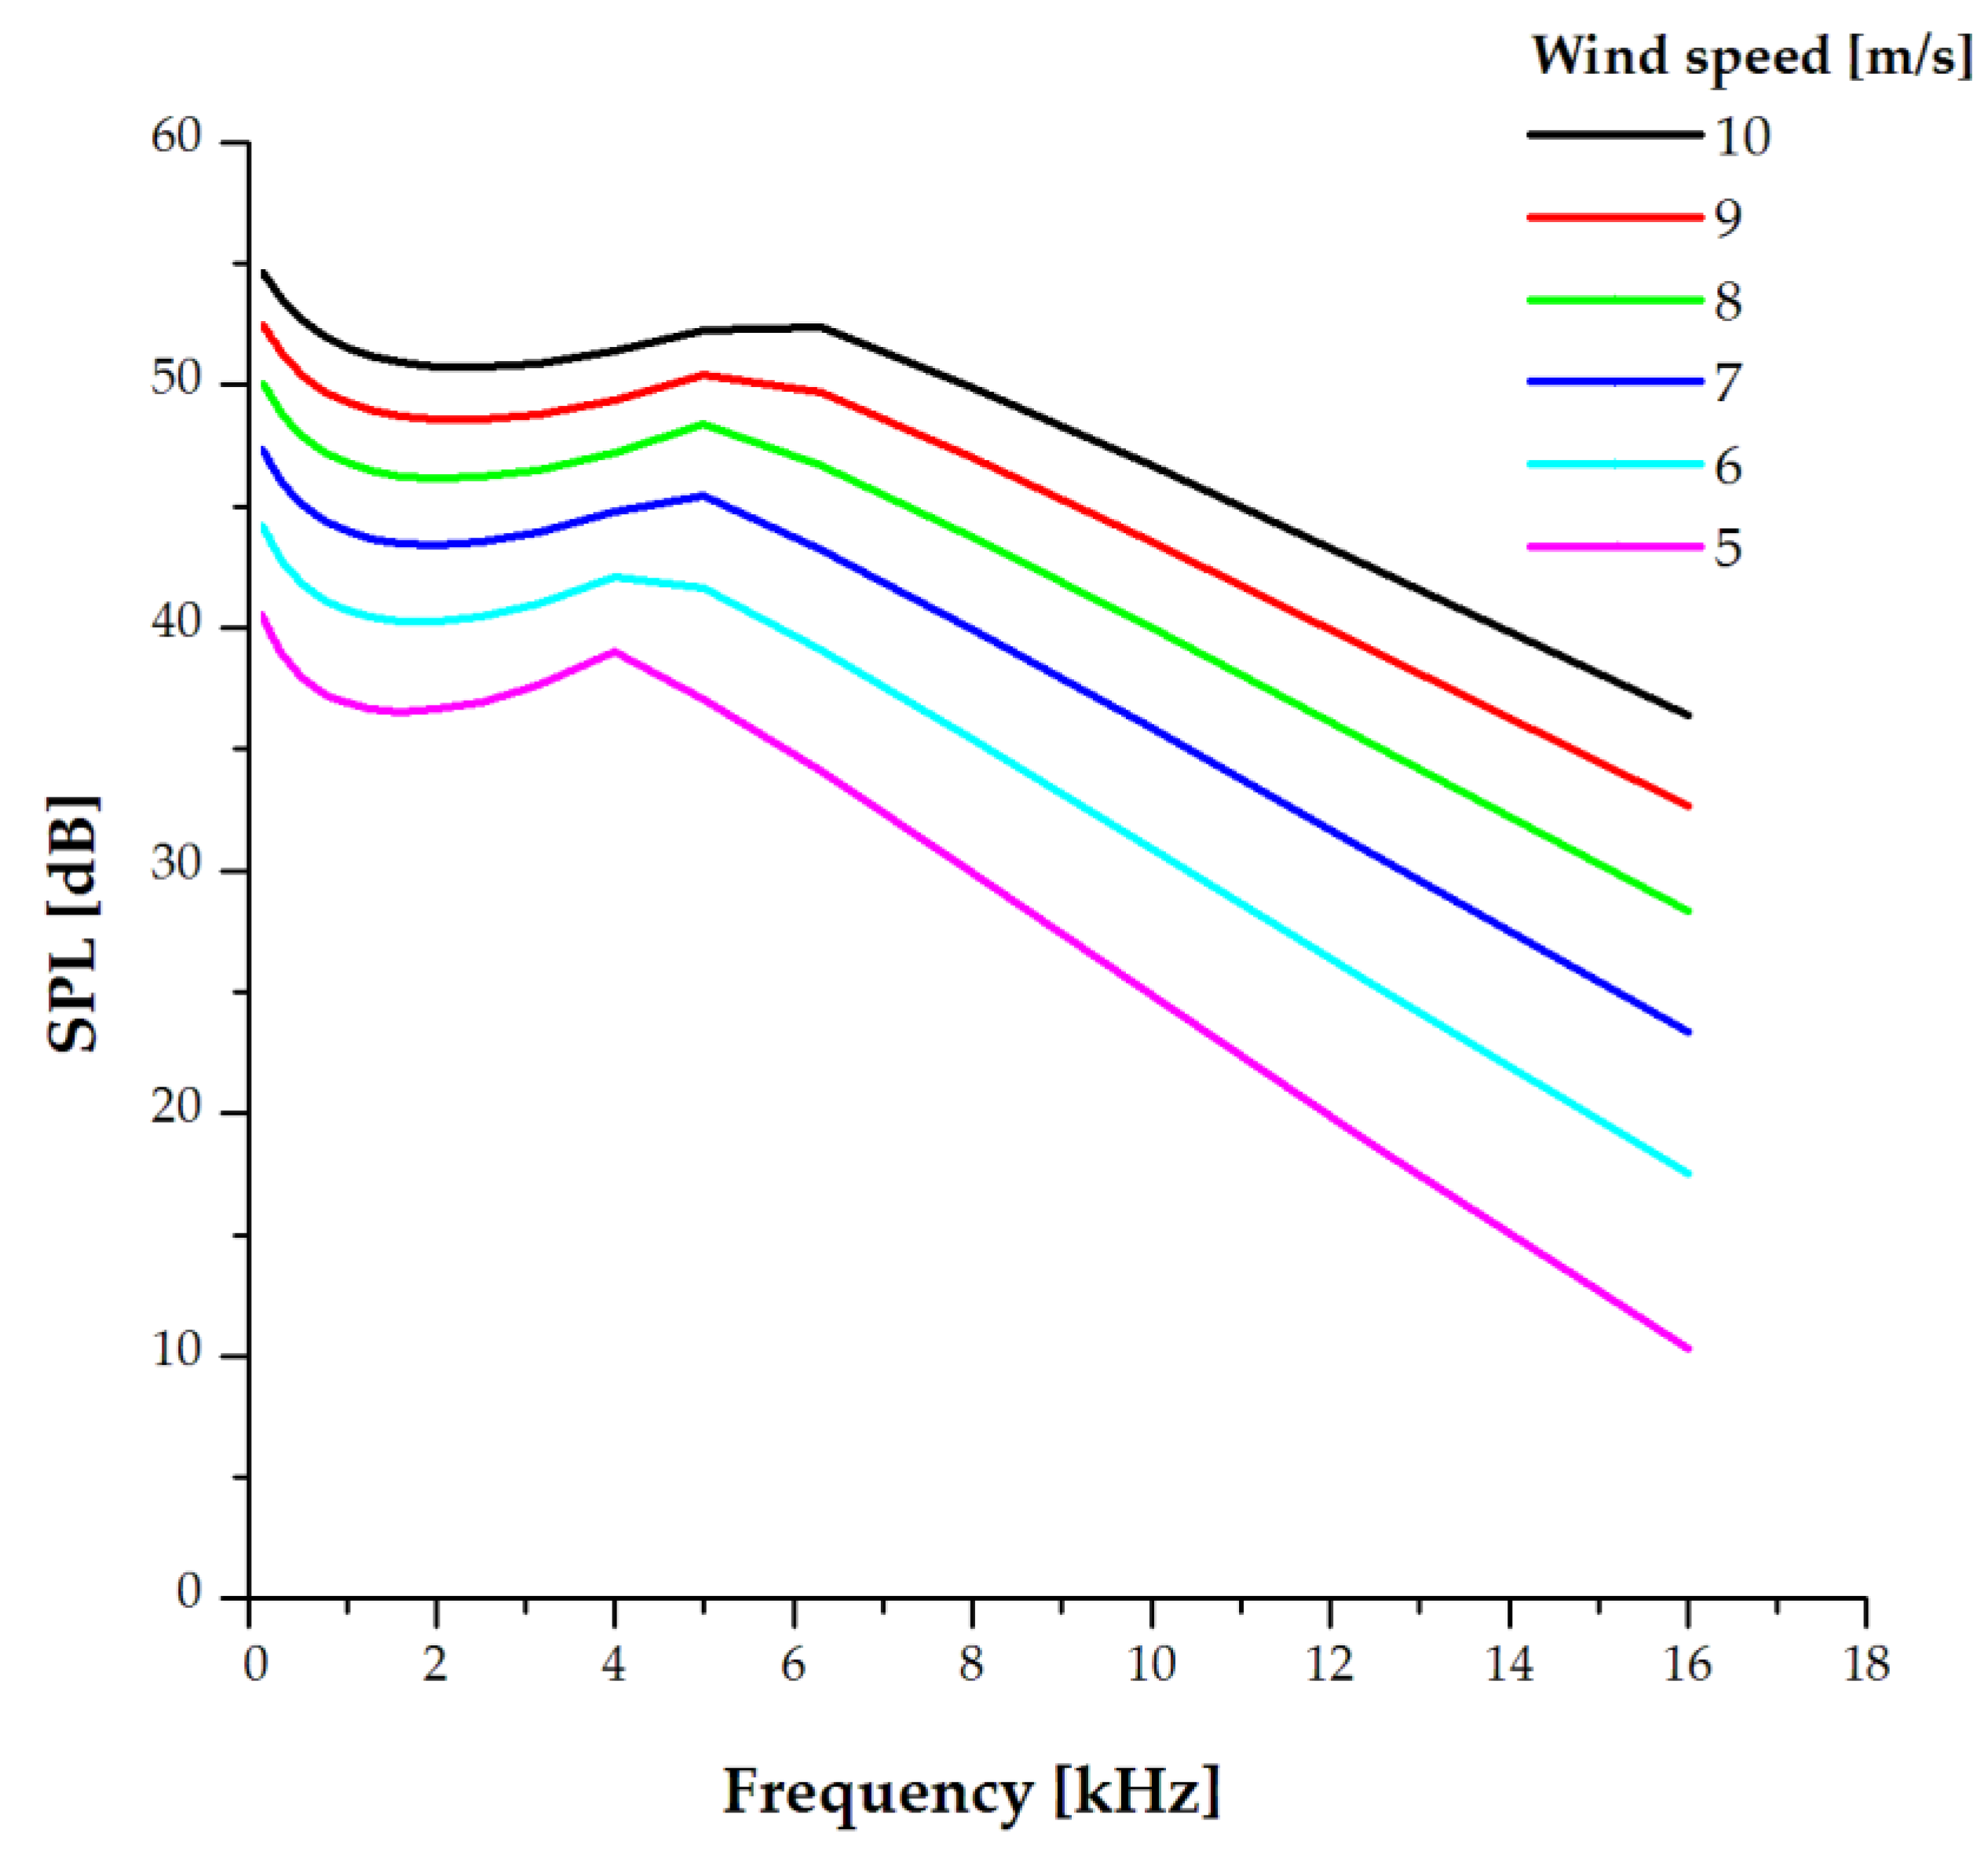
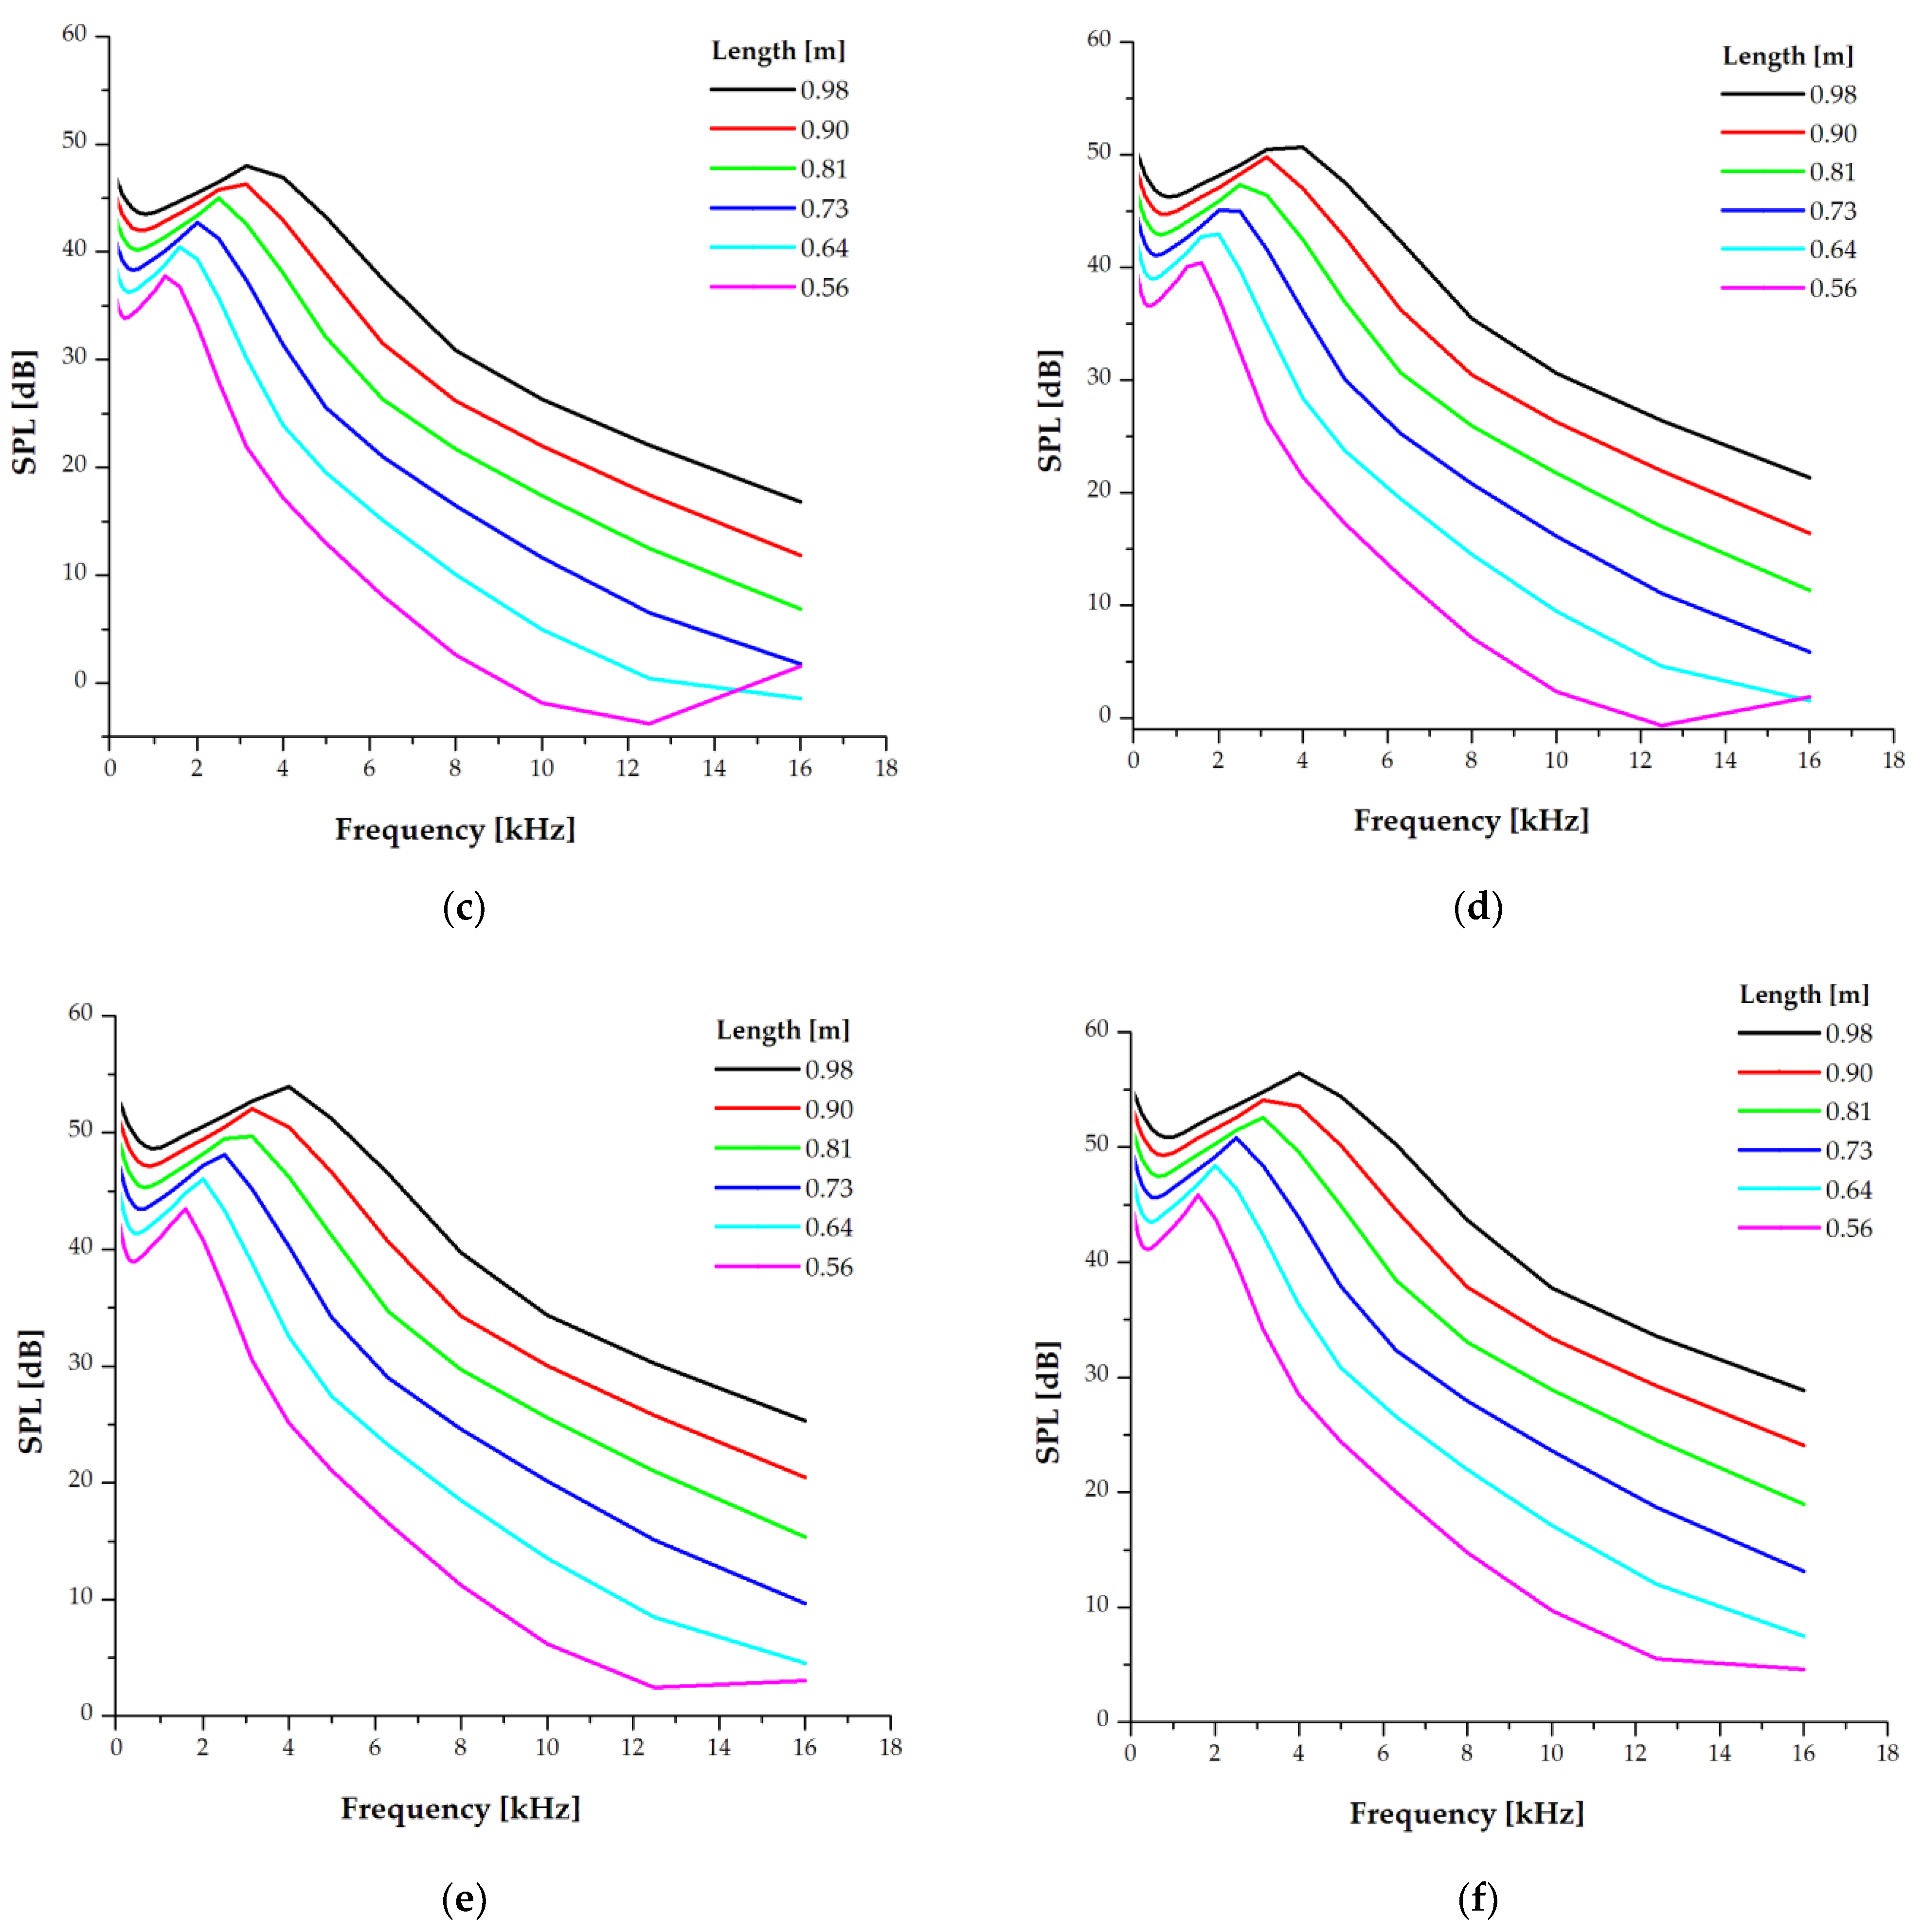
3.2.1. Turbulent Boundary Layer at the Trailing Edge and Flow Detachment
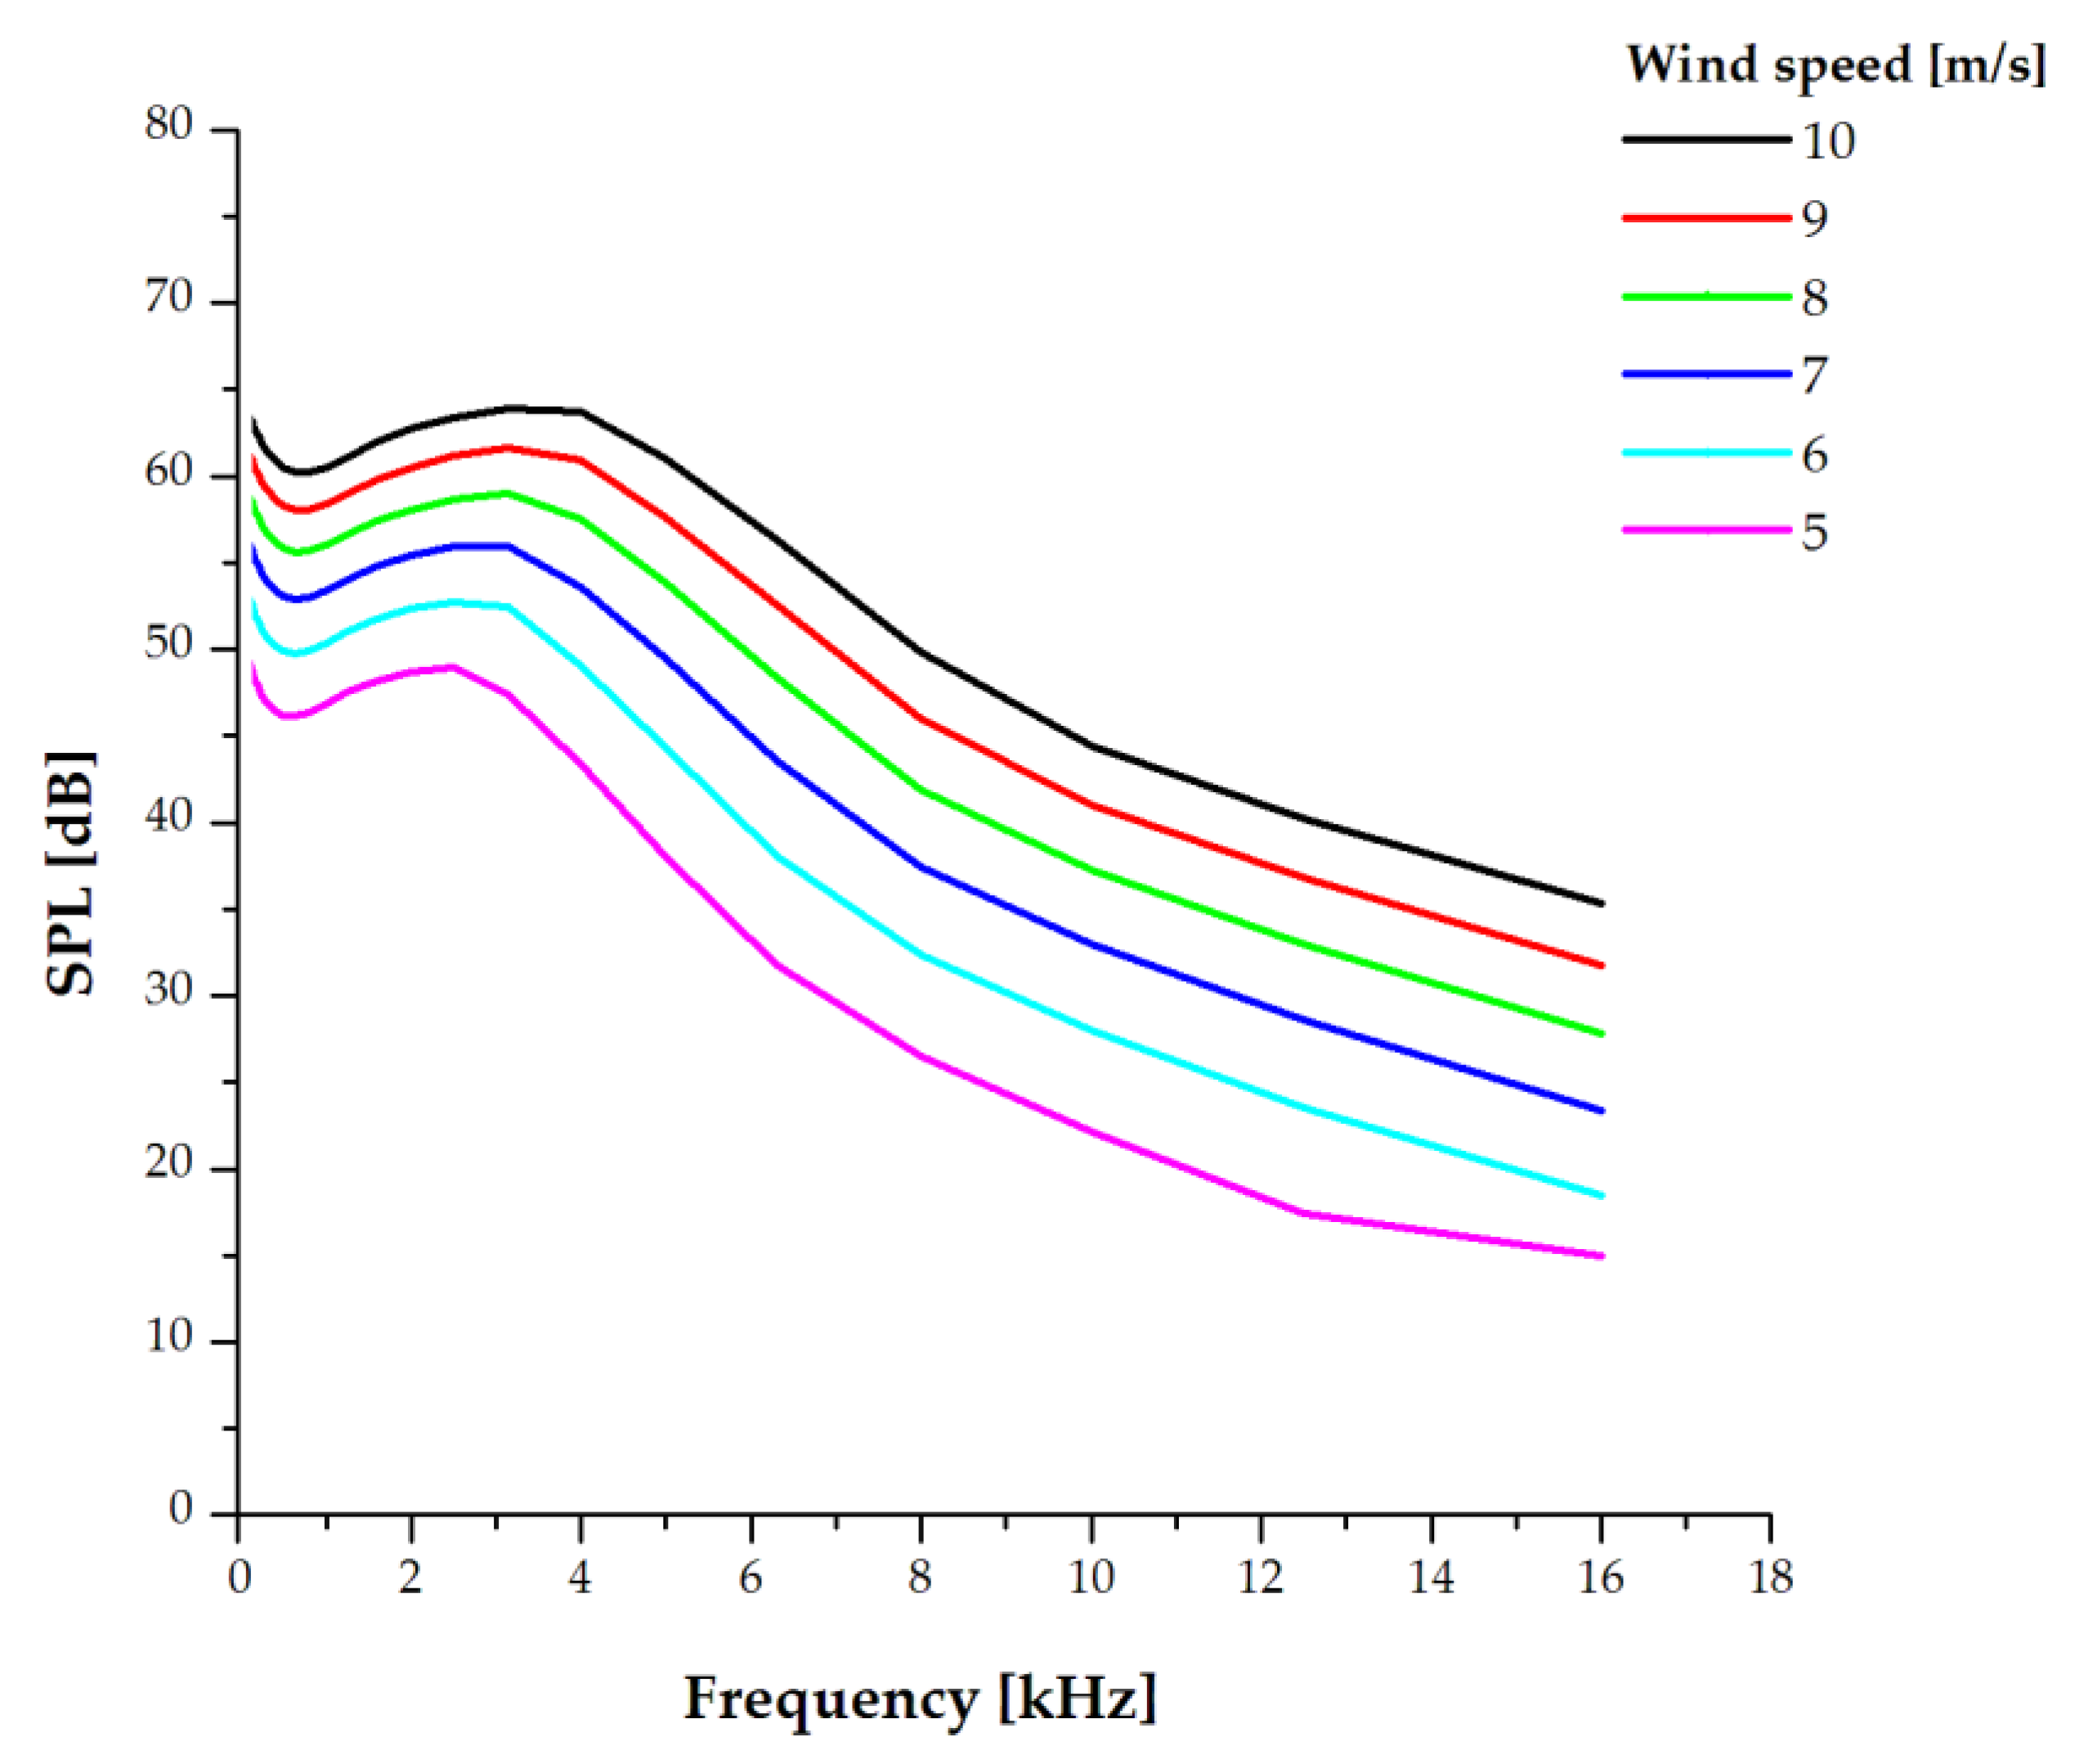
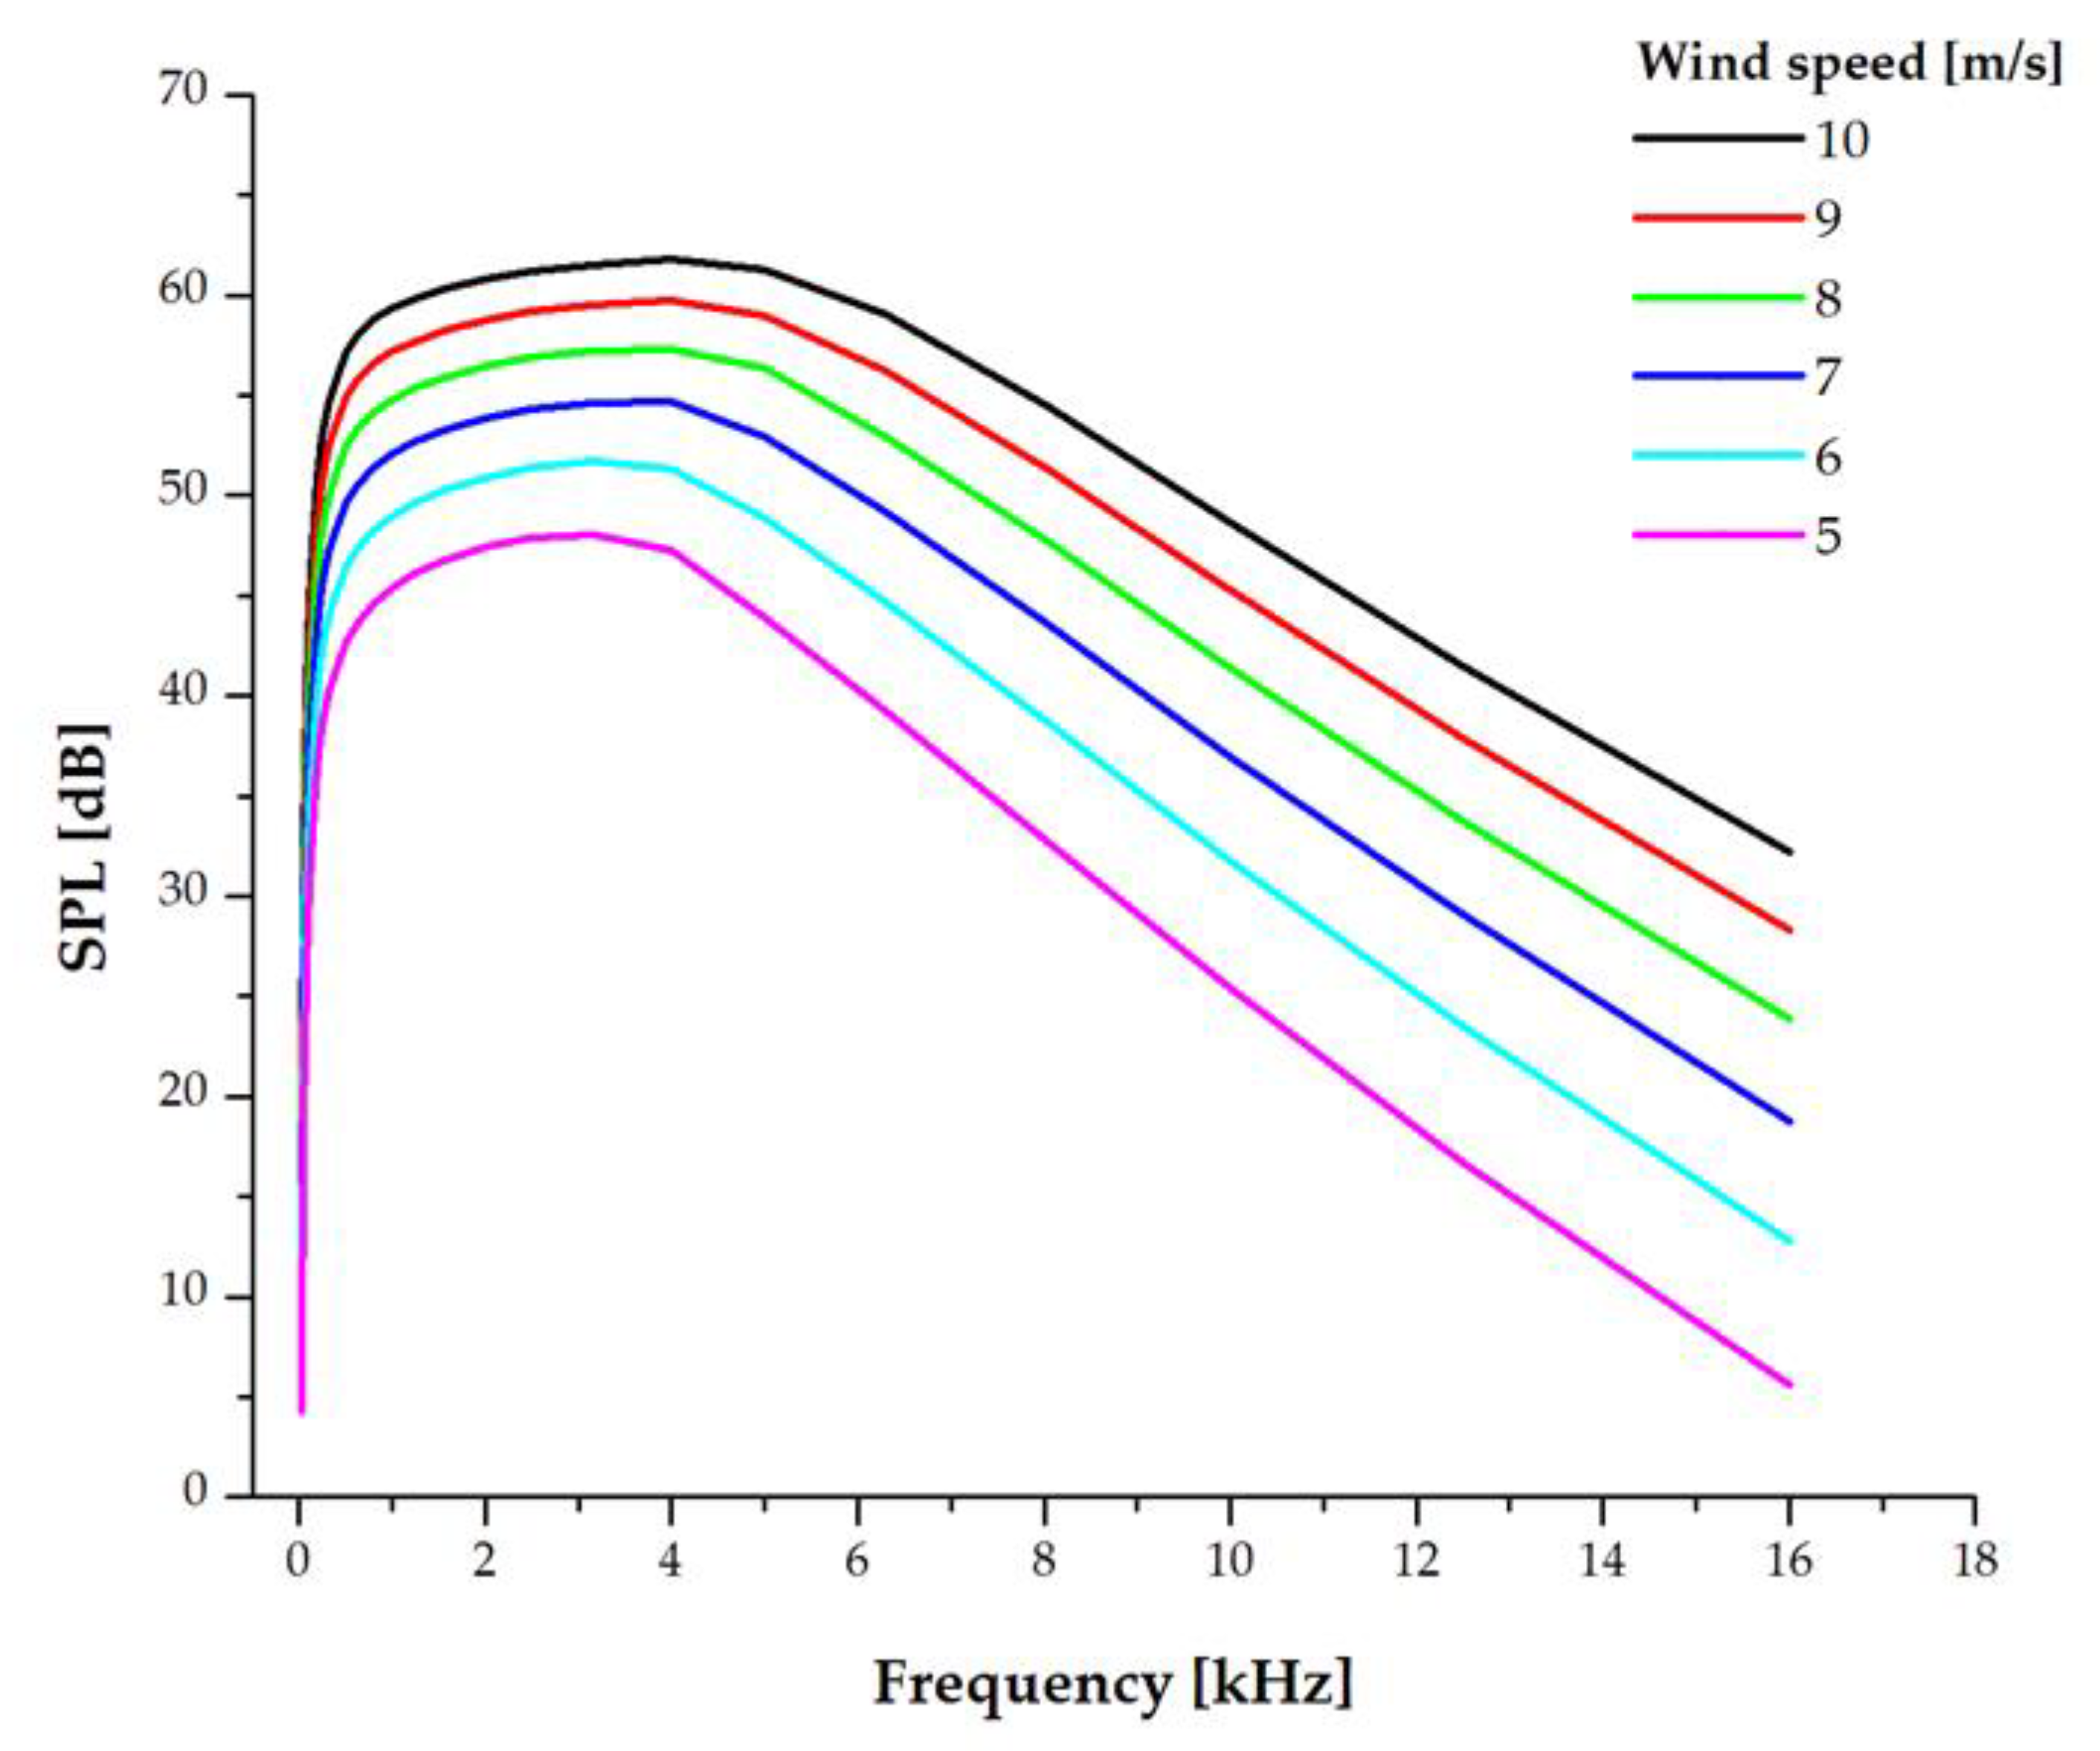
3.2.2. Sound Pressure Levels Due to Vortex Formation at the Tip of the Blade
4. Discussion
5. Conclusions
Author Contributions
Funding
Institutional Review Board Statement
Informed Consent Statement
Acknowledgments
Conflicts of Interest
References
- Schmidt, J.H.; Klokker, M. Health Effects Related to Wind Turbine Noise Exposure: A Systematic Review. PLoS ONE 2014, 9. [Google Scholar] [CrossRef] [PubMed] [Green Version]
- Saab-Junior, J.Y. Trailing-Edge Noise Development and Application of a Noise Prediction Tool for the Assessment and Design of Wind Turbine Airfoils; Escola Politécnica da SUniversidade de Sao Paulo: Sao Paulo, Brazil, 2016. [Google Scholar]
- Ma, J.; Duan, Y.; Zhao, M.; Lv, W.; Wang, J.; Meng Ke, Q.; Ren, Y. Effect of Airfoil Concavity on Wind Turbine Blade Performances. Shock Vib. 2019. [Google Scholar] [CrossRef] [Green Version]
- Zhang, C.Q.; Gao, Z.Y.; Chen, Y.Y.; Dai, Y.J.; Wang, J.W.; Zhang, L.R.; Ma, J.L. Locating and Tracking Sound Sources on a Horizontal Axis Wind Turbine Using a Compact Microphone Array Based on Beamforming. Appl. Acoust. 2019, 146. [Google Scholar] [CrossRef]
- Clifton-Smith, M.J. Aerodynamic Noise Reduction for Small Wind Turbine Rotors. Wind Eng. 2010, 34. [Google Scholar] [CrossRef]
- Wagner, S.; Bareiß, R.; Guidati, G. Wind Turbine Noise; Springer: Berlin/Heidelberg, Germany, 1996; ISBN 978-3-642-88712-3. [Google Scholar]
- Pinder, J.N. Mechanical Noise from Wind Turbines. Wind Eng. 1992, 16, 158–168. [Google Scholar]
- Deshmukh, S.; Bhattacharya, S.; Jain, A.; Paul, A.R. Wind Turbine Noise and Its Mitigation Techniques: A Review. Energy Procedia 2019, 160. [Google Scholar] [CrossRef]
- Ottermo, F.; Möllerström, E.; Nordborg, A.; Hylander, J.; Bernhoff, H. Location of Aerodynamic Noise Sources from a 200 KW Vertical-Axis Wind Turbine. J. Sound Vib. 2017, 400. [Google Scholar] [CrossRef]
- Möllerström, E.; Ottermo, F.; Hylander, J.; Bernhoff, H. Noise Emission of a 200 KW Vertical Axis Wind Turbine. Energies 2016, 9, 19. [Google Scholar] [CrossRef] [Green Version]
- Su, J.; Lei, H.; Zhou, D.; Han, Z.; Bao, Y.; Zhu, H.; Zhou, L. Aerodynamic Noise Assessment for a Vertical Axis Wind Turbine Using Improved Delayed Detached Eddy Simulation. Renew. Energy 2019, 141, 559–569. [Google Scholar] [CrossRef]
- Chrysochoidis-Antsos, N.; Amoros, A.V.; van Bussel, G.J.W.; Mertens, S.M.; van Wijk, A.J.M. Wind Resource Characteristics and Energy Yield for Micro Wind Turbines Integrated on Noise Barriers–An Experimental Study. J. Wind Eng. Ind. Aerodyn. 2020, 203, 104206. [Google Scholar] [CrossRef]
- Zagubień, A.; Wolniewicz, K. The Impact of Supporting Tower on Wind Turbine Noise Emission. Appl. Acoust. 2019, 155, 260–270. [Google Scholar] [CrossRef]
- Göçmen, T.; Özerdem, B. Airfoil Optimization for Noise Emission Problem and Aerodynamic Performance Criterion on Small Scale Wind Turbines. Energy 2012, 46. [Google Scholar] [CrossRef] [Green Version]
- Lee, S.; Lee, S. Numerical and Experimental Study of Aerodynamic Noise by a Small Wind Turbine. Renew. Energy 2014, 65. [Google Scholar] [CrossRef]
- Zhu, W.J.; Heilskov, N.; Shen, W.Z.; Sørensen, J.N. Modeling of Aerodynamically Generated Noise from Wind Turbines. J. Sol. Energy Eng. 2005, 127. [Google Scholar] [CrossRef]
- Oerlemans, S.; Schepers, J.G. Prediction of Wind Turbine Noise and Validation against Experiment. Int. J. Aeroacoustics 2009, 8. [Google Scholar] [CrossRef]
- Rodrigues, S.S.; Marta, A.C. On Addressing Wind Turbine Noise with After-Market Shape Blade Add-Ons. Renew. Energy 2019, 140. [Google Scholar] [CrossRef]
- Sessarego, M.; Wood, D. Multi-Dimensional Optimization of Small Wind Turbine Blades. Renew. Wind Water Sol. 2015, 2. [Google Scholar] [CrossRef] [Green Version]
- Wood, D. Small Wind Turbines; Springer: London, UK, 2011; ISBN 978-1-84996-174-5. [Google Scholar]
- Solís-Gallego, I.; Meana-Fernández, A.; Fernández Oro, J.M.; Argüelles Díaz, K.M.; Velarde-Suárez, S. LES-Based Numerical Prediction of the Trailing Edge Noise in a Small Wind Turbine Airfoil at Different Angles of Attack. Renew. Energy 2018, 120. [Google Scholar] [CrossRef]
- Taylor, J.; Eastwick, C.; Lawrence, C.; Wilson, R. Noise Levels and Noise Perception from Small and Micro Wind Turbines. Renew. Energy 2013, 55. [Google Scholar] [CrossRef]
- Lee, H.; Lee, D.-J. Low Reynolds Number Effects on Aerodynamic Loads of a Small Scale Wind Turbine. Renew. Energy 2020, 154. [Google Scholar] [CrossRef]
- NOM-081-ECOL-1994: Límites Máximos Permisibles de Emisión de Ruido de Las Fuentes Fijas; CDMX, Diario Oficial de la Ferderacion: Mexico City, Mexico, 1994.
- Brooks, T.F.; Pope, D.S.; Marcolini, M.A. Airfoil Self-Noise and Prediction; National Aeronautics and Space Administration: Washington, DC, USA, 1989. [Google Scholar]
- Bhargava, V.; Samala, R. Effect of Boundary Layer and Rotor Speed on Broadband Noise from Wind Turbines. J. Aerosp. Technol. Manag. 2019. [Google Scholar] [CrossRef]
- Standard IEC 61400-11: Wind Turbine Generator Systems- Part 11: Acoustic Noise Measurement Techniques; International Electrotechnical Commission: Geneva, Switzerland, 2003.
- Lowson, M.V. Assessment and Prediction of Wind Turbine Noise; IAEA: Bristol, UK, 1993. [Google Scholar]
- Grosveld, F.W. Prediction of Broadband Noise from Horizontal Axis Wind Turbines. J. Propuls. Power 1985, 1. [Google Scholar] [CrossRef]
- Brooks, T.F.; Marcolini, M.A. Airfoil Tip Vortex Formation Noise. AIAA J. 1986, 24. [Google Scholar] [CrossRef]
- Rogers, A.L.; Manwell, J.F.; Wright, S. Wind Turbine Acoustic Noise; Renewable Energy Research Laboratory: Amherst, MA, USA, 2002. [Google Scholar]
- Vers, I.L.; Beranek, L.L. (Eds.) Noise and Vibration Control Engineering; John Wiley & Sons, Inc.: Hoboken, NJ, USA, 2005; ISBN 9780470172568. [Google Scholar]
- RTO Energy. Available online: www.rtoenergy.com.mx (accessed on 8 January 2021).
- Echeverri-Londoño, C.A.; González-Fernández, A.E. Model for the Prediction of Noise from Wind Turbines. Rev. Fac. Ing. Univ. Antioq. 2018. [Google Scholar] [CrossRef]
- Lopez-Villalobos, C.; Rodriguez-Hernandez, O.; Campos-Amezcua, R.; Hernandez-Cruz, G.; Jaramillo, O.; Mendoza, J. Wind Turbulence Intensity at La Ventosa, Mexico: A Comparative Study with the IEC61400 Standards. Energies 2018, 11, 3007. [Google Scholar] [CrossRef] [Green Version]
- Cadenas, E.; Campos-Amezcua, R.; Rivera, W.; Espinosa-Medina, M.A.; Méndez-Gordillo, A.R.; Rangel, E.; Tena, J. Wind Speed Variability Study Based on the Hurst Coefficient and Fractal Dimensional Analysis. Energy Sci. Eng. 2019, 7. [Google Scholar] [CrossRef]


| Wind Speed [m/s] | SPLbg [dB] | Atmospheric Pressure [Pa] | Temperature [°C] | Relative Humidity [%] | Time [hh:mm] |
|---|---|---|---|---|---|
| 1.9 | 45.5 | 101.3 | 35 | 34 | 12:50 |
| 3.0 | 48.5 | 101.3 | 35 | 34 | 12:55 |
| 2.5 | 47.4 | 101.3 | 35 | 34 | 13:00 |
| 3.4 | 49.1 | 101.3 | 35 | 34 | 13:05 |
| 4.6 | 50.1 | 101.3 | 35 | 34 | 13:10 |
| 4.1 | 54.5 | 101.3 | 35 | 34 | 13:15 |
| 4.6 | 57.1 | 101.3 | 35 | 34 | 13:20 |
| 4.7 | 59.6 | 101.3 | 35 | 34 | 13:25 |
| 2.7 | 51.1 | 101.3 | 35 | 34 | 13:30 |
| 3.5 | 57.1 | 101.3 | 35 | 34 | 13:35 |
| 2.1 | 56.3 | 101.3 | 35 | 34 | 13:40 |
| 2.8 | 53.9 | 101.3 | 35 | 34 | 13:45 |
| 3.0 | 51.9 | 101.3 | 35 | 34 | 13:50 |
| 2.8 | 53.9 | 101.3 | 35 | 34 | 13:55 |
| 1.2 | 45.8 | 101.3 | 35 | 34 | 14:00 |
| 2.1 | 51.3 | 101.3 | 35 | 34 | 14:05 |
| 2.3 | 51.6 | 101.3 | 35 | 34 | 14:10 |
| 1.6 | 44.4 | 101.3 | 35 | 34 | 14:15 |
| 1.8 | 47.7 | 101.3 | 35 | 34 | 14:20 |
| 2.7 | 52.9 | 101.3 | 35 | 34 | 14:25 |
| 3.1 | 55.1 | 101.3 | 35 | 34 | 14:30 |
| 3.0 | 51.6 | 101.3 | 35 | 34 | 14:35 |
| 2.5 | 45.8 | 101.3 | 35 | 34 | 14:40 |
| 3.3 | 63 | 101.3 | 35 | 34 | 14:45 |
| 1.8 | 47.3 | 101.3 | 35 | 34 | 14:50 |
| 2.0 | 49.3 | 101.3 | 35 | 34 | 14:55 |
| 1.9 | 45.3 | 101.3 | 35 | 34 | 15:00 |
| 3.0 | 45.9 | 101.3 | 35 | 34 | 15:05 |
| 2.6 | 52.2 | 101.3 | 35 | 34 | 15:10 |
| 1.3 | 50.3 | 101.3 | 35 | 34 | 15:15 |
| 6.3 | 53.9 | 101.3 | 35 | 34 | 15:20 |
| 4.0 | 56 | 101.3 | 35 | 34 | 15:25 |
| 1.2 | 52.2 | 101.3 | 35 | 34 | 15:30 |
| Wind Speed [m/s] | SPLwt,bg [dB] | Atmospheric Pressure [Pa] | Temperature [°C] | Relative Humidity [%] | Time [hh:mm] |
|---|---|---|---|---|---|
| 5.5 | 63.9 | 101.3 | 35 | 34 | 11:10 |
| 3.0 | 67.4 | 101.3 | 35 | 34 | 11:15 |
| 2.5 | 67.0 | 101.3 | 35 | 34 | 11:20 |
| 3.0 | 72.0 | 101.3 | 35 | 34 | 11:25 |
| 2.0 | 64.0 | 101.3 | 35 | 34 | 11:30 |
| 7.0 | 69.0 | 101.3 | 35 | 34 | 11:35 |
| 4.0 | 61.0 | 101.3 | 35 | 34 | 11:40 |
| 7.5 | 62.8 | 101.3 | 35 | 34 | 11:45 |
| 3.0 | 62.0 | 101.3 | 35 | 34 | 11:50 |
| 4.0 | 64.0 | 101.3 | 35 | 34 | 11:55 |
| 2.0 | 59.0 | 101.3 | 35 | 34 | 12:00 |
| 4.0 | 60.0 | 101.3 | 35 | 34 | 12:05 |
| 2.5 | 57.0 | 101.3 | 35 | 34 | 12:10 |
| 8.0 | 65.0 | 101.3 | 35 | 34 | 12:15 |
| 7.0 | 63.0 | 101.3 | 35 | 34 | 12:20 |
| 5.0 | 60.0 | 101.3 | 35 | 34 | 12:25 |
| 4.6 | 63.0 | 101.3 | 35 | 34 | 12:30 |
| 5.0 | 68.0 | 101.3 | 35 | 34 | 12:35 |
| 2.0 | 60.0 | 101.3 | 35 | 34 | 12:40 |
| 4.0 | 61.2 | 101.3 | 35 | 34 | 12:45 |
| 2.3 | 56.0 | 101.3 | 35 | 34 | 12:50 |
| 1.5 | 58.0 | 101.3 | 35 | 34 | 12:55 |
| 2.7 | 57.0 | 101.3 | 35 | 34 | 13:00 |
| 5.0 | 66.0 | 101.3 | 35 | 34 | 13:05 |
| 4.0 | 62.0 | 101.3 | 35 | 34 | 13:10 |
| 3.0 | 61.0 | 101.3 | 35 | 34 | 13:15 |
| 5.0 | 62.0 | 101.3 | 35 | 34 | 13:20 |
| 5.5 | 63.0 | 101.3 | 35 | 34 | 13:25 |
| 4.0 | 67.0 | 101.3 | 35 | 34 | 13:30 |
| 2.0 | 60.0 | 101.3 | 35 | 34 | 13:35 |
| 2.3 | 63.7 | 101.3 | 35 | 34 | 13:40 |
| Section [-] | Radius [m] | Chord [m] | Twist [°] | Section [-] | Radius [m] | Chord [m] | Twist [°] |
|---|---|---|---|---|---|---|---|
| 1 | 0.145 | 0.165 | 22.4 | 9 | 0.625 | 0.089 | 10.1 |
| 2 | 0.205 | 0.155 | 20.9 | 10 | 0.685 | 0.079 | 8.5 |
| 3 | 0.265 | 0.146 | 19.3 | 11 | 0.745 | 0.069 | 7.0 |
| 4 | 0.325 | 0.136 | 17.8 | 12 | 0.805 | 0.060 | 5.4 |
| 5 | 0.385 | 0.127 | 16.2 | 13 | 0.865 | 0.050 | 3.9 |
| 6 | 0.445 | 0.117 | 14.7 | 14 | 0.925 | 0.041 | 2.4 |
| 7 | 0.505 | 0.108 | 13.2 | 15 | 0.986 | 0.031 | 0.8 |
| 8 | 0.565 | 0.098 | 11.6 |
| Wind Speed [m/s] | Sound Pressure Level [dB] | Sound Power Level [dB] |
|---|---|---|
| 10 | 71.2 | 82.2 |
| 9 | 71.1 | 82.2 |
| 8 | 70.9 | 81.9 |
| 7 | 70.0 | 81.0 |
| 6 | 69.0 | 80.0 |
| 5 | 67.0 | 78.0 |
| Wind Speed [m/s] | Propagation Distance [m] | |||
|---|---|---|---|---|
| 1 | 8 | 10 | 20 | |
| SPL [dB] | ||||
| 5 | 78.0 | 59.0 | 58.0 | 51.9 |
| 6 | 80.0 | 61.0 | 60.0 | 53.9 |
| 7 | 81.0 | 62.0 | 61.0 | 54.9 |
| 8 | 81.9 | 63.0 | 61.9 | 55.8 |
| 9 | 82.2 | 64.0 | 62.2 | 56.1 |
| 10 | 82.2 | 64.0 | 62.2 | 56.1 |
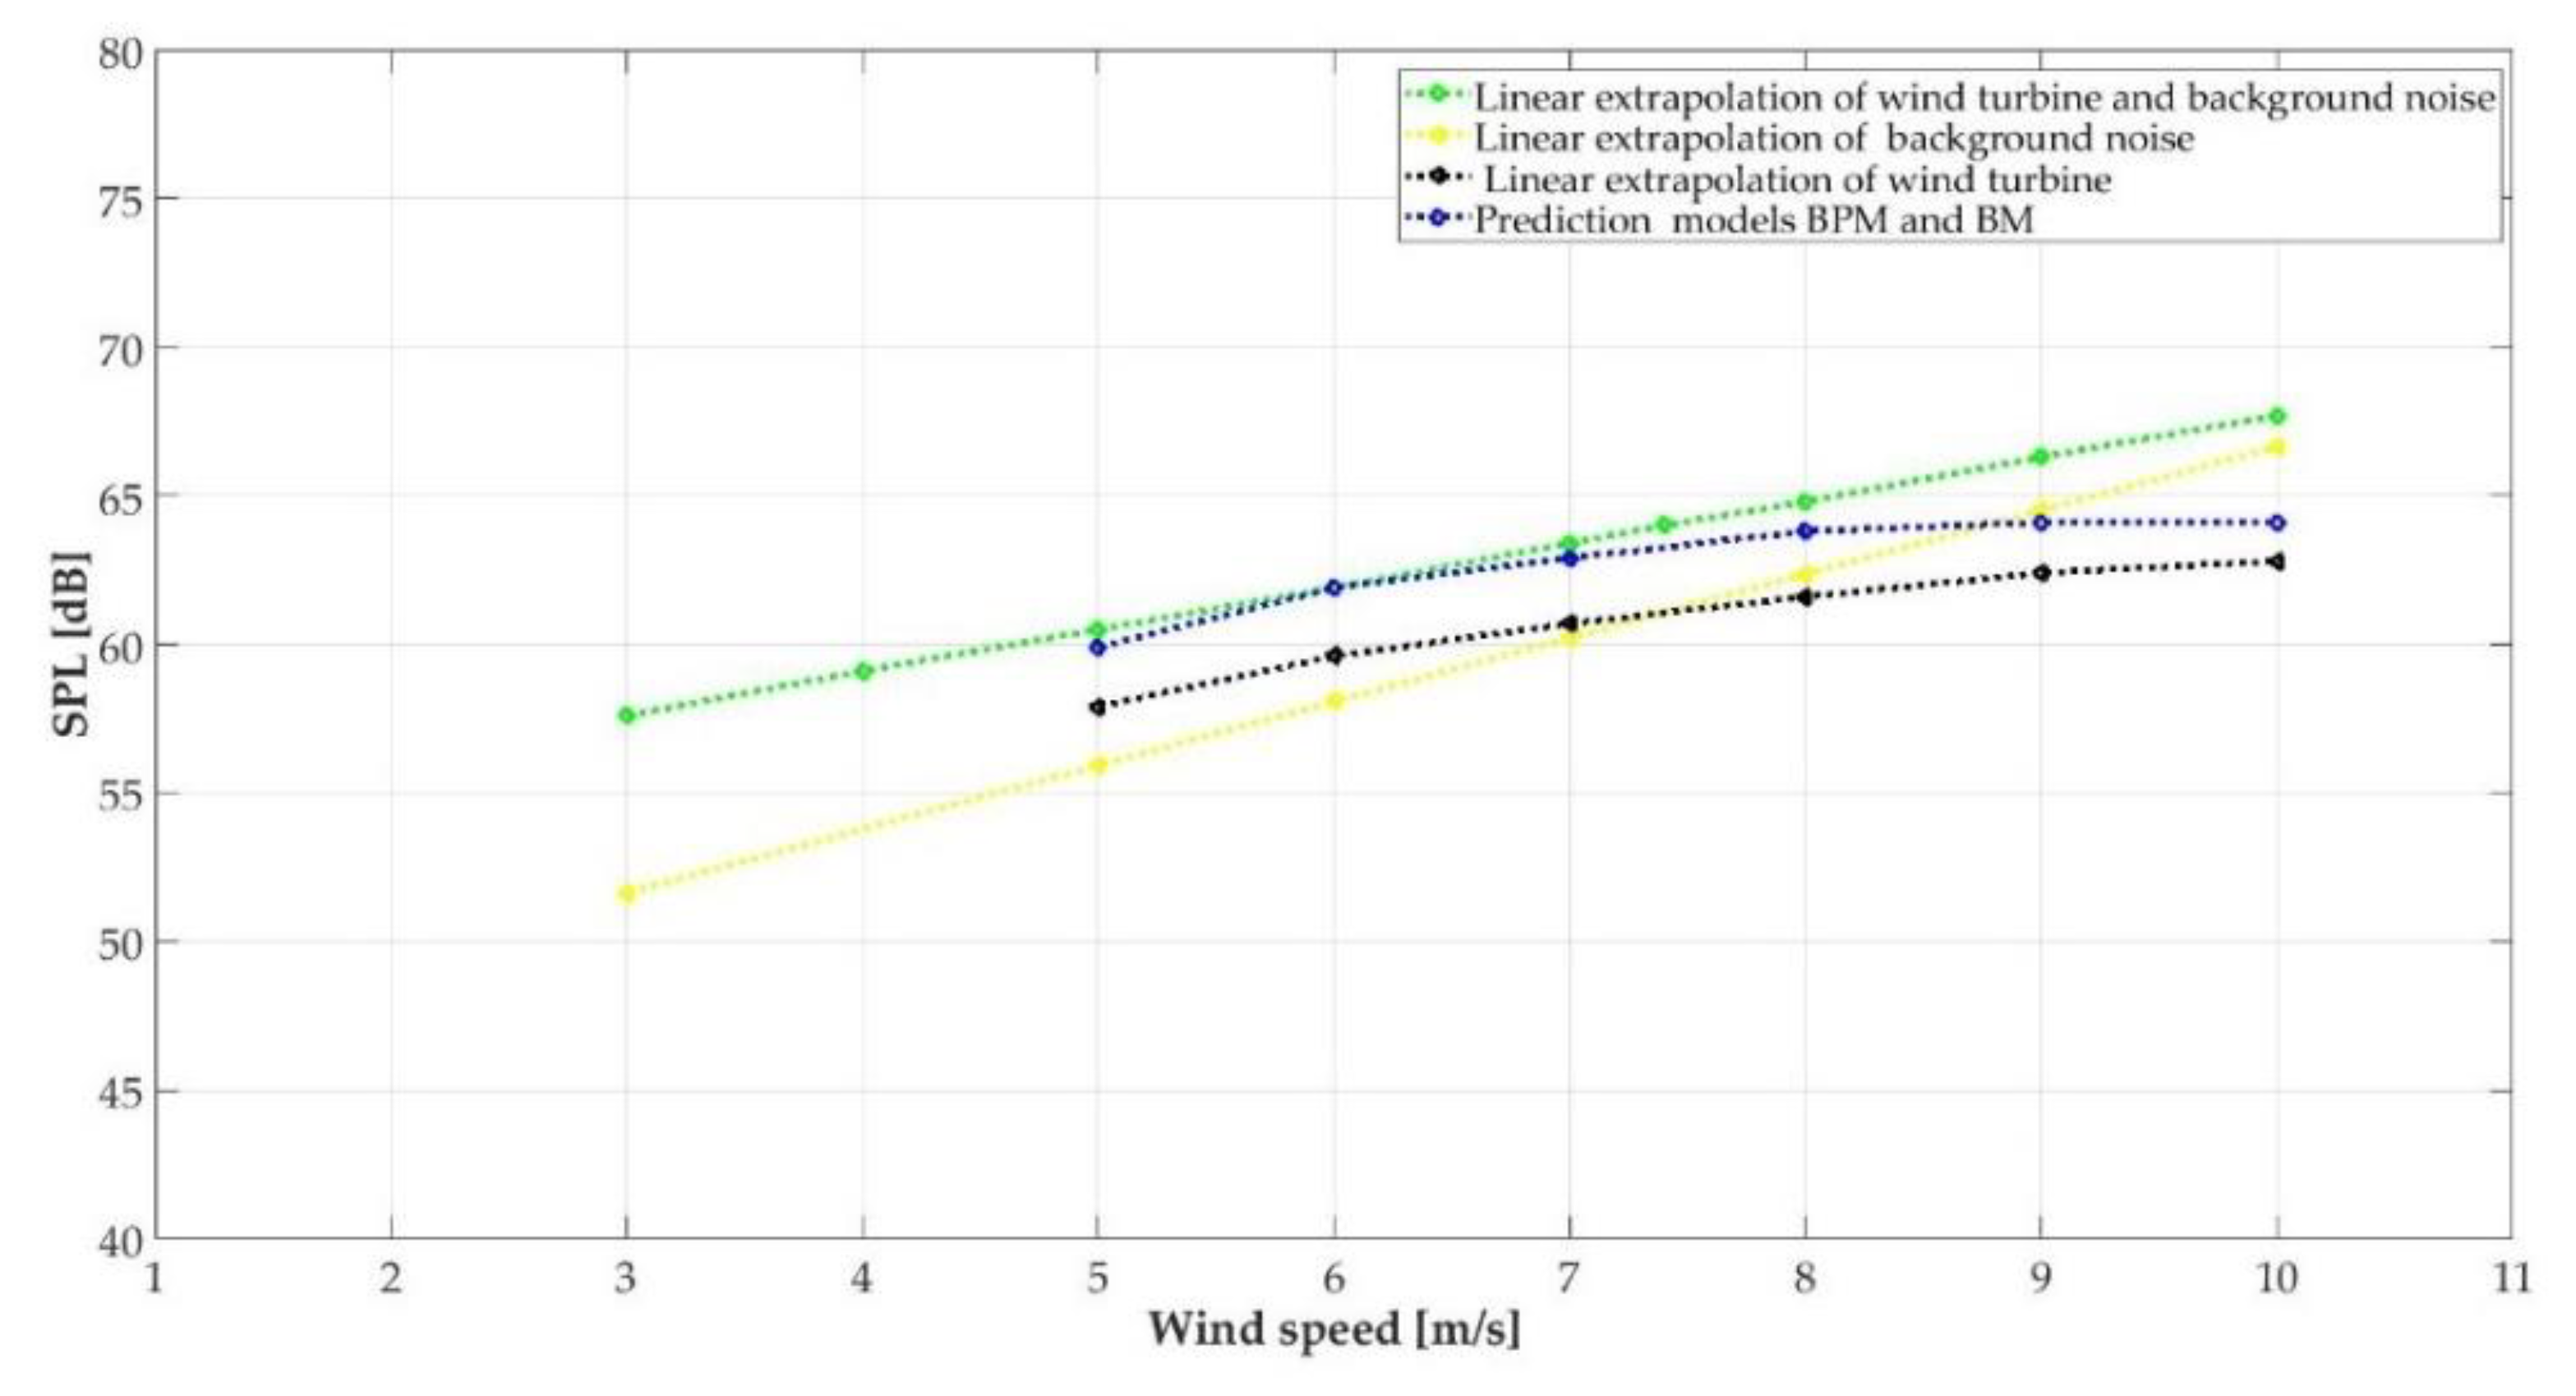
| Wind Speed [m/s] | SPL [dB] | Error [%] | |
|---|---|---|---|
| Experimental Analysis: Wind Turbine | Theoretical Analysis: Wind Turbine | ||
| 5 | 57.9 | 59.0 | 3.4 |
| 6 | 59.6 | 61.9 | 3.8 |
| 7 | 60.7 | 62.9 | 3.6 |
| 8 | 61.6 | 63.8 | 3.5 |
| 9 | 62.4 | 64.1 | 2.7 |
| 10 | 62.8 | 64.1 | 2.0 |
Publisher’s Note: MDPI stays neutral with regard to jurisdictional claims in published maps and institutional affiliations. |
© 2021 by the authors. Licensee MDPI, Basel, Switzerland. This article is an open access article distributed under the terms and conditions of the Creative Commons Attribution (CC BY) license (http://creativecommons.org/licenses/by/4.0/).
Share and Cite
Dorrego, J.R.; Ríos, A.; Hernandez-Escobedo, Q.; Campos-Amezcua, R.; Iracheta, R.; Lastres, O.; López, P.; Verde, A.; Hechavarria, L.; Perea-Moreno, M.-A.; et al. Theoretical and Experimental Analysis of Aerodynamic Noise in Small Wind Turbines. Energies 2021, 14, 727. https://doi.org/10.3390/en14030727
Dorrego JR, Ríos A, Hernandez-Escobedo Q, Campos-Amezcua R, Iracheta R, Lastres O, López P, Verde A, Hechavarria L, Perea-Moreno M-A, et al. Theoretical and Experimental Analysis of Aerodynamic Noise in Small Wind Turbines. Energies. 2021; 14(3):727. https://doi.org/10.3390/en14030727
Chicago/Turabian StyleDorrego, José R., Armando Ríos, Quetzalcoatl Hernandez-Escobedo, Rafael Campos-Amezcua, Reynaldo Iracheta, Orlando Lastres, Pascual López, Antonio Verde, Liliana Hechavarria, Miguel-Angel Perea-Moreno, and et al. 2021. "Theoretical and Experimental Analysis of Aerodynamic Noise in Small Wind Turbines" Energies 14, no. 3: 727. https://doi.org/10.3390/en14030727
APA StyleDorrego, J. R., Ríos, A., Hernandez-Escobedo, Q., Campos-Amezcua, R., Iracheta, R., Lastres, O., López, P., Verde, A., Hechavarria, L., Perea-Moreno, M.-A., & Perea-Moreno, A.-J. (2021). Theoretical and Experimental Analysis of Aerodynamic Noise in Small Wind Turbines. Energies, 14(3), 727. https://doi.org/10.3390/en14030727