Abstract
The integration of a variety of heterogeneous energy sources and different energy storage systems has led to complex infrastructures and made apparent the urgent need for efficient energy control and management. This work presents a non-linear model predictive controller (NMPC) that aims to coordinate the operation of interconnected multi-node microgrids with energy storage capabilities. This control strategy creates a superstructure of a smart-grid consisting of distributed interconnected microgrids, and has the ability to distribute energy among a pool of energy storage means in an optimal way, formulating a virtual central energy storage platform. The goal of this work is the optimal exploitation of energy produced and stored in multi-node microgrids, and the reduction of auxiliary energy sources. A small-scale multi-node microgrid was used as a basis for the mathematical modelling and real data were used for the model validation. A number of operation scenarios under different weather conditions and load requests, demonstrates the ability of the NMPC to supervise the multi-node microgrid resulting to optimal energy management and reduction of the auxiliary power devices operation.
1. Introduction
Climate change, global warming and ozone depletion are important issues for reducing carbon dioxide emissions. In combination with the increased energy demand and the reduced fossil fuel stocks, the global interest has shifted to alternative energy sources. Distributed renewable production, over the years evolved into an organized structure by integrating local energy storage systems and loads [1]. These structures known as microgrids have undertaken the fulfillment of energy demand, mostly based on renewable energy [2]. Microgrids contain electricity sources and loads and they consist of various sources of distributed generation, and most importantly renewable energy sources (RES) [3]. The integration of numerous power devices in microgrids along with the stochastic nature of renewable generation and the uncertainty concerning the load demand resulted in the need of appropriate management and control [4,5,6].
A review in microgrid technologies can be found in [7] where the authors provide a multi-disciplinary portrait of today’s microgrid drivers, real-world applications, challenges, and future prospects. Authors in [8] give an overview of the main control topics in microgrids, covering different control levels, emphasizing on energy management systems with model predictive control (MPC). Many approaches have been reported in the literature for optimal control and management [9,10,11,12,13,14]. MPC is a control policy extensively used by the power system community. Advantage of this method is its capability to handle the future behavior of the system, the renewable energy generation and demand forecasts, the systems constraints, as well as the feedback mechanism it provides, making the controlled system more robust against uncertainty [15,16]. MPC methods used in power networks have been illustrated for voltage control [17], thermal loads [18], for managing the heating, ventilation and air conditioning units (HVAC) [19] and as a framework for controlling microgrids or multiple units with flexible power consumption [20,21]. As microgrids greatly depend on its renewables and load demand forecasts, which include certain amount of uncertainty [22], model predictive control (MPC) is an effective control policy to optimize their operation. The effectiveness of MPC as a control policy in microgrids is examined by numerous studies. In this respect, authors in [23] investigate the available MPC policies that can be applied for linear parameter varying (LPV) systems. Authors in [24] propose a supervisory MPC system for a wind/solar energy generation. The system computes the optimal power references for the generators and two local controllers drive the two subsystems to these references. In [25] a flexible and modular control scheme is presented that allows virtual power plant (VPP) operation, based on distributed MPC, while in [26] a distributed power scheduling approach is proposed for balancing the demand and supply. A distributed peer-to-peer multi-agent framework [27] and a two level MPC scheme [28] are proposed for managing the power sharing and ensuring stable operation in microgrids with inverter-interfaced distributed energy resources.
At isolated microgrids, the challenge is to provide an uninterrupted and stable power supply based only on local generation and storage. In [29] a centralized energy management system based on MPC is proposed. The goal is to reduce the negative impacts introduced by uncertainties of renewable energy generations. Additionally, [30] proposes a stochastic-predictive energy management system while in [31] a two-stage MPC based energy management comprising of two optimization layers is presented. The first supports power dispatch and the second, the prediction error correction while the power output of a diesel generator is used as control variable in order to minimize the microgrid operational cost. In [32] an MPC-based combined unit commitment and optimal power flow model is proposed for integrated energy management in isolated microgrids whereas authors in [33] propose an MPC-based centralized energy management strategy (EMS) for an isolated microgrid including a distribution network model and its unbalance conditions.
Extended research and evolution of microgrids resulted in structures integrating multiple distributed microgrids into larger multi-node microgrids by linking each other through power, information and control signals channels [34]. A challenge was raised because the energy management in these microgrids is needed not only to optimize operation of each microgrid, but also to achieve global optimization by coordinating power flow among microgrids. Studies on this field propose an MPC-based EMS [35,36] for multiple microgrids to optimally manage and coordinate energy supply and demand aiming at minimization of overall costs whereas in [37] a centralized MPC method for power flow management is proposed for cooperating microgrids, targeting to balance the supply and demand by maximizing renewable energy generation.
To this end, this work presents a framework for coordinating multi-microgrids based on Non Linear Model Predictive control. A two layer approach is used. The first layer consists of a low level internal hierarchical EMS providing a device level coordination and power flow at each node. The second layer implements a NMPC framework for managing the power flow between the interconnected battery energy storage systems (BESS) of the nodes. In this way a supervisory EMS is applied that does not affect directly the device level operation, but has an indirect affect to the systems through the BESS and the exchanged energy. The simplicity of the framework is derived from the ability of the NMPC to coordinate the energy storage systems, based on their energy state as well as on weather and load predictions and maintain independent device level operation letting it exclusively be handled by the internal EMS. The main aim of the work is to provide a reliable and highly efficient control scheme that can provide a solid basis for the study of multi-node microgrids and their response under different scenarios of weather and load situations. An increased flexibility can be achieved in the microgrid by aggregating the distributed BESS into one virtually larger central storage system. Additionally, the framework is highly parameterizable and it can be adapted not only to various types of energy devices and microgrid topologies but also to user and/or microgrid needs through the objective function’s weight coefficients.
The work is organized as follows: In Section 2, a description is given of the multi-node microgrid adopted for this research. The formulation of the mathematical models of the nodes based on the low level hierarchical EMS and the devices models, is also described in this section. In Section 3 the methodology is analyzed and the formulation of the NMPC is given. Section 4 presents the simulation results of three microgrid case studies. Finally in Section 5 a discussion is made and overall conclusions are given.
2. Multi-Node Microgrid
The methodology in this work is developed based on a real multi-node microgrid. The existing infrastructure is used in order to be able to apply, tune and validate the controller based on real data acquired from the field. This multi-node autonomous microgrid is powered from RES and consists of three smaller microgrids, the nodes. Each node integrates photovoltaics (PV) and wind turbines (WT) as energy sources, local loads and BESS. Additionally, diesel generators (DG) are included as backup energy sources. One of the nodes incorporates hydrogen generation and consumption infrastructure that is used in cases of renewable energy excess, where electricity is converted to hydrogen and stored in tanks. In case of energy shortage the stored hydrogen is converted to electricity to meet the load demand. The infrastructure consists of a low temperature proton exchange membrane (PEM) water electrolysis device (Electrolyzer) and a PEM fuel cell (FC). Moreover, each node incorporates all necessary devices and power electronics, such as converters and inverters, meters and chargers. A low-pressure intermediate tank and a final high-pressure tank for hydrogen storage as well as a compressor are also included. The operation of the microgrid is monitored by a supervisory control and data acquisition (SCADA) system [38]. An additional DC bus bar, that interconnects electrically the nodes, enables the exchange of energy through bidirectional DC/DC converters. Table 1 describes the power characteristics of the devices and Figure 1 shows the topology of the microgrid.

Table 1.
Power characteristics of the integrated devices.
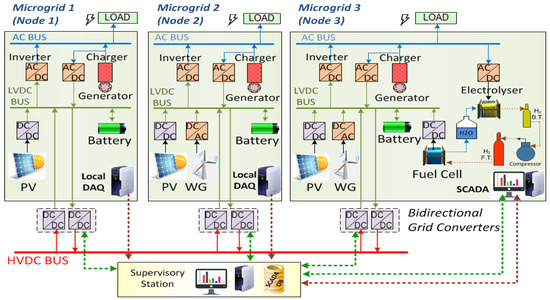
Figure 1.
Topology of the autonomous microgrid.
2.1. Methodology
The process of implementing the NMPC in the microgrid under study, due to the complexity of the structure and the plethora of subsystems, requires careful planning both in the construction of the models as well as in the definition of the constraints governing the system. The steps are:
- Mathematical models of all the devices that make up the nodes of the microgrid were used.
- Finding the parameters determined from the technical characteristics of all devices.
- Validating of the mathematical models. Experimental data and characteristic curves of the devices were used for the validation of the models.
- Creating an energy management algorithm for each node. An EMS is implemented internally at each node.
- Using the mathematical models of the devices and the energy management algorithm, the mathematical model of each node was developed.
- Developing and implementing the NMPC for the nodes taking into account the operating constraints. The NMPC is the basis for the creation of a virtual central storage platform and the resulting optimal energy management among the nodes of the microgrid.
2.2. Mathematical Models
The mathematical models of the devices of each node of the micro grid are from [39]. The process models that describe the topology of the nodes of the multi node microgrid and used for prediction and optimization by the NMPC, have been developed on the basis of a hierarchical EMS. The mathematical models include batteries (lead acid accumulators), photovoltaic panels, wind turbines and in case of H2 production a PEM electrolyzer, a PEM fuel cell, hydrogen low and high pressure storage tanks and a hydrogen compressor [39,40]. All mathematical models were experimentally verified with data acquired from the onsite SCADA archiving system [41] and from tests conducted in CPERI/CERTH laboratories (fuel cell). Indicative results from the validation process can be found in Appendix A.
2.3. Energy Management Strategy
The operation sequence of the power devices defines the EMS applied in each of the nodes of the microgrid. This sequence depends on the existing subsystems, the desired results and the technical characteristics of the devices [42,43,44]. In this work a hierarchical energy management is applied for the internal operation of the nodes (adopted by the SCADA system), targeting mainly on the load fulfillment [41].
The same strategy is applied to all three nodes, to keep the internal operation as simple as possible, in order to demonstrate the ability of the NMPC to provide in a higher level the optimal energy management in the multi-node microgrid. In the applied strategy (Figure 2), priority is given in the fulfillment of the load demand. The necessary power is provided firstly from the RES and subsequently from the BESS in case of RES shortage. The final power source to cover the load comes from the DG. If there is a power excess, the batteries are charged in priority until the maximum defined limit, and the remaining power is converted and stored as hydrogen.
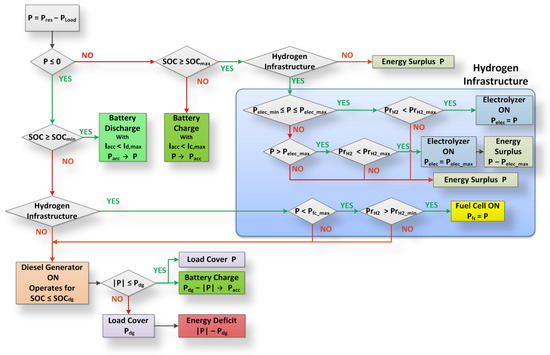
Figure 2.
Energy management strategy algorithm.
We define with P the available power in the node resulting by the difference between the renewable power PRES minus the load demand PLoad, i.e., P = PRES − PLoad. When P > 0, the battery state of charge (SOC) is checked. If SOC is not exceeding SOCmax, the excess power charges the batteries (Pacc = P). Otherwise, if the node integrates an electrolyzer, the available power P is compared with the device’s operational limits Pelec_min, Pelec_max and if being between them, P is exploited to produce hydrogen (Pelec = P). In case of P > Pelec_max, only the maximum feasible amount of power is handled by the electrolyzer (Pelec = Pelec_max). In all other cases, the power remains unexploited.
When P < 0, if SOC > SOCmin, the batteries discharge to cover the load (P = Pacc). Otherwise, if the node integrates a fuel cell, and the power demand is less than its operational limit Pfc_max, P is covered from the fuel cell power (Pfc = P). In any other case, the diesel generator is activated and produces constant power Pdg. Part of this power covers the load and the rest charges the battery. The generator remains active, until battery SOC reaches a predefined level SOCdg.
Additional operational limits of the devices have been taken into account, such as battery charging and discharging current limits,. which depend on the instant SOC [39], as well as hydrogen tank pressures PrH2, and limits PrH2_min, PrH2_max necessary for hydrogen utilization.
3. Formulation of the Non-Linear Model Predictive Control Framework
According to the mathematical formulation of the NMPC [45,46,47,48] the state variable vector . is the stored energy in the batteries, the controlled variable vector is the state of the battery charge SOC% and the manipulated variable vector. is the power that needs to be transferred from and to each node.
At each time instant t, each node . has an energy state. This is calculated from the mathematical model and the EMS applied in each node and depends on the respective weather forecast and load demand. The controlled variable is a function of the state variable and the manipulated variable. Positive values of . depict power inflow into node i from other nodes while negative values depict power outflow to other nodes. defines the control signals to be applied on the DC/DC converter of node i in order to achieve the energy exchange with the other nodes of the microgrid.
For weighting independently the inflow and outflow exchanged power, manipulated variables . are divided into charging () and discharging variables ().
. depicts the set point of the SOC of node i at time instant t.
The optimal control problem can be described as a trajectory following problem, applying the minimum amount of energy. The functional J in Equation (2) is defined by the sum of squares of the distances of the controlled variables . from the reference trajectory . multiplied with a matrix of appropriate weight coefficients Q and the sum of squares of the manipulated variables . for each node in the prediction horizon multiplied also with a matrix of appropriate coefficients P.
At each time step k, a prediction of the energy states . is made for the current step and the next Np − 1 steps,
with functions fa,i being a set of algebraic equations that define the process model. The process model was developed in MATLAB environment and consists of three functions. Each function is developed taking into account the mathematical models of the devices (Figure 1), the power characteristics (Table 1) and the hierarchical EMS applied for each node (Figure 2). The prediction error between the current predicted state and the current real state is calculated by:
This error is added to the predicted states of the entire prediction horizon Tp,
resulting the . states for the cost function J. The optimal control values for the control horizon Tc are then recalculated by minimizing the cost function J within the prediction horizon Tp
with respect to u and taking into account a set of constrains. Only the first control value of the optimal control sequence is applied to the DC/DC converters and the procedure is then repeated for the next time step. The duration of each step is 5 min.
Matrices Q and P, are diagonal positive definite matrices of order Np and are weight matrices for the quadratic terms in the cost function. Matrix Q defines the rate at which each node reaches the target while matrix P defines the significance of each node’s participation in providing or receiving energy. Both matrices weight the quadratic terms of the cost function for the entire prediction horizon.
Constraints
The cost function J is subject to several physical and conceptual constrains. The solution of the optimal control problem takes into account all constrains which are applied at each time-step k for every step . in the prediction horizon. The power exchange should be between the limits of the nominal power of the bidirectional DC/DC converters, rated at 2.5 kW:
Additionally, charging and discharging simultaneously a node, is not a feasible state. Thus,
In order for the exchanged energy balance to be maintained and since power flowing in and out of the node has opposite signs, the sum of the power exchanged at each time step should be zero.
Equation (10) determines the predefined limits of the batteries SOC (controlled variable .
Finally, Equation (11) determines the limits of the battery operating current .
4. Simulation Results
In order to demonstrate the benefits of the NMPC, three scenarios (case studies) were examined. The first scenario, demonstrates a 24-h operation of the microgrid with weather conditions similar to a typical spring day. The second scenario demonstrates the effectiveness of the controller under different set points and weight coefficients in the cost function and under unpredicted weather and load conditions for a 24-h operation. Finally, a long-term operation (7 days) of the microgrid is simulated in the third scenario for the controller’s long-term efficiency validation. To compare and highlight the capability of the controller to exploit the maximum amount of energy and balance the microgrid, in each scenario, two simulations of the microgrid operation are performed: one with the NMPC disabled (isolated node operation) and one with the controller enabled (interconnected node operation).
In all scenarios, each node starts at different levels of battery SOC. The initial SOC for the three nodes is 63%, 69% and 76.5% respectively. It is assumed that third node has initial stored hydrogen at 6 bars. For weather conditions prediction, the last 30 days average for 24 h of solar irradiation and wind speed are used. Furthermore, three typical residential load profiles are used.
4.1. Scenario 1—Daily Operation of the Microgrid
4.1.1. Μicrogrid Operation without the NMPC
In the first scenario, data of solar irradiation and wind speed were used by the models. Figure 3a shows the daily power production from the PV in each node, while Figure 3b shows the respective power from wind turbines. The load profiles of each node are shown in Figure 3c.
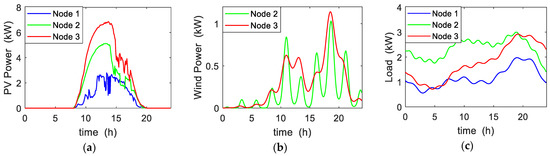
Figure 3.
Renewable power and loads in daily operation: (a) PV power production; (b) Wind Turbine power production; (c) Local load demand.
Figure 4a shows the total available power at each node. Positive values indicate power available for storage while negative indicate usage of stored power. After simulating the operation of the microgrid without power exchange (isolated node operation), the SOC evolution at any given time during the day is shown in Figure 4b.
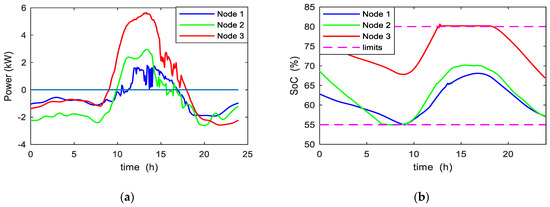
Figure 4.
(a) Available power in the nodes; (b) Battery SOC in daily operation.
The charging and discharging operation is observed in positive and negative availability respectively. In the first and the second node, the diesel generators are activated when minimum SOC is reached while in the third node the water electrolysis device is activated at maximum SOC in order to exploit excess energy.
A detailed operation of the power devices inside each node can be seen in Figure 5, Figure 6 and Figure 7. Figure 5a shows that the load in node 1 (dashed line) is covered initially by the battery. Afterwards the RES are gradually beginning to contribute during the day. At approximately 9:00 h, when the battery reaches the minimum SOC (55%), the diesel generator starts to operate offering 2 KW constant power to load demand and for the battery charging. During this period, battery is also charged from the RES. The generator stops as soon as the battery reaches 65% SOC (generator operating limit) at 14:00 h. From this point, the RES and the battery take over to fulfill the load. The total power flow along with any shortage or excess of energy in the node during the 24 h operation is given in Figure 5b with a Sankey diagram. Data of all Sankey diagrams in table form can be found in Appendix B.
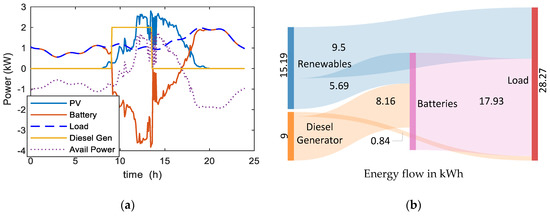
Figure 5.
Node 1 at isolated daily operation (NMPC off): (a) Systems operation; (b) Energy flow (kWh).
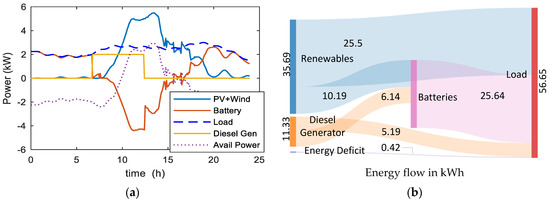
Figure 6.
Node 2 at isolated daily operation (NMPC off): (a) Systems operation; (b) Energy flow (kWh).
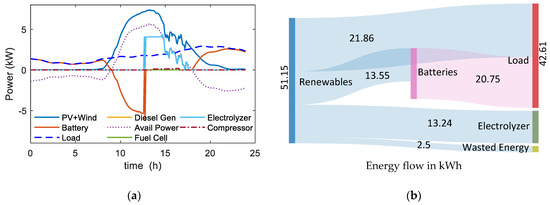
Figure 7.
Node 3 at isolated daily operation (NMPC off): (a) Systems operation; (b) Energy flow (kWh).
In a similar way, node 2 uses the diesel generator, since its battery also reaches the lower SOC limit. Figure 6a shows operation of all devices in node 2 while the total energy flow is depicted in Figure 6b.
In contrast to the first two nodes, the greater RES production capacity of node 3 (Figure 7), constantly covers the loads and brings the battery’s SOC in its maximum permissible limit, 80%. This results in the operation of the water electrolysis device at 12:30 h for the excess energy exploitation. As shown in Figure 7a, the electrolyzer operates at its maximum power (4 KW) for the first 2.5 h of operation, while in the remaining period (until 17:30) operates at the levels of renewable surplus.
A more detailed analysis of the microgrid’s operation reveals (Figure 8a) an additional energy shortage in node 2 at time periods where the diesel generator was activated, indicating unmet loads. At the third node, on the other hand, power excess occurs, even though the electrolyzer was in operation. The renewable hydrogen production, the pressures of the intermediate and the final hydrogen storage tanks (produced H2) are depicted in Figure 8b.
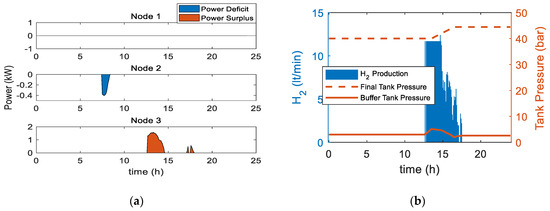
Figure 8.
Isolated daily operation (NMPC off) of the microgrid: (a) Resulting power shortage/surplus at the nodes; (b) Hydrogen production and storage tanks pressures.
4.1.2. Microgrid Operation with NMPC
By electrically interconnecting the three nodes through the common DC bus and applying the NMPC to the microgrid brings a significant difference in the overall operating state. When the controller actions for energy exchange are applied, the BESS of the three nodes create a distributed central storage unit. The operating conditions of the three nodes are suggested to be the same.
The goal of the NMPC is set to drive the batteries to a charging state of 80%. This goal however, can only be achieved when the globally required power at any time is available to the microgrid as a whole. Due to stochastic production from renewables, reaching the desired goal can be considered relative to the energy availability. The NMPC however, provides at all times the optimal solution fulfilling the constraints given the power availability of the renewable sources.
Figure 9a shows the battery SOC evolution which is balanced between limits after a short period of time and energy surplus and shortage is managed without the operation of auxiliary power devices. The appropriate control actions for energy transfer delivered by the optimal solution of the NMPC optimization problem are shown in Figure 9b. At any given time the control satisfies the constraints of batteries charging/discharging currents, exchanged power energy balance and limits of exchanged power.
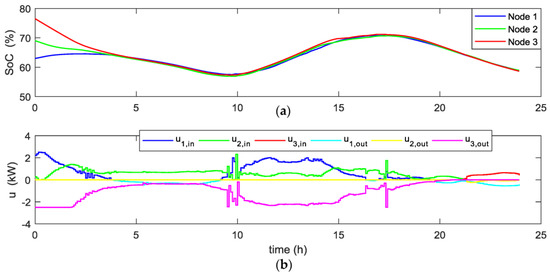
Figure 9.
(a) Battery SOC at each node with NMPC enabled; (b) Control actions u applied at each time step at the DC/DC converters.
The total energy flow throughout the microgrid is shown in Figure 10, as a result of the energy exchange actions determined by the NMPC. It is obvious that the control actions reflect the energy dynamics of each node, since the quantities of energy exchanged in total, correspond to the pre-existing energy state of each node.
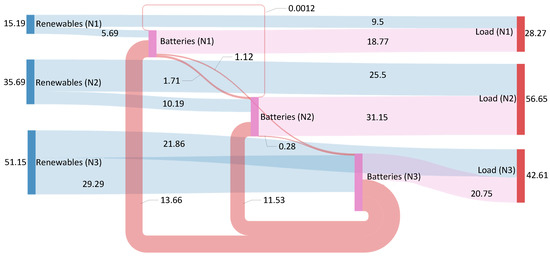
Figure 10.
Total daily energy flow (kWh) in the microgrid with the NMPC enabled.
4.2. Scenario 2—Daily Operation with Unpredicted Weather and Load Conditions
4.2.1. Operation without the NMPC
In this case study a variety of different assumptions is applied compared to the previous one. As shown in Figure 11a,b the operation of nodes 2 and 3 is simulated with load demands at the 2/3rd of the first case, which indicates an unforeseen change in power requirements and for node 3 less sun irradiation is assumed, that indicates an unforeseen change in weather conditions (disturbance). The wind turbine generation remains the same as previous scenario. Simulating the operation of the microgrid under these conditions, Figure 11c shows the evolution of the battery SOC during the 24 h operation and Figure 12, Figure 13 and Figure 14 show the detailed operation of the internal power systems of each node and the respective power flow.
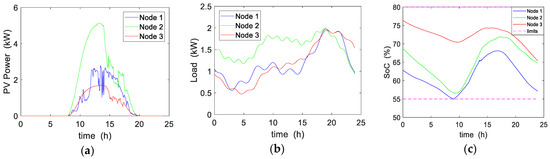
Figure 11.
Renewable power and loads simulating unpredicted conditions: (a) PV power production; (b) Local load demand; (c) Battery SOC evolution at each node.
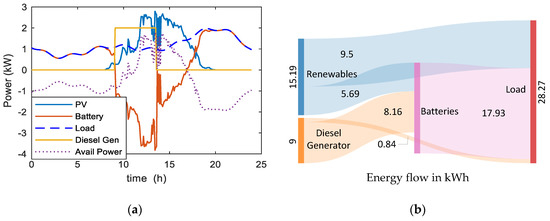
Figure 12.
Node 1 at isolated operation (NMPC off) with unpredicted conditions: (a) Systems operation; (b) Energy flow (kWh).
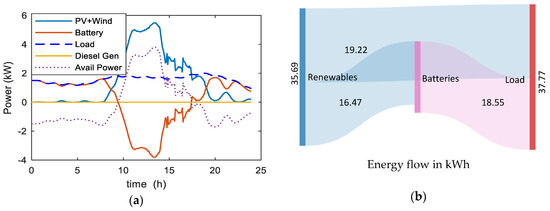
Figure 13.
Node 2 at isolated operation (NMPC off) with unpredicted conditions: (a) Systems operation; (b) Energy flow (kWh).
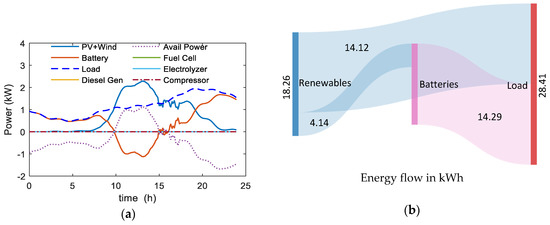
Figure 14.
Node 3 at isolated operation (NMPC off) with unpredicted conditions: (a) Systems operation; (b) Energy flow (kWh).
During the time periods having no sunshine the batteries cover the greatest amount of requested energy, with a small contribution of the wind generators at nodes 2 and 3. Although the power production from PVs in node 3 was almost ¼ th of the previous scenario, battery SOC remains in high levels. No energy surplus at node 3 is observed thus no hydrogen production is noticed. However, the node is capable of covering the loads. The same condition applies also for node 2. On the other hand, node 1 reaches instantly the lower SOC, and thus the diesel generator starts to offer the requested amount of energy as seen in Figure 12a.
4.2.2. Microgrid Operation with the NMPC
In the second scenario the controller efficiency in case of different reference trajectories for each node is investigated, including also a step change during the day. Moreover achieving the desired SOC in the first node is weighted as more important than for the other two ones (different weights in the cost function). To this end, the controller was adjusted to the desired reference trajectories giving more emphasis on the charging status of the first node in the objective function.
The resulting operation of the microgrid with the NMPC enabled is shown in Figure 15. The controller derives appropriate control actions in order to keep track of the targets (dashed lines) succeeding, as expected, better results for node 1.
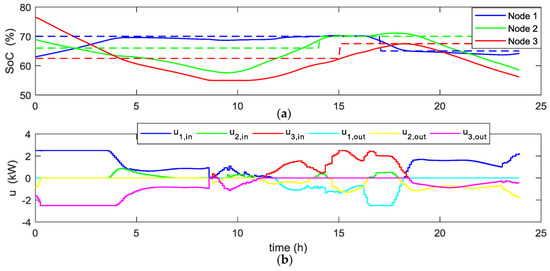
Figure 15.
(a) Battery SOC at each node with NMPC enabled; (b) Control actions u applied at each time step at the DC/DC converters.
The deviations of battery SOC from the desired trajectories at nodes 2 and 3 are equally divided, as a result of the optimal control actions, depending at the same time on the available renewable power constrain.
At node 3, due to the reduced renewable power and the given weight for achieving the SOC reference, the battery SOC reaches the lower level limit, which results in the activation of the fuel cell at 8:30 h. Figure 16a–c show the device operation at each node, with the battery power following the controller’s actions. The operation of the fuel cell is shown in Figure 16c (node 3) during the period of time that the battery reaches the lower SOC limit. A significant outcome is that node 3 offers power to other nodes during the fuel cell operation. Therefore, a single fuel cell device installed in one of the nodes can cover energy shortage in the whole microgrid as a result of the NMPC actions. Figure 16d shows the respective hydrogen consumption from the fuel cell.
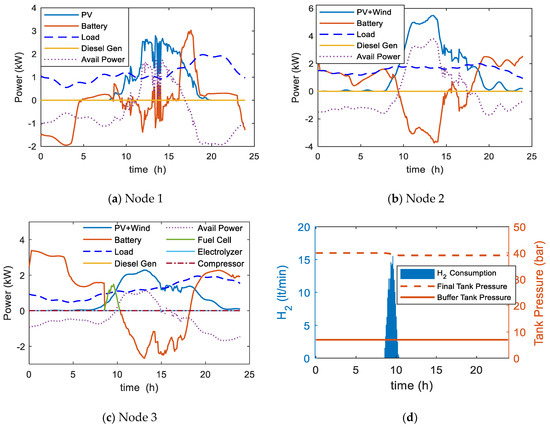
Figure 16.
(a–c) Systems operation with the NMPC enabled and with unpredicted conditions; (d) Hydrogen consumption and storage tanks pressures.
In Figure 17, the total power flow throughout the microgrid is depicted, after implementing the NMPC. Node 1 absorbs the largest amount of energy. There is generally a greater energy exchange in this scenario, as a result of the controller trying to meet the targets under different reference goals and load demands.
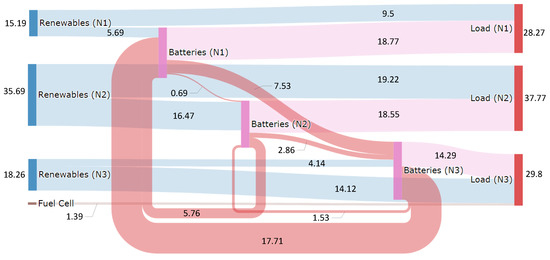
Figure 17.
Total daily energy flow (kWh) in the microgrid with the NMPC enabled and with unpredicted conditions.
4.3. Scenario 3—Weekly—Long Term Operation
4.3.1. Microgrid Operation without the NMPC
In order to validate the long-term efficiency of the controller, a seven-day operation of the microgrid was examined. In this case in order to investigate the controller’s efficiency under more extreme conditions, the diesel generator’s dynamics is decreased to 1 kW while the batteries low SOC limit is set to 60% resulting to narrower operation zone of 60–80%. Additionally, the renewable power generation is reduced to 75% of the nominal power. The required loads were set to 1 kWp, 1.5 kWp and 3 kWp for each node respectively. Thus the microgrid faces greater challenges in order to maintain its optimal operability. Figure 18a depicts the available power each node should handle for seven days.
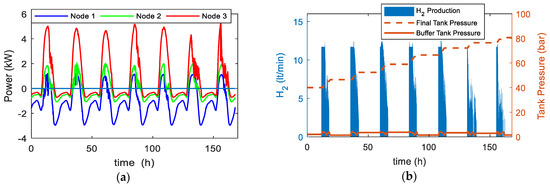
Figure 18.
(a) Available power at each node in weekly operation; (b) Hydrogen production and storage tanks pressures.
In the case where NMPC is not activated, (Figure 19) the extended usage of the diesel generator in node 1 is necessary, with an additional energy shortage. These unmet loads exist although at node 3 there is a surplus of unexploited energy and the electrolyzer is in operation (Figure 18b).
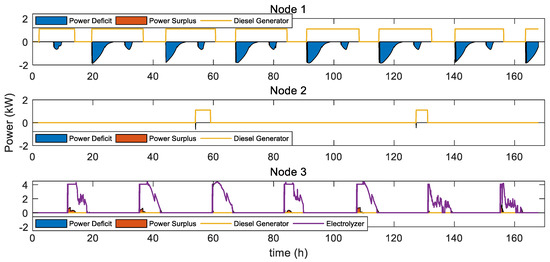
Figure 19.
Auxiliary power systems usage (diesel generator, electrolyzer) and total power shortage/surplus at each node in weekly operation.
4.3.2. Microgrid Operation with the NMPC
The batteries SOC evolution is shown in Figure 20a. The cases of with or without the activation of the NMPC is shown. The controller successfully manages to balance the dynamic of the microgrid, by providing cooperation. In case that all BESS reach the lower SOC, then the controller disallows the energy exchange. The respective control action is depicted in Figure 20b.
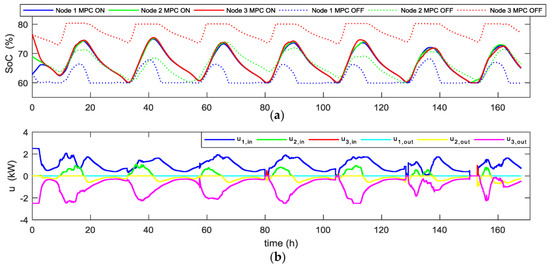
Figure 20.
(a) Battery SOC at each node with NMPC enabled; (b) Control actions u applied at each time step at the DC/DC converters.
Figure 21 shows the total energy flow through the three nodes. One can notice the contribution of the diesel generator in nodes 1 and 2 and the contribution of the fuel cell in node 3. This is a minimum contribution of the auxiliary power devices and took place in the periods where all three nodes reached the lower SOC.
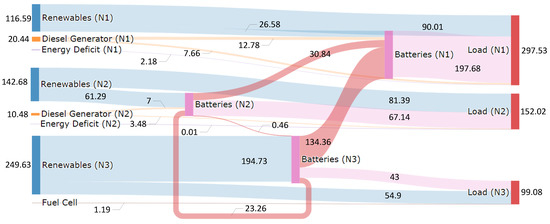
Figure 21.
Total energy flow (kWh) in the microgrid with the NMPC enabled in weekly operation.
5. Discussion
The interconnected operation of the microgrid nodes revealed a new perspective in the coordinated operation of the overall network. The NMPC demonstrates its ability to synchronize the operation of distributed microgrids and provide increased flexibility in the energy distribution by formulating a virtual central storage. The energy sharing provided by the controller’s actions, offers not only energy balance in the microgrid but also a significant change in the utilization of the auxiliary devices. The main goal of achieving optimal energy exploitation at each case is fulfilled. The NMPC framework can be highly parameterized and it can be adapted to various types of energy devices and microgrid topologies. Moreover, the controller itself can be adapted to user and/or microgrid needs through the objective function’s weight coefficients.
An overall analysis of the results proves the capabilities of the NMPC. The coordination of the BESS provides an indirect management of the local systems operation. The first scenario shows the minimization of the diesel generator and the electrolyzer operation with a respective reduction of the energy shortage and surplus periods (Figure 22a). At the more demanding second scenario (Figure 22b), even though the fuel cell initiated its operation, the provided power was relatively lower than the respective power that would be required by the usage of the diesel generator in the isolated mode operation.
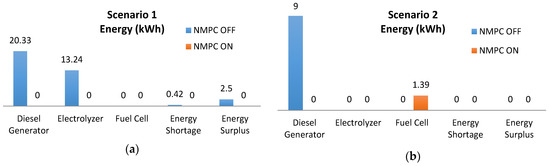
Figure 22.
Comparative results in energy management: (a) Daily operation; (b) Daily operation with disturbance.
At the third scenario of the weakly operation (Figure 23), a significant reduction is observed in the NMPC case to the diesel generator operation by 76.65% and to the energy shortage by 95.85%. The energy surplus is also reduced, which depicts that the energy is optimally exploited throughout the entire microgrid.
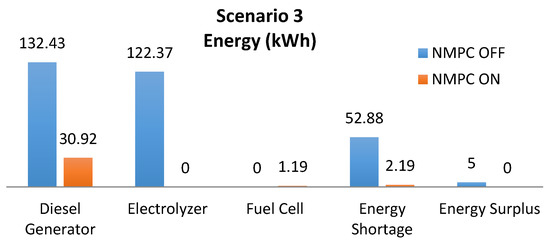
Figure 23.
Comparative results in energy management in seven-day operation.
Overall we can say that the presented NMPC meets the requirements for a coordinated and balanced operation, taking into account unpredictable weather fluctuations, user defined expectations and constrains set by the microgrid and systems operation.
6. Conclusions
In the present work the development of a NMPC scheme for the supervisory management of energy in an autonomous RES-powered microgrid was presented. The controller takes in account all the features of a multi-node microgrid including renewables, H2, storage and load demands. An investigation in the behavior of the controller under nominal operational conditions and under disturbances in weather, load demands, changes of SOC profiles and long term operation, prove the effectiveness and robustness of the controller. The integration of the transferred energy among the nodes in the cost function reduces the transferred amounts of energy, protecting the BESS from multiple charging/discharging cycles. By independently weighting the manipulated variables, additional flexibility is given for the power that each node should provide or receive. In this way necessary restrictions can be applied, depending on user and/or microgrid needs.
Three case studies were demonstrated where the behavior of the nodes was studied both in connected and isolated mode. The comparison demonstrated that the controller always fulfills the operating objectives, regardless of the RES fluctuation. Overall the NMPC coordinates the energy exchange between the storage systems and therefore performs an aggregation of the distributed energy storage formulating a virtual larger system that acts as central storage for the multi-node microgrid. This virtual central storage is able to manage local energy shortage or excess at all times reducing or even eliminating the operation of the auxiliary power systems (diesel generator).
The main benefit derived by the NMPC application is the optimal usage of the renewable energy, through the minimization of the losses. On the other hand, reducing the operation of auxiliary sources offers not only economic benefits (fuel, maintenance), but also environmental, due to reduced carbon dioxide emissions. Adjusting the operation of sensitive hydrogen devices (water electrolysis device and fuel cell) to the optimal is another economic benefit, since the cost of purchasing and maintaining these devices and the required infrastructure is high. In short, the use of the NMPC framework, to control and achieve energy balance between the nodes, maximizes the autonomy of the microgrid in terms of profitability, economy and environmental friendliness.
Author Contributions
Conceptualization, D.T. and C.Z.; funding acquisition, S.V.; methodology, D.T., C.Z., S.V. and S.P.; project administration, S.V. and S.P.; software, D.T.; supervision, S.P.; writing—original draft preparation, D.T.; writing—review and editing, C.Z. and S.P.; All authors have read and agreed to the published version of the manuscript.
Funding
This research has received funding from the European Union HORIZON 2020 project inteGRIDy—integrated Smart GRID Cross-Functional Solutions for Optimized Synergetic Energy Distribution, Utilization and Storage Technologies, H2020 Grant Agreement Number: 731268.
Acknowledgments
The authors would like to thank the anonymous reviewers for their insightful comments and valuable suggestions on this paper.
Conflicts of Interest
The authors declare no conflict of interest.
Appendix A. Indicative Results of Models Verification

Figure A1.
Experimental verification of the models a: (a) 2000 Ah lead acid battery (b) Electrolyzer.

Figure A2.
Experimental verification of the Fuel Cell’s model: (a) V-I current curve, (b) P-I curve.
Appendix B. Comparative Results from the Use Cases
Table A1.
Comparative results from Scenario 1—Daily operation.
Table A1.
Comparative results from Scenario 1—Daily operation.
| Energy (kWh) | Node 1 | Node 2 | Node 3 | |||
| NMPC OFF | NMPC ON | NMPC OFF | NMPC ON | NMPC OFF | NMPC ON | |
| Total Renewable Energy | 15.1879 | 35.6866 | 51.1523 | |||
| Load | 28.2738 | 56.6508 | 42.6078 | |||
| Renewable Energy to Batteries | 5.6857 | 5.6857 | 10.1872 | 10.1872 | 13.5534 | 29.2948 |
| Renewable Energy to Load | 9.5022 | 9.5022 | 25.4994 | 25.4994 | 21.8575 | 21.8575 |
| Renewable Energy Surplus | 0 | 0 | 0 | 0 | 2.5032 | 0 |
| Diesel Generator to Batteries | 8.1615 | 0 | 6.1425 | 0 | 0 | 0 |
| Diesel Generator to Load | 0.8385 | 0 | 5.1908 | 0 | 0 | 0 |
| Energy Shortage | 0 | 0 | 0.4168 | 0 | 0 | 0 |
| Fuel Cell | - | - | - | - | 0 | 0 |
| Batteries to Load | 17.9313 | 18.7716 | 25.6371 | 31.1514 | 20.7503 | 20.7503 |
| Renewable Energy to Electrolyzer (Hydrogen) | - | - | - | - | 13.2382 | 0 |
| Node 1 to… | - | - | 0 | 1.7143 | 0 | 1.1173 |
| Node 2 to… | 0 | 0.0012 | - | - | 0 | 0.2763 |
| Node 3 to… | 0 | 13.6576 | 0 | 11.5332 | - | - |
Table A2.
Comparative results from Scenario 2—Daily operation with unpredicted weather and load conditions.
Table A2.
Comparative results from Scenario 2—Daily operation with unpredicted weather and load conditions.
| Energy (kWh) | Node 1 | Node 2 | Node 3 | |||
| NMPC OFF | NMPC ON | NMPC OFF | NMPC ON | NMPC OFF | NMPC ON | |
| Total Renewable Energy | 15.1879 | 35.6866 | 18.2598 | |||
| Load | 28.2738 | 37.7672 | 28.4052 | |||
| Renewable Energy to Batteries | 5.6857 | 5.6857 | 16.4699 | 16.4699 | 4.1406 | 4.1406 |
| Renewable Energy to Load | 9.5022 | 9.5022 | 19.2168 | 19.2168 | 14.1193 | 14.1193 |
| Renewable Energy Surplus | 0 | 0 | 0 | 0 | 0 | 0 |
| Diesel Generator to Batteries | 8.1615 | 0 | 0 | 0 | 0 | 0 |
| Diesel Generator to Load | 0.8385 | 0 | 0 | 0 | 0 | 0 |
| Energy Shortage | 0 | 0 | 0 | 0 | 0 | 0 |
| Fuel Cell | - | - | - | - | 0 | 1.3884 |
| Batteries to Load | 17.9313 | 18.7716 | 18.5504 | 18.5504 | 14.2860 | 14.2860 |
| Renewable Energy to Electrolyzer (Hydrogen) | - | - | - | - | 0 | 0 |
| Node 1 to… | - | - | 0 | 0.6859 | 0 | 7.5275 |
| Node 2 to… | 0 | 5.7639 | - | - | 0 | 2.8609 |
| Node 3 to… | 0 | 17.709 | 0 | 1.5275 | - | - |
Table A3.
Comparative results from Scenario 3—Weekly—Long term operation.
Table A3.
Comparative results from Scenario 3—Weekly—Long term operation.
| Energy (kWh) | Node 1 | Node 2 | Node 3 | |||
| NMPC OFF | NMPC ON | NMPC OFF | NMPC ON | NMPC OFF | NMPC ON | |
| Total Renewable Energy | 116.5930 | 142.6770 | 249.6322 | |||
| Load | 297.5335 | 152.0241 | 99.0844 | |||
| Renewable Energy to Batteries | 26.5844 | 26.5844 | 61.2895 | 61.2895 | 67.3874 | 194.7302 |
| Renewable Energy to Load | 90.0116 | 90.0116 | 81.3875 | 81.3875 | 54.9020 | 54.9020 |
| Renewable Energy Surplus | 0 | 0 | 0 | 0 | 4.9963 | 0 |
| Diesel Generator to Batteries | 24.6674 | 12.7806 | 0 | 6.9969 | 0 | 0 |
| Diesel Generator to Load | 105.0409 | 7.6611 | 2.7198 | 3.4844 | 0 | 0 |
| Energy Shortage | 52.8790 | 2.1795 | 0 | 0.0147 | 0 | 0 |
| Fuel Cell | - | - | - | - | 0 | 1.1904 |
| Batteries to Load | 52.0602 | 197.6805 | 67.6016 | 67.1399 | 44.1824 | 42.9920 |
| Renewable Energy to Electrolyzer (Hydrogen) | - | - | - | - | 122.3738 | 0 |
| Node 1 to… | - | - | 0 | 0 | 0 | 0 |
| Node 2 to… | 0 | 30.8373 | - | - | 0 | 0.4576 |
| Node 3 to… | 0 | 134.3642 | 0 | 23.2566 | - | - |
References
- Bizon, N.; Oproescu, M.; Raceanu, M. Efficient energy control strategies for a standalone renewable/fuel cell hybrid power source. Energy Convers. Manag. 2015, 90, 93–110. [Google Scholar] [CrossRef]
- Ahshan, R.; Iqbal, M.T.; Mann, G.K.I.; Quaicoe, J.E. Micro-grid system based on renewable power generation units. In Proceedings of the 23rd Canadian Conference on Electrical and Computer Engineering, CCECE, Calgary, AB, Canada, 2–5 May 2010. [Google Scholar]
- Lasseter, R.H. Microgrids. In Proceedings of the IEEE Power Engineering Society Winter Meeting, New York, NY, USA, 27–31 January 2002; Volume 1, pp. 305–308. [Google Scholar]
- Menon, R.; Paolone, M.; Maréchal, F. Model predictive control strategies for low-voltage microgrids. Proc. Chem. Eng. Trans. 2014, 39, 1123–1128. [Google Scholar]
- Bizon, N.; Thounthong, P. Fuel economy using the global optimization of the Fuel Cell Hybrid Power Systems. Energy Convers. Manag. 2018, 173, 665–678. [Google Scholar] [CrossRef]
- Castaneda, M.; Cano, A.; Jurado, F.; Sánchez, H.; Fernández, L.M. Sizing optimization, dynamic modeling and energy management strategies of a stand-alone PV/hydrogen/battery-based hybrid system. Int. J. Hydrogen Energy 2013, 38, 3830–3845. [Google Scholar] [CrossRef]
- Hirsch, A.; Parag, Y.; Guerrero, J. Microgrids: A review of technologies, key drivers, and outstanding issues. Elsevier Renew. Sustain. Energy Rev. 2018, 90, 402–411. [Google Scholar] [CrossRef]
- Bordons, C.; Garcia-Torres, F.; Ridao, M. Model Predictive Control of Microgrids; Springer International Publishing: Berlin/Heidelberg, Germany, 2020. [Google Scholar]
- Choi, S.; Park, S.; Kang, D.J.; Han, S.J.; Kim, H.M. A microgrid energy management system for inducing optimal demand response. In Proceedings of the IEEE International Conference on Smart Grid Communications (SmartGridComm), Brussels, Belgium, 17–20 October 2011; pp. 19–24. [Google Scholar]
- Siano, C.; Cecati, C.; Yu, H.; Kolbusz, J. Real time operation of smart grids via FCN networks and optimal power flow. IEEE Trans. Ind. Inf. 2012, 8, 944–952. [Google Scholar] [CrossRef]
- Chakraborty, P.; Baeyens, E.; Khargonekar, P.P.; Poolla, K. A cooperative game for the realized profit of an aggregation of renewable energy producers. In Proceedings of the IEEE 55th Conference on Decision and Control (CDC), Las Vegas, NV, USA, 12–14 December 2016; pp. 5805–5812. [Google Scholar]
- Ahshan, R.; Saleh, S.A.; Al-Badi, A. Performance Analysis of a Dq Power Flow-Based Energy Storage Control System for Microgrid Applications. IEEE Access 2020, 8, 178706–178721. [Google Scholar] [CrossRef]
- Cano, A.; Jurado, F.; Sánchez, H.; Fernández, L.M.; Castañeda, M. Optimal sizing of stand-alone hybrid systems based on PV/WT/FC by using several methodologies. J. Energy Inst. 2014, 87, 330–340. [Google Scholar] [CrossRef]
- Barata, F.A.; Igreja, J.M.; Neves-Silva, R. Demand Side Management Energy Management System for Distributed Networks. In Doctoral Conference on Computing, Electrical and Industrial Systems 2016; Springer: Berlin/Heidelberg, Germany, 2016; pp. 455–471. [Google Scholar]
- Otomega, B.; Marinakis, A.; Glavic, M.; Cutsem, T.V. Model predictive control to alleviate thermal overloads. IEEE Trans. Power Syst. 2007, 22, 1384–1385. [Google Scholar] [CrossRef]
- Borrelli, F.; Bemporad, A.; Morari, M. Predictive Control for Linear and Hybrid Systems, 1st ed.; Cambridge Univ. Press: Cambridge, UK, 2017. [Google Scholar]
- Namara, P.M.; Negenborn, R.R.; Schutter, B.D.; Lightbody, G. Optimal coordination of a multiple HVDC link system using centralized and distributed control. IEEE Trans. Control. Syst. Technol. 2013, 21, 302–314. [Google Scholar] [CrossRef]
- Liu, M.; Shi, Y.; Liu, X. Distributed MPC of aggregated heterogeneous thermostatically controlled loads in smart grid. IEEE Trans. Ind. Electron. 2016, 63, 1120–1129. [Google Scholar] [CrossRef]
- Mai, W.; Chung, C.Y. Economic MPC of aggregating commercial buildings for providing flexible power reserve. IEEE Trans. Power Syst. 2015, 30, 2685–2694. [Google Scholar] [CrossRef]
- Ouammi, A.; Dagdougui, H.; Dessaint, L.; Sacile, R. Coordinated model predictive-based power flows control in a cooperative network of smart microgrids. IEEE Trans. Smart Grid 2015, 6, 2233–2244. [Google Scholar] [CrossRef]
- Halvgaard, R.; Vanderberghe, L.; Poulsen, N.K.; Madsen, H.; Jorgensen, B. Distributed model predictive control for smart energy systems. IEEE Trans. Smart Grid 2016, 7, 1675–1682. [Google Scholar] [CrossRef]
- Parisio, A.; Rikos, E.; Glielmo, L. A Model Predictive Control Approach to Microgrid Operation Optimization. IEEE Trans. Control Syst. Technol. 2014, 22, 1813–1827. [Google Scholar] [CrossRef]
- Morato, M.M.; Normey-Rico, J.E.; Sename, O. Model predictive control design for linear parameter varying systems: A survey. Elsevier Annu. Rev. Control 2020, 49, 64–80. [Google Scholar] [CrossRef]
- Qi, W.; Liu, J.; Chen, X.; Christofides, P. Supervisory predictive control of standalone wind/solar energy generation systems. IEEE Trans. Control Syst. Technol. 2011, 19, 199–207. [Google Scholar] [CrossRef]
- Stadler, P.; Ashouri, A.; Maréchal, F. Distributed model predictive control of energy systems in microgrids. In Proceedings of the IEEE Annual Systems Conf. (SysCon), Orlando, FL, USA, 18–21 April 2016; pp. 1–6. [Google Scholar]
- Zhang, Y.; Gatsis, N.; Giannakis, G.B. Robust energy management for microgrids with high-penetration renewables. IEEE Trans. Sustain. Energy 2013, 4, 944–953. [Google Scholar] [CrossRef]
- Rahman, M.; Oo, A. Distributed multi-agent based coordinated power management and control strategy for microgrids with distributed energy resources. Energy Convers. Manag. 2017, 139, 20–32. [Google Scholar] [CrossRef]
- Shan, Y.; Hu, J.; Wing Chan, K.; Fu, Q.; Guerrero, J.M. Model Predictive Control of Bidirectional DC–DC Converters and AC/DC Interlinking Converters—A New Control Method for PV-Wind-Battery Microgrids. IEEE Trans. Sustain. Energy 2019, 10, 1823–1833. [Google Scholar] [CrossRef]
- Olivares, D.E.; Cañizares, C.A.; Kazerani, M. A centralized energy management system for isolated microgrids. IEEE Trans. Smart Grid 2014, 5, 1864–1875. [Google Scholar] [CrossRef]
- Olivares, D.E.; Lara, J.D.; Cañizares, C.A.; Kazerani, M. Stochastic-predictive energy management system for isolated microgrids. IEEE Trans. Smart Grid 2015, 6, 2681–2693. [Google Scholar] [CrossRef]
- Sachs, J.; Sawodny, O.A. Two-stage model predictive control strategy for economic diesel-pv-battery island microgrid operation in rural areas. IEEE Trans. Sustain. Energy 2016, 7, 903–913. [Google Scholar] [CrossRef]
- Solanki, B.V.; Bhattacharya, K.; Cañizares, C.A. Integrated energy management system for isolated microgrids. In Proceedings of the IEEE Power Systems Computation Conference (PSCC), Genoa, Italy, 20–24 June 2016; pp. 1–7. [Google Scholar]
- Palma-Behnke, R.; Benavides, C.; Lanas, F.; Severino, B.; Reyes, L.; Llanos, J.; Sáez, D. A microgrid energy management system based on the rolling horizon strategy. IEEE Trans. Smart Grid 2013, 4, 996–1006. [Google Scholar] [CrossRef]
- Ng, E.J.; El-Shatshat, R.A. Multi-microgrid control systems (mmcs). In Proceedings of the IEEE PES Gen. Meet, Minneapolis, MN, USA, 25–29 July 2010; pp. 1–6. [Google Scholar]
- Mc Namara, P.; Negenborn, R.R.; De Schutter, B.; Lightbody, G. Weight optimisation for iterative distributed model predictive control applied to power networks. Eng. Appl. Artif. Intell. 2013, 26, 532–543. [Google Scholar] [CrossRef]
- Parisio, A.; Wiezorek, C.; Kyntäjä, T.; Elo, J.; Johansson, K.H. An mpc-based energy management system for multiple residential microgrids. In Proceedings of the IEEE International Conference Automation Science and Engineering (CASE), Gothenburg, Sweden, 24–28 August 2015; pp. 7–14. [Google Scholar]
- Hooshmand, A.; Malki, H.; Mohammadpour, J. Power flow management of microgrid networks using model predictive control. Comput. Math. Appl. 2012, 64, 869–876. [Google Scholar] [CrossRef]
- Ziogou, C.; Voutetakis, S.; Papadopoulou, S. Design of an energy decision framework for an autonomous RES-enabled Smart-Grid network. In Proceedings of the IEEE 23rd International Conference on Telecommunications (ICT), Thessaloniki, Greece, 16–18 May 2016; pp. 1–5. [Google Scholar]
- Ipsakis, D.; Voutetakis, S.; Seferlis, P.; Stergiopoulos, F.; Elmasides, C. Power management strategies for a stand-alone power system using renewable energy sources and hydrogen storage. Int. J. Hydrogen Energy 2009, 34, 7081–7095. [Google Scholar] [CrossRef]
- Ulleberg, O. Stand-Alone Power Systems for The Future: Optimal Design, Operation & Control of Solar-Hydrogen Energy Systems. Ph.D. Thesis, Department of Thermal Energy and Hydropower Norwegian University of Science and Technology, Trondheim, Norway, 1998. [Google Scholar]
- Ziogou, C.; Ipsakis, D.; Elmasides, C.; Stergiopoulos, F.; Papadopoulou, S.; Seferlis, P.; Voutetakis, S. Automation infrastructure and operation control strategy in a stand-alone power system based on renewable energy sources. Elsevier J. Power Sources 2011, 196, 9488–9499. [Google Scholar] [CrossRef]
- Lara, J.D.; Olivares, D.E.; Cañizares, C.A. Robust Energy Management of Isolated Microgrids. IEEE Syst. 2019, 13, 680–691. [Google Scholar] [CrossRef]
- Olivares, D.E.; Etemadi, A.H.; Kazerani, M.; Gomis-Bellmunt, O.; Palma-Behnke, R. Trends in Microgrid Control. IEEE Trans. Smart Grid 2014, 5, 1905–1919. [Google Scholar] [CrossRef]
- Yang, N.; Paire, D.; Gao, F.; Miraoui, A. Power Management Strategies for Microgrid- A Short Review. In Proceedings of the IEEE Industry Applications Society Annual Meeting, Lake Buena Vista, FL, USA, 6–11 October 2013; pp. 1–9. [Google Scholar]
- Allgöwer, F.; Findeisen, R.; Nagy, Z.K. Nonlinear Model Predictive Control: From Theory to Application. J. Chin. Inst. Chem. Eng. 2004, 35, 299–315. [Google Scholar]
- Mayne, D.Q.; Rawlings, J.B.; Rao, C.V.; Scokaert, P.O.M. Constrained model predictive control: Stability and optimality. Automatica 2000, 36, 789–814. [Google Scholar] [CrossRef]
- Grüne, L.; Pannek, J. Nonlinear Model Predictive Control. In Theory and Algorithms; Springer: London, UK, 2011. [Google Scholar]
- Maciejowski, J.M. Predictive Control with Constraints; Pearson Education Limited: London, UK, 2002. [Google Scholar]
Publisher’s Note: MDPI stays neutral with regard to jurisdictional claims in published maps and institutional affiliations. |
© 2021 by the authors. Licensee MDPI, Basel, Switzerland. This article is an open access article distributed under the terms and conditions of the Creative Commons Attribution (CC BY) license (http://creativecommons.org/licenses/by/4.0/).