Article

Measuring the Implementation of the Agenda 2030 Vision in Its Comprehensive Sense: Methodology and Tool

Faculty of Computing, University of Latvia, Raina blvd. 19, LV1586 Riga, Latvia
*
Author to whom correspondence should be addressed.
Energies 2021, 14(4), 856; https://doi.org/10.3390/en14040856
Submission received: 28 December 2020 / Revised: 26 January 2021 / Accepted: 1 February 2021 / Published: 6 February 2021
(This article belongs to the Special Issue Innovation in Energy Security and Long-Term Energy Efficiency Ⅱ)

Abstract

:
The contribution of the energy sector to human development (HD) is one of the aspects that requires measuring growth of the overall sustainability of HD. The UN program, Agenda 2030, has defined the vision of advanced development by introducing a sustainable HD paradigm, the balanced integrated development paradigm, in three dimensions: economic, social and environmental. The overall performance of countries is not currently assessed; there are several proposals for measuring sustainable HD level, but none have become widely accepted due to their weaknesses. The selected indirect measurement method reflects the interlinkage of development dimensions in real cases of low data availability. By combining the strengths of existing proposals and eliminating their weaknesses, the measuring methodology has been created and an appropriate tool—the Advanced Human Development Index (AHDI)—has been designed, which ensures unity and concordance of all included comprehensive dimension indices. The calculations confirm the accuracy and simplicity of the measurement. The proposed methodology and AHDI, as a simple, balanced index that is based on result-oriented headline indices, provide the big picture, which will be transparent, acceptable and usable for experts, politicians and the global community to assess the achieved development levels and to make strategic decisions for the coming period.

1. Introduction

Academic and political understanding of human development, its scope and dimensions, interrelations and significance in the human development process is formed and changes during global socioeconomic and political development. Such a concept asks for the regular comprehensive measurement of progress in human development (let us remember Niels Bohr’s expression, “Nothing exists until it is measured”) to explicate the achieved level in statics and dynamics, as well as to make strategic decisions for the coming period.
A secure and stable supply of energy has been a key driver of development for both the world’s leading economies and developing countries. From the beginning of human development, energy has made a direct contribution to economic growth [1]. “Energy and economy evolve in tandem” [2] is a well-established axiom. In addition to the economy, access to energy is a critical precondition for the social development of humanity; this is the conviction of politicians (e.g., “Energy is the lifeblood of our present-day civilization and culture” [3]) and experts (e.g., “The provision of adequate energy services is a precondition for socioeconomic development and human wellbeing” [4]).
Such comprehensive qualitative assessments can be confirmed and quantified by the indication of causation between energy consumption and human development. The last aspect is currently measured by the Human Development Index (HDI) as a parameter, which is globally accepted by experts and politicians as the indicator of national socioeconomic development level. Figure 1 shows that the correlation between both mentioned indices is strong. In general, access to exponentially increasing amounts of energy is necessary to achieve linear growth of the development level. There are no indications that this pattern is substantially weakened on a global scale. This causation should be taken into account in determining future energy (including energy efficiency and performance) policies to break growing energy consumption in many countries.
To shape human development as a global sustainable trend, which will secure welfare opportunities for future generations, the United Nations (UN) has adopted an advanced development concept, Agenda 2030, which includes an environmental dimension in addition to the economic and social dimensions. The concept forecasts energy as one of the key pillars for human wellbeing and further sustainable development in the 21st century: “Sustainable development of energy systems requires consideration of all three sustainability dimensions: environmental, economic and social” [5]. Issues such as long-term energy efficiency and energy security are becoming critical far beyond the context of energy: “It is clear that the energy sector must be at the heart of efforts to lead the world on a more sustainable pathway” [6].
Even in this case, which corresponds to the Agenda 2030 vision, the real contribution of energy consumption to sustainable human development can best be indicated by measuring growth of the overall development level. However, the quantitative assessment in this case lacks a complex indicator of development level, which integrates all three dimensions and corresponds to the Agenda 2030 vision.
The aim of this study is to develop a measurement methodology, which is consistent with the Agenda 2030 vision on the advanced human sustainable development paradigm, as well as an appropriate tool—the Advanced Human Development Index (AHDI)—that reconciles the social and economic dimensions with the environmental dimension. Of course, the importance of creating such an index goes far beyond energy, which is certainly very important, but is only one aspect of human development.
In Section 2, an advancement of the human development paradigm and its measurement is analyzed to indicate academic and political context. Section 3 shows the selection of the optimum method for measuring sustainable human development. Section 4 is devoted to the creation of measurement methodology and calculation of the AHDI. Section 5 discusses the results obtained, while Section 6 outlines the introduction of the AHDI in the practice of experts and politicians.

2. An Advancing Paradigm of Human Development

The term development in general is described as “the steady growth of something so that it becomes more advanced, stronger, etc.” [7]; in relation to humans, the term denotes a continuously advanced concept on a “comprehensive societal process that covers all aspects of life” [8].
For many centuries, the economic activities were considered as the single real driving force of human/national development and progress. Gross domestic product (GDP) (or its derivatives) has been considered as the core indicator in measuring the development level of a nation and its power (see, e.g., [9]).
From the 1960s onwards, experts and politicians have increasingly emphasized that human development is not just about economic growth. “It [GDP] measures neither our wit nor our courage, neither our wisdom nor our learning, neither our compassion nor our devotion to our country, it measures everything in short, except that which makes life worthwhile” [10]. Consequently, “National income … [becomes] an inappropriate indicator of development” [11]; in terms of measuring development, this means that “…such as the GDP are useful, development is now considered to be a much broader concept and must be more than a focus on economic growth [only]” [12].
Starting with a general thesis on social development, a consensus has gradually emerged on the most crucial dimensions for humans: health and longevity, good education and sufficiently high income. Instead of money, people became the priority of global development.
An integrated and, at the same time, simple indicator—the Human Development Index—was created and adopted within the UN framework. The HDI has convinced academics, politicians and the whole community for 30 years that they can and must value development not only with economic progress, but also with the increase of human well-being. In the first edition of subsequent annual Human Development Reports, it was declared that “It is about more than GNP growth, more than income and wealth and more than producing commodities and accumulating capital. It is about how development enlarges their [people] choices. The most critical of these wide-ranging choices are to live a long and healthy life, to be educated and to have access to resources needed for a decent standard of living” [13].
At the end of the 20th century, an extensive global discussion of experts and high-level politicians expanded on the next fundamental issue: how to increase the sustainability of human development.
In general, experts define sustainability as a long-term concept of various interrelated economic, social and environment aspects (see, e.g., [14]). Different priorities have been set; however, the broadest consensus has been achieved on the importance of protecting the natural environment. This resulted in the 21st Century Action Program Agenda 21 [15]; the UN Summit on Sustainable Development then expanded and modified it as the Agenda 2030 [16]. The programs defined the extended vision, which is the kernel of the today’s sustainable human development paradigm, as a holistic vector of global progress, incorporating balanced integrated solutions to the economic, social and environmental dimensions. Seventeen sustainable development goals (SDG) and 169 targets have been set for the period up to 2030, these are directed to the implementation of the multidimensional Agenda 2030 vision.
Naturally, such a vision and sustainability concept asks for an advanced human development measuring procedure to characterize progress in statics and dynamics: “…it is important to seriously start thinking about the performance measurement system associated with SDGs at the initial stages itself, to lay foundations for effective and evidence-based policy making” [17].
Although “...the concept of sustainable development is much broader than the protection of natural resources and the physical environment; it includes the protection of human lives in the future; after all, it is people, not trees, whose future options need to be protected” [13], it will take a long time to globally harmonize other aspects of sustainability (see, e.g., [18]). The current task is to measure sustainable human development exactly according to the current consensus, thus indicating the successes and problems in the implementation of Agenda 2030.
The COVID-19 pandemic and the subsequent difficult recovery period significantly increases the importance of sustainability in global and national long-term policy planning (see, e.g., [19]). The predicted inevitable decline in the level of globalization of processes and changes in value chains; the growing importance of self-sufficiency at the national level; and changes in the level and structure of consumption, the national isolation of countries and the growth of international competition (see, e.g., [20,21]), all increase the share of sustainability in reasoned policymaking. As a result, the importance of objective comprehensive measurements and monitoring of sustainable human development as a result of the implementation of post-COVID recovery policies becomes much higher.
There is a typical measuring problem for multidimensional programs: even many separate narrow profile indicators cannot show the overall progress of the program; therefore, composite indicators (indexes) are created, aggregating individual indicators. “Composite indicators can be used to summarize complex or multidimensional issues, in view of supporting decision-makers. Composite indicators provide the big picture… An index remains useful to make a point for action” [22].
Currently, the problem is a lack of a politically accepted methodology and tools to measure the implementation of the comprehensive Agenda 2030 vision. At the time of elaboration of Agenda 2030, the UN Division for Sustainable Development recommended that “Indicators corresponding to the future SDGs are most important for monitoring future progress, but they will need to be complemented by composite indices of sustainable development progress” [23]. The task to improve the system of indicators for progress measurement already exists in the composition of SDGs: “By 2030, build on existing initiatives to develop measurements of progress on sustainable development” [24].
Experts have a similar position: “We must first decide where we are going—our overarching goal—to measure progress toward it. … We are certainly not recommending throwing out the [indicator] dashboard, but merely recognizing that the dashboard and an aggregated indicator of overall progress toward our shared goal are both necessary if we hope to achieve our goal” [25].

3. An Optimum Method for Measuring Sustainable Human Development

The selection of a measurement method is a very important step in the creation of any measurement procedure; unfortunately, its importance is not always fully appreciated. However, it is the method that is the kernel for further generation of the methodology and thus primarily determines the performance of the whole measurement procedure. We carried out a purposeful detailed investigation of the cohesion of the Agenda 2030 vision and past experience in measuring human development to make an informed choice.

3.1. Direct Measurement Method

“In direct methods of measurement, the unknown quantity is directly compared against a standard and the result is expressed as a numerical number and a unit” (see, e.g., [26]. Direct (absolute) measurement of the achieved progress in sustainable human development and obtaining the measurement result as one quantity value is impossible due to lack of a standard (etalon).
That is why the SDG indicators’ set, which was adopted by the UN General Assembly, consists of 232 narrow profile indicators only [27]. A huge advantage of the set is its relatively widespread use of hard statistical indicators; they provide a representative view of the relevant part of aspects of sustainable development. Nevertheless, not all SDG indicators can be quantified; the global data availability is low (about 50%, according to [28]), especially for reliable data. The similarly purposed Eurostat database provides the data on 100 indicators for EU countries only [29].
With such a huge number of indicators, uneven execution occurs in various aspects (targets); similar progress for all aspects is unthinkable. An analysis of the Agenda 2030 implementation trend reflects that part of the individual indicators show progress, others show mining at the current level with some fluctuations while still others show regression in the relevant aspects.
The UN High-level Political Forum on Sustainable Development [30] was held to comprehensively review the achieved progress. In assessing progress, successes as well problems were mentioned only on individual aspects, e.g., access to safe drinking water and electricity, child and neonatal mortality, economic growth, quality education, poverty, hunger, gender equality and environment. Progress as a whole and the general dynamics had not been assessed; leaders and those falling behind were not identified. Due to the Agenda 2030 key thesis on integrity of the sustainable human development process, the forum had to give a political conclusion on the overall progress, and it did: “… yet it is clear that the world is not on track to meet the SDGs by 2030”. However, it is difficult to consider it as a data-based conclusion.
Assessments at EU [28] and OECD [31] levels had an analogous fragmented structure. Analysts were also forced to draw conclusions about the overall trend based on individual indicators only and using an indefinite conclusion on “… only limited progress” [32].
There are several additional reasons as to why obtaining a positive result by creation of a composite index aggregating many specific target-related indicators (the so-called bottom-up approach) in this case is questionable.
As the integrated essence of multidimensional sustainable human development, the overall progress of Agenda 2030’s implementation cannot be adequately characterized, even by a combination of many sectoral numerical indicators “because these [social, economic, and environmental] resources are interconnected, there are no simple solutions to the problems society causes” [33]; e.g., the economic growth affects investments in social and environment dimensions, knowledge drives the economy and creates awareness of the environmental issues and the polluted environment directly impacts health. Bennich, Weitz and Carlsen [34] provide an extensive analytic overview of these interlinkages.
In turn, Barbier and Burgess [35] show that many of the SDGs contribute to more than one dimension of sustainability; quantitative analysis of the interactions and complementarities convincingly confirms the existence of interconnections; 43% of the sustainable development indicators in the EU database are used to describe two or more SDGs. The actions taken and the relevant indicators do not always have a positive effect on all SDGs; a different and, in the medium term, even contradictory effect on overall progress is possible (e.g., the balance between economic and environmental activities is still being sought).
Nevertheless, there have been several attempts to create the index that directly integrates SDG-related indicators.
The Sustainable Development Goals Index (SDGI) methodology is directly based on the structure of 17 SDGs that is an advantage of the approach [21]. The SDGI is created by summarizing part of the target indicators, which reflects the SDG settings; averaging the normalized indicators takes place first within the SDGs and then across SDGs.
Several weaknesses in the index methodology have been mentioned [36,37]. Only 60 (issue 2016) and 85 (issue 2020) of the accepted 232 SDG indicators are aggregated depending on the data availability to date. It is not known whether these are the determining indicators; this creates uncertainty in the calculated result. The methodology does not account for the interlinkages and the integrity of the SDGs.
The Systemic Indicator of Sustainable Development (SISD) is an academic attempt to remedy the last shortcoming of the SDGI and to measure the sustainable human development process in a more holistic manner [38]. Applying the systems thinking theory and approach, the dataset of 47 indicators (the same data availability problem), which relate to 17 SDGs, is transformed into another set of 14 factors taking into account the complexity of sustainable development and interlinkages of the SDGs. These factors are aggregated as secondary indicators to create the SISD. At the current stage of elaboration of the index, the result has become difficult to interpret; the question of interlinkage at the factor level also remains.
There are also proposals for the creation of composite indexes at the level of individual SDGs [39]. However, the bids are for some goals only and their aggregation to obtain a common index has not been elaborated.

3.2. Indirect Measurement Method

The essence of the indirect measurement method is synthesis of the unknown quantity from measurements made by direct methods of measurement of some other quantity linked to the unknown one by a defined relationship (see, e.g., [26]). In the practice of measuring human development, several quantities (indicators), which are related to achievements of human development as a whole or its dimensions, are usually used. This (so-called top-down) approach makes the problems of the direct measurement method irrelevant: a lack of a part of individual indicators is insignificant, interdimensional links and impacts are observed and the impact of indicators on several targets and SDGs is considered.
Dimension indicators typically are aggregated as components in the composed index. Experts, politicians as well as the global community, already have long-term experience and habits for creating and using an exactly indirect measurement method of the achieved human development level.
“Gross domestic product is an aggregate measure of production” [40], which is formed by the value added by all households, companies, public bodies and nonprofit institutions across the economy. It is a comprehensive indicator, which is constructed using datasets of the National Accounts and is based on the economic output, which is a principal advantage for data-driven high-level political decision-making. In fact, GDP not only summarizes the economy in one number, but “it drives government policy and sets priorities in a variety of vital social fields—from schooling to healthcare” [41]. Therefore, “the success of GDP is based on the fact that, with them, politicians were from the outset able to pursue a whole array of goals beyond just documenting economic processes” [42].
HDI is a politically accepted index, it has been used successfully for many years as “the best available alternative to GDP per capita” [43], although problems have already been identified (see, e.g., [44]). HDI is calculated as the geometric mean of three normalized dimension indexes (see Figure 2), thus ensuring a balance between the dimensions [45].
HDI = (ILife)1/3 × (IEducation)1/3 × (IIncome)1/3
There are more suggestions for indirect measurement of sustainable human development compared with the direct one. Two of them propose the use of one or more narrow profile environmental indicators, others use integrated environmental indices. It should be noted that there are also offers that include other aspects such as peace, happiness and so on (see, e.g., [46]).
The Human Sustainable Development Index (HSDI) [47] was proposed by Togtokh and Gaffney “as a small step ahead to promote sustainable development” [48]. It is created by the addition of an environmental dimension to the HDI. Although environmental health and the services, which ecosystems provide for humans, are mentioned as factors that increase quality of life, CO2 emissions per capita is proposed as the only indicator representing the environmental dimension. HDI methodology is preserved; there is an equal weighting of all four dimensions (standard of living, longevity, knowledge and environment):
HSDI = (ILife)1/4 × (IEducation)1/4 × (IIncome)1/4 × (ICO2)1/4.
There are not many worldwide complex environmental indices that cover various environmental aspects as a whole.
The Ecological Footprint (EF) created by the World Wildlife Fund [49] reflects use of the natural capital (soil, air, water, minerals and living creatures) as well as the amount of generated carbon emissions. This should be evaluated as an insufficient composition for its use as an environmental indicator. The authors of the report themselves acknowledge that “National Footprint Accounts are not capable to quantify human environmental damage or pollution”. Nevertheless, several authors have used EF to create sustainable human development indices.
The Ecological Well-being Performance indicator (EWP) [50] is composed as the ratio of the HDI and the logarithmically normalized value (EFn) of the EF to measure the achieved level of sustainable human development in relation to ecological assets consumed:
EWP = HDI/EFn.
Analysis shows that there is quite a strong positive correlation between the HDI and EF (see Figure 3): a more developed economy and society is generally more resource intensive. The impact of the environmental dimension (EFn) on the calculated composite indicator is extremely strong, resulting in a moderate negative correlation between HDI and EWP. Such an introduction of the environmental factor crosses the economic, longevity and educational achievements of society.
The Sustainable Development Index (SDI) philosophy [51], in general, is similar to that of EWP. HDI is slightly modified (HDIm), e.g., Gross National Income per capita (GNI pc) levels have been limited at $20,000 PPS (Purchasing Parity Standard). Unlike EWP, the environmental dimension is formed by a complex function of material footprint (MF) and CO2 emissions:
SDI = HDIm/f {MF, CO2}.
Correlations between the HDI and both MF and CO2 are strongly positive. The result in this offer is very similar to that of the EWP.
There is a clear need for a more integrated environmental indicator that covers as many aspects as possible and thus assesses the inevitable pressure of human development on the environment.
The Environmental Performance Index (EPI), which is compiled by experts from several prominent universities, has much wider coverage of environmental issues [52]. It covers 11 high-priority environmental aspects (air and water quality and pollution, biodiversity degradation, climate change and emissions, waste management, etc.), for which 32 statistical indicators have been compiled for characterization. The index provides a balanced assessment of environmental health, evolving with increasing levels of knowledge and well-being, and the viability of ecosystems, which suffer from industrialization and urbanization.
Experts of the EC Joint Research Centre acknowledge the EPI “as a reliable composite indicator to measure environmental performance worldwide” [53].
The Environmental Human Development Index (EHDI) takes a holistic approach [54] to the synthesis of human development (which is characterized by the HDI) and environmental factor (EPI, as the most comprehensive environmental index is chosen). Based on the assumption of equal importance (resp. weights) of both mentioned components on sustainable human development, the index is calculated as the geometric mean of HDI and EPI:
EHDI = (HDI)1/2 × (EPI)1/2.
Accounting for formula (1):
EHDI = (ILife)1/6 × (IEducation)1/6 × (IIncome)1/6 × (IEnvironment)1/2.
The environmental dimension has the same weight as the life, education and income dimensions in total. For example, a 5% growth in one of the HDI dimensions results in a 0.82% increase of the EHDI, while a 5% growth in the environment dimension provides a 2.47% increase of the EHDI. This is not as strong an impact of the environmental dimension as we have seen in the cases of EWP and SDI; nevertheless, it does not correspond to the Agenda 2030 setting on interdimensional balance. In fact, these examples reflect the regular efforts of radical environmental activists to limit the concept of sustainability to the natural environment only.

3.3. Selection of the Optimum Measurement Method

Several postulates arise from the investigation of the key principles of Agenda 2030 and past experience in measuring human development (see [55]). Currently, when experts and politicians are looking for a successor of the HDI to measure sustainable human development, it is important to take them into account to select the most appropriate measurement method:
  • The Agenda 2030 general vision—“achieving sustainable development in its three dimensions—economic, social and environmental”—describes not only the development process but, firstly, the result achieved. Thus, respect is given to the principle already defined in the 1st Human Development Report [13]: “Human development has two sides: the formation of human capabilities—such as improved health, knowledge and skills—and the use people make of their acquired capabilities”. The indirect measurement method makes it possible to create the AHDI by aggregating the indicators characterizing the results achieved in various dimensions of sustainable human development; this opportunity should be appreciated.
  • Assuming that any of the 17 SDGs, 169 targets and 232 indicators is, to some extent, the driving force of the Agenda 2030 vision, it is necessary to consider all indicators in the sustainable human development measurement process, if the bottom-up method is used. Many of these indicators could be insignificant and could be dropped, but which ones? It would be worthwhile to determine them using data mining methods, but before that, data on all indicators are necessary. While data for many indicators are not available, several indicators are not quantifiable at all, this is a fundamental obstacle to obtaining an adequate measurement. Applying the top-down method does not result in such a problem if appropriate result-oriented indices are used to describe dimensions of sustainable human development.
  • The interlinkages and integrated nature of the SDGs are of crucial importance when implementing the Agenda 2030 vision; an indivisible, integrated approach is one of the basic principles of Agenda 2030: “As already pointed out, many of the goals included in the SDGs are multidimensional, covering more than one dimension of sustainability. Many synergies and complementarities can exist among the different SDGs. But trade-offs are also possible where improvements in one dimension could trigger negative results in another” [36]. When aggregating many individual indicators in a composite index, these features may be lost. When working with the resulting data, they will be considered.
The postulates show that the use of the direct measurement method is associated with great difficulties in creating the composite index for measuring sustainable human development, which will “be helpful in setting policy priorities and in benchmarking or monitoring performance” [56], and will be understandable, transparent, acceptable and practicable for experts, politicians and the global community. The existing offers confirm that there is a long way to go in solving various problems, and there is no guarantee of a successful result.
Accounting for the SDGs’ and indicators’ crosslinks is of crucial importance. The final documents of the SDG Summit [30] reiterate the necessity of a systemic and all-inclusive approach: “Focusing on one goal or target at a time and working in silos is therefore unlikely to result in overall success. Transforming to a socially, economically and ecologically sustainable society requires strengthening the focus toward all the SDGs and ensuring cooperation among the different measures or levers of action”. Furthermore: “The widely accepted ceteris paribus condition, which analyses the behavior of each system independently, cannot be considered helpful in the Agenda 2030 context. More holistic approaches are required as the contextual evaluation of several systems together is fundamental” [36].
Experience shows that the indirect measurement method (used by both GDP and HDI) has been popular and practically applicable. “Top-down approach is less time and resource intensive and has been generally applied at larger geographical scale; …it is driven by the opinions of experts/researchers, through which the framework is designed based on broad common issues” [57]. This is exactly what is needed to carry out sustainable human development planning, monitoring and evaluation tasks on a global and national scale.
The indirect measurement method also allows minimizing potential discussion of one’s or another country’s national priorities and interests within the scope of the SDGs, targets and indicators. The core dimensions of Agenda 2030—economic, social (i.e., life and education) and environmental—are important for any country and society.
Overall, it shows that the indirect measurement of sustainable human development offers a much wider perspective. We selected the indirect measurement method for creation of the methodology and measurement tool, the AHDI.

4. Methodology and the AHDI Calculation

Similarly, observing the principles of Agenda 2030 and the experience gained in measuring human development, we put forward several postulates to generate the framework for the measuring methodology and selection of the environmental dimension indicator:
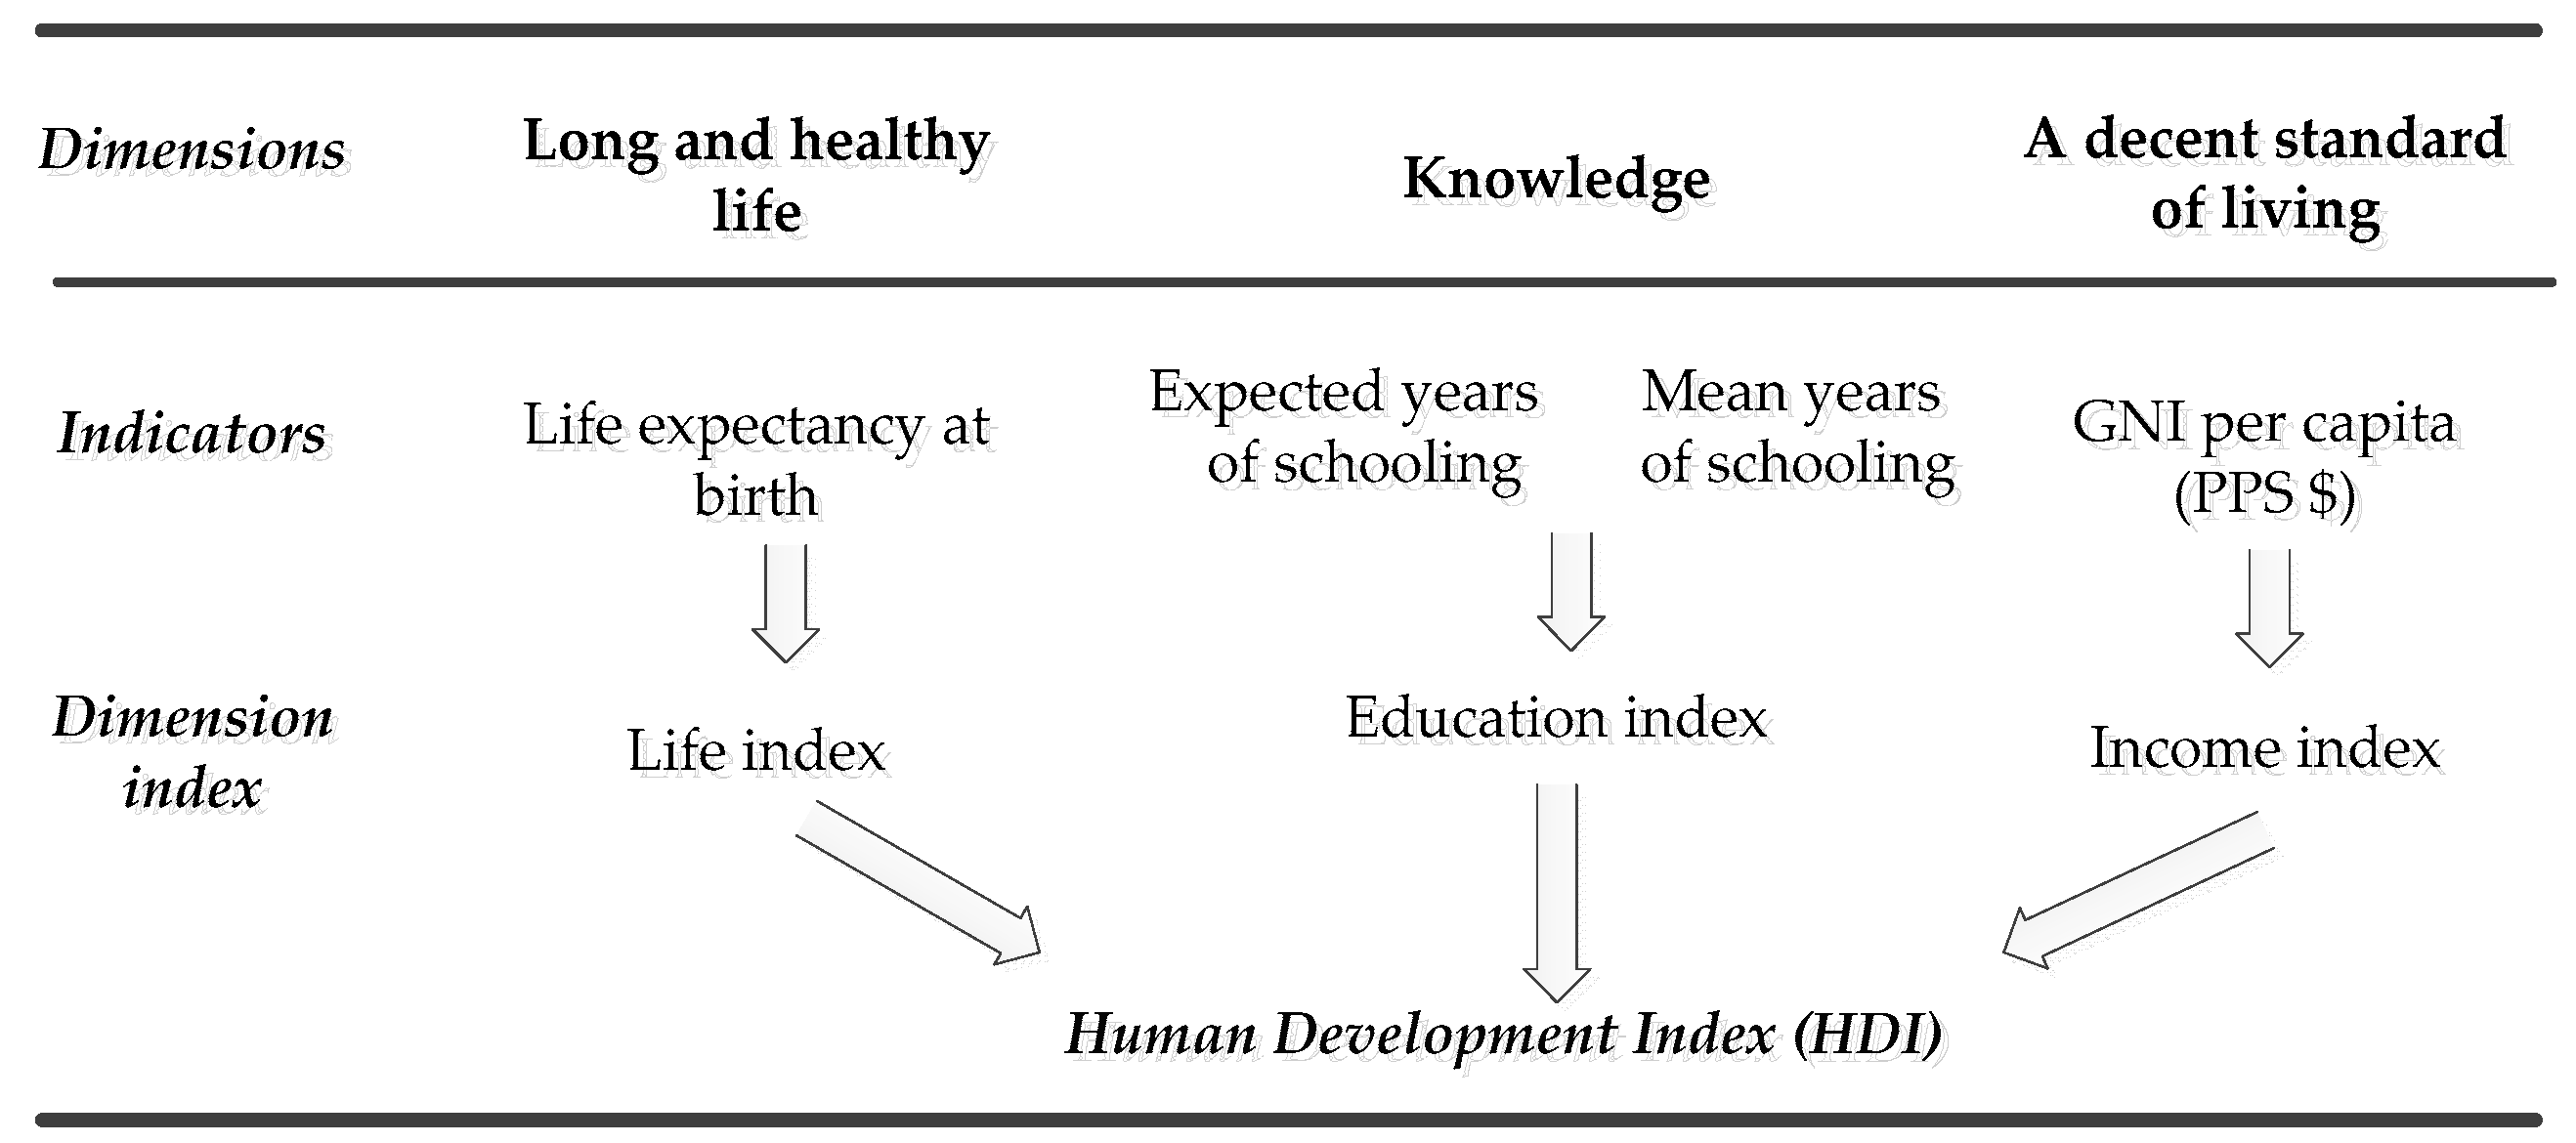
  • Heredity, evolution rather than revolution; in creating the HDI as a substitute of GDP, the very popular GDP was not discarded. It was included in the set of HDI dimension indexes, supplemented by the longevity and knowledge indexes. There is neither reason nor need to stop using this principle in the future. Usage of the HDI, which is globally accepted at the expert and political level, is expedient in the creation of the AHDI to describe social and economic dimensions. Significantly, all described indirect measurement proposals are designed exactly by supplementing the HDI with some environmental indicators.
  • Simplicity of the indicator and the use of few dimension indices provides understanding to non-economists, politicians and the community, which is important for political decision-making. The main advantage of GDP, which has enabled it to gain a strong political acceptance and become “the most powerful statistical figure in human history” [41], is its simplicity of use. Likewise, “the HDI’s simplicity, coupled with the transparency assured by the utilization of data published by international organizations, has been one of the main drivers behind the success of the HDI in the past twenty years” [58]. The aspect of simplicity in creating the AHDI should not be underestimated; the design of AHDI, using only a few indicators, will contribute to its popularity. Only one comprehensive headline indicator should be chosen to characterize the environmental dimension.
  • An important feature of HDI’s design is its unity and concordance of all three dimension indices; this is confirmed by strong positive correlations between the indices (Table 1). In turn, the HDI methodology guarantees a balanced effect of the dimension indices on the HDI value. An equal weight of united and consistent dimension indicators in the AHDI is the best decision following Agenda 2030’s politically accepted settings on development in a “balanced and integrated manner”.
  • Any dimension indicator should provide the fullest possible coverage of the aspects of the Agenda 2030 dimension concerned. The chosen environmental indicator should also cover various aspects of environment pollution, degradation and preservation; given the diversity of environmental aspects, an integrated dimension index will have to be used in practice.
  • There is no rational reason for developing a new comprehensive environmental index; instead, it is desirable to use a stable existing index that is elaborated by high-level experts and that is already politically accepted.
Table 2 summarizes the compliance of the proposed indices for sustainable human development measurement with the proposed postulates.
All proposed indices are based on the HDI expanding, nevertheless there is no such consensus on other postulates. However, new constructions of ecological indicators do not fully cover the problems of environmental pollution and degradation, while unduly complicating the index; EF is, by definition, contradictory to economic development.
The HSDI and EHDI methodologies are most appropriate for the defined set of postulates. The chosen narrow-profile environmental indicator (CO2 per capita) is a shortcoming of the HSDI, while the weak point of the EHDI is a dimensional imbalance, as the impact of the environmental index on the EHDI significantly exceeds that of other dimension indices. Possible further advancement is achievable by an integration of the strengths of both methodologies: the HSDI methodology that provides a balance of all dimensions in the index by partial opening HDI calculation as well as by the EHDI methodology that uses the EPI as an environmental indicator, providing incomparably wider coverage of the environmental aspects in comparison with that of the other options.
To bring the HDI in line with today’s concept of sustainability (balanced long-term integration of economic, social and environmental dimensions), its existing dimension base had been complemented by an environmental dimension (Figure 4). The AHDI methodology was elaborated by combining the advantages of EHDI and HSDI, thus achieving a significantly higher compliance of the AHDI with the principles of the Agenda 2030. In doing so, the HDI calculation methodology [45] was used precisely to maintain the multidimensional balance already achieved. We rely on the expertise and authority of the UN, so we accept the calculation methodology of the HDI as time-tested and sufficiently stable.
By selecting the EPI as an environmental index (wide coverage, accepted index) for expanding HDI (simplicity, result-orientated indices) and using the HSDI’s methodological principle for composing the index (balance), we obtain the formula of AHDI:
AHDI = (ILife)1/4 × (IEducation)1/4 × (IIncome)1/4 × (IEnvironment)1/4.
The EPI values must also be normalized analogously to other dimension indices on a single scale between 0 and 1; the min–max normalization is used as in HDI. Additionally, as in the case of the HDI, to keep the EPI index constant for new entrants and for several years, minimum and maximum threshold values (goalposts) have been adopted with some reserve (Table 3).

5. Results and Discussion

The aggregated AHDI values were calculated applying formula (7) for 178 countries, the data of which are included in both the HDI 2020 and EPI 2020 reports (Figure 5).
There are strong positive Pearson correlation coefficients between AHDI and dimension indices (Table 4); all values show a remarkable impact of all dimensions on the AHDI. At the same time, the similarity of correlations to those in the HDI show that potential data redundancy would not create problems.
Table 5 indicates the strong correlations between dimension indices; it shows that there are no contradictions between the dimension indices. This is a very substantial positive feature of the AHDI as the functions of all dimension indices are integrated; there is no need to compromise with others when improving one of them.
At the same time, the cross-independence level of the dimension indices is not so high as to cause unreliability by usage of interdependent indicators (so-called multicollinearity problem). To examine the potential problem, we used the typical tool, variance inflation factors (VIFs), which characterizes the mutual correlation between any pair of dimension indices (see, e.g., [59]). The reliability criterion is
VIF = 1/(1 − R2) < δ.
There are various evaluations of the critical value δ; however, in general, VIF values greater than 5 are considered moderately (undesirably) high. In our case, the maximum VIF value (4.04) satisfies even conservative recommendations.
Figure 5 shows a relatively different impact of the EPI on assessment of human development. For 55 countries, the difference of position in the AHDI ranking compared to that in the HDI ranking is 3 positions or less, which can be considered as statistically insignificant. In these countries, environmental policy keeps pace with the country’s socioeconomic development.
Inclusion of the environmental dimension in the AHDI has shifted another 55 countries down in the ranking. In these countries, the environmental policy and activities do not meet the level of human development that is shown by the three-dimensional HDI.
We carried out the grouping of countries into categories according to the level of sustainable human development achieved (very high, high, medium, low); the selection of cutoff points was performed using the HDI methodological principles (Table 6). As shown, 18 countries moved to a lower development category when compared by HDI ranking.
A more detailed analysis shows that for the eight countries that were excluded from the very high development category (Table 7), many of the positions in the global rankings per several key environment indicators (components of the EPI) are only in the second hundred. This confirms that the downward shift is reasonable; such pollution and ecosystem degradation levels cannot be considered as a very high sustainable human development feature.

6. Conclusions

Although the existing proposed indices for measuring sustainable human development seem insufficient to accurately measure the implementation of the Agenda 2030 vision in its comprehensive sense, their strengths and weaknesses strongly helped to improve the measuring methodology and tool. The performed integrated investigation of the key principles of Agenda 2030 and experience gained in measuring human development provided an opportunity to combine the strengths of existing proposals for measuring sustainable human development and to eliminate their weaknesses.
The selected indirect measurement method allows, in real cases of insufficient data availability, to reflect the results achieved in the implementation of the Agenda 2030 vision, including accounting for the mutual relationships and the inter-impact of the development dimensions. The set of postulates formulated in the study is the basis for the elaborated optimum measurement procedure that is consistent with the Agenda 2030 vision on sustainable human development.
The created measurement methodology ensures the balance and integrity of economic, social and environmental dimensions of the Agenda 2030 vision. An appropriate tool, the Advanced Human Development Index, was designed. This provides unity and concordance of all included, well-known and accepted comprehensive dimension indices.
Figure 6 shows that the causality between final energy consumption and the Advanced Human Development Index is strong; the AHDI is usable for measuring the linkage between supplied energy and sustainable development level in countries worldwide. Further, to reiterate, sustainable development also asks for energy.
Two groups of countries are visible. For some countries, energy is an efficient driver of the sustainable development; an increase in energy consumption above 20,000 kWh pc/year has enabled further growth in sustainability of development, reaching very high levels of AHDI of around 0.9. These countries are realizing sustainable energy policies and effective actions to improve energy security and efficiency, with an emphasis on environment friendly practice. However, growth in energy consumption above 40,000 kWh pc/year is not directly related to an increase in SD level.
For other countries, energy is a less efficient driver of sustainable development. At energy consumption above 20,000 kWh pc/year, the growth of SD slows down; it is hampered by growing environment pollution problems (see Table 7); even at consumption above 100 kWh pc/year, these countries do not reach an AHDI level of 0.8.
AHDI calculations confirm the accuracy and simplicity of the measurement, as well as its usability for experts, politicians and the community. They show objective and reasonable shifts in conventional human development assessments due to the inclusion of the environment component. The countries with unilateral development policies and practices cannot claim sustainability.
For five years now, the Agenda 2030 has been pursued without a sound understanding of the overall trend at both national and global levels. The proposed AHDI, as a simple balanced index that is based on result-oriented headline indices, provides the big picture, which will be understandable, transparent, acceptable and usable for experts, politicians and the global community. The COVID-19 pandemic has sharply exacerbated the need for an efficient general assessment of the performance of national recovery policies. The developed measurement procedure makes it possible to meet these needs immediately.

Author Contributions

Conceptualization and methodology, E.K.; data analysis, E.K., G.K., J.B.; writing—original draft preparation, E.K., J.B., G.K.; writing—review and editing, E.K., G.K., J.B.; visualization, E.K., G.K.; resources, supervision and project administration, G.K.; funding acquisition, E.K., G.K., J.B. All authors have read and agreed to the published version of the manuscript.

Funding

This research was funded by Latvian Council of Science, grant Nr. lzp-2020/2-0073, University of Latvia Nr. LZP2020/69.

Institutional Review Board Statement

Not applicable.

Informed Consent Statement

Not applicable.

Data Availability Statement

Data are publicly available in indicated sources.

Conflicts of Interest

The authors declare no conflict of interest.

References

  1. Tvaronaviciene, M. Towards sustainable and secure development: Energy efficiency peculiarities in transport sector. J. Secur. Sustain. Issues 2018, 7, 719–725. [Google Scholar] [CrossRef]
  2. Kaya, Y.; Yokobori, K. (Eds.) Energy and Economy. In Global Energy Assessment (Toward a Sustainable Future); Cambridge University Press: Cambridge, UK; New York, NY, USA, 2012; pp. 385–423. [Google Scholar]
  3. Opinion of the European Economic and Social Committee on the ‘Proposal for a Decision of the Council on a Supplementary Research Programme for the ITER Project (2014–2018). Available online: https://eur-lex.europa.eu/LexUriServ/LexUriServ.do?uri=OJ:C:2012:229:0060:0063:EN:PDF (accessed on 20 December 2020).
  4. International Institute for Applied Systems Analysis. Available online: https://iiasa.ac.at/web/home/research/researchPrograms/Energy/About-Energy-Program.en.html (accessed on 20 December 2020).
  5. Santoyo-Castelazo, E.; Azapagic, A. Sustainability assessment of energy systems: Integrating environmental, economic and social aspects. J. Clean. Prod. 2014, 80, 119–138. [Google Scholar] [CrossRef]
  6. Birol, F.; International Energy Agency. Energy Is at the Hearth of the Sustainable Development Agenda to 2030. 2018. Available online: https://www.iea.org/commentaries/energy-is-at-the-heart-of-the-sustainable-development-agenda-to-2030 (accessed on 20 December 2020).
  7. Oxford Learner’s Dictionaries. Available online: https://www.oxfordlearnersdictionaries.com (accessed on 20 December 2020).
  8. Rabie, M. A Theory of Sustainable Sociocultural and Economic Development; Palgrave Macmillan: London, UK, 2016; p. 243. [Google Scholar]
  9. Coyle, D. GDP; a Brief but Affectionate History; Princeton University Press: Princeton, NJ, USA; Oxford, MS, USA, 2015; p. 184. [Google Scholar]
  10. Kennedy, J.F. Remarks at the University of Kansas. 1968. Available online: https://www.jfklibrary.org/learn/about-jfk/the-kennedy-family/robert-f-kennedy/robert-f-kennedy-speeches/remarks-at-the-university-of-kansas-march-18-1968 (accessed on 20 December 2020).
  11. Seers, D. What are We Trying to Measure? In Measuring Development; the Role and Adequacy of Development Indicator; Baster, N., Ed.; Routledge: Abingdon, UK, 1972; pp. 21–36. [Google Scholar]
  12. Morse, S. Indices and Indicators in Development: An Unhealthy Obsession with Numbers; Earthscan Publications: London, UK, 2013; p. 224. [Google Scholar]
  13. UN Development Programme. Human Development Report 1990: Concept and Measurement of Human Development. Available online: http://hdr.undp.org/en/reports/global/hdr1990 (accessed on 20 December 2020).
  14. de Boer, B.; Hueting, R. Sustainable National Income and Multiple Indicators for Sustainable Development. In Measuring Sustainable Development; Integrated Economic, Environmental and Social Frameworks; OECD Publishing: Paris, France, 2004; pp. 39–52. [Google Scholar]
  15. United Nations Sustainable Development; Agenda 21. UN General Assembly. Available online: https://sustainabledevelopment.un.org/content/documents/Agenda21.pdf (accessed on 20 December 2020).
  16. Resolution Adopted by the General Assembly on 25 September 2015. Transforming Our World: The 2030 Agenda for Sustainable Development. UN General Assembly. Available online: https://www.un.org/ga/search/view_doc.asp?symbol=A/RES/70/1&Lang=E (accessed on 20 December 2020).
  17. Jacob, A. Mind the Gap: Analysing the Impact of Data Gap in Millennium Development Goals’ (MDGs) Indicators on the Progress toward MDGs. World Dev. 2017, 93, 260–278. [Google Scholar] [CrossRef]
  18. Balkyte, A.; Tvaronaviciene, M. Perception of competitiveness in the context of sustainable development: Facets of “Sustainable competitiveness”. J. Bus. Econ. Manag. 2010, 11, 341–365. [Google Scholar] [CrossRef] [Green Version]
  19. Cizo, E.; Lavrinenko, O.; Ignatjeva, S. Analysis of the relationship between financial development and economic growth in the EU countries. Insights Reg. Dev. 2020, 2, 645–660. [Google Scholar] [CrossRef]
  20. Worldwide Cost of Living 2020: How is Covid-19 Affecting the Prices of Consumer Goods? The Economist Intelligence Unit. Available online: https://www.eiu.com/ (accessed on 20 December 2020).
  21. Sachs, J.; Schmidt-Traub, G.; Kroll, C.; Lafortune, G.; Fuller, G.; Woelm, F. Sustainable Development Report 2020; The Sustainable Development Goals and COVID-19; Cambridge University Press: Cambridge, UK, 2020; pp. 1–99. [Google Scholar]
  22. Saltelli, A. Composite Indicators between Analysis and Advocacy. Soc. Indic. Res. 2007, 81, 5–77. [Google Scholar] [CrossRef]
  23. Measuring Progress. In Prototype Global Sustainable Development Report; UN Department of Economic and Social Affairs, Division for Sustainable Development: New York, NY, USA, 2014; pp. 73–92. Available online: http://sustainabledevelopment.un.org/globalsdreport/2014 (accessed on 20 December 2020).
  24. UN Department of Economic and Social Affairs. Sustainable Development Goal 17. Available online: https://sdgs.un.org/goals/goal17 (accessed on 20 December 2020).
  25. Costanza, R.; Daly, L.; Fioramonti, L.; Giovannini, E.; Kubiszewski, I.; Mortensen, L.F.; Pickett, K.E.; Ragnarsdottir, K.V.; De Vogli, R.; Wilkinson, R. Modelling and Measuring Sustainable Wellbeing in Connection with the UN Sustainable Development Goals. Ecol. Econ. 2016, 130, 350–355. [Google Scholar] [CrossRef]
  26. Bewoor, A.K.; Kulkarni, V.A. Metrology and Measurement; Tata McGraw-Hill Education: New Delhi, India, 2009; pp. 1–21. [Google Scholar]
  27. Resolution Adopted by the General Assembly on 6 July 2017: Work of the Statistical Commission Pertaining to the 2030 Agenda for Sustainable Development. UN General Assembly. 2017. Available online: http://ggim.un.org/documents/A_RES_71_313.pdf (accessed on 20 December 2020).
  28. Sustainable Development in the European Union; Monitoring Report on Progress towards the SDGs in an EU Context, 2020 ed.; Publications Office of the European Union: Luxembourg, 2020; pp. 1–34.
  29. Eurostat. Sustainable Development Indicators. Available online: https://ec.europa.eu/eurostat/data/database (accessed on 20 December 2020).
  30. SDG Summit 2019; Summary of the President of the General Assembly. UN General Assembly. 2019. Available online: https://sustainabledevelopment.un.org/content/documents/25200SDG_Summary.pdf (accessed on 20 December 2020).
  31. OECD. Measuring Distance to the SDG Targets; an Assessment of where OECD Countries Stand. 2017. Available online: http://www.oecd.org/sdd/OECD-Measuring-Distance-to-SDG-Targets.pdf (accessed on 20 December 2020).
  32. Moyer, J.D.; Hedden, S. Are we on the right path to achieve the sustainable development goals? World Dev. 2020, 127, 104749. [Google Scholar] [CrossRef]
  33. Flint, R.W. Practice of Sustainable Community Development. In Basics of Sustainable Development; Springer: New York, NY, USA; Heidelberg, Germany, 2013; pp. 25–54. [Google Scholar]
  34. Bennich, T.; Weitz, N.; Carlsen, H. Deciphering the scientific literature on SDG interactions: A review and reading guide. Sci. Total Environ. 2020, 728, 138405. [Google Scholar] [CrossRef] [PubMed]
  35. Barbier, E.B.; Burgess, J.C. Sustainable development goal indicators: Analyzing trade-offs and complementarities. World Dev. 2019, 122, 295–305. [Google Scholar] [CrossRef]
  36. Miola, A.; Schiltz, F. Measuring sustainable development goals performance: How to monitor policy action in the 2030 Agenda implementation? Ecol. Econ. 2019, 164, 106373. [Google Scholar] [CrossRef] [PubMed]
  37. Papadimitriou, E.; Neves, A.R.; Becker, W. JRC Statistical Audit of the Sustainable Development Goals Index and Dashboards [Technical Report]; Joint Research Centre. Publication Office of the EU: Luxembourg, 2019; pp. 1–30. [Google Scholar]
  38. Eustachio, J.H.; Caldana, A.C.; Liboni, L.B.; Martinelli, D.P. Systemic Indicator of Sustainable Development: Proposal and Application of a Framework. J. Clean. Prod. 2019, 241, 118383. [Google Scholar] [CrossRef]
  39. Kynclova, P.; Upadhyaya, S.; Nice, T. Composite Index as a Measure on Achieving Sustainable Development Goal 9 (SDG-9) Industry-related Targets: The SDG-9 Index. Appl. Energy 2020, 265, 114755. [Google Scholar] [CrossRef]
  40. Callen, T.; International Monetary Fund. Gross Domestic Product: An Economy’s All. Available online: https://www.imf.org/external/pubs/ft/fandd/basics/gdp.htm (accessed on 20 December 2020).
  41. Fioramonti, L. Gross Domestic Problem: The Politics Behind the World’s Most Powerful Number; Zed Books: London, UK; New York, NY, USA, 2013; p. 208. [Google Scholar]
  42. Lepenies, P. The Power of a Single Number, a Political History of GDP; Columbia University Press: New York, NY, USA, 2016; p. 208. [Google Scholar]
  43. Klasen, S.; UN Human Development Report Office. Human Development Indices and Indicators: A Critical Evaluation [Background Paper]. 2018. Available online: http://hdr.undp.org/sites/default/files/klasen_final.pdf (accessed on 20 December 2020).
  44. Mazzanti, M.; Mazzarano, M.; Pronti, A.; Quatrosi, M. Fiscal policies, public investments and wellbeing: Mapping the evolution of the EU. Insights Reg. Dev. 2020, 2, 725–749. [Google Scholar] [CrossRef]
  45. UN Development Programme. Human Development Report 2020; Statistical Annex. Available online: http://hdr.undp.org/sites/default/files/hdr2020.pdf (accessed on 20 December 2020).
  46. Prakash, R.; Garg, P. Comparative assessment of HDI with Composite Development Index (CDI). Insights Reg. Dev. 2019, 1, 58–76. [Google Scholar] [CrossRef]
  47. Togtokh, C.; Gaffney, O.; UN University. Human Sustainable Development Index. 2010. Available online: https://ourworld.unu.edu/en/the-2010-human-sustainable-development-index (accessed on 20 December 2020).
  48. Bravo, G. The Human Sustainable Development Index: New Calculations and a First Critical Analysis. Ecol. Indic. 2014, 37, 145–150. [Google Scholar] [CrossRef]
  49. World Wildlife Fund. Ecological Footprint. 2020. Available online: https://wwf.panda.org/knowledge_hub/all_publications/ecological_footprint2/ (accessed on 20 December 2020).
  50. Zhu, D.; Zhanga, S.; Sutton, D.B. Linking Daly’s Proposition to Policymaking for Sustainable Development: Indicators and Pathways. J. Clean. Prod. 2015, 102, 333–341. [Google Scholar] [CrossRef]
  51. Hickel, J. The Sustainable Development Index: Measuring the Ecological Efficiency of Human Development in the Anthropocene. Ecol. Econ. 2020, 167, 106331. [Google Scholar] [CrossRef]
  52. Environmental Performance Index. 2020. Available online: https://epi.yale.edu/downloads (accessed on 20 December 2020).
  53. Papadimitriou, E.; Neves, A.R.; Saisana, M. JRC Statistical Audit of the 2020 Environmental Performance Index [Technical Report]; Joint Research Centre, Publication Office of the EU: Luxembourg, 2020; p. 24. [Google Scholar]
  54. Maccari, N. Environmental Sustainability and Human Development: A Greening of Human Development Index. 2014. Available online: https://ssrn.com/abstract=2426073 (accessed on 20 December 2020).
  55. Pinter, L.; Hardi, P.; Bartelmus, P. Sustainable Development Indicators; Proposals for the Way Forward (Discussion Paper). International Institute for Sustainable Development. 2005. Available online: https://www.iisd.org/pdf/2005/measure_indicators_sd_way_forward.pdf (accessed on 20 December 2020).
  56. Handbook on Constructing Composite Indicators; OECD Publications: Paris, France, 2008; Available online: https://www.oecd.org/sdd/42495745.pdf (accessed on 20 December 2020).
  57. Kwatra, S.; Kumar, A.; Sharma, P. A Critical Review of Studies Related to Construction and Computation of Sustainable Development Indices. Ecol. Indic. 2020, 112, 106061. [Google Scholar] [CrossRef]
  58. Klugman, J.; Rodríguez, F.; Choi, H. The HDI 2010: New Controversies, Old Critiques. J. Econ. Inequal. 2011, 9, 249–288. [Google Scholar] [CrossRef]
  59. Hair, J.F.; Babin, J.B.; Anderson, R.E.; Black, W.C. Multivariate Data Analysis. In Multiple Regression, 8th ed.; Cengage Learning EMEA: London, UK, 2018; pp. 246–314. [Google Scholar]
Figure 1. Human development index vs. final energy consumption per capita (2019 or the last available year); sources—Human Development Report and Our World in Data.
Energies 14 00856 g001
Figure 2. Design of the HDI; source—Human Development Report.
Energies 14 00856 g002
Figure 3. Ecological Footprint (a) and The Ecological Well-being Performance indicator (b) vs. HDI; sources—Human Development Report and World Wildlife Fund.
Energies 14 00856 g003
Figure 4. Design of the AHDI. Created by the authors.
Energies 14 00856 g004
Figure 5. AHDI ranking. (a) very high development; (b) high development level; (c) medium and low development level achieved. Authors’ calculations.
Energies 14 00856 g005
Figure 6. Advanced human development index vs. final energy consumption per capita (2019 or the last available year); sources—Our World in Data and authors’ calculation.
Energies 14 00856 g006
Table 1. Interdimensional correlations of HDI 2020.
Income IndexLife IndexEducation Index
Income indexxxx0.84110.8675
Life index xxx0.8193
Education index xxx
Table 2. Compliance of the proposed indices with the defined postulates.
PostulatesHSDIEWPSDIEHDI
Heredity, usage of the globally accepted HDI2212
Simplicity, a small set of “headline indicators”2202
Balanced and integrated, united and consistent set of dimension indicators2001
Wide coverage of environment pollution, degradation and preservation0112
Existing and politically accepted environmental index/indicator2102
HSDI—The Human Sustainable Development Index; EWP—The Ecological Well-being Performance indicator; SDI—The Sustainable Development Index; EHDI—The Environmental Human Development Index; (2—good, 1—moderate, 0—does not comply).
Table 3. Threshold values for normalization.
IndicatorsMinimumMaximum
Actual National Values Threshold ValuesActual National ValuesThreshold Values
Life expectancy at birth (years)53.32083.685
Expected years of schooling (years)502218
Mean years of schooling (years)1.6014.215
Gross national income per capita ($ PPS 2017)75410088,15575,000
Environment Performance Index22.62082.590
Table 4. Correlation between dimension indices and composite indexes.
Composite Indexes Dimension Indices
IncomeLifeEducationEnvironment
HDI0.95890.91130.9607xxx
AHDI0.92810.88410.93590.9614
Table 5. AHDI interdimensional correlations and VIFs.
Dimension IndexesIncome IndexLife IndexEducation IndexEnvironment Index
Pearson Correlation Coefficients
Income indexxxx0.84110.86750.8345
Life index3.42xxx0.81930.7981
Education index4.042.91xxx0.8462
Environment index3.292.753.52xxx
Variance Inflation Factors (VIF)
Table 6. Cutoff points and grouping of countries by HDI and AHDI rankings.
Categories of
Development
Cut Off PointsNumber of Countries
HDIAHDIHDIShift DownShift UpAHDI
Very high 62 60
0.80.67 8 ↓6 ↑
High 50 49
0.70.55 6 ↓3 ↑
Medium 36 38
0.550.41 4 ↓3 ↑
Low 31 32
Table 7. Ranks of the countries that have lost positions in the very high development category.
CountryWaste ManagementAir QualityPollutionEcosystem
Growth RatesCHG pcNitrogenBiodiversity
Solid WasteWaste-WaterOzonePM2.5CO2 SO2NOxCH4N2OBlack Carbon
Bahamas133100 137168162107125172131168
Barbados 104 159 164 170177
Georgia133 113119109176174 130148 163126
Kazakhstan124 167138 177105127170 128
Mauritius 123101131131 154170
Oman133 135171134 157133172172168 159
Qatar 150169160 134177174172172134129
Turkey113 160117110 174 175
Publisher’s Note: MDPI stays neutral with regard to jurisdictional claims in published maps and institutional affiliations.

