Article

Effect of Foaming Temperature on Microstructure, Mechanical Properties and Flame Spread Rate in PET–PEN Copolymer

1
Research Institute of Advanced Materials, Seoul National University, Seoul 151-744, Korea
2
Department of Mechanical Engineering, Seoul National University, Seoul 151-744, Korea
3
School of Mechanical Engineering, Yeungnam University, Gyeongbuk 38541, Korea
*
Authors to whom correspondence should be addressed.
Energies 2021, 14(4), 957; https://doi.org/10.3390/en14040957
Submission received: 25 December 2020 / Revised: 27 January 2021 / Accepted: 8 February 2021 / Published: 11 February 2021
(This article belongs to the Section G: Energy and Buildings)

Abstract

:
Polymer foams are expanding their applications into functional materials. Partial foam structure has been fabricated in polyethylene terephthalate–polyethylene naphthalate (PET–PEN) copolymer by solid state foaming. Through SEM image analyses, a potential to fabricate gradient foam structures with micropores and unfoamed skin layers has been identified. The post-foaming temperature Tf tune the pore size distribution. Radial distribution of micromechanical properties, indentation hardness and elastic modulus were measured for the partial foam and their values were around 0.12 GPa and 2.0 GPa, respectively, for the outer foamed region. Foaming temperature affects the glass transition temperature Tg, the coefficient of thermal expansion and the flame spreading rate. For the range of Tf ≤ 60°C, thermal expansion coefficients for T > Tg are about 0.5 m/m°C (steep expansion group, SEG). When Tf is above 80 °C, they are around 0.02 m/m°C (mild expansion group, MEG). The burning rate of SEG is 2.8 times higher than that of MEG.

Graphical Abstract

1. Introduction

The global need for energy savings demands improved thermal performance. Vacuum Insulation Panel (VIP) is one of the candidates to meet these needs due to its excellent thermal insulation performance, i.e., a very low thermal conductivity of 4 mW/(mK). It is slowly being introduced into buildings in certain elements of the interior and exterior thermal insulation composite system [1]. VIP consists of a core and an envelope. The core blocks heat by the pore structure, evacuates the gas (air) inside the VIP and provides mechanical strength to atmospheric pressure. Typical core material is polycarbonate staggered beam or pillar and supports such as glass wool, glass fibers, fumed silica, polyurethane foam, and phenolic foam [2,3]. The envelope is a sealing and blocking layer to keep the inside in a vacuum. Typically, a metallized multilayer film consisting of an Al-sputtered layer over polyethylene terephthalate (PET) and an inner sealing layer of polyethylene or ethylene vinyl alcohol is used.
Polymer foams have excellent properties—low thermal conductivity, low density and damping characteristics. They are widely used in the fields of building construction, aerospace, vehicles, packages, and medical industries [4,5,6,7,8,9]. Physical foaming using carbon dioxide (CO2) has attracted the attention of academia and industry because it is an environmentally friendly foaming agent. Solid foaming, one of the physical foaming processes, is a process in which foaming occurs while the polymer remains solid during the entire process. It has been investigated as a blowing agent for the amorphous ABS copolymer materials [10]. It has an advantage of being able to independently control the sorption and foaming process. A two-stage foaming process was developed using liquid CO2 at ultrahigh pressure [11,12].
The polymer itself is highly flammable due to its organic nature. It has a special feature of rapid ignition and the collapse of the foam structure following violent fire growth [13,14,15]. To understand the potential hazards to humans and the safety of building insulation, flammability/flame retardancy [16,17], ignition time [18], flame spread [19,20,21,22,23], and toxic-products emissions [24] became major issues in polymer combustion research fields.
Polyethylene terephthalate (PET) is one of the most commonly used thermoplastic polyester polymers. It is easily found in household items such as textiles for clothing and liquid/food containers. Polyethylene naphthalate (PEN) is a semiaromatic transparent polyester synthesized from naphthalene-2,6-dicarboxylic acid and ethylene glycol. Since PEN has superior barrier properties, it is used in making high-performance sailcloth and film. Recently, partial foams of cellulose crystals and copolymers (polyethylene terephthalate-polyethylene naphthalate, PET–PEN) have been investigated as a substitute for VIP core [25,26]. The PET–PEN copolymer for additive manufacturing has emerged as an environmentally benign material for kitchen and decoration applications. It is readily available and strong enough for its present purpose. The post-foaming temperature of PET–PEN has been shown to change cell nucleation density, mechanical compressive stress, and thermal conductivity. It will also affect the micromechanical properties and combustion characteristics.
To extend the use of PET–PEN to insulation, building materials, automotive and aerospace, the micromechanical and thermal properties of PET–PEN must be evaluated. The purpose of this study is to show the effect of post-foaming temperature in a PET–PEN copolymer on foam structure, micromechanical properties and flame spread rate by experiment.

2. Materials and Methods

2.1. Materials

PET–PEN (9:1) copolymer filaments of 1.75 mm diameter (Kolon Plastics, Kimchun, Korea, reported actual density: 1.33 g/cm3) was developed as a nontoxic and environmentally friendly material for kitchen and decoration. The copolymer is a random type. PET–PEN micro rods of 0.4 mm in diameter were made using a 3D printer from the copolymer filament. In the additive manufacturing process, the steady-state volumetric flow rate is approximately 720 mm3/min at 275 °C.

2.2. Methods

2.2.1. Sample Preparation

The physical foaming using the CO2 foaming process was performed through a batch foaming system. Detailed foaming procedures can be found in the authors’ previous publication [10]. Briefly, it is as follows: Liquid CO2 at 5 MPa and 20 °C in the cylinder was supplied to the sample containing the vessel. It was compressed to 10 MPa by a high-pressure pump. The vessel was immersed into a cold ethanol/water bath of −20 °C for the dissolution process. The pressure was maintained at 10 MPa by the pump and automatic pressure regulator. The sorption time applied for dissolution was 24 h. After the pressure in the vessel was rapidly dropped to atmospheric pressure at a rate of ~100 MPa/s, the sample was immersed in a water bath at the foaming temperature Tf for 3 min. Then, the pore growth was frozen by quenching for 1 min in an ethanol/water mixture at −20 °C. The foaming temperature range was 20 to 100 °C. Finally, samples were dried with nitrogen to remove the residue of the ethanol/water mixture.

2.2.2. Measurement of Pore Diameter and Distribution

To see the cross-sectional structure, samples were cryo-fractured in the liquid nitrogen using a sharp blade attached at the end of linear slide mechanism. Samples were coated with ~15 nm thick platinum using sputtering equipment. A field emission scanning electron microscope (FE-SEM, SUPRA 55VP model) with typically 2.0 kV acceleration voltage was used to capture surface images.
Carbon-dioxide-induced partial foaming was observed along the radial direction of the sample. To characterize the morphology, the pore-size distribution of the SEM images was measured using the ImageJ (NIH) package and libraries. The effective pore diameter d p o r e was calculated from the measured cross-sectional area assuming circular pores.

2.2.3. Micromechanical Property Measurement

The instrumented indentation technique, also known as the nano-indentation method, was developed from the conventional hardness test. It measures the relationship between the indentation load and the penetration depth at constant speed loading and unloading. In this method, only load displacement data without residual impressions of complex imaging techniques are required to calculate the contact area. It means that measuring properties on the submicron scale is much easier [27]. For mechanical property measurements, the instrumented indentation system, Nano-Stress-Mapper (Frontics Inc., Seoul, Korea), was used to obtain the indentation hardness and elastic modulus from the following relations;
E r = π 2 β S A c
A c = f h c
where E r is reduced elastic modulus, and β is a constant that depends on the geometry of the indenter tip. For the indenter with the triangular cross-section like Berkovich tip, β = 1.034. The true projected contact area, A c , is determined using the true contact depth h c and calibration coefficients. The indentation hardness, H I T , is determined through the following equation with maximum applied load, P max ;
H I T = P max A c
The indentation elasticity, E I T , is calculated using the following relation;
E I T = 1 ν 2 1 E r 1 ν i 2 E i 1
where ν is the Poisson’s ratio for the test material, E i and ν i are the indenter’s elastic modulus and Poisson’s ratio, respectively.

2.2.4. Measurement of Simple Extension Behavior

As the temperature increases, polymers turn from a very high viscous super-cooled liquid to a low viscous amorphous state [24]. This transition occurs at the glass transition temperature (Tg). One common method to define Tg is the temperature at the intersection of the two tangents in thermal expansion versus temperature graph [28]. A PET–PEN rod of nominally 60 mm long and d = 0.42–0.77 mm was put in the uniform temperature tube of inner diameter 1.5 mm, which has less than +/− 0.3 °C variation for 210 mm long. Each end of the rod was tied to the diameter of 0.24 mm wire. The 92 g weight was attached to the lower end of the wire to stretch them out. Temperature of the tube, from 55 °C to 92 °C at the rate of 1.9 °C/min, was controlled by the water coming from the circulating bath. By the analysis of the recorded video images, T and the moving length of weight, thermal expansion were measured as function of time.

2.2.5. Measurement of Flame Spread Rate

A 40 mm long PET–PEN strand with d = 0.42–0.77 mm was used to obtain the burning rate. The top of it was placed between the ignition electrodes with 4 mm spacing. The ignition transformer for the oil boiler (16.5 kV, Kiturami El-110) was used to ignite. The flame propagated vertically downwards. Flame images were recorded using a camera (NIKON DS750s) with a recording capacity of up to 60 frames per second. A 105 mm telephoto lens with optical bellows was used to increase the measurement resolution to 0.025 mm/pixel. The intensity of the chemi-luminescence of the flame was reduced by two polarizing filters mounted in front of the lens. The burning rate was calculated by tracking the location of the flame base.

3. Results and Discussion

3.1. Microstructure

Sorption tests have been conducted as described by the authors [26]. As a fundamental-level investigation of the partial foaming, we have used the pristine filament in a cylindrical rod of 1.75 mm in diameter and the microrod extruded through a nozzle of 0.4 mm in diameter in a 3D printer. A wider range of post-foaming temperatures from 20 to 100 °C were tested as the typical cross-sectional SEM images of resulting features as shown in Figure 1.
There have been previous studies on partial gradient foam [9,29,30]. In general, the penetration depth in partial sorption depends on the pressure, temperature, and sorption time. After a quick pressure relief, when the diameter of the nucleus exceeds a critical value, the nuclei of the polymer matrix begin to grow into pores by the cell-growth mechanism. The concentration gradient induces a foam gradient. Since the CO2 concentration on the outer surface of the filament drops sharply, cells are hardly found near the surface. The underlying reason for this phenomenon is “gas escaping”. Outgassing and melt/matrix strength are the major causes of the reduced gas concentration in the wells. Therefore, nuclei near the wall do not pass the critical radius and fail to grow. Even though the glass transition temperature is lowered due to the Joule–Thomson effect (low temperature due to decompression), the viscosity of the matrix increases as the CO2 leaves the copolymer boundary. Thus, the process of pore formation is suppressed. This is the mechanism for the formation of a dense skin layer near the outer boundary. There is no pore at the center of the filament because the CO2 is under the lower limit due to very low diffusion coefficient of the copolymer. However, the CO2 concentration between the unfoamed thin layer and center of the filaments is higher than the lower limit, and thus the nuclei are able to grow into bigger foams. In the enlarged image, the thickness of the unfoamed skin layer was measured as 20.1 μm, 15.5 μm, 10.4 μm, 4.2 μm and 2.1 μm at Tf of 20, 40, 60, 80 and 100 °C, respectively.
To characterize the pore morphology, the inspection area of the SEM image was radially segmented and examined at 30–50 µm intervals depending on the pore size. There were more than 100 pores within the inspection area, 100 µm × 30–50 µm. The measured radial pore size distributions are shown in Figure 2. Here, x is inward distance from the outer surface of the filament. Entering the center increases the local mean pore diameter, indicating gradient foaming. It can be seen that the higher the post-foaming temperatures, the larger the pore diameter. It is due to reduced viscosity by approaching or exceeding glass transition temperature. In the case of a post-foaming temperature of 100 °C, there is a slight increase in outermost pore size, due to softer copolymer matrix at the elevated post-foaming temperature.
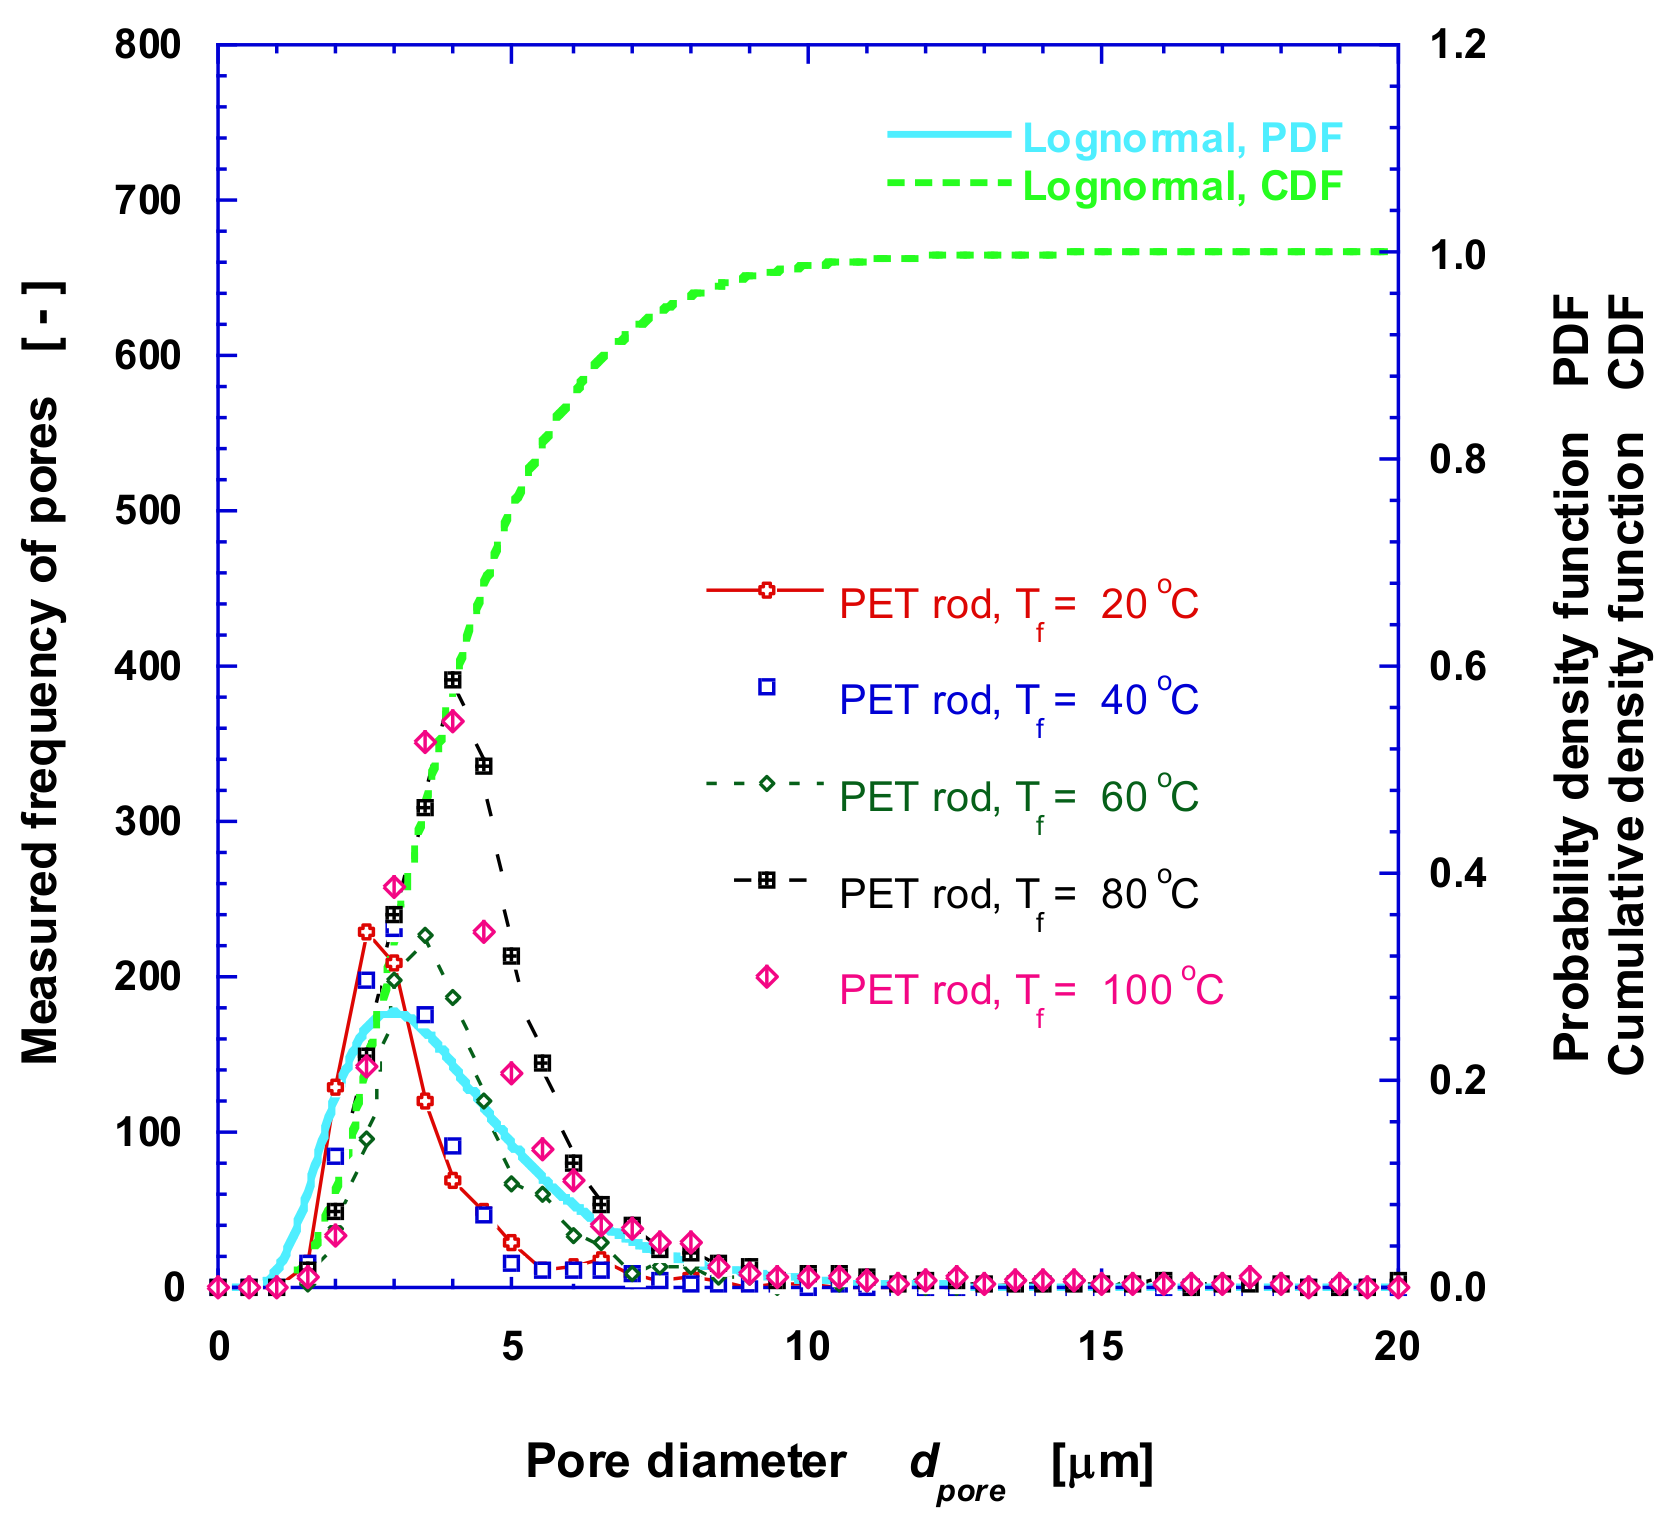
The pore-size distribution and probability density function were evaluated from the image analysis results as shown in Figure 3. The number-averaged effective pore diameter, d p o r e , was calculated. As the post-foaming temperature goes up, a gradual increase in mean diameter, i.e., 3.08 µm, 3.12 µm, 3.99 µm, 4.57 µm, and 5.26 µm, respectively, occurs from 20 °C to 100 °C. After collecting all the pore sizes obtained from image analysis, the size distribution fits the lognormal distribution as in [10]. The median diameter and the standard deviation obtained by the overall lognormal distribution fitting are 3.512 µm and 0.4574, respectively. There are small differences in the mean diameter since it is calculated not from the area-average basis but the number-average one. Although the pore-size distributions were estimated from SEM images, we also confirmed negligible fraction of submicron pores from further zoomed-in SEM images.

3.2. Mechanical Properties—Hardness and Elasticity

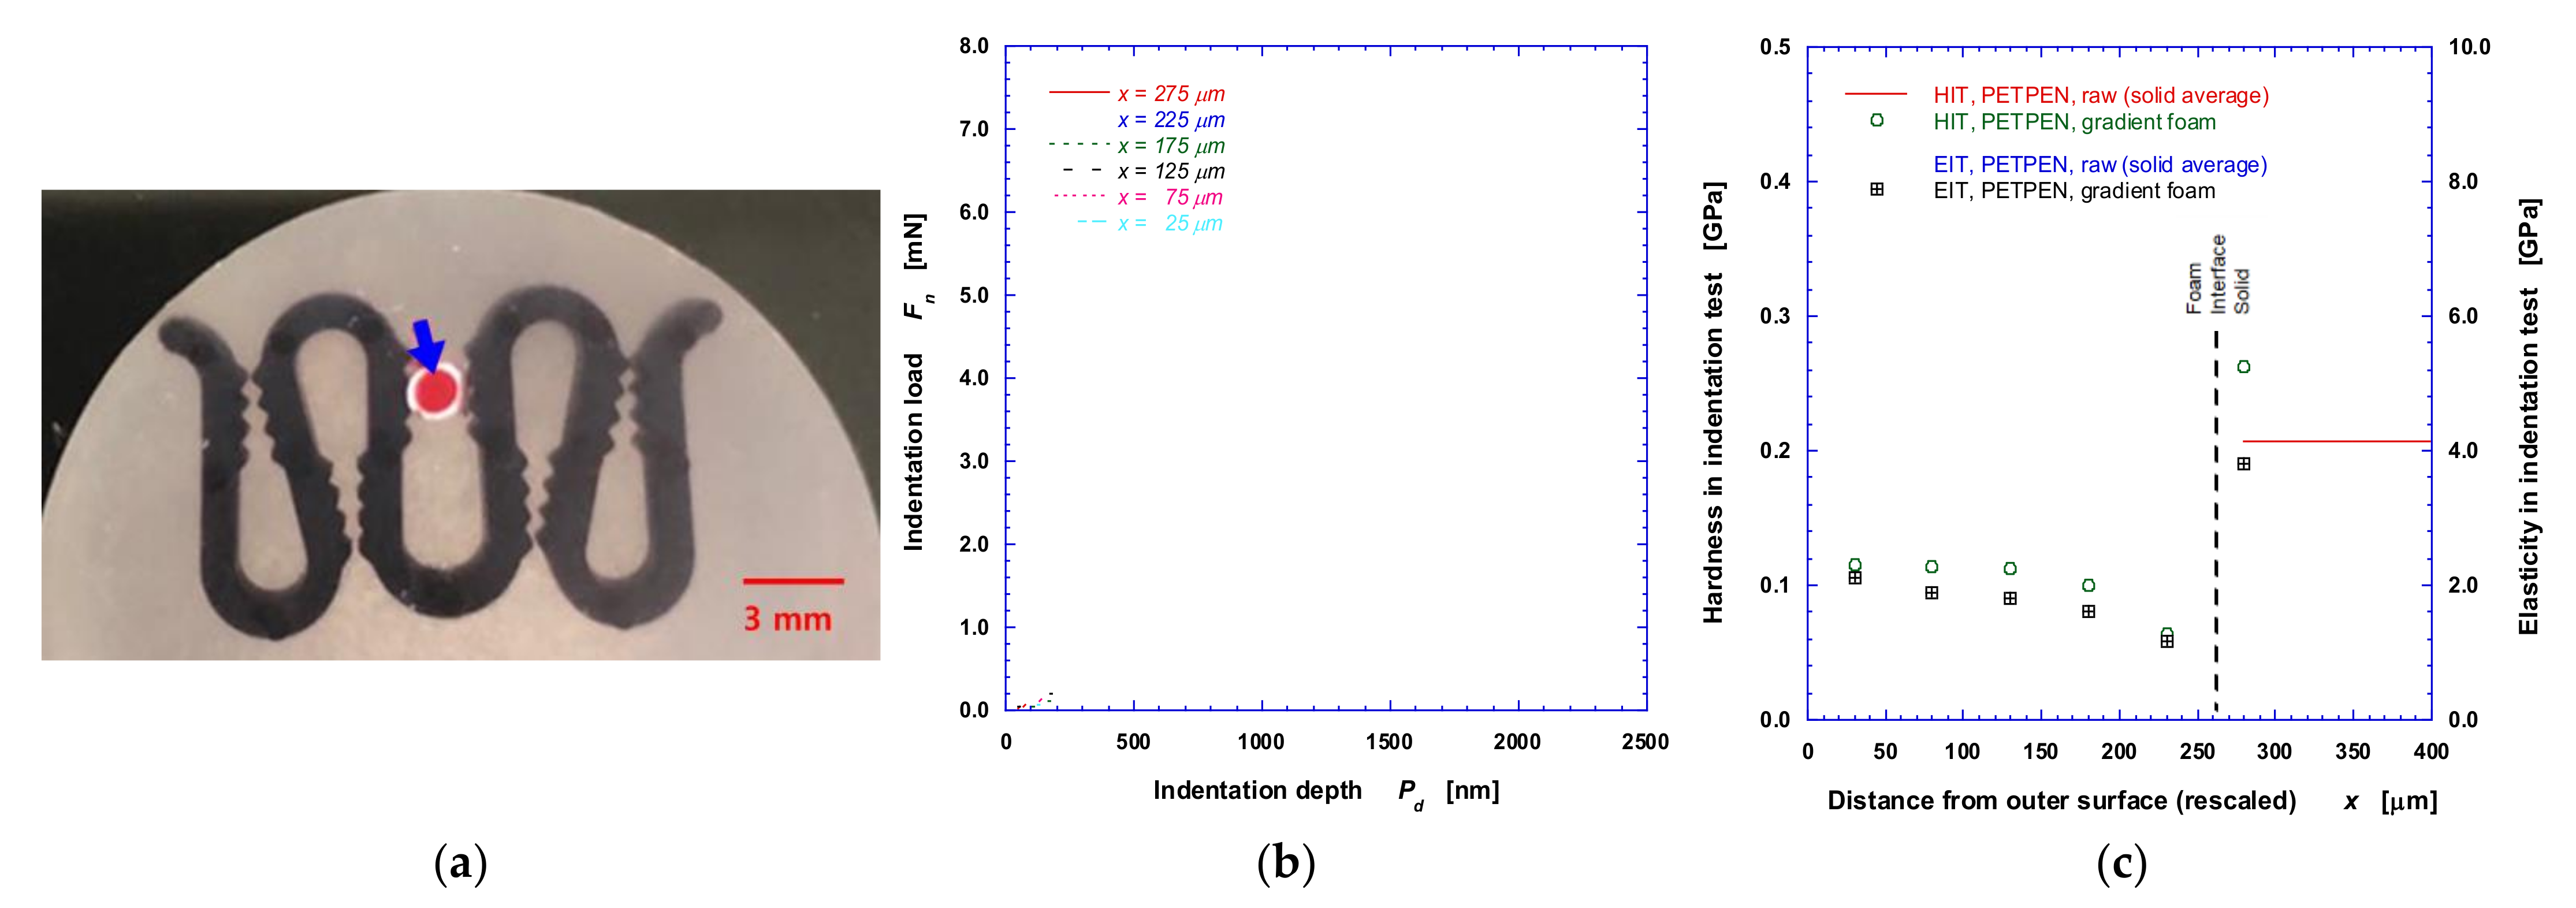
Figure 4 shows the results of an advanced indentation test to get micromechanical properties of gradient foam. The sample preparation steps for the instrument (Autopolisher Tegramin-25, Struers Inc., Cleveland, OH, USA) used in the experiment are as follows. Samples were clamped using a mounting clip and then cold-mounted for indentation tests. In the cold mounting process, the acrylic powder and acrylic liquid (Allied High Tech Products Inc., Compton, CA, USA) were well-mixed at a weight ratio of 2:1 and poured into a mounting cap. The resin compound was solidified for more than 30 min in a suction hood. Then, sample surfaces were rubbed by changing SiC papers #220 to #2200, and polished into about 1 µm thickness using diamond paste. The hardness and elastic moduli were measured from nano-indentation experiments using Berkovich indenter (Nano-Stress-Mapper by Frontics, Inc., Seoul, Korea, 65.3° Berkovich indenter tip angle), measuring radial distribution of hardness and elasticity at equal intervals. Loading rate was 10 mN/min with single loading–unloading, and holding time was 1.0 s. All the measurements were performed in ambient air condition. Experimental parameters are summarized in Table 1.
Figure 4a is a photograph of a sample prepared for nano-indentation using instrumented indentation technique (IIT). Figure 4b shows typical indentation load–displacement curves for the foamed filaments subjected to the sorption at −20 °C for 24 h and the post-foaming at 60 °C for 3 min. Although copolymer is viscoelastic, it is seen that the slopes of elastic unloading curves are higher than those of elastic–plastic loading curves. All the load-displacement curves exhibit hysteresis between loading and unloading as expected. One way to ensure the reliability of measured data is to examine the configuration of the load-deflection curve. The reliability of our results can be confirmed, for example, by Figure 4b. As the distance x from the outer surface increases, the slope of the hysteresis curve decreases slightly except for x = 275 mm, where solid core is present so that it has the highest value. Figure 4c shows the variations of estimated mechanical properties, H I T and E I T . As the inward distance, x, increases, the pore size is getting larger as shown in Figure 1 and Figure 2. The indentation hardness and elasticity of polymer are load-level invariants [31]. However, they are sensitive to the loading rate, holding time, and unloading rate. Both H I T and E I T increase with increasing loading rate, while they decrease with increasing holding time. The indentation hardness decreases as the holding time increases, while the hardness exhibits unloading-rate independence. Nevertheless, Figure 4c shows the detailed distribution of mechanical properties, i.e., increasing pore size in the gradient foam results in a little decrease in both mechanical properties H I T and E I T . In the central core region unaffected by the foaming process, the indentation hardness and elasticity were maximum. H I T and E I T varied around 0.12 GPa and 2.0 GPa, respectively, in the foamed region while H I T and E I T were 0.21 GPa and 5.3 GPa, respectively in the core region.

3.3. Simple Extension Behavior

To characterize the simple extension behavior of the PET–PEN rod when it was exposed to different temperature environments, the length increase with T was measured with the method at Section 2.2.4. The recorded video images were analyzed to measure the moving length of the weight attached to the PET–PEN rod as a function of time. Linear expansion is defined as the percent increase in the length of the rod (L–L0)/L0 * 100, where L is the length and subscript 0 represents the initial value. Figure 5 shows the linear expansion of the rod with changes in environment and foaming temperature Tf. The thermal expansion of the wire is 18 to 19 * 10−6 m/m °C, so it was neglected. The slope in Figure 5 represents 100 times of coefficient of linear thermal expansion (α). Below 70 °C, all rods expand slowly due to thermal expansion and tensile stress of 2.2 MPa by the weight of the load. Above 70 °C, it can be seen that there are two types of groups: a rapid or steep expansion group (SEG) and a weak or mild expansion group (MEG). Pristine 40 °C, 60 °C foaming PET–PEN is a case that belongs to SEG, and its length increases rapidly with temperature. An increase of 1 °C above 78 °C almost doubles its length. Foaming temperatures of 80 °C and 100 °C correspond to MEGs whose length gradually increases with temperature. During the change from 85 to 90 °C, the length increases by 10%. The glass transition temperature (Tg) can be obtained from the intersection of the two linear tangents obtained from the data in this figure. For a pristine PET–PEN, it is 79.0 °C, which is close to 75.9 °C obtained using the DSC curve [26].
Figure 6 shows the effect of foaming temperature on Tg and the coefficient of thermal expansion. The foaming temperature causes a change of Tg about 2 °C, but has a lot of influence on α for T > Tg. The coefficient of thermal expansion of SEG is around 0.5 m/m°C and that of MEG is 0.02.

3.4. Flame Spread Rate

To extend the use of PET–PEN to building insulation, the flame spread rate must be a known property. For this, it was measured when the flame propagated vertically downward.
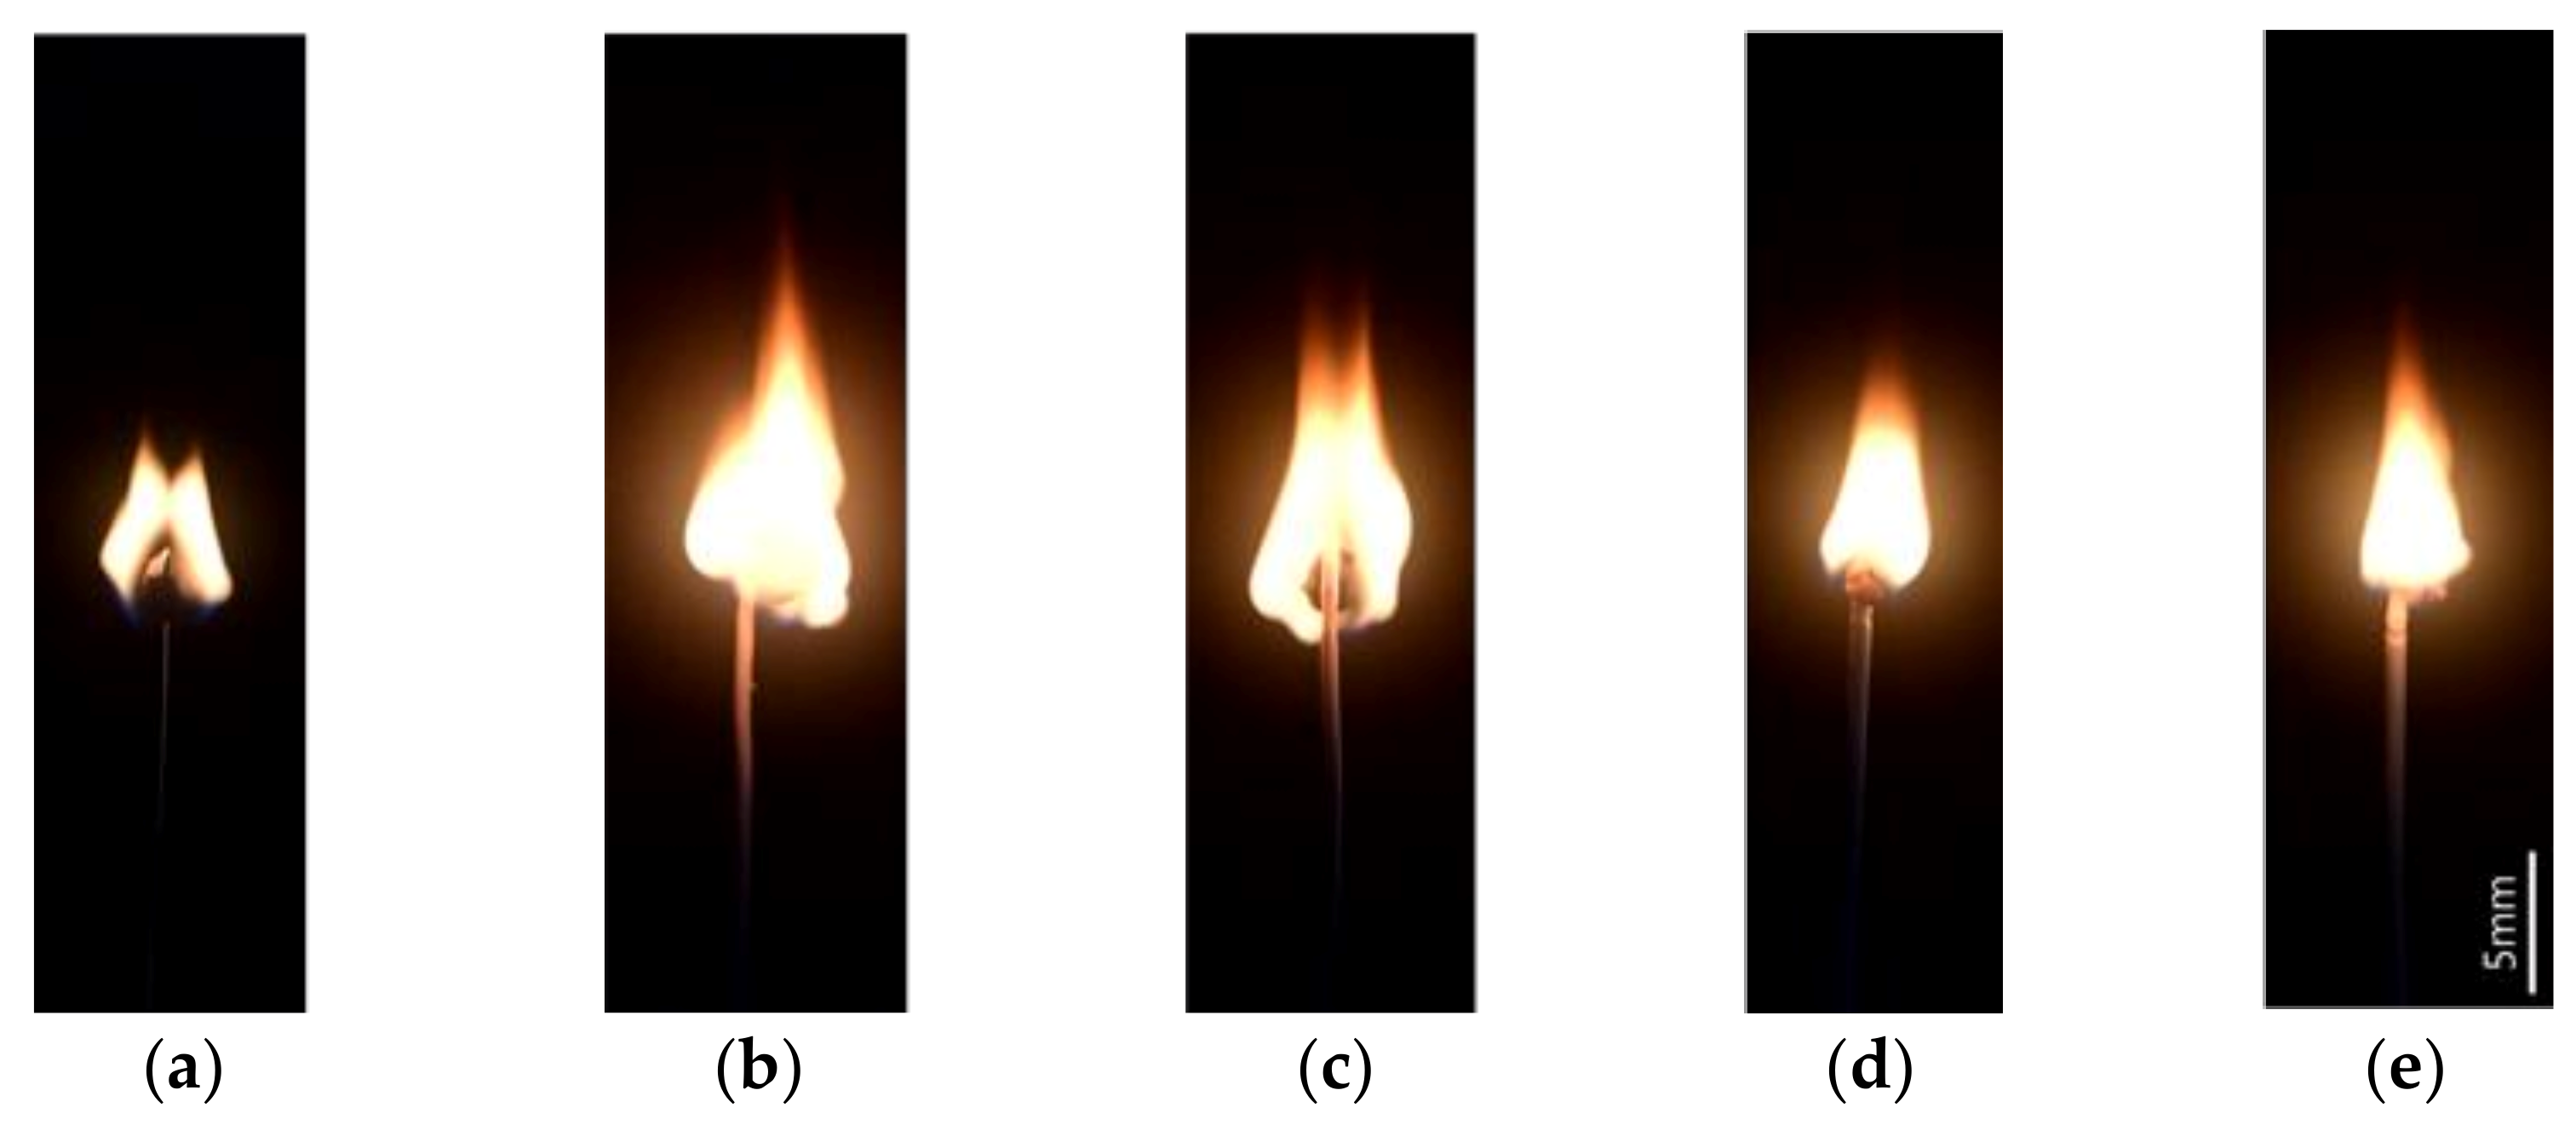
PET–PEN has a yellowish flame that emits soot from the flame tip and has a slightly different shape depending on the foaming temperature (Figure 7). The molten polymer did not fall off or drip off. The flame of the pristine case is visibly split into two tips by relatively large molten polymer balls. At a foaming temperature of 40 °C or 60 °C, fragments scatter outward and burn, which are connected to the main flame. This results in an irregular shape of the flame. In the 80 °C and 100 °C cases, the flame appears to lie on a burning rod. The rod beneath the flame base has a small area where the surface appears to melt.
For pristine, 40 °C and 60 °C, classified as SEG in Section 3.4, there are relatively large molten polymer balls suspended from bent PET–PEN strands. Heat transfer from the flame makes the heated part of the virgin rod above the glass transition temperature Tg, resulting in a lower viscosity and rapid length expansion. Due to the weight and low viscosity of the molten polymer, it bends, and the length and surface area of the rod within the flame envelope increase. On the contrary, MEG (80 °C and 100 °C cases) have less flexibility to extend their length, so the rod bends less and the angle between the virgin rod and the burning rod is mostly near the right angle as was shown in Figure 7. Because the fresh rod within the flame zone is relatively small, the heat transfer to the unburned rod is less than that of the other group. Thus, less polymer is supplied to the flame.
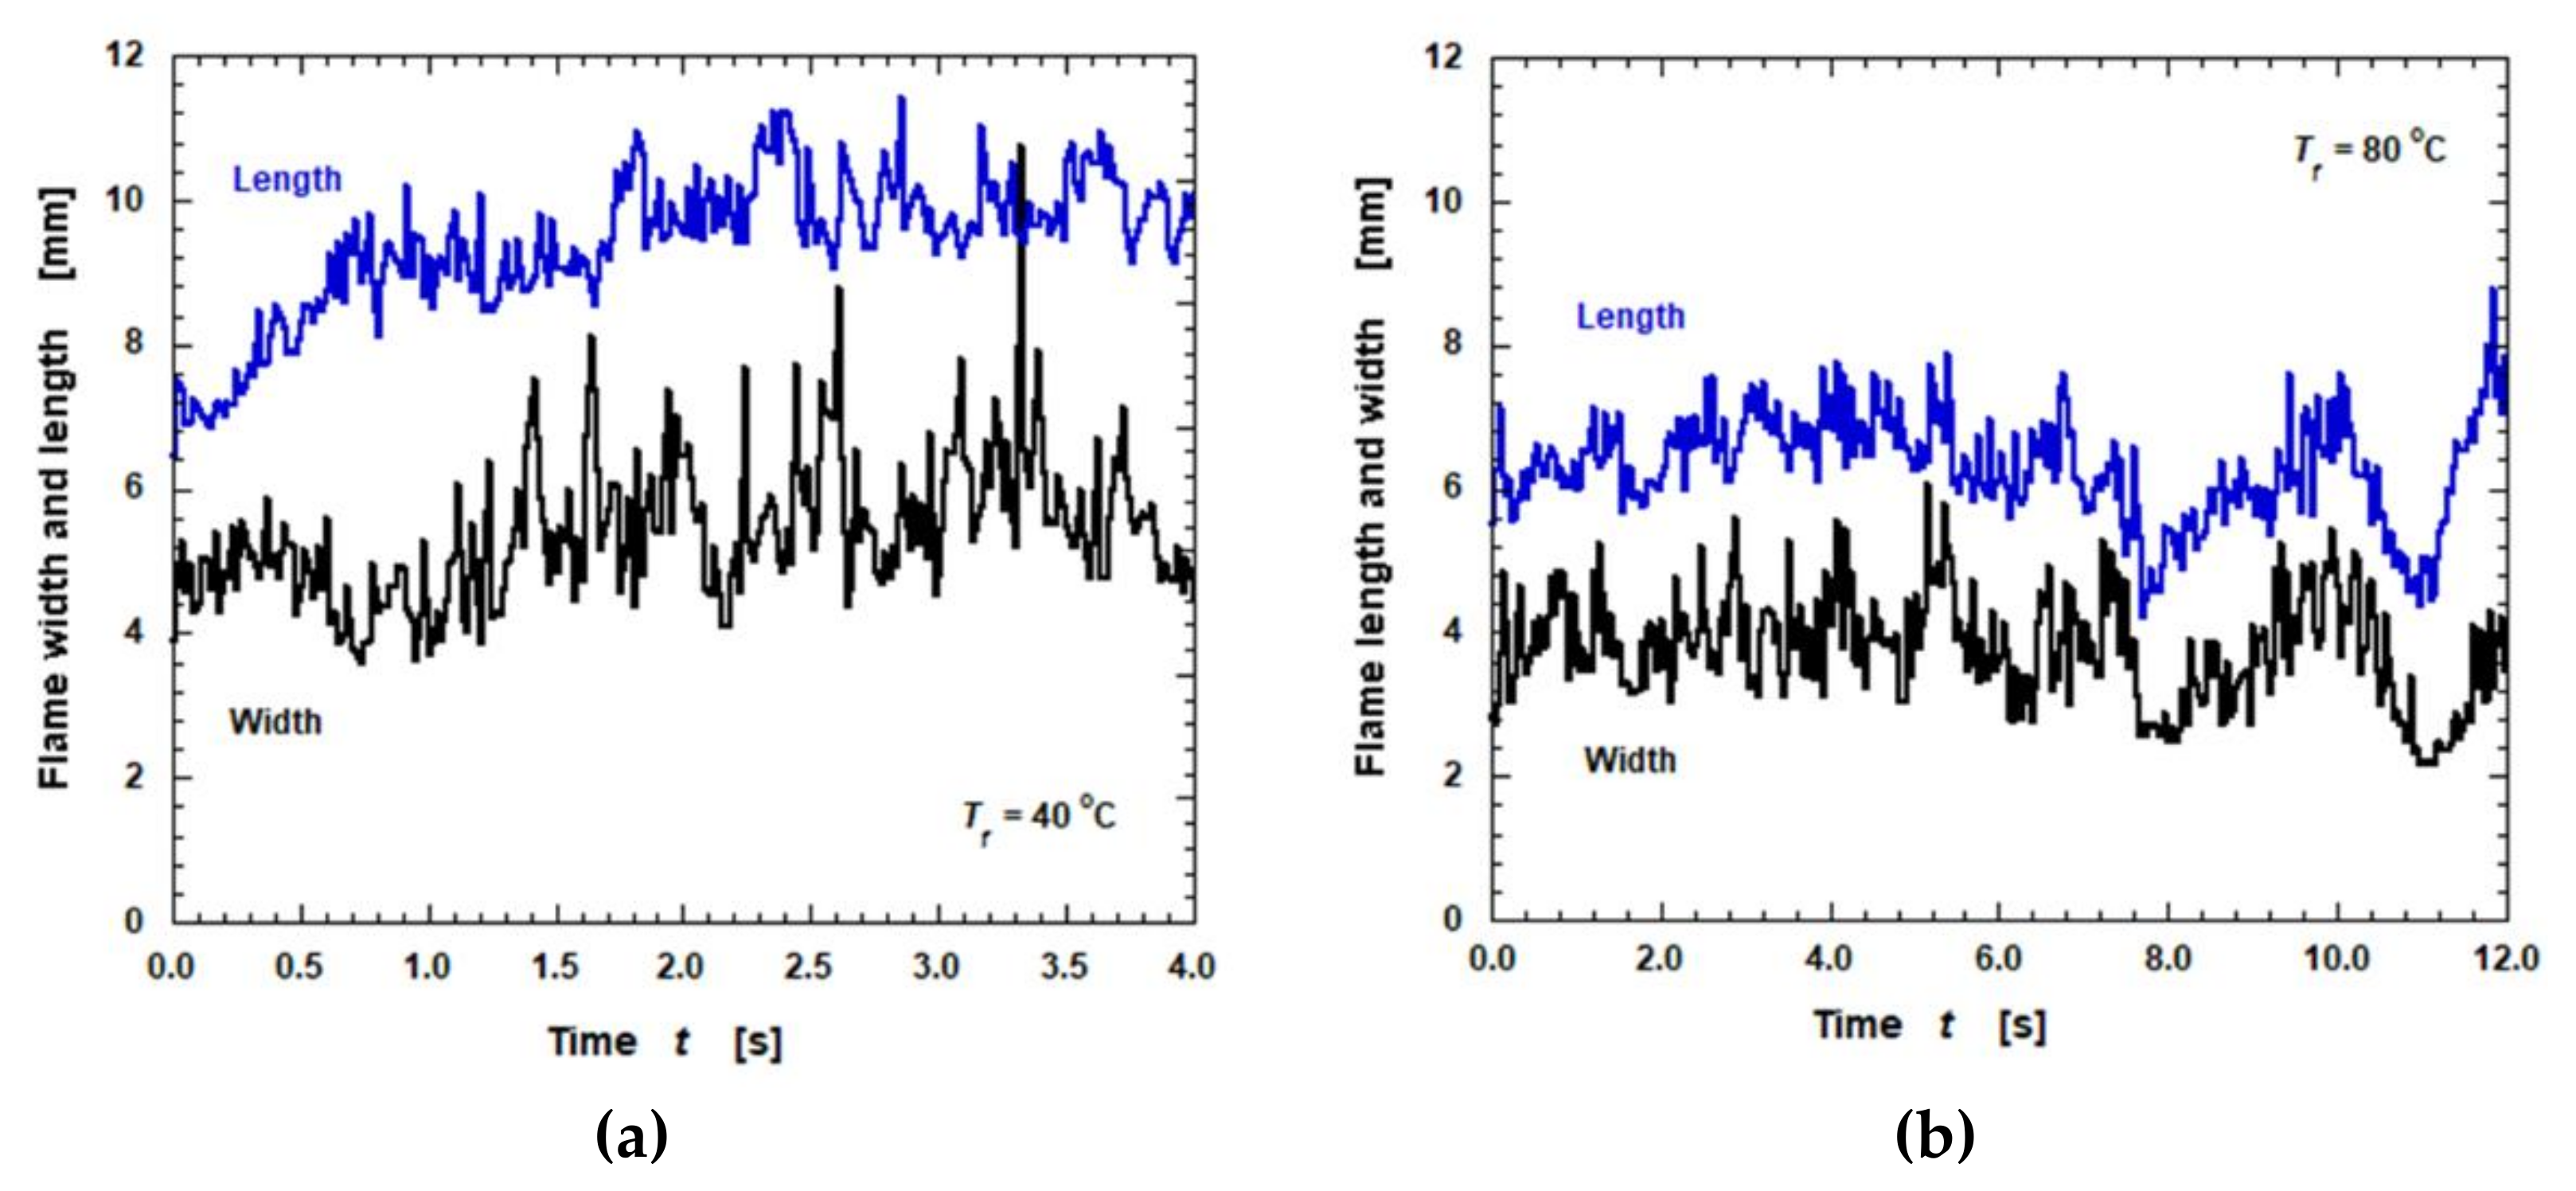
Figure 8 shows the flame length and width of 40 °C and 80 °C cases representing each group. In the flame image, the distance between the tip and the bottom of the flame was defined as the flame length. The length from the right-most to the left-most bright spot was defined as the flame width. The 40 °C case has a larger flame length and width compared to the case of 80 °C. This relates to the pieces of burning fragments that move outward within the flame envelope, as previously mentioned. Though there are some spikes in the figure, the dimensions of the flame do not change much for most of the period, especially at 40 °C.
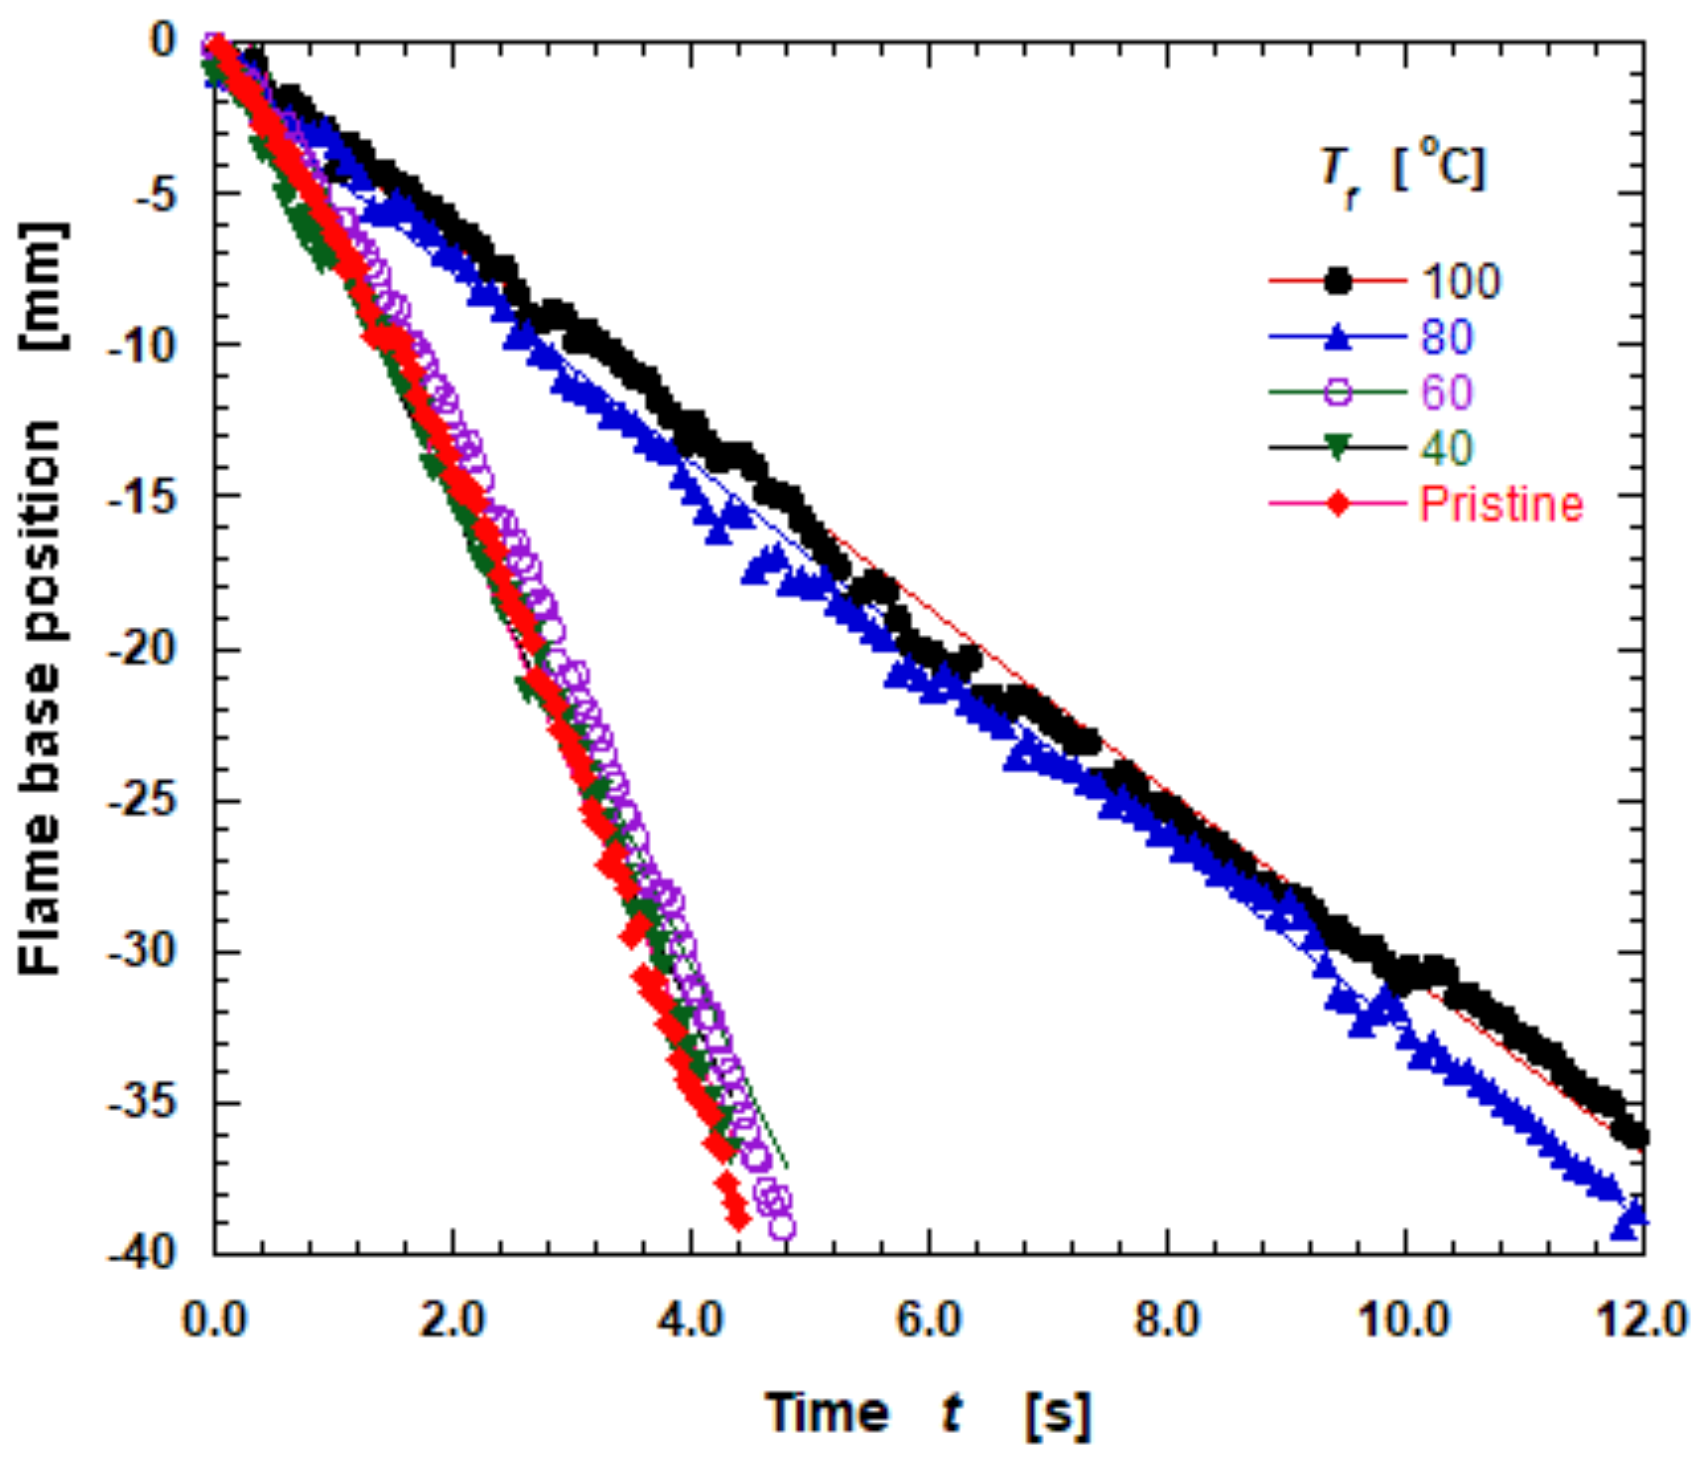
The position of the flame base was measured to get the flame spread rate. To avoid the interaction between the flame and the ignition electrode, we started analyzing the recorded image from after the flame tip passed the electrode. Zero-markers in Figure 9 indicate this analysis starting moment. A minus sign in the vertical axis means downward direction. Because the length of the flame does not change a lot, it could be considered as the movement of the flame. It shows that the flame immigrates downward fairly steadily with time. There are two things to point out in the graph. First, the time to reach the bottom of the image exhibits different characteristics for each group. The flame of SEG (pristine, 40 °C and 60 °C foaming temperature) reached the bottom faster than that of MEG (80 °C and 100 °C). Second, there is little difference in flame propagation within the group. These two seem to be related to the material’s ability to stretch. The large elongation property increases the heat transfer to the material entering the flame, which makes it easier to burn, as mentioned earlier.
If there is a core solid material and the polymer covers it up, the flame-spread rates can be evaluated by tracking the leading edge of the flame since it spread over the core wire [19]. When there is no core wire as in this research, the polymer rod is bent by heat, gravity, surface tension, and viscosity. Since the irregular three-dimensional flame covers up the rod tip and burning molten material, the difference in the brightness between the flame and the rod tip is not large enough to trace the flame edge on the raw material. We assumed the movement of the flame base is similar to that of the flame leading edge because the distance between the point where the rod is bent down and the upper end of the molten polymer is small as in Figure 7 and flame length does not change significantly as in Figure 8. So we traced the flame base to get the flame spread rate.
The flame spread rate of the material as shown in Figure 10 was calculated from the slope in Figure 9. The correlation of the curve fitting is 0.99 or more, and the error of the burn rate is +-7.1%. The burning rates of pristine, 40 °C and 60 °C cases that expand rapidly for T > Tg are 8.3, 8.5, and 8.8 mm/s, respectively. The rates are 3.1 and 3.1 mm/s for 80 °C and 100 °C cases that are the mildly expanding group. The SEG group has a higher burning rate than MEG. As mentioned previously, the high thermal elongation properties at T > Tg in steep expansion groups improve heat transfer by bending the rod and increasing the volume of the burning material of the rod in the flame zone. These things seem to have influenced the SEG group to have a higher burning rate.

4. Conclusions

In this study, a partial foam structure was fabricated in a PET–PEN copolymer by solid state foaming. Through morphological characterization, a potential to fabricate gradient foam structures with micropores was identified. The post-foaming temperature can tune the pore size as well as its distribution. The thickness of the unfoamed thin layer decreases as the post-foaming temperature increases. Radial distribution of micromechanical properties H I T and E I T were measured for the gradient foam, and their values were around 0.12 GPa and 2.0 GPa, respectively, for the outer foamed region.
The foaming temperature Tf changes the glass transition temperature Tg by about 2 °C, but has a great influence on the coefficient of thermal expansion α. For the range of Tf ≤ 60°C, thermal expansion coefficients for T > Tg are about 0.5 m/m °C. These ranges were called the steep expansion group (SEG). For the range of Tf ≥ 80 °C, called the mild expansion group (MEG), thermal expansion coefficients are around 0.02 m/m °C. The SEG groups have about 2.8 times higher flame spread rates than the MEG groups, but there are no significant differences in flame spread rates within each group.

Author Contributions

Conceptualization, B.K.P.; methodology, B.K.P. and B.J.L.; validation, B.K.P. and B.J.L.; formal analysis, B.K.P. and B.J.L.; data curation, C.-J.K. and B.J.L.; writing—original draft, B.K.P. and B.J.L.; writing—review and editing, B.J.L. and C.-J.K.; project administration, B.K.P. and C.-J.K.; funding acquisition, B.K.P. All authors have read and agreed to the published version of the manuscript.

Funding

This research was supported by Grant (NRF-2018R1A2B2008196) from National Research Foundation of Korea funded by Ministry of Science and ICT of Korea government.

Acknowledgments

Authors are grateful to Woojoo Kim, Department of Materials Science and Engineering at Seoul National University, for experiment help and comments on the nano-indentation system.

Conflicts of Interest

The authors declare that there is no conflict of interest regarding the publication of this paper.

References

  1. Gonçalvesa, M.; Simõesa, N.; Serraa, C.; Flores-Colen, I. A review of the challenges posed by the use of vacuum panels in external insulation finishing systems. Appl. Energy 2020, 257, 114028. [Google Scholar]
  2. Choi, B.; Yeo, I.; Lee, J.; Kang, W.K.; Song, T.H. Pillar-supported vacuum insulation panel with multi-layered filler material. Int. J. Heat Mass Transf. 2016, 102, 902–910. [Google Scholar] [CrossRef]
  3. Kwon, J.S.; Jang, C.H.; Jung, H.; Song, T.H. Vacuum maintenance in vacuum insulation panels exemplified with a staggered beam VIP. Energy Build. 2010, 42, 590–597. [Google Scholar] [CrossRef]
  4. Lee, S.T. Polymeric Foams: Innovations in Process, Technologies and Products; CRC Press: Boca Raton, FL, USA, 2017. [Google Scholar]
  5. Maio, E.D.; Kiran, E. Foaming of polymers with supercritical fluids and perspectives on the current knowledge gaps and challenges. J. Supercrit. Fluids 2018, 134, 157–166. [Google Scholar] [CrossRef]
  6. Martini, J.E.; Waldman, F.A.; Suh, N.P. The Production and analysis of microcellular thermoplastic foams. SPE Tech. Pap. 1982, 28, 674. [Google Scholar]
  7. Guo, H.; Kumar, V. Some thermodynamic and kinetic low-temperature properties of the PC-CO2 system and morphological characteristics of solid-state PC nanofoams produced with liquid CO2. Polymer 2015, 56, 46–56. [Google Scholar] [CrossRef]
  8. Xia, T.; Xi, Z.; Tao Liu, T.; Zhao, L. Solid state foaming of poly(ethylene terephthalate) based on periodical CO2-renewing sorption process. Chem. Eng. Sci. 2017, 168, 124–136. [Google Scholar] [CrossRef]
  9. Yu, J.; Song, L.; Chen, F.; Fan, P.; Sun, L.; Zhong, M.; Yang, J. Preparation of polymer foams with a gradient of cell size: Further exploring the nucleation effect of porous inorganic materials in polymer foaming. Mater. Today Commun. 2016, 9, 1–6. [Google Scholar] [CrossRef]
  10. Yoon, T.J.; Kong, W.; Kwon, D.E.; Park, B.K.; Lee, Y.-W. Preparation of solid-state micro- and nanocellular acrylonitrile-butadiene-styrene (ABS) foams using sub- and supercritical CO2 as blowing agents. J. Supercrit. Fluids 2017, 124, 30–37. [Google Scholar] [CrossRef]
  11. Ono, T.; Wu, X.; Horiuchi, S.; Furuya, T.; Yoda, T. Two-step foaming process for production of PMMA nanocellular polymer foams via ultra-high pressure and rapid depressurization. J. Supercrit. Fluids 2020, 165, 104963. [Google Scholar] [CrossRef]
  12. Martin-de Leon, J.; Bernardo, V.; Rodriguez-Perez, M.A. Key production parameters to obtain transparent nanocellular PMMA. Macromol. Mater. Eng. 2017, 302, 1700343. [Google Scholar] [CrossRef]
  13. Sałasińska, K.; Borucka, M.; Leszczyńska, M.; Zatorski, W.; Celiński, M.; Gajek, A.; Ryszkowska, J. Analysis of flammability and smoke emission of rigid polyurethane foams modified with nanoparticles and halogen-free fire retardants. J. Therm. Anal. Calorim. 2017, 130, 131–141. [Google Scholar] [CrossRef] [Green Version]
  14. Szabó, V.A.; Dogossy, G. Flame retardancy of recycled PET foam. In IOP Conference Series: Materials Science and Engineering; IOP Publishing: Bristol, UK, 2020; Volume 903. [Google Scholar] [CrossRef]
  15. Yuan, Q.; Huang, D.; Hu, Y.; Shen, L.; Shi, L.; Zhang, M. Comparison of Fire Behavior of Thermally Thin and Thick Latex Foam Under Bottom Ventilation. Polymers 2019, 11, 88. [Google Scholar] [CrossRef] [PubMed] [Green Version]
  16. Babu, K.; Rend, G.; Mensah, R.A.; Kim, N.K.; Jiang, L.; Xu, Q.; Restas, A.; Neisiany, R.E.; Hedenqvist, M.S.; Försth, M.; et al. A Review on the Flammability Properties of Carbon-Based Polymeric Composites: State-of-the-Art and Future Trends. Polymers 2020, 12, 1518–1536. [Google Scholar] [CrossRef]
  17. Jasinski, E.; Bounor-Legaré, V.; Taguet, A.; Beyou, E. Influence of halloysite nanotubes onto the fire properties of polymer based composites: A review. Polymer Degrad. Stab. 2021, 183. [Google Scholar] [CrossRef]
  18. Delichatsios, M. Effects of material thickness on ignition times and creeping flame spread in the thermal regime: Theory, analytical solution and experimental justification. Fire Saf. J. 2020, 116, 103204. [Google Scholar] [CrossRef]
  19. Kobayashi, Y.; Huang, X.; Nakaya, S.; Tsue, M.; Fernandez-Pello, C. Flame Spread over Horizontal and Vertical Wires: The Role of Dripping and Core. Fire Saf. J. 2017, 91, 112–122. [Google Scholar] [CrossRef]
  20. Kobayashi, Y.; Konno, Y.; Huang, X.; Nakaya, S.; Tsue, M.; Hashimoto, N.; Fujita, O.; Fernandez-Pello, C. Effect of insulation melting and dripping on opposed flame spread over laboratory simulated electrical wires. Fire Saf. J. 2018, 95, 1–10. [Google Scholar] [CrossRef]
  21. Park, S.H.; Lim, S.J.; Cha, M.S.; Park, J.; Chung, S.H. Effect of AC electric field on flame spread in electrical wire: Variation in polyethylene insulation thickness and di-electrophoresis phenomenon. Combust. Flame 2019, 202, 107–118. [Google Scholar] [CrossRef]
  22. Park, S.H.; Kang, M.S.; Cha, M.S.; Park, J.; Chung, S.H. Flame spread over twin electrical wires with applied DC electric fields. Combust. Flame 2019, 210, 350–359. [Google Scholar] [CrossRef] [Green Version]
  23. Rybińskia, P.; Bradłob, D.; Żukowskib, W.; Syreka, B. Determination of toxic products emissions of polymers thermal decomposition using fluidised bed reactor and FTIR analysis. Polym. Test. 2019, 79, 106040. [Google Scholar]
  24. Godey, F.; Fleury, A.; Soldera, A. Local dynamics within the glass transition domain. Sci. Rep. 2019, 9, 9638. [Google Scholar] [CrossRef] [Green Version]
  25. Tetlow, D. Cellulosic-crystals as a fumed-silica substitute in vacuum insulated panel technology used in building construction and retrofit applications. Energy Build. 2017, 156, 187–196. [Google Scholar] [CrossRef]
  26. Park, B.K.; Kim, C.-J.; Kwon, D.E.; Lee, Y.-W. Design and Fabrication of of Partially Foamed Grid Structure Using Additive Manufacturing and Solid State Foaming. Processes 2020, 8, 1594. [Google Scholar] [CrossRef]
  27. Oliver, W.C.; Pharr, G.M. An improved technique for determining hardness and elastic modulus using load and displacement sensing indentation experiments. J. Mater. Res. 1992, 7, 1564–1583. [Google Scholar] [CrossRef]
  28. Baylakoglu, I.; Hillman, C.; Pecht, M. Characterization of Some Commercial Thermally-Cured Potting Materials. In Proceedings of the International IEEE Conference on the Business of Electronic Product Reliability and Liability, Hong Kong & Shenzhen, China, 13–14 January 2003; Available online: https://www.researchgate.net/publication/265869710 (accessed on 20 December 2020).
  29. Kiran, E. Morphological modifications and formation of morphologically-gradient polymers in dense fluids. In Proceedings of the 5th International Symposium on High Pressure Process Technology and Chemical Engineering, Segovia, Spain, 24–27 June 2007; pp. 1–10. [Google Scholar]
  30. Park, B.K.; Kim, C.-J.; Lee, Y.W. Characterization of Gradient Foam Using Additive Manufacturing and Gas Foaming Technologies. In Proceedings of the 4th International Conference on Manufacturing Technologies (ICMT 2020), Seattle, DC, USA, 17–20 January 2020; Agarwal, R.K., Ed.; Abstract MC20-321-A. Available online: http://icmt.org/icmt2020.html (accessed on 16 October 2020).
  31. Jin, T.; Niu, X.; Xiao, G.; Wang, Z.; Zhou, Z. Effects of experimental variables on PMMA nano-indentation measurements. Polym. Test. 2015, 41, 1–6. [Google Scholar]
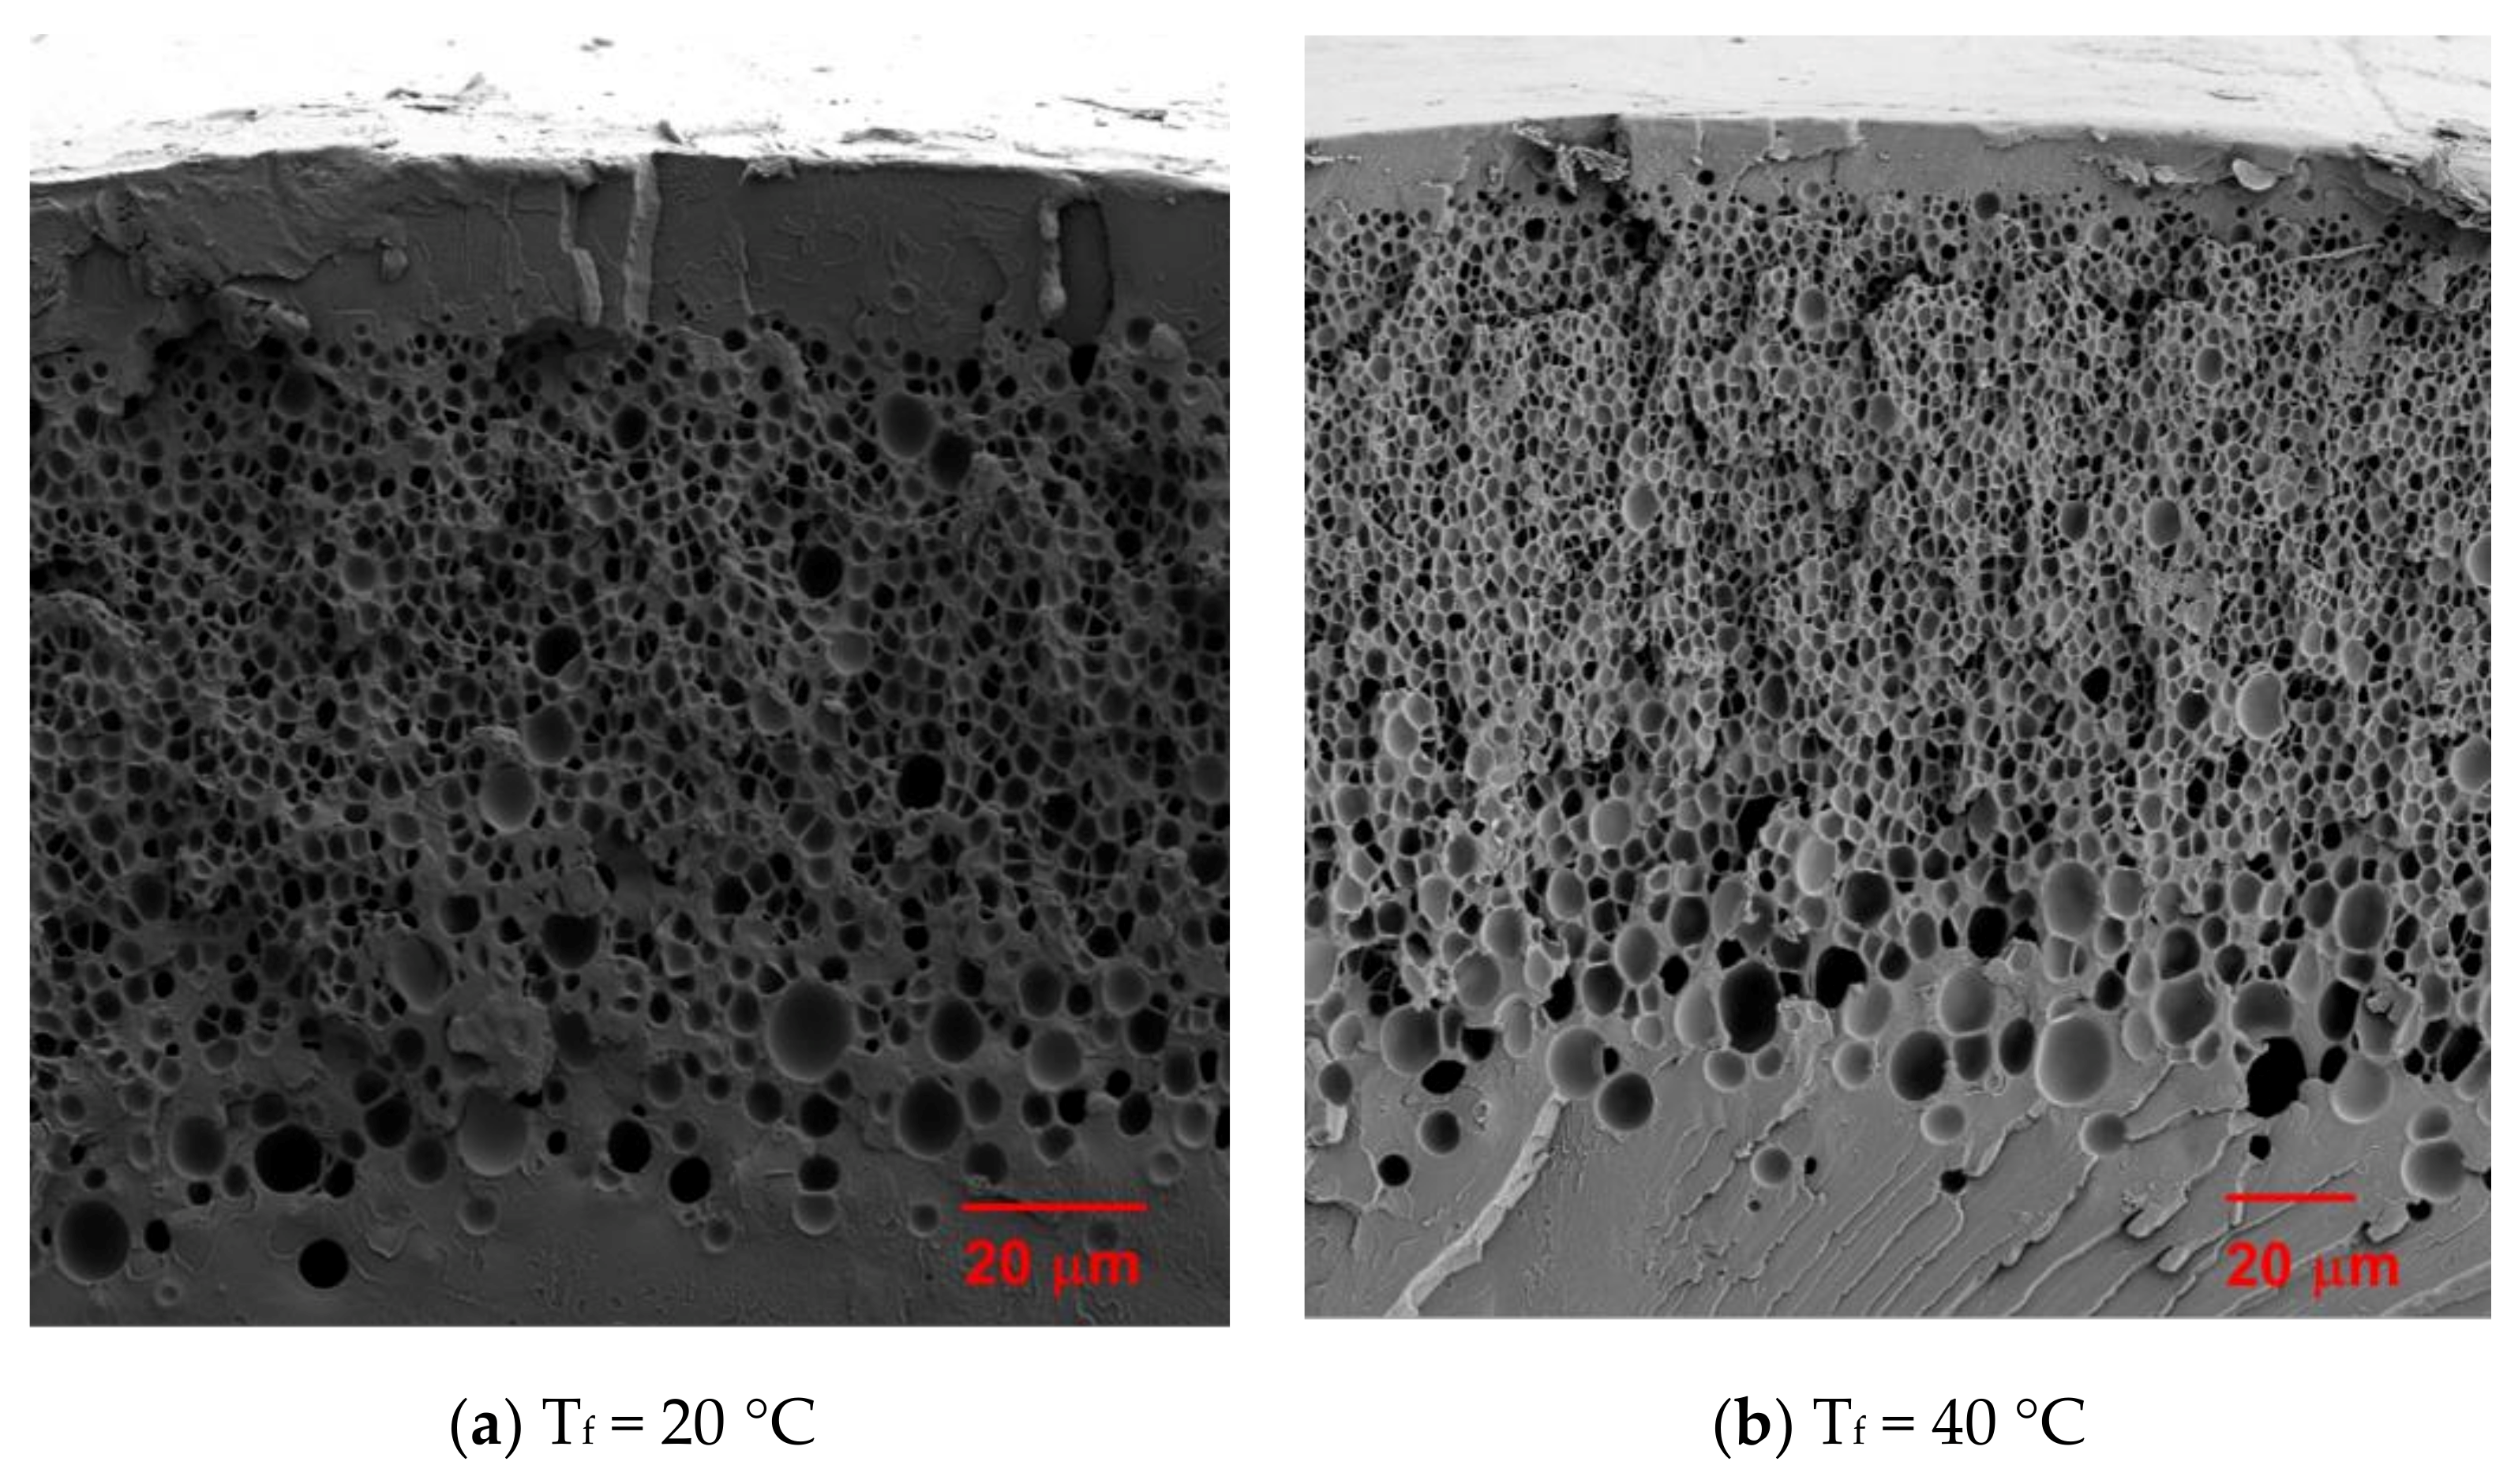
Figure 1. SEM micrographs of the foamed polyethylene terephthalate–polyethylene naphthalate (PET–PEN) copolymer when Tf is equal to (a) 20 °C; (b)40 °C; (c) 60 °C; (d) 80 °C.
Energies 14 00957 g001aEnergies 14 00957 g001b
Figure 2. Variation of local foam diameter along radial direction as trend of gradient foaming depending on post-foaming temperature. x = 0 corresponds to the outer surface location of PET–PEN copolymer filaments.
Energies 14 00957 g002
Figure 3. Size distribution of pores and probability density function for the CO2 foamed PET–PEN structure (sorption at −20 °C for 24 h, post-foaming at 20–100 °C for 3 min), measured from SEM images.
Energies 14 00957 g003
Figure 4. Measured hardness and elasticity. (a) Photograph of sample prepared; (b) load-depth curves, and (c) hardness and elasticity results for the foamed PET–PEN copolymer measured by instrumented indentation technology (sorption at −20 °C for 24 h, and then post-foaming at 60 °C for 3 min).
Energies 14 00957 g004
Figure 5. Linear expansion of the PET–PEN rod as function of environment and foaming temperature.
Energies 14 00957 g005
Figure 6. Effects of PET–PEN foaming temperature on (a) glass transition temperature; (b) coefficient of thermal expansion (CTE) for T > Tg. Vertical lines represent error bars.
Energies 14 00957 g006
Figure 7. Typical flame shape when the foaming temperature is (a) pristine; (b) 40 °C; (c) 60 °C; (d) 80 °C; (e) 100 °C.
Energies 14 00957 g007
Figure 8. Temporal changes in flame width and flame length when Tf equals (a) 40 °C; (b) 80 °C. Each is a representative case of SEG and MEG.
Energies 14 00957 g008
Figure 9. Temporal location of the flame base along the vertical PET–PEN rod.
Energies 14 00957 g009
Figure 10. Flame spread rate as function of PET–PEN foaming temperature. Vertical line represents error bar.
Energies 14 00957 g010
Table 1. Experimental parameters for the hardness and elasticity.
Standards and
Options
Acquisition Rate: 10.0 [Hz], Linear Loading, Max load: 5.00 mN,
Loading rate: 10.00 mN/min, Unloading Rate: 10.00 mN/min, Pause: 1.0 s
Fn contact: 0.3 mN, Approach distance: 2000 nm, Approach speed: 2000 nm/min,
Retract speed: 2000 nm/min, Stiffness Threshold: 150 μN/μm
Publisher’s Note: MDPI stays neutral with regard to jurisdictional claims in published maps and institutional affiliations.