Article

The Impact of an Ultrasonic Field on the Efficiency of Coke Wastewater Treatment in a Sequencing Batch Reactor

by
Anna Kwarciak-Kozłowska
and
Małgorzata Worwąg
*
Faculty of Infrastructure and Environment, Czestochowa University of Technology, 42-200 Czestochowa, Poland
*
Author to whom correspondence should be addressed.
Energies 2021, 14(4), 963; https://doi.org/10.3390/en14040963
Submission received: 17 December 2020 / Revised: 1 February 2021 / Accepted: 8 February 2021 / Published: 11 February 2021
(This article belongs to the Special Issue Energy and Matter Recovery from Organic Waste Processing and Reuse)

Abstract

:
The growing production of coke and, consequently, coke wastewater is a significant problem for the environment. Coke wastewater, because it contains high amounts of toxic substances, is classified as an extremely hazardous industrial wastewater. The treatment of such wastewater requires a combination of advanced physicochemical and biological methods. The aim of the research was to investigate the effectiveness of the application of the ultrasonic disintegration of coke wastewater in a sequencing batch reactor (SBR). The tests were conducted in two stages, wherein the first stage involved determining the most favorable sonication conditions, that is, time and amplitude. The authors used the following amplitudes: 31 µm; 61.5 µm; 92 µm; 123 µm and times: 120 s; 240 s; 480 s; 960 s. The second stage focused on treating coke wastewater in SBRs (Reactor A—a proportion of coke wastewater in the mixture: 5%, 10%, and 20%; reactor B—sonicated coke wastewater, proportion in mixture: 5%, 10%, 20%). The efficiency of the treatment process was determined based on the rate of removal of selected parameters: chemical oxygen demand (COD), total organic carbon (TOC), inorganic carbon (IC), ammoniacal nitrogen (N-NH4), total nitrogen (TN), the course of pH changes. The study revealed that sonication of coke wastewater increased biodegradability and reduced its toxicity. The use of the preliminary sonication of coke wastewater before biological treatment improved the degree of removal of the tested parameters by approximately 10%. The volumetric ratio of coke wastewater in the mixture had the greatest impact on the obtained results. The use of an ultrasound field allows the treatment process to be executed with a coke wastewater addition exceeding 10%. In addition, it was found that in order to increase the coke wastewater treatment efficiency, one should optimize individual phases in the SBR and the pollution load.

Graphical Abstract

1. Introduction

The production of coke is growing year by year. According to the forecast for 2021, global production will exceed 900,000 Mg per year. Most of the coking plants are located in Asia, while around 10% of global production comes from the European Union. Per every Mg of coke, 0.6 to 1.6 m3 of wastewater is generated. This means that approximately 144 ×107 m3 of coke wastewater is produced annually in coking plants around the world, and this is set to increase. The removal of pollutants from coke oven wastewaters is a significant issue due to the environmental impact of these compounds. The technological cycle of coke oven wastewater treatment is based on the conventional arrangement, i.e., the physical separation of larger solids by means of grids and/or grates, chemical coagulation for the removal of suspensions, and the precipitation of inorganic contaminants and biological nitrification/denitrification systems for the elimination of ammonia and soluble (DOC) organics. The purified wastewater, after the treatment process, can be used in wet coke quenching or disposed of in the environment [1,2,3,4].
The wastewater generated in the coking industry is classified as an extremely hazardous industrial wastewater. It contains a number of organic and inorganic substances, such as oils and tars (100–240 g/m3), slurries (200–330 g/m3), free and fixed ammonia (980–6500 g/m3), volatile and non-volatile phenols (260–3000 g/m3), thiosulphates, hydrogen sulfide, and highly toxic substances such as cyanides (approx. 50 g/m3) and rhodonites (approx. 200 g/m3) [5,6,7,8,9]. The average wastewater volume varies from 0.15 to 0.35 m3/t carbon. The application of conventional treatment methods, based on the activated sludge technology, is not always efficient, due to, among other factors, the significant variability in coke wastewater composition, depending on the type of coal and the coal processing technology used [10,11,12,13]. Therefore, in order to ensure the appropriate treatment outcome, it is very important to use (besides the biological activated sludge method) supporting and supplementing physicochemical processes responsible for the preliminary decomposition of these toxic and non-biodegradable organic compounds. According to the source literature, the application of a sequencing batch reactor (SBR) for the treatment of industrial wastewater, including coke-derived, is promising, since it enables matching the reactor operation cycle to the variable production of industrial wastewater in technological facilities and the removal of organic and nitrogen compounds [14,15,16]. Furthermore, in order to effectively intensify the treatment process, it is recommended to apply substrate disintegration methods. Numerous disintegration methods are used in practice, with the purpose of changing the chemical and physical structure of the substrate and conducting initial hydrolysis. Preliminary processing of coke wastewater seems a necessity due to its high toxicity [17,18,19].
Although many years have passed since the first use of ultrasound to accelerate chemical reactions, performed by Richards and Loomis (1927) [20], its use in organic wastewater technology is still rarely used on an industrial scale [21]. This, aside from the operating costs of the technology used, may be influenced by the variable nature of industrial wastewater [22].
Ultrasonic energy is a common and efficient disintegration technology for solving issues associated with removing toxic and hazardous organic compounds [23]. The active action of ultrasound leads to irreversible macroscopic changes in the medium. These interactions may involve the initiation of new processes, and affect the course of processes already taking place before their application. As a result of the active action of ultrasonic waves, secondary phenomena of a physical and chemical nature occur, such as dispersion, ultrasonic coagulation, oxidation, and depolymerization [24,25]. Apart from biological and chemical phenomena, mechanical phenomena are also observed in the ultrasonic field. They lead to the destruction of the structure of the medium as a result of particle vibrations, the intensity of which depends on the frequency and amplitude of the ultrasonic waves, which are caused by the varying pressures of the ultrasonic wave. The use of the ultrasonic field in industrial wastewater technology helps to break down many toxic and resistant organic pollutants, such as aromatics, chlorinated aliphatic compounds, surfactants, and organic dyes into simpler forms [26]. It is associated with the production of highly reactive oxidizing radicals, e.g., hydroxyl (OH•), hydrogen (H•) and hydroperoxyl (HO2•), and hydrogen peroxide (H2O2), produced during the implosion of cavitation bubbles. This leads, inter alia, to the oxidative breakdown of resistant compounds found in wastewater [27,28,29].
Oxidation of difficult-to-decompose organic compounds often contributes to an increase in their biodegradability, which, in turn, is associated with their accelerated degradation by bacteria in activated sludge [21]. Because industrial wastewater also contains ammonium nitrogen or phosphorus compounds, cavitation can oxidize molecules to CO2, H2O, and H2O2, and nutrients to NO3 and PO43− [30,31]. This contributes to further changes in the values of the chemical oxygen demand (COD), BOD, and TKN indicators [32].
As a result of the implosion of cavitation bubbles (temperature approx. 500 K, pressure approx. 180 MPa), besides the formation of H• and OH• radicals, there is also thermal decomposition of hydrophobic volatile substances and high mechanical shear stresses. Cavitation bubbles increase in volume in the areas of reduced pressure, i.e., below the critical value, and rapidly decrease in volume (disappear, implode) in areas of increased pressure, above the critical (threshold) value. The size of the threshold value depends on the type of liquid and wave frequency, as well as on the presence of microscopic impurities and gas particles in the liquid [33,34,35].
Acoustic cavitation occurs at low frequencies (20–100 kHz), whereas most ultrasonic wave energy is dissipated within the medium [36]. In order to induce cavitation in water, for a frequency of 20 kHz, the intensity value is approximately 1 W/cm2. This increases as the frequency increases [37,38,39]. The application of an ultrasonic field requires the optimization of operating parameters, such as the selection of appropriate frequencies, amplitude, impact times, and the characteristics of conditioned sludges. The assessment and analysis of the obtained ultrasonic conditioning results were conducted while taking into account the input variables, such as ultrasound dose, ultrasonic wave intensity, and input energy. The ultrasound effectiveness depends also on a number of parameters, such as substrate volume and type and the geometry of the sonication tank [40,41,42,43].
The use of the ultrasonic field in wastewater technology does not require the addition of oxidants or catalysts. Generating additional waste streams is also not a problem. In addition, ultrasound allows the duration of unit processes to be significantly shortened compared to other known techniques [21]. However, one of the main problems discouraging the operators of wastewater treatment plants from using ultrasound for the pre-conditioning of industrial wastewater is the high operating and investment costs of ultrasound devices [26].
This paper presents a novel application of an ultrasonic field for intensifying coke wastewater treatment in an SBR. The coke wastewater treatment process, as a result of its properties and variable composition, requires further research in order to determine the optimal process conditions. This may be key in order for these processes to become possible on a technical scale.
The objective of this research was to determine the impact of an ultrasonic field on wastewater treatment efficiency under a various mixtures of coke wastewater in an SBR. This study also addresses the problem of the influence of the size of the load introduced into the SBR reactor chamber (each of the analyzed indicators) on the efficiency of the wastewater treatment process. During the research, the sewage flowing in and out of the reactor after its full cycle of operation was analyzed. The effectiveness of wastewater treatment in this study was assessed using pollution indicators, which are characteristic of the given unit process.

2. Materials and Methods

2.1. Materials

The test substrate was a mixture consisting of synthetic and coke wastewater. Synthetic wastewater was prepared in accordance with the standard PN72/C-0455009 [44], with the primary organic carbon source being glucose. Coke wastewater from the Coking Plant in Czestochowa, prior to sampling within the facility, was mechanically treated, which resulted in the removal of oils, tar substances, and solid contaminants. Activated sludge, as the inoculum, was taken from the aeration chamber of the WARTA S.A. municipal wastewater treatment plant in Czestochowa. Table 1 shows the coke wastewater characteristics. The dry matter concentration in the sludge used to inoculate the reactors was 9.38 g/L, whereas the volume index (VI) amounted to approx. 85.3 cm3. The flock structure was compact and the sludge flock size was in the range of 150–200 µm. There were sedentary and floating ciliates, and proper and filamentous bacteria. There were no nematodes in the sediment used.

2.2. Experimental Design

The tests were conducted in two stages. The impact of ultrasonic disintegration on coke wastewater was determined in the first stage. For this purpose, changes in the concentration of COD and BOD5 values were analyzed with the assumed disintegration parameters. On the basis of the obtained results, the BOD5/COD ratio was calculated, which is an indicator of biodegradability. If the BOD5/COD ratio was >0.5, the substrate was referred to as easily degradable, 0.4–0.5 denoted moderately degradable, 0.2–0.4 denoted slowly degradable, and <0.2 non-degradable [26]. The selection of the most favorable sonication parameters (amplitude and time) was made on the basis of the highest value of the quotient obtained, proving the effectiveness of the applied disintegration (Figure 1, Stage I). The most favorable sonication time and amplitude were applied in the second stage of tests in the SBR.
The second stage involved laboratory-scale tests in two SBR-type reactors, with the active volume of each SBR amounting to 1 L. A diagram of the test rig is shown in Figure 1.

2.3. Sonicated

Ultrasonic disintegration of coke wastewater was conducted using a Sonisc vibro cell ultrasonic disintegration with a frequency of 40 kHz. Ultrasonic energy (Es) generated by a “sandwich” ceramic transducer in the disintegrator was introduced to the tested medium (raw coke wastewater) through a probe. The following sonication parameters were used: vibration amplitude A: 31 μm, 61.5 μm; 92 μm; 123 μm; and times t = 2 min (120 s), 4 min (240 s), 8 min (480 s), 16 min (960 s). The volume of the sonicated samples was 0.5 L (500 cm3) in a vessel with a diameter of 8 cm (Figure 1, Stage I). Sonication energy (Table 2) read from the device was used to calculate the acoustic power (1) followed by the acoustic wave intensity, using Formula (2) (Table 3) [45]:
N = Es/ts [J/s = W]
I = N/S [W/cm2]
  • N—acoustic power (W)
  • Es—sonication energy (J)
  • ts—sonication time (s)
  • I—acoustic wave intensity (W)
  • S—area of the surface that the wave passes through (cm2)

2.4. Operating Conditions of Laboratory-Scale SBRs

The hydraulic retention time (HRT) was 4 days; the average wastewater flow was 0.25 L/d and the amount of wastewater supplied within a single cycle was 0.25 L/d. A 24 h cycle constituted the daily operation of the system, and it included the phases of filling the chamber with wastewater (1.5 h), stirring raw wastewater (2 h), aeration (19 h), sedimentation (2 h), decantation (0.5 h) and a break (0.5 h). After the daily cycle was completed, the treated wastewater (0.25 L) was subjected to a physical and chemical analysis, and the bioreactor was prepared for the next cycle of operation. Air used in the reaction phase (aeration) was supplied to the system in the form of fine bubbles and through a diffuser. The contents of the reactor were mixed with a magnetic stirrer.
After a 21-day adaptation of the synthetic wastewater and the inoculum, a mixture of synthetic wastewater with an appropriate amount of coke wastewater (5%, 10%, 20%) was added to one of the bioreactors, and a mixture with the same % proportion of wastewater, but after sonication, was added to the other one. The entire experiment lasted 45 days. Literature reports do not provide consistent views as to the retention time of wastewater or the length of individual phases, as well as the increase in pollutant load over time. As a result of large fluctuations in the load of pollutants in the raw wastewater flowing to the treatment plant, short times (7 days) for the reaction were assumed in this study with an increasing the portion of coke wastewater in the mixture. Table 4 shows the duration of the individual operating stage of the bioreactor.

2.5. Analytical Methods and Statistical Procedures

The following analytical, chemical, and physical designations were used in the course of conducted tests:
  • COD was determined according to standard methods (APHA, 1999) [46], with the bichromate method using a Dr/4000 spectrometer by HACH, (APHA, 1999) [46];
  • Total organic carbon (TOC), total carbon (TC), inorganic carbon (NC), and total nitrogen (TN) were determined using a TOC 10 C Analyzer PX by Kiper, with an AS 40 autosampler by Dione;
  • Ammoniacal nitrogen (N-NH4) was determined using the titration method according to standard methods (APHA, 1999) [46];
  • pH was determined using the potentiometric method, (pH measurements were conducted using a 59002-00 pH meter by ColePalmer);
All analyses were triplicated. The results are presented in the tables and figures as arithmetic means.

2.6. Statistical Analysis

Statistical analysis was performed using the STATISTICA 13.3 software. The aim of the analysis was to determine the difference in the values of the studied indicators depending on the combination of tests (the variables in the combinations were amplitude (A), sonication time (t), the portion of coke wastewater in the treated mixture: 5% coke wastewater (CW), 10% CW, and 20% CW, and whether the process carried out in the reactor was assisted with the ultrasonic field-SBR + UD or the non-aided ultrasonic field-SBR). Levene’s test was used to check the homogeneity of variance. The null hypothesis in Levene’s test was that the variances in the different groups were homogeneous (the same). Levene’s test proved significant and the homogeneity of variance hypothesis was rejected. In this situation, Tukey’s post hoc test was performed. The adopted alpha significance level was 0.05. The value bars in the figures marked with the same letter (a–k) are not statistically significant (no statistically significant difference).

3. Results and Discussion

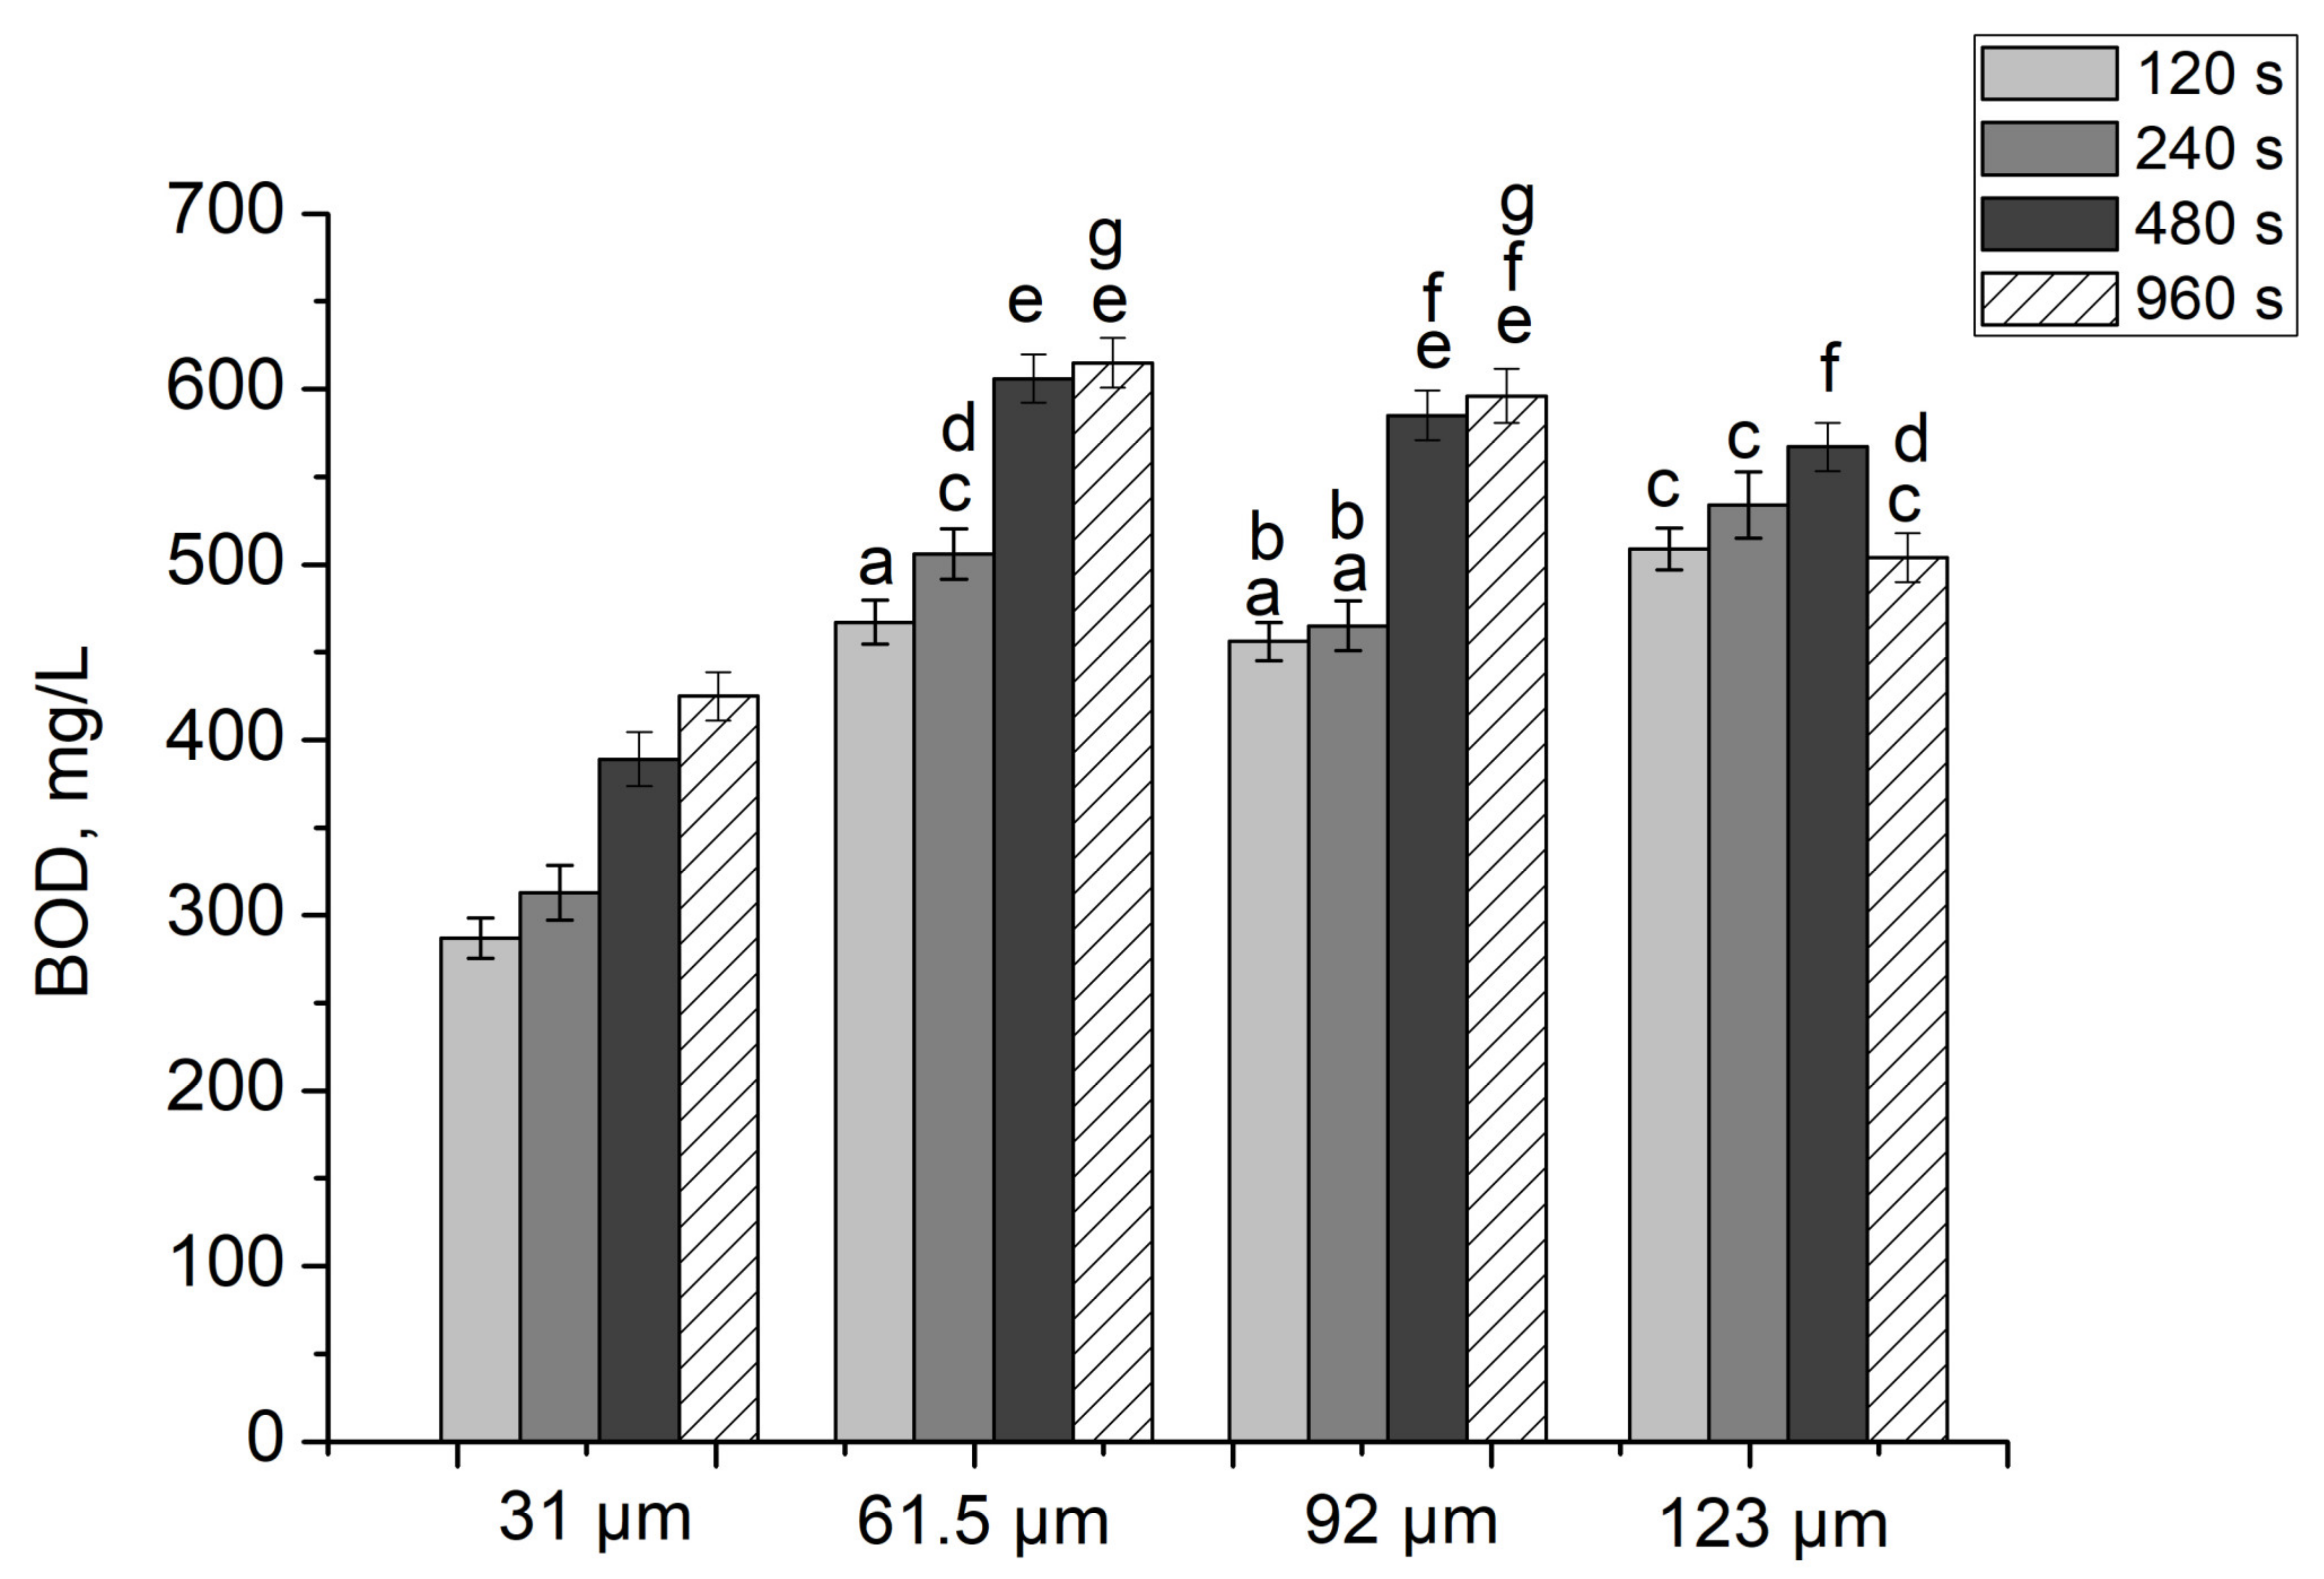
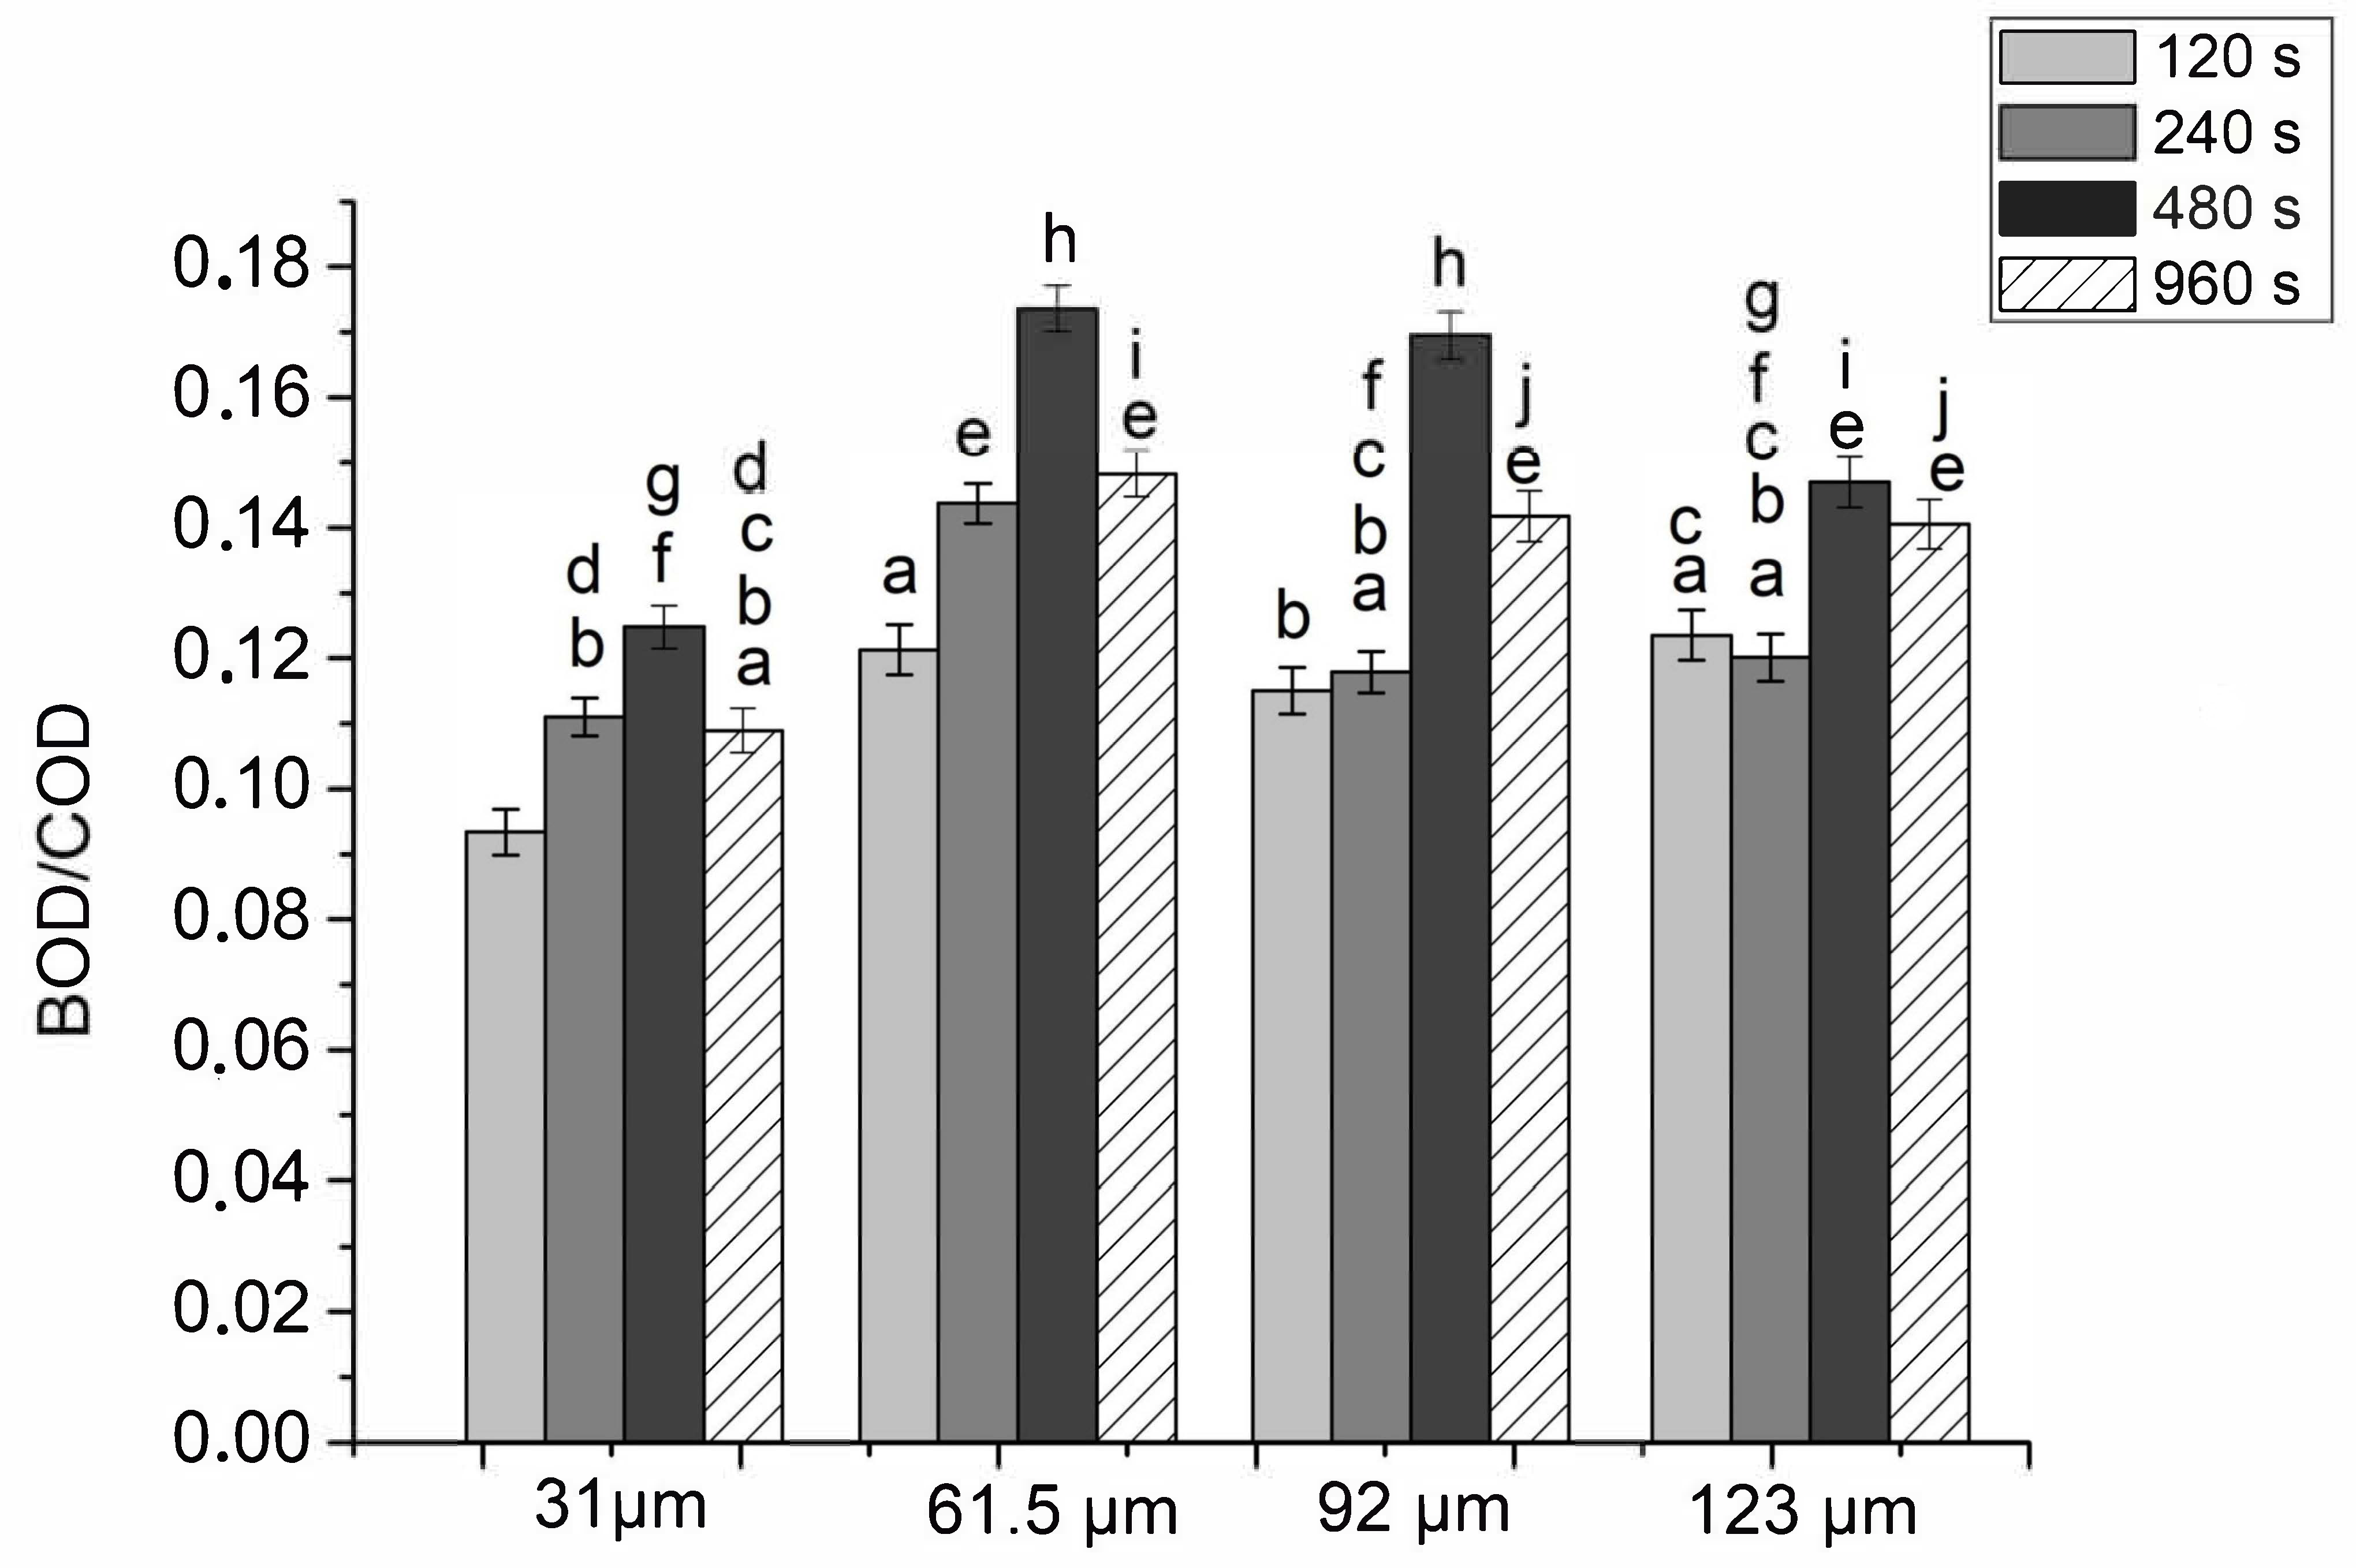
3.1. Ultrasound of Coke Wastewater—Selection of Amplitude and Sonication Time

Changes in the acoustic energy value depending on the applied sonication times and oscillation amplitudes are shown in Table 2. The sonication energy values were read from the device. According to the source literature [47,48], the application of an ultrasonic technique requires the optimization of the operating parameters, such as frequency, oscillation amplitude, wave intensity, acoustic energy, and interaction duration. The capacity and geometry of the tank where the process takes place are also an important element of optimizing sonication conditions.
The sonication process is also described through its intensity. This reliable parameter determines the amount of energy carried by an acoustic wave that reaches the medium surface, perpendicular to the wave propagation direction [49,50]. It is assumed that in order for cavitation to occur in a liquid medium, an ultrasonic wave intensity must reach at least 1.0 W/cm2. Table 3 lists the acoustic wave intensities depending on the applied sonication time and amplitude. It was concluded that only when the coke wastewater was sonicated at an amplitude of 31 μm and a longer exposure time, i.e., 8 min (0.67 W/cm2) and 16 min (0.76 W/cm2), was the ultrasonic wave intensity lower than the theoretic cavitation inducing threshold. The highest ultrasonic wave intensity (11.86 W/cm2) was observed during a 4 min sonication at an amplitude of 123 μm.
The most favorable sonication parameters were selected based on the BOD5/COD quotient. The direct outcome of an ultrasonic field acting on coke wastewater is the hydrolysis of compounds and an increase in organic substances, expressed in the form of COD and BOD5 (Figure 2 and Figure 3). On the basis of the conducted analysis, an increase in the value of COD in the coke wastewater corresponding to the increasing oscillation amplitude and sonication time was observed. The maximum values were achieved for an amplitude of 123 µm and an exposure time of 240 s. Further conditioning did not result in a significant COD value increase. A similar trend was observed for the BOD5 indicator. The studies conducted by Ning et al. [50] show that the application of ultrasonic disintegration in coke wastewater, as a process of preliminary processing, not only decomposes various organic compounds, but also results in an increasing percentage of easily biodegradable organic substances in the subsequent treatment processes. As shown earlier, studies were carried out in which landfill leachate was used as a substrate. In these studies, the sonication process clearly affects the violation of the chemical structure of organic compounds contained in them. The -CH2 and -CH3 groups were released, probably from humic compounds or aromatic compounds. The formation of a significant amount of compounds with the -OH functional group was also observed, which could be derivatives of alcohols or carboxylic acids. It was also found that it was likely to generate compounds with a chemical structure more susceptible to the biodegradation process—an increase in the BOD/COD ratio [51].
It is worth noting, however, that during the ultrasonic treatment of industrial wastewater, a number of chemical compounds occur, which differ in physico-chemical nature or the number of bonds, and their influence on the biocenosis of activated sludge is still unknown. It turns out that despite the increase in the BOD/COD ratio, which indicates an improvement in their biodegradability, this treatment is not significantly more effective. It is suspected that the sonification of coke wastewater results in the release/formation of compounds with potentially toxic/inhibitory effects on activated sludge bacteria. The solution to this problem may be the selection of the SBR reactor operating parameters, i.e., sludge concentration, duration of the reaction phase, sludge age, and ultrasonic field parameters such as its intensity.
Ultrasonic disintegration impacts structural changes in the organic compounds of coke wastewater and leads to the increase in their biodegradability, facilitating their subsequent treatment in the SBR [52]. The BOD5/COD quotient for all applied combinations was below 0.2 (Figure 4), indicating very low susceptibility to biochemical decomposition of the compounds. The highest quotient value of 0.17 was achieved at an amplitude of 61.5 µm and sonication time of 480 s, with the aforementioned sonication parameters applied in the second stage of the tests.
The results of the statistical analysis concerning the influence of the ultrasonic field on the change in the coke wastewater characteristics showed that the effects obtained during the sonication of the wastewater at higher amplitudes (91 µm and 123 µm) are similar to the effects obtained at the amplitude of 61.5 µm. The analysis led to the conclusion that the change in the COD index during the sonication of wastewater at the lowest of the applied amplitudes (31 µm) and the longest time (960 s) was statistically comparable to the value obtained with the amplitude of 123 µm and the time of 480 s. The increase in the BOD index for the amplitude of 61.5 µm and longer exposure times (480 s and 960 s) did not show significant statistical differences in comparison to the 92 µm amplitude and the same sonication times. The highest increase in the BOD/COD ratio was recorded at the amplitudes of 61.5 µm and 92 µm and the same exposure time (480 s). It was observed that the changes in the BOD/COD ratio did not show significant differences when the wastewater was sonicated at an amplitude of 31 µm and a time of 960 s, or 91 µm and 123 µm at a time of 240 s. In Figure 2, Figure 3 and Figure 4, the symbols a–j indicate the samples showing no significant statistical differences.

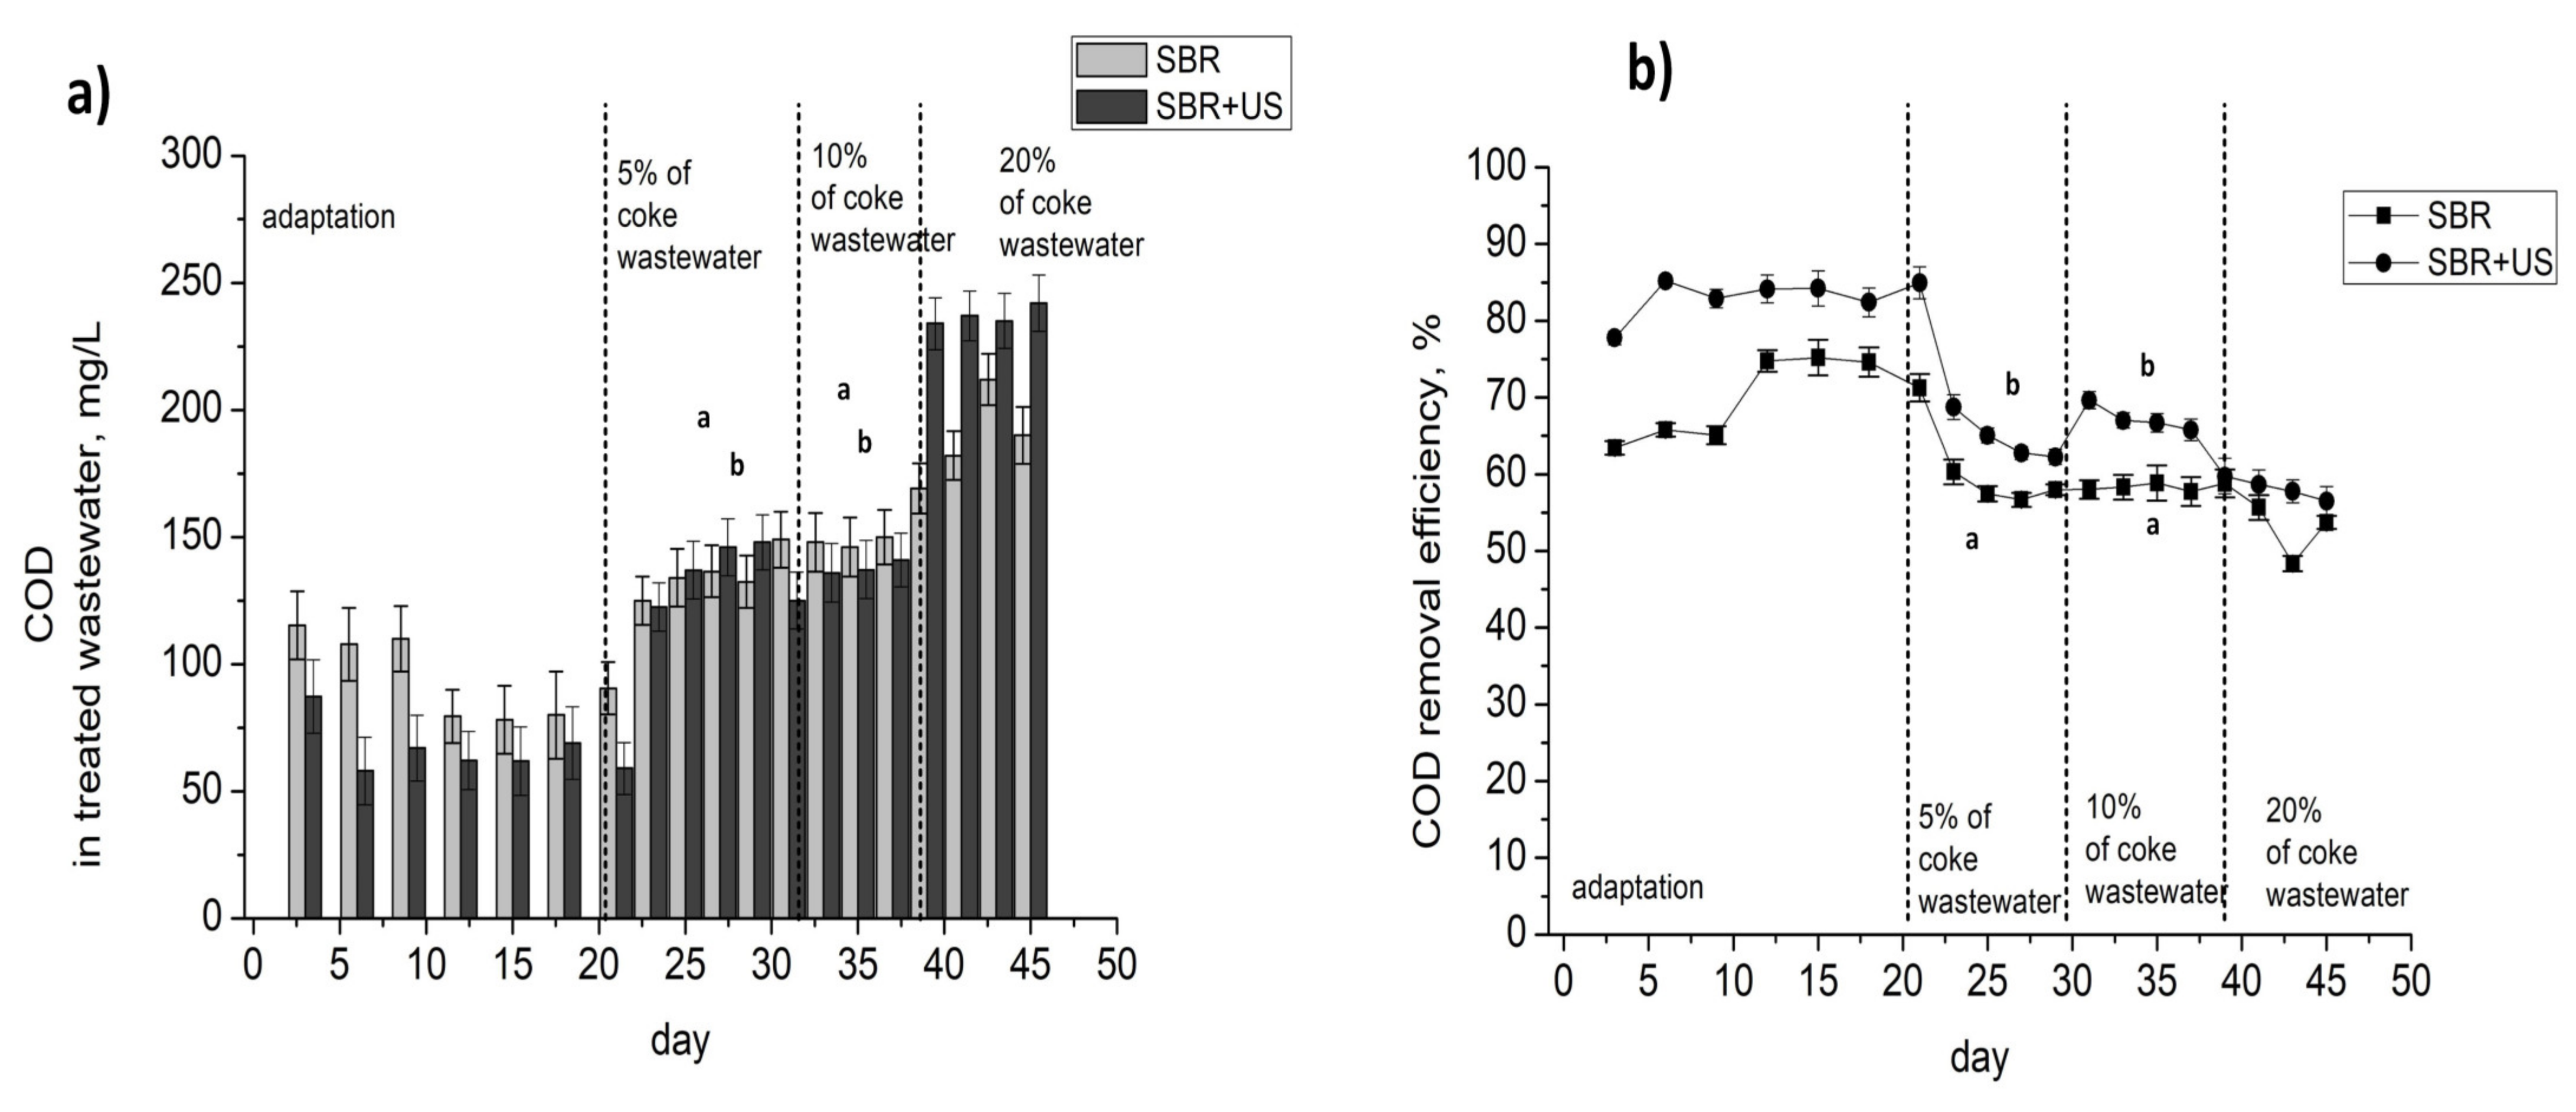
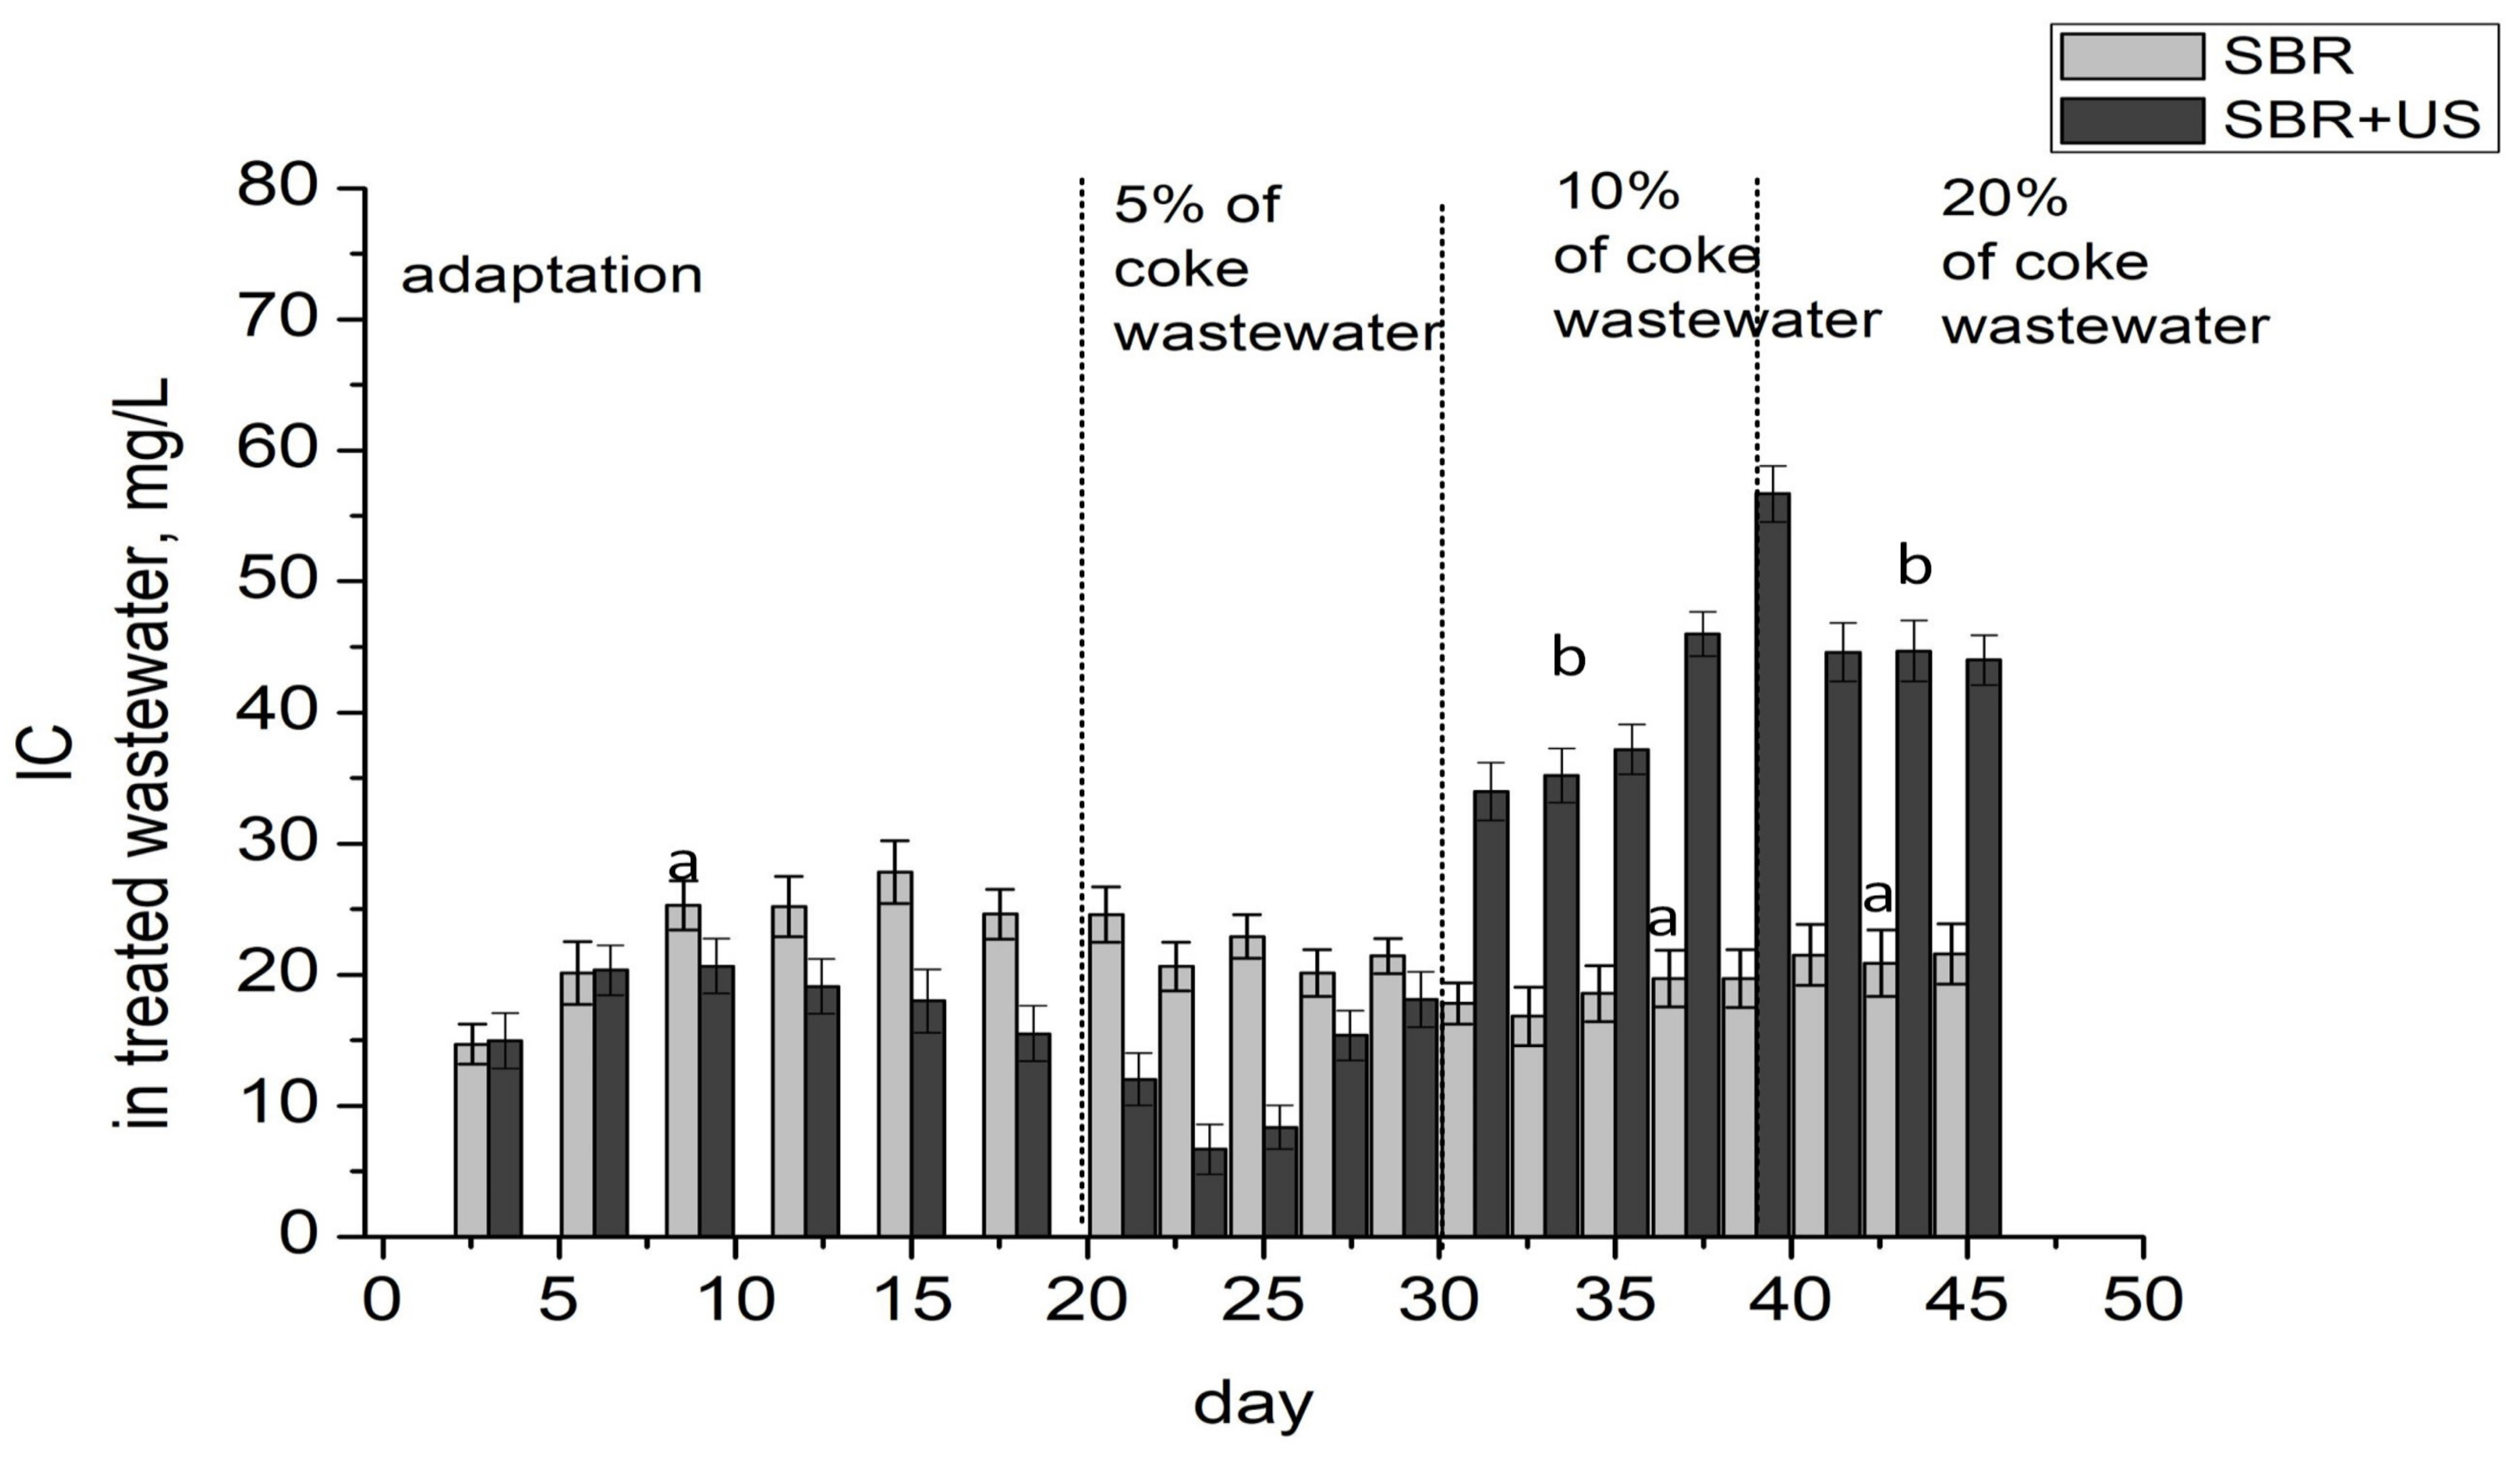
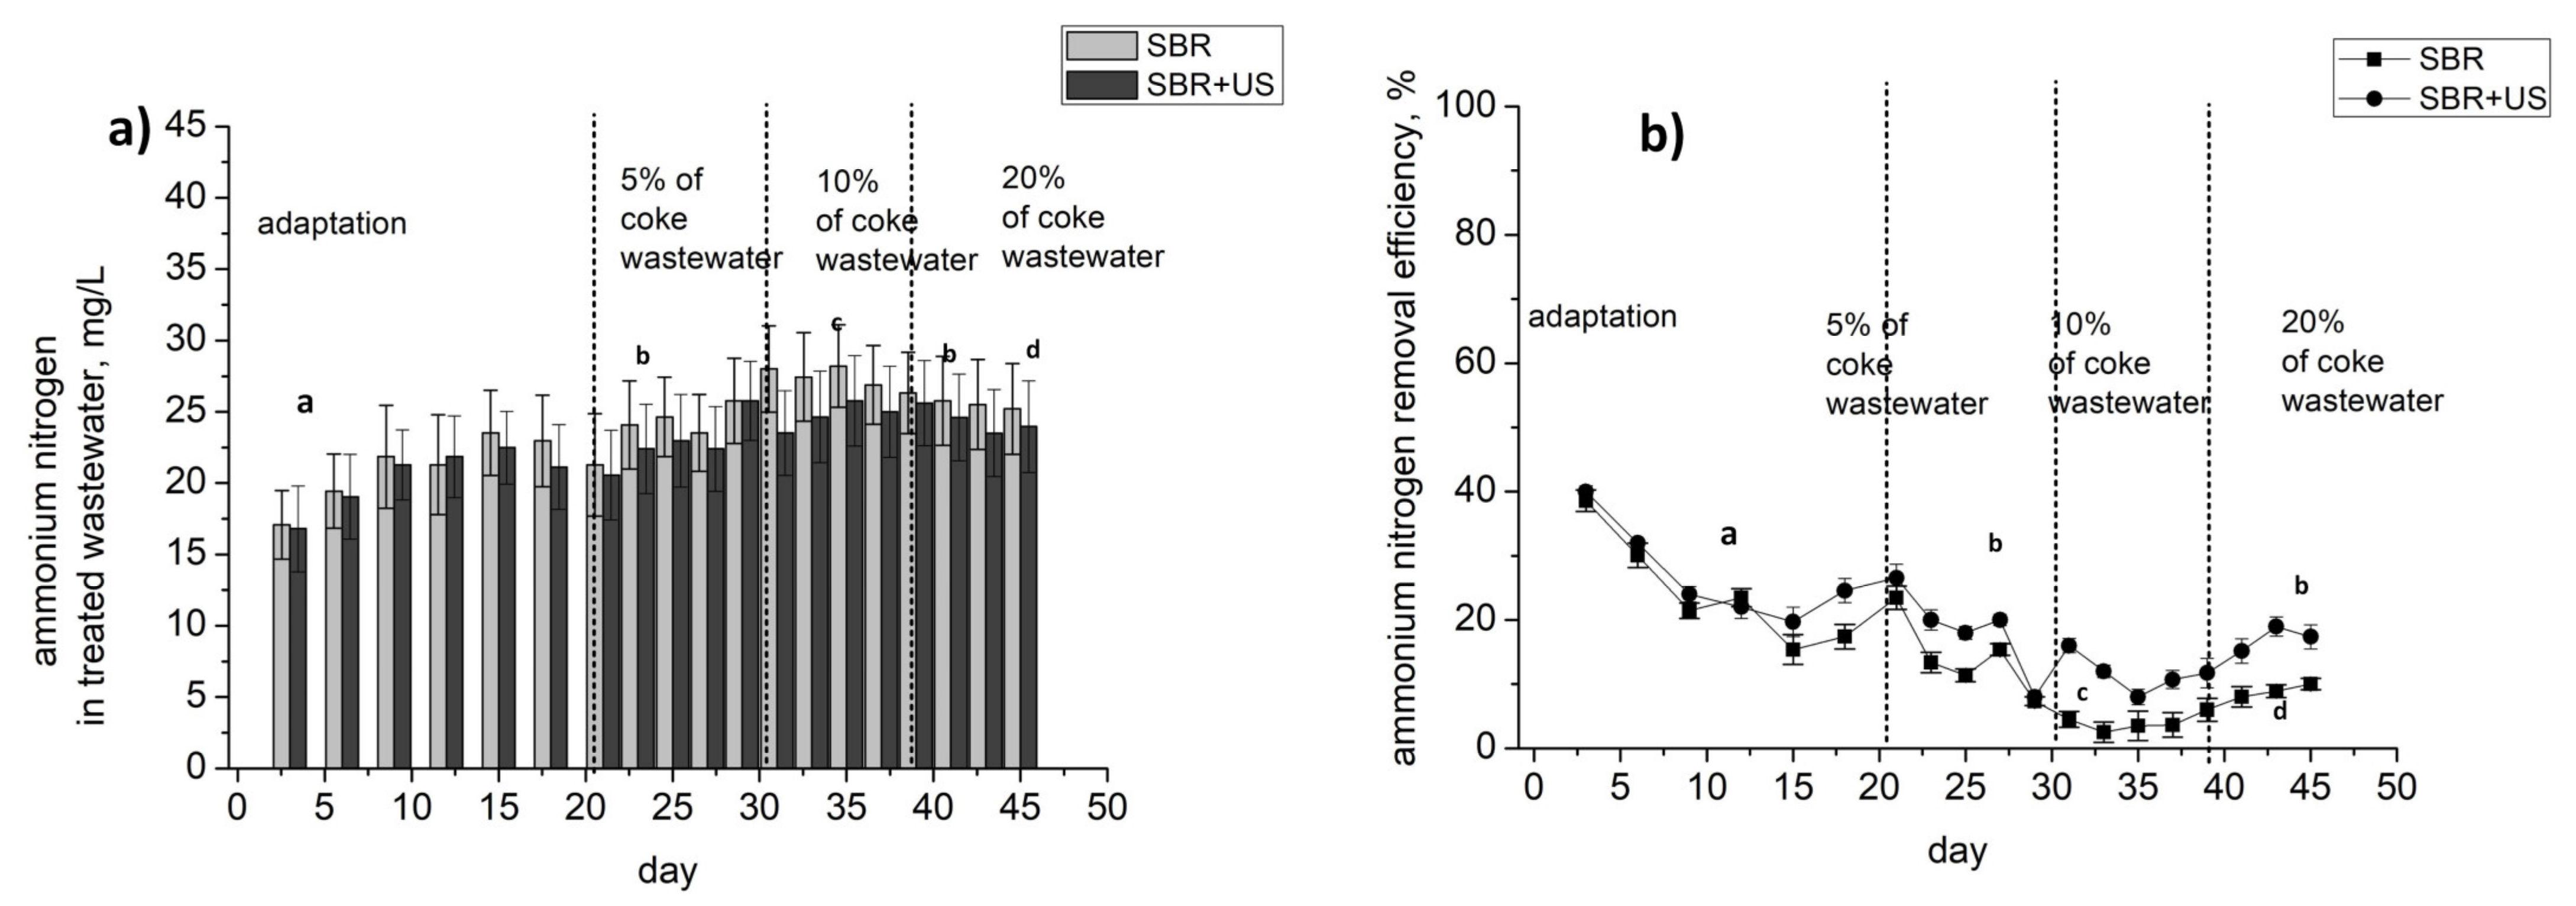
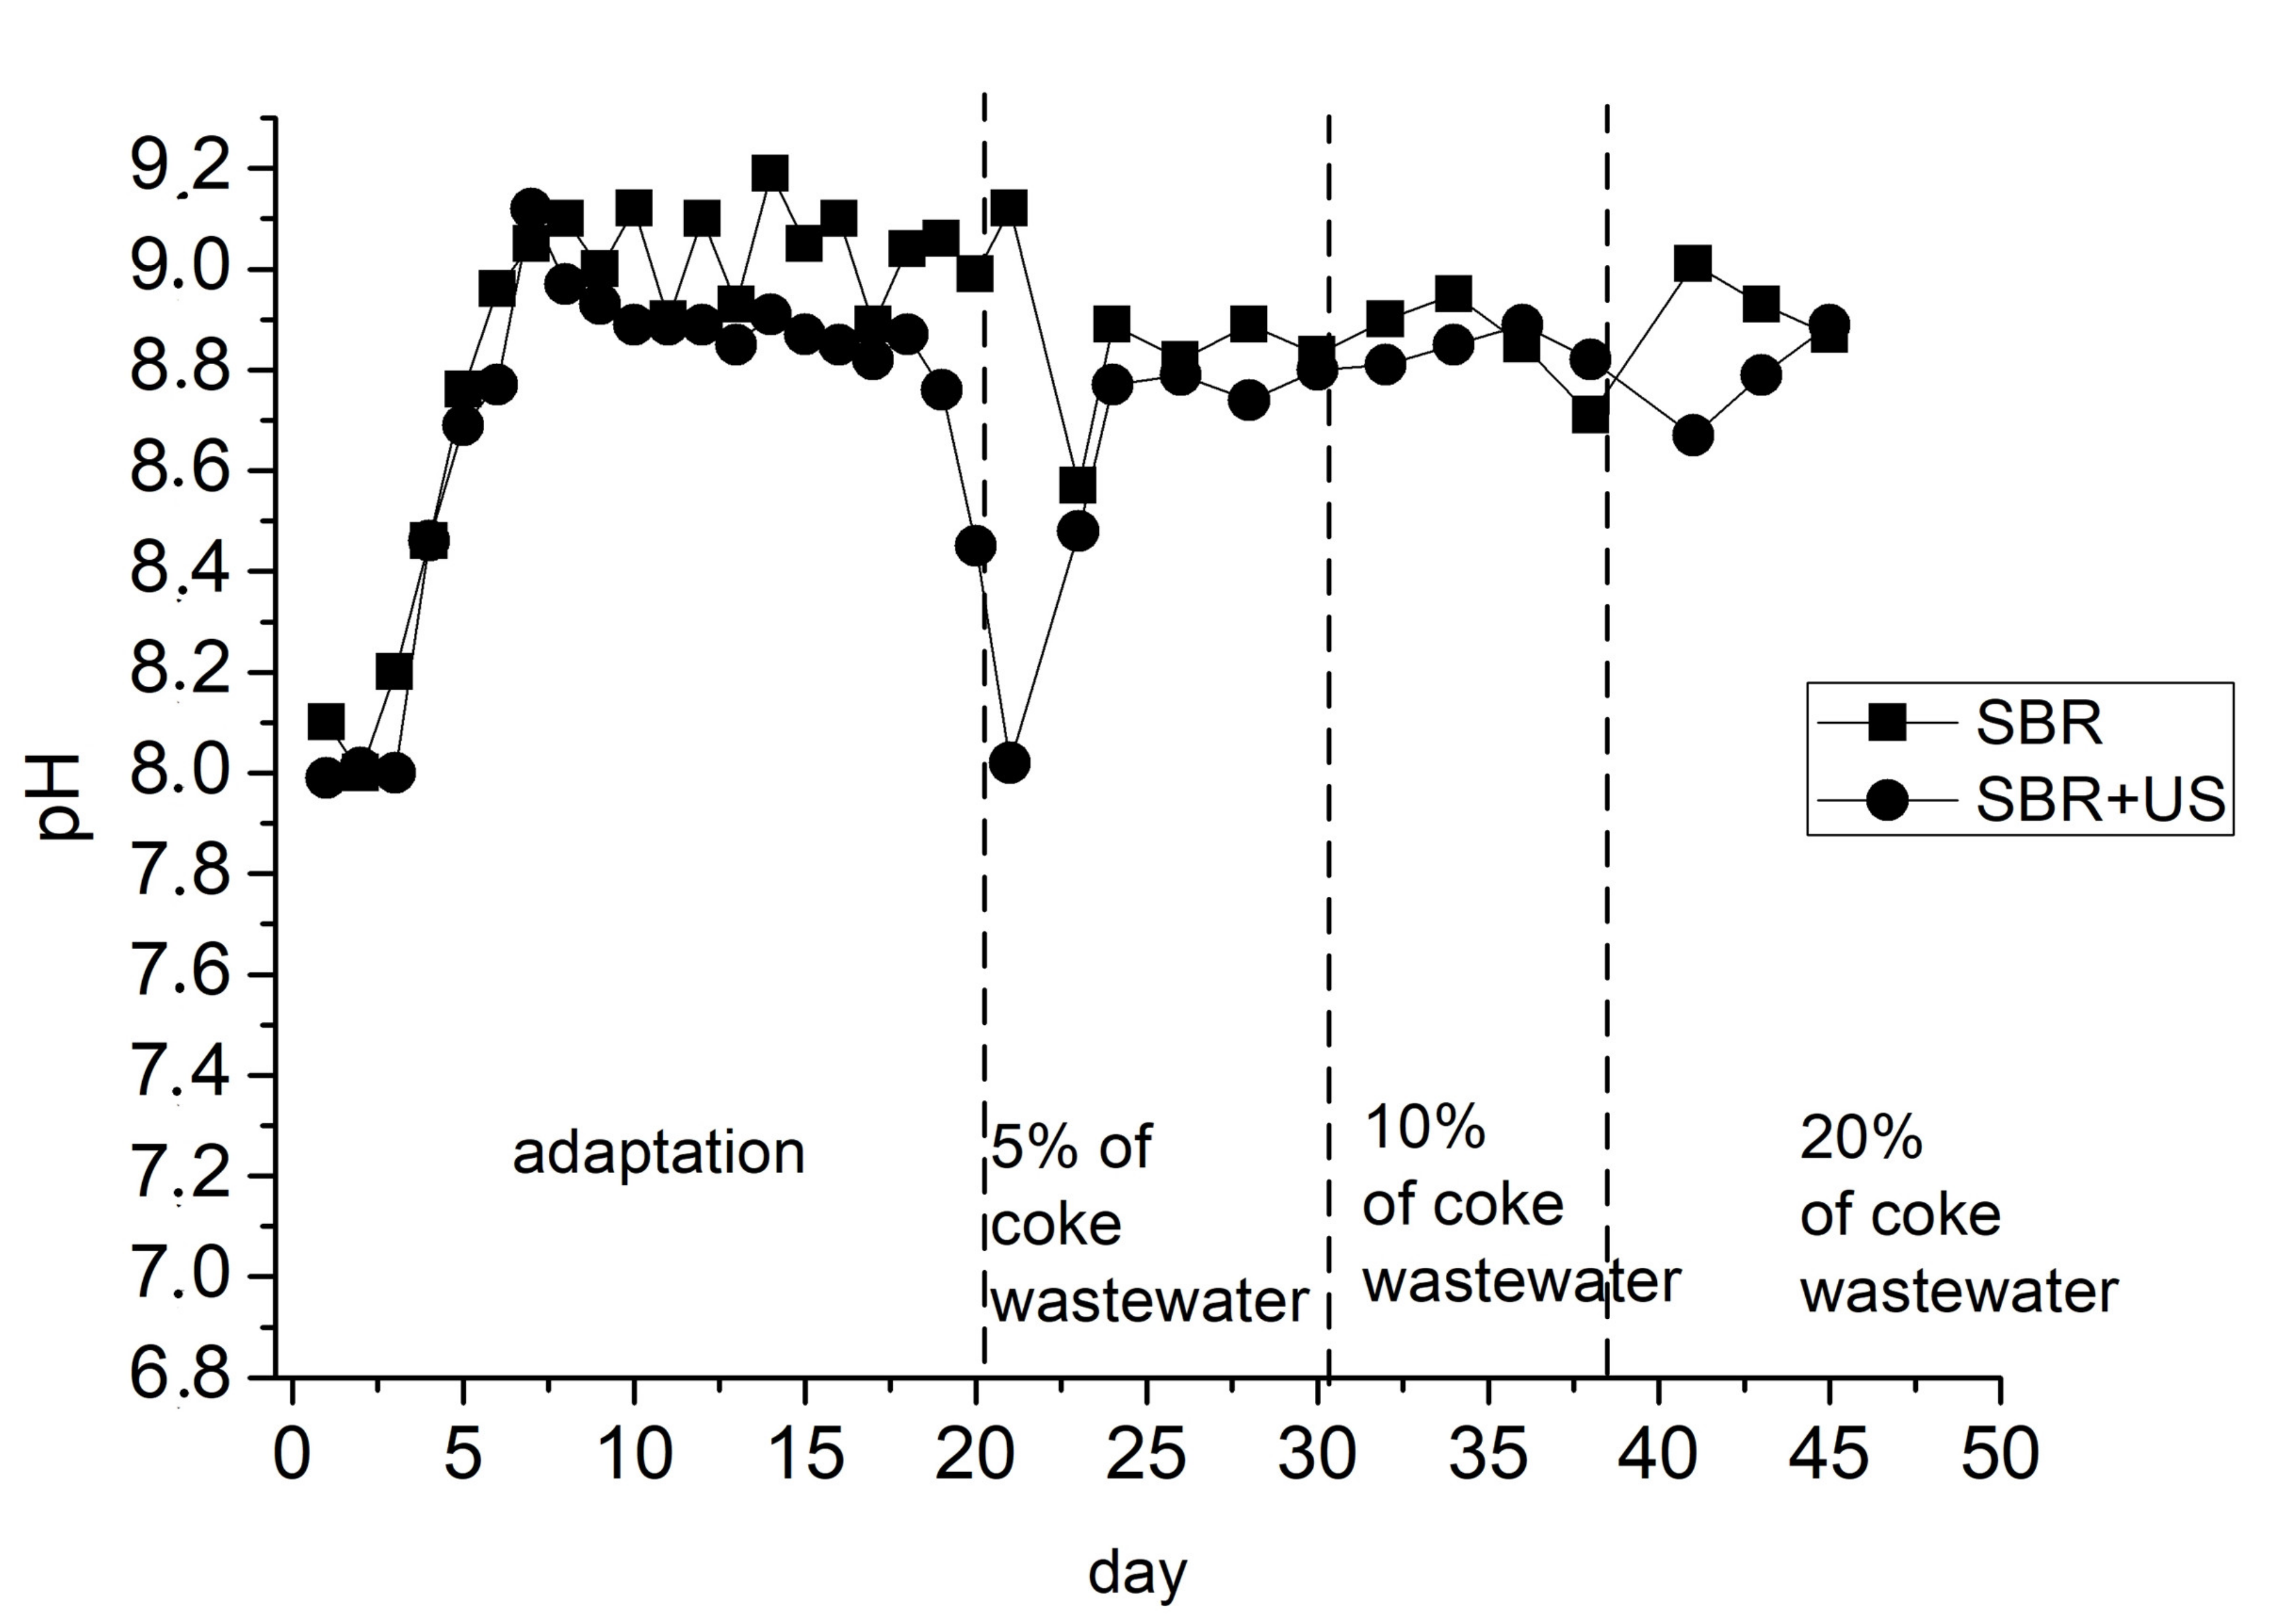
3.2. Wastewater Treatment in the SBR

Table 5 shows the pollution load during bioreactor operation in the case of the applied mixtures, with increasing percentages of coke wastewater and applied ultrasonic field. The wastewater pollution load increased proportionally to the amount of coke wastewater in the mixture—from 0.15 g O2/d for a 5% proportion to 0.205 g O2/d for a 20% proportion. Coke wastewater sonication resulted in an increased pollution load in wastewater from 0.196 g O2/d for a 5% proportion to 0.2785 g O2/d for a 20% proportion. A similar trend to that of pollution load was observed for COD in the studied combinations. The highest values were recorded for a 20% proportion of coke wastewater and a 20% proportion of sonicated coke wastewater, for which the COD was 410.5 mg/L and 556.5 mg/L, respectively (Table 6).
The TOC and TN concentration values increased along with the increasing coke wastewater content in the mixture, from 42.53 mg C/L; 83.86 mg N/L for a 5% proportion, to 179.65 mg C/L; 352.4 mg N/L for a 20% proportion. Coke wastewater sonication did not impact the concentration of the discussed parameters. N-NH4+ concentration stayed at a similar level for all the studied combinations (27.8–29.0 mg/L). Similarly, the pH varied in the range of 7.592–7.697. Inorganic carbon (IC) concentration was at a low level for the 5% and 10% additions of coke wastewater in the mixture. This was also the case after ultrasound (10.48–19.84 mg C/L), with a significant increase in this parameter observed for the 20% proportion of coke wastewater in the mixture (220.01 ÷ 223.27 mg C/L). The characteristics of the applied test mixtures are shown in Table 6. Along with the increasing addition of raw coke wastewater, as well as the initially ultrasonic wastewater, the size of activated sludge flocs increased (>500 µm) and their structure became looser. The species composition of activated sludge microorganisms also deteriorated (the quantity of filamentous bacteria increased at the expense of free-flowing and sedentary ciliates). The activated sludge exhibited slowly swelling behavior.
COD concentration in the course of the experiment ranged from 51 to 240 mg/L (Figure 5). The course of COD changes was similar for all the mixtures. An increase in the parameter in question after preliminary disintegration of coke wastewater could be observed in the last stage of the study at a 20% addition of coke wastewater. A 20% addition of coke wastewater resulted in a significant increase in COD concentration; in the case of the 5% and 10% additions, the COD value remained at a similar level. The use of the ultrasonic field improved the degree of COD removal by approximately 10% compared to the coke wastewater in SBR. The degree of COD removal for the mixture without sonication was constant, amounting to approximately 55%, regardless of the percentage of coke wastewater throughout the experiment. In the case of the mixture after sonication, the degree of COD removal was approximately 10% higher than that of the control. Only an increase in the content of coke wastewater to 20% after ultrasound (US) resulted in a decrease in the degree of COD removal. This may be because the pollutant load increases too much over time. The reasons for this could be that the sludge load became highly activated over a short period of time, and the increasing amount of coke wastewater in the mixture from 10% to 20% prevented gradual adaptation of microorganisms to the increasing pollutant loads. In his studies, Ning et al. [50] concluded that the application a combination of ultrasonic irradiation and catalytic oxidation prior to biological treatment can improve biodegradation by up to 63.49%, as compared to the biodegradation effect when using only a biological treatment through activated sludge, for which the COD degradation value was 32.25%. The use of only one method of disintegration is much less effective than combined methods, e.g., when using only ultrasonic disintegration, the improvement of the COD degradation efficiency increased by 48.29–80.54% [52].
Changes in TOC concentration and their removal rates for the studied mixtures in the second stage of the tests are shown in Figure 6. On the basis of the results, it can be concluded that the course of TOC concentration changes and TOC removal rates during SBR treatment were similar for the studied mixtures. The TOC removal rate was approximately 85% for both mixtures. The much higher TOC values in the wastewater after sonication did not disturb the process, although the course of the removal rate varied with time.
The inorganic carbon (IC) removal rate after the application of coke wastewater sonication was approximately 10% lower than that of the mixture without US (Figure 7). As a result of the hydrolysis of compounds after sonication and purification in SBR, a significant increase in IC was observed, which may indicate the degradation of organic compounds and the formation of other inorganic forms. The increasing proportion of coke wastewater in the mixture strengthened this effect. When analyzing the literature, the IC parameter is generally not tested during sewage treatment. The analyses only concern organic substances, such as COD, TOC, and BOD, the loss of which is used to demonstrate the effectiveness of the process.
The course of ammoniacal nitrogen changes within the process was similar for the COD and TOC. The N-NH4+ removal rate for the mixture with sonicated wastewater was approximately 19%, and was higher by ca. 10% than for the mixture without US, in which it was 9% at the end of the process (Figure 8). According to Keller [53], and Chakraborty and Veeramani [54], in order to achieve a lower ammonium concentration and a higher ammoniacal nitrogen removal rate, the subsequent phases in the SBR should be optimized, especially the wastewater retention time. A TN removal rate of approximately 90% was obtained for the tested mixtures.
Ultrasonic field conditioning did not significantly improve this parameter. The course of TN concentration changes is shown in Figure 9. Furthermore, in the case of pH values, no significant differences were recorded for the tested mixtures. The pH value remained in the range of 8.0–9.2 through the course of the process. According to data from the literature, the pollution biodegradation process is most effective when the pH is 8.5, demonstrating a TOC removal rate of 34%; an increase in pH to a value of 11 may result in the pollutant removal rate decreasing to 29% [55].
The results of the statistical analyses concerning the treatment efficiency of variable proportions coke wastewater in the SBR reactor in the pre-conditioned ultrasonic field (SBR + UD) as compared to the non-conditioned (SBR) state are as follows: the values of COD and TOC wastewater treated with a 5% addition of coke wastewater (SBR-5% CW) showed no statistical differences as compared to the 5% and 10% additions of pre-conditioned sewage in the ultrasonic field (SBR + 5% CW + UD and SBR + 10% CW + UD). In the case of ammonium nitrogen, the samples demonstrating no significant statistical differences are as follows: the SBR-5% CW sample and the SBR-5% CW + UD and SBR-20% CW samples (b); and the SBR-10% CW + UD sample and the SBR-20% CW and SBR-20% CW + UD samples (c). In Figure 5, Figure 6, Figure 7, Figure 8, Figure 9 and Figure 10, the symbols a–d indicate samples that do not demonstrate significant statistical differences.

4. Conclusions

The authors of this paper studied the impact of an ultrasonic field on the efficiency of coke wastewater treatment. The application of preliminary disintegration of coke wastewater using an ultrasonic field resulted in the growth of organic substances as indicated by COD and BOD5. A direct effect of coke wastewater exposure to an ultrasonic field was the hydrolysis of compounds and their improved biodegradability. On the basis of the conducted analysis, an increase in the value of COD in coke wastewater along with increasing oscillation amplitude and sonication time was observed. On the basis of the BOD/COD ratio, it was found that the most favorable parameters are an amplitude of 61.5 µm and an exposure time of 480 s, which were applied in the second stage of the study.
Treating wastewater after preliminary disintegration in an SBR resulted in an improvement in the degree of removal for most of the parameters tested. The efficiency of the treatment improved by approximately 10% after the initial sonication of the coke wastewater. The removal efficiency of the examined parameters decreased slightly with the increase in the proportion of coke wastewater in the mixture. However, regardless of the coke wastewater ratio (% v/v), the treatment efficiency was higher for the sonicated mixture as compared to the control. Thus, pre-treatment of coke wastewater prior to treatment in an SBR reduces the negative impact of coke wastewater on the degree of removal for the parameters tested. Co-purification of coke wastewater with no negative impact on the efficiency of pollutant removal is possible, but with a small addition of coke wastewater, i.e., up to 10% (v/v). However, as shown by the results obtained, the introduction of pre-treatment of coke wastewater before biological treatment may lead to a 20% increase in the volume of coke wastewater in the stream of treated wastewater.
It was observed that the key factor impacting the effectiveness of pollutant removal was a gradually increasing pollutant load. Additional studies in this respect are planned in the future. HRT is another crucial element for improving treatment efficiency, with the duration of individual phases needing to be optimized depending on the load, which in this case was coke wastewater in the mixture. As a result of the large unevenness of the sewage inflow and fluctuations in the pollutant load, it is very important to properly determine the operating parameters, including the amount and frequency of the air supply. The duration of the individual phases in the cycle should also be optimized.

Author Contributions

Conceptualization, A.K.-K. and M.W.; methodology, A.K.-K.; software, A.K.-K., M.W.; validation, A.K.-K.; formal analysis, M.W.; investigation, M.W.; resources, A.K.-K.; data curation, A.K.-K.; writing—original draft preparation, M.W.; writing—review and editing, M.W.; visualization, A.K.-K.; supervision, M.W.; project administration, M.W.; funding acquisition, A.K.-K. and M.W. All authors have read and agreed to the published version of the manuscript.

Funding

The study was carried out in the framework of the statutory funds for research, financed by the Ministry of Science and Higher Education. The research was funded by the project No. BS/PB- 400/301/21.

Institutional Review Board Statement

Not applicable.

Informed Consent Statement

Not applicable.

Data Availability Statement

Data sharing not applicable.

Conflicts of Interest

The authors declare no conflict of interest. The funders had no role in the design of the study; in the collection, analyses, or interpretation of data; in the writing of the manuscript, or in the decision to publish the results.

References

  1. Valia, H.S. Coke Production for Blask Furnace Ironmaking. American Iron and Steel Institute. Available online: http://www.steel.org/making-steel/how-its-made/processes/processes-info/coke-production-for-blastfurnace-ironmak-ing.aspx (accessed on 11 January 2021).
  2. Metallurgical Coke Market Outlook. CRU. 2015. Available online: https://www.crugroup.com/analysis/coal/ (accessed on 11 January 2021).
  3. Research Report on China’s Coke Industry 2010–2019. Research and Market. Available online: http://www.researchandmarkets.com/research/6998gk/research_report (accessed on 11 January 2021).
  4. Żarczyński, P.; Sikorski, C.; Strugała, A. Defining strategic directions of technological development coking plants in Poland based on the forecast of the raw material base and the expectations of coke customers. Energy Policy 2012, 15, 269–283. Available online: https://meeri.eu/Wydawnictwa/PE154/4-20-zarczynski-i-in.pdf.
  5. Li, Y.; Gu, G.; Zhao, J.; Yu, H.-Q.; Qiu, Y.; Peng, Y. Treatment of coke-plant wastewater by biofilm systems for removal of organic compounds and nitrogen. Chemosphere 2003, 52, 997–1005. [Google Scholar] [CrossRef]
  6. Staib, C. Understanding and Modelling the Dynamics of Aerobic Biodegradation of Coke-Oven Wastewater. Ph.D. Thesis, University of Queensland, Brisbane, Australia, 1998. [Google Scholar]
  7. Vázquez, I.; Rodríguez, J.; Marañón, E.; Castrillón, L.; Fernández, Y. Simultaneous removal of phenol, ammonium and thiocyanate from coke wastewater by aerobic biodegradation. J. Hazard. Mater. 2006, 137, 1773–1780. [Google Scholar] [CrossRef] [PubMed]
  8. Vázquez, I.; Rodriguez, J.; Maranon, E.; Castrillón, L.; Fernández-Nava, Y. Study of the aerobic biodegradation of coke wastewater in a two and three-step activated sludge process. J. Hazard. Mater. 2006, 137, 1681–1688. [Google Scholar] [CrossRef] [Green Version]
  9. Ghose, M. Complete physico-chemical treatment for coke plant effluents. Water Res. 2002, 36, 1127–1134. [Google Scholar] [CrossRef]
  10. Fan, Y.; Wang, R.; Sun, J.; Xiang, J.; Wang, R.; Sun, H. An effective recycle way of waste coke ash and coking wastewater for preparing coke ash coking wastewater slurry. Sci. Total Environ. 2020, 742, 140581. [Google Scholar] [CrossRef]
  11. Raper, E.; Stephenson, T.; Simões, F.; Fisher, R.; Anderson, D.; Soares, A. Enhancing the removal of pollutants from coke wastewater by bioaugmentation: A scoping study. J. Chem. Technol. Biotechnol. 2018, 93, 2535–2543. [Google Scholar] [CrossRef] [Green Version]
  12. Wang, R.; Ma, Q.; Zhao, Z.; Ye, X.; Jin, Q.; Zhao, Z.; Liu, J. Adsorption of Surfactants on Coal Surfaces in the Coking Wastewater Environment: Kinetics and Effects on the Slurrying Properties of Coking Wastewater–Coal Slurry. Ind. Eng. Chem. Res. 2019, 58, 12825–12834. [Google Scholar] [CrossRef]
  13. Geng, Y.; Bai, J.; Liu, Y.; Zhong, X.; Li, C.; Zhang, Z.; Zhang, Y. Catalysis and degradation of phenol in coking wastewater during low-rank coal coke gasification. React. Chem. Eng. 2020, 1–14. [Google Scholar] [CrossRef]
  14. Villaverde, S.; García, E.M.L.; Fernández-Polanco, F. New operational strategy for SBR technology for total nitrogen removal from industrial wastewaters highly loaded with nitrogen. Water Sci. Technol. 2000, 41, 85–93. [Google Scholar] [CrossRef]
  15. Yalmaz, G.; Öztürk, I. Biological ammonia removal from anaerobically pre-treated landfill leachate in sequencing batch reactors (SBR). Water Sci. Technol. 2001, 43, 307–314. [Google Scholar] [CrossRef]
  16. Wisaam, S.; Wei, Q.W. Review on Sequencing Batch Reactors, Pakistan. J. Nutr. 2007, 6, 11–19. [Google Scholar]
  17. Marañón, E.; Vázquez, I.; Rodríguez, J.; Castrillón, L.; Fernández, Y.; López, H. Treatment of coke wastewater in a sequential batch reactor (SBR) at pilot plant scale. Bioresour. Technol. 2008, 99, 4192–4198. [Google Scholar] [CrossRef]
  18. Krzywicka, A.; Kwarciak-Kozłowska, A. Advanced oxidation processes with coke plant wastewater treatment. Water Sci. Technol. 2014, 69, 1875–1878. [Google Scholar] [CrossRef]
  19. Kwarciak-Kozłowska, A.; Krzywicka, A.; Gałwa-Widera, M. Fenton process supported with ultrasonic field in coke wastewater treatment. Chem. Ind. 2016, 94, 1527–1529. [Google Scholar]
  20. Richards, W.T.; Loomis, A.L. The chemical effects of high frequency sound waves I. A preliminary survey. J. Am. Chem. Soc. 1927, 49, 3086–3100. [Google Scholar] [CrossRef]
  21. Kwarciak-Kozłowska, A.; Krzywicka, A. Effect of ultrasonic field to increase the biodegradability of coke processing wastewater. Arch. Waste Manag. Environ. Prot. 2015, 17, 133–142. [Google Scholar]
  22. Zhang, M.; Zhang, Z.; Liu, S.; Peng, Y.; Chen, J.; Ki, S.Y. Ultrasound-assisted electrochemical treatment for phenolic wastewater. Ultrason. Sonochemistry 2020, 65, 105058. [Google Scholar] [CrossRef] [PubMed]
  23. Dębowski, M.; Zieliński, M.; Kisielewska, M.; Kazimierowicz, J. Evaluation of Anaerobic Digestion of Dairy Wastewater in an Innovative Multi-Section Horizontal Flow Reactor. Energies 2020, 13, 2392. [Google Scholar] [CrossRef]
  24. Stępniak, L. The Use of an Ultrasonic Field to Support the Coagulation Process in Water Treatment; Monograph 112—Publishing House of the Częstochowa University of Technology: Czestochowa, Poland, 2005. [Google Scholar]
  25. Patel, V.K.; Sen, D.J.; Patel, H.U.; Patel, C.N. ChemInform Abstract: Sonochemistry: The Effect of Sonic Waves on Chemical Systems. ChemInform 2011, 42, 573–580. [Google Scholar] [CrossRef]
  26. Khanal, S.K.; Grewell, D.; Sung, S.; van Leeuwen, J. Ultrasound Applications in Wastewater Sludge Pretreatment: A Review. Crit. Rev. Environ. Sci. Technol. 2007, 37, 277–313. [Google Scholar] [CrossRef]
  27. Adewuyi, Y.G. Sonochemistry: Environmental Science and Engineering Applications. Ind. Eng. Chem. Res. 2001, 40, 4681–4715. [Google Scholar] [CrossRef]
  28. Tiehm, A.; Nickel, K.; Zellhorn, M.M.; Neis, U. Ultrasound waste activated sludge disintegration for improving anaerobic stabilization. Water Res. 2001, 35, 2003–2009. [Google Scholar] [CrossRef]
  29. Doosti, M.R.; Kargar, R.; Sayadi, M.H. Water treatment using ultrasonic assistance: A review. Proc. Int. Acad. Ecol. Environ. Sci. 2012, 2, 96–110. [Google Scholar]
  30. Borea, L.; Naddeo, V.; Shalaby, S.M.; Zarra, T.; Belgiorno, V.; Abdalla, H.; Shaban, A.M. Wastewater treatment by membrane ultrafiltration enhanced with ultrasound: Effect of membrane flux and ultrasonic frecuency. Ultrasonics 2017, 83, 42–47. [Google Scholar] [CrossRef] [PubMed]
  31. Changxiu, G.; Jianguo, J.; Deán, L. Ultrasound coupled with Fenton oxidation pretreatment of sludge to release organic carbon, nitrogen and phosphorus. Sci. Total Environ. 2015, 532, 495–500. [Google Scholar]
  32. Vázquez-López, M.; Amabilis-Sosa, L.E.; Moeller-Chávez, G.E.; Roé-Sosa, A.; Neumann, P.; Vidal, G. Evaluation of the ultrasound effect on treated municipal wastewater. Environ. Technol. 2018, 40, 3568–3577. [Google Scholar] [CrossRef]
  33. Suscha, J.; Grűbel, K.; Machnicka, A. Possibility to intensify the process of anaerobic digestion of sewage sludge by disintegrating the activated sludge in the process of mechanical cavitation. Gas Water Sanit. Technol. 2007, 3, 26–28. [Google Scholar]
  34. Gogate, P.R. Cavitation: An auxiliary technique in wastewater treatment schemes. Adv. Environ. Res. 2002, 6, 335–358. [Google Scholar] [CrossRef]
  35. Wolny, L.; Kamzela, T. Ultrasonic disintegration techniques in wastewater and sewage sludge technology. Ecol. Technol. 2003, 11, 3–7. [Google Scholar]
  36. Mamvura, T.A.; Iyuke, S.E.; Paterson, A.E. Energy changes during use of high-power ultrasound on food grade surfaces. South Afr. J. Chem. Eng. 2018, 25, 62–73. [Google Scholar] [CrossRef]
  37. Esfahani, M.R.; Azin, M. Pretreatment of sugarcane bagasse by ultrasound energy and dilute acid. Asia-Pacific J. Chem. Eng. 2011, 7, 274–278. [Google Scholar] [CrossRef]
  38. Worwąg, M.; Grosser, A.; Neczaj, E.; Kamizela, T. Impact of Ultrasonic Pretreatment on the Anaerobic Fermentation of Dairy Waste Activated Sludge. Annu. Set Environ. Prot. 2018, 20, 512–527. [Google Scholar]
  39. Ingole, N.W.; Khedkar, S.V. The ultrasound reactor technology-a technology for future. IJAERS 2012, 2, 72–75. [Google Scholar]
  40. Gedanken, A. Ultrasonic Processing to Produce Nanoparticles. In Encyclopedia of Materials: Science and Technology, 2nd ed.; Jürgen, B.K.H., Cahn, R.W., Flemings, M.C., Ilschner, B., Kramer, E.J., Mahajan, S., Eds.; Elsevier Ltd.: London, UK, 2001; pp. 9450–9456. [Google Scholar]
  41. Kootenaei, F.G.; Mehrdadi, N.; Rezazadeh, M.; Seyedmahalleh, E.S. Application of ultrasound waves for biodegradation of pollutants in wastewater and sludge dewatering. Interciencia 2015, 9, 6–9. [Google Scholar]
  42. Worwąg, M. Effect of sewage sludge sonication parameters on the content of organic compounds in the supernatant liquid. Desalination Water Treat. 2020, 199, 66–71. [Google Scholar] [CrossRef]
  43. Upadhyay, K.; Khandate, G. Ultrasound Assisted Oxidation Process for the Removal of Aromatic Contamination from Effluents: A Review. Univers. J. Environ. Res. Technol. 2012, 2, 458–464. [Google Scholar]
  44. Wydawnictwa Normalizacyjne. PN72/C-0455009, Determination of the efficiency of biochemical anionic oxidation and non-ionic synthetic surfactants by the activated sludge method under kinetic conditions; Wydawnictwa Normalizacyjne: Warszawa, Poland, 1972. (In Polish) [Google Scholar]
  45. Kamizela, T. The Use of Sonification for Phase Separation in the Thickening of Activated Sludge Suspensions. Monograph of the Częstochowa University of Technology No. 243; Częstochowa University of Technology: Czestochowa, Poland, 2012. [Google Scholar]
  46. APHA. Standard Methods for the Examination of Water and Wastewater, 20th ed.; American Public Health Association: Washington, DC, USA, 1999. [Google Scholar]
  47. Kidak, R.; Wilhelm, A.-M.; Delmas, H. Effect of process parameters on the energy requirement in ultrasonical treatment of waste sludge. Chem. Eng. Process. Process. Intensif. 2009, 48, 1346–1352. [Google Scholar] [CrossRef] [Green Version]
  48. Nanzai, B.; Okitsu, K.; Takenaka, N.; Bandow, H.; Tajima, N.; Maeda, Y. Effect of reaction vessel diameter on sonochemical efficiency and cavitation dynamics. Ultrason. Sonochemistry 2009, 16, 163–168. [Google Scholar] [CrossRef]
  49. Śliwiński, A. Ultrasound and Its Application; Scientific and Technical Publishing House: Warsaw, Poland, 1993. [Google Scholar]
  50. Ning, P.; Bart, H.-J.; Jiang, Y.; de Haan, A.; Tien, C. Treatment of organic pollutants in coke plant wastewater by the method of ultrasonic irradiation, catalytic oxidation and activated sludge. Sep. Purif. Technol. 2005, 41, 133–139. [Google Scholar] [CrossRef]
  51. Xu, J.; Jia, J.; Wang, J. Ultrasonic Decomposition of Ammonia-Nitrogen and Organic Compounds in Coke Plant Wastewater. J. Chin. Chem. Soc. 2005, 52, 59–65. [Google Scholar] [CrossRef]
  52. Kwarciak-Kozłowska, A.; Sławik-Dembiczak, L. Characterization of the Organic Fraction of Pretreated Leachate from Old Landfill after Sonication Exposure. Eng. Prot. Environ. 2016, 19, 561–575. [Google Scholar] [CrossRef]
  53. Keller, J.; Watts, S.; Battye-Smith, W.; Chong, R. Full-scale demonstration of biological nutrient removal in a single tank SBR process. Water Sci. Technol. 2001, 43, 355–362. [Google Scholar] [CrossRef] [PubMed]
  54. Chakraborty, S.; Veeramani, H. Anaerobic-anoxic-oxic sequential degradation of synthetic wastewaters. Appl. Biochem. Biotechnol. 2002, 102, 443–451. [Google Scholar] [CrossRef]
  55. Kwarciak-Kozłowska, A.; Krzywicka, A.; Gałwa-Widera, M. The use of ozonation process in coke wastewater treatment. Annu. Set Environ. Prot. 2016, 18, 61–73. [Google Scholar]
Figure 1. Test diagram.
Energies 14 00963 g001
Figure 2. The influence of sonication time and the magnitude of the vibration amplitude on the chemical oxygen demand (COD) value of coke wastewater (Statistical group a–i).
Energies 14 00963 g002
Figure 3. Effect of sonication time and the magnitude of the vibration amplitude on the BOD5 value of coke wastewater (Statistical group a–g).
Energies 14 00963 g003
Figure 4. The impact of sonication time and the magnitude of the vibration amplitude on the BOD5/COD ratio (Statistical group a–h).
Energies 14 00963 g004
Figure 5. COD changes during treatment in the sequencing batch reactor (SBR): (a) concentration; (b) removal efficiency (Statistical group a–b).
Energies 14 00963 g005
Figure 6. Total organic carbon (TOC) changes during treatment in the SBR: (a) concentration; (b) removal efficiency (Statistical group a–c).
Energies 14 00963 g006
Figure 7. Inorganic carbon (IC) changes during treatment in the SBR (Statistical group a–b).
Energies 14 00963 g007
Figure 8. N-NH4+ changes during treatment in the SBR: (a) concentration; (b) removal efficiency. (Statistical group a–d).
Energies 14 00963 g008
Figure 9. Total nitrogen (TN) changes during treatment in the SBR: (a) concentration; (b) removal efficiency (Statistical group a–b).
Energies 14 00963 g009
Figure 10. pH changes during treatment in the SBR.
Energies 14 00963 g010
Table 1. Values of individual coke wastewater pollution indicator.
Pollution IndicatorUnitCoke Wastewater (CW)Synthetic
Wastewater (SW)
Permissible Pollutant Values in Wastewater Discharged to a Consumer
pH-8.79–9.187.46.5–9
CODmg O2/L2450–2560380–395250
TOCmg C/L908–935228–24830
ICmg C/L230–24568.4–72.5-
TNmg N/L1600–167039.8–42.53
BOD5mg O2/L225–235296–298180
BOD5/COD-0.0960.78-
Table 2. Change in energy (Es) introduced into the sample depending on the applied amplitude and sonication time.
UD
Amplitude
t = 120 st = 240 st = 480 st = 960 s
A = 31.0 μmEs = 4410 JEs = 9500 JEs = 12470 JEs = 28405 J
A = 61.5 μmEs = 7530 J Es = 20047 JEs = 31860 JEs = 43560 J
A = 92.0 μmEs = 10729 JEs = 40551 JEs = 82340 JEs = 91056 J
A = 123.0 μmEs = 25120 JEs = 109567 JEs = 117658 JEs = 120438 J
Table 3. Change in the acoustic wave intensity (I) to the sample depending on the applied amplitude and sonication time.
UD
Amplitude
t = 120 st = 240 st = 480 st = 960 s
A = 31.0 μmI = 1.09 W/cm2I= 1.02 W/cm2I = 0.67 W/cm2I = 0.76 W/cm2
A = 61.5 μmI = 1.63 W/cm2I = 2.17 W/cm2I = 1.72W/cm2I = 1.18 W/cm2
A = 92.0 μmI = 2.32 W/cm2I= 4.39 W/cm2I = 4.46 W/cm2I = 2.46 W/cm2
A = 123.0 μmI = 5.44 W/cm2I= 11.86 W/cm2I = 6.37 W/cm2I = 3.26 W/cm2
Table 4. Duration of the individual reactor operation stage.
DayReactor AReactor B
1–21AdaptationAdaptation
22–295% addition of coke wastewater5% addition of coke wastewater after US
30–3710% addition of coke wastewater10% addition of coke wastewater after US
38–4520% addition of coke wastewater20% addition of coke wastewater after US
Table 5. Reactor’s operating parameters for individual percentage additions of coke wastewater.
Coke Wastewater Share [%]Wastewater Charge
[gO2/d]
Sludge Loading with Pollution Charge [mgO2/gsmo*d]
50.15 ± 0.010.032 ± 0.001
100.16 ± 0.0110.036 ± 0.001
200.205 ± 0.0120.044 ± 0.001
5US0.196 ± 0.030.042 ± 0.002
10US0.226 ± 0.0210.051 ± 0.001
20US0.2785 ± 0.0220.06 ± 0.001
Table 6. Characteristics of used test mixtures—synthetic wastewater (SW) with an addition of coke wastewater (CW) (5%, 10%, 20%) and ultrasound (US).
ParameterSW +
5% CW
SW +
5% CW-US
SW +
10% CW
SW +
10% CW-US
SW +
20% CW
SW +
20% CW-US
COD315 ± 5392 ± 11355 ± 8412 ± 8410.5 ± 11556.5 ± 9.1
TOC42.53 ± 1.243.95 ± 2.180.53 ± 2.182.54 ± 2.5179.65 ± 12.1181.9 ± 8.7
IC10.48 ± 0.510.76 ± 0.819.84 ± 0.7821.2 ± 1.1220.01 ± 14.6223.27 ± 12.5
TN83.86 ± 5.483.61 ± 4.1181.1 ± 11.2198.8 ± 14.4352.4 ± 8.9359 ± 9.4
N-NH4+27.8 ± 1.228.0 ± 1.127.9 ± 1.128.8 ± 3.728 ± 0.729.0 ± 1.2
pH7.592 ± 0.47.597 ± 0.47.67 ± 0.67.647 ± 0.77.693 ± 0.87.697 ± 0.5
Publisher’s Note: MDPI stays neutral with regard to jurisdictional claims in published maps and institutional affiliations.

