1. Introduction
Coronavirus disease 2019—COVID-19—is a contagious disease caused by the severe acute respiratory syndrome coronavirus 2—SARS-CoV-2. The rapid spread of COVID-19 led the World Health Organization to declare the disease a public health emergency of international concern on 30 January 2020 and classify it as a global pandemic on 11 March 2020 [
1,
2,
3]. The disease was first observed in China in December 2019, and it has spread fast worldwide [
4]. Since the beginning of the pandemic until 31 January 2021, about 103 million cases of COVID-19 have been reported worldwide, causing 2.23 million deaths [
5]. The novel coronavirus pandemic constitutes a massive global health crisis [
6,
7] that has quickly evolved into a global meltdown [
8,
9]. COVID-19 has hit the economies and humans on an unprecedented scale since the Great Depression (1929–1933) or the global financial crisis (2008–2009) and is epidemically compared to the Spanish flu pandemic of 1918 [
10,
11,
12].
Consequently, this fear has led to the national governments’ reactions worldwide, including social distancing measures, public awareness programs, testing and quarantining policies, and income support packages [
13,
14]. Cheng et al. [
15], investigating COVID-19 government response in mid-March 2020 through 24 May 2020, observe that governments worldwide implemented countless policies in reaction to the pandemic, i.e., over 13,000 such policy announcements across more than 195 countries. However, Anderson et al. [
16] claim that governments will not be able to minimise both the economic impact of the viral spread of coronavirus and deaths from COVID-19.
The outbreak of the COVID-19 pandemic has affected the global financial markets significantly [
16,
17,
18,
19,
20]. There are numerous studies on stock market reactions to the COVID-19 pandemic [
17,
18]. March 2020, the month the World Health Organization (WHO) announced the novel coronavirus pandemic, witnessed one of the most dramatic stock market crashes in history [
19], a substantially sharper fall than the stock market decline during the global financial crisis of 2008–2009. Moreover, COVID-19 exposed countless sway on the national markets’ financial volatility than the global financial crisis [
20].
In our paper, we examine how the COVID-19 pandemic has influenced the stock market indices related to the alternative and conventional energy sector. Energy resources are indispensable for economic development and treated as a vital commodity for humankind [
21]. Conventional energy sources, i.e., natural gas, oil, coal, or nuclear, are non-renewable but still hold most of the energy market [
22,
23]. Conventional energy sources have proved to be highly effective drivers of economic growth, but have been damaging the environment and human health, and the fossil fuel-driven economies tend to be cyclical [
6,
7]. Alternative energy sources, including wind, hydropower, fuel cells, solar, biogas, biomass, tidal, geothermal, etc., are clean and routinely available in nature [
23,
24]. As they are renewable, they compete with conventional energy sources. The shortage of conventional energy and global warming effect worldwide leads to a search for alternative energy sources as a full-fledged alternative for fossil-based fuels [
25,
26]. Increasing the use of alternative energy sources instead of conventional ones has relieved the growing concerns about climate change and environmental pollution [
27].
Most empirical studies emphasise the strong spillover effect of the conventional energy sector on the alternative energy sector. Zhu et al. [
27], based on daily data from China’s new energy index (which lists 411 companies mainly engaged in alternative energy business) from 2011–2018, show that oil prices have a strong lagged and asymmetric effect on most alternative energy companies’ stock prices. However, the stock price response to oil prices depends on the companies’ ownership structure. Kumar et al. [
28], using data from three clean energy indices—the WilderHill New Energy Global Innovation Index (NEX), the WilderHill Clean Energy Index (ECO), and S&P Global Clean Energy Index (S&P GCE)—show that oil prices but not carbon prices positively impact the stock prices of clean energy companies. Moreover, Managi and Okimoto [
29] reveal that conventional energy prices, particularly oil, positively affect clean energy prices in the stock market. Sun et al. [
30], applying a variable vector autoregressive model to assess the alternative energy companies’ stock prices’ reaction to three fossil energy prices fluctuations, reveal that the effect is only fractional. Kocaarslan and Soytas [
31] point out that speculative attacks, along with an increase in oil prices, appear to be the driving force behind increased investments in clean energy stocks in the short-run. However, in the long-run, increased oil prices negatively affect clean energy stock prices, and this impact is asymmetric.
Many aspects, including economic, political, environmental, technological, and social, affect global energy production and consumption. The COVID-19 pandemic hit the global energy sector by, among others, a plunge in oil prices and demand, increased global CO2 emissions, energy supply chains disruptions, and has led to the problem of global energy crisis [
21,
32,
33]. The COVID-19 pandemic hit the conventional energy sector and conventional energy commodities [
34,
35,
36]. Fu and Shen [
37], based on the financial data of the listed companies in China’s energy industry, both conventional and alternative, from 2014 to 2020, find that the novel coronavirus harms the performance of energy industry companies in high pandemic areas, and the industry performance declined in the first quarter of 2020. As we showed above, there are numerous and profound studies on the spillover effect between the conventional and alternative energy sector. It might imply that the new coronavirus pandemic has negatively affected the alternative energy sector. Chang et al. [
38], based on crisis periods like the 2008–2009 global financial crisis, SARS epidemic, and COVID-19, find that as the costs in developing renewable energy are still substantial, the renewable energy market seems to be susceptible to any shocks in the conventional energy market. They observe risk spillovers from conventional energy to the renewable energy stock market. Pradhan et al. [
39] indicate that an amalgamation of the novel coronavirus pandemic’s effects on the global economy and oil prices fluctuation resulting from country-wide lockdowns worldwide triggered its impact on the alternative energy industry. Eroglu [
40] observes that the COVID-19 outbreak caused severe problems in the renewable energy sector, such as delays and breaks in the supply chain, tax stock market difficulties, and the risk of not benefiting from government incentives and support in 2020. However, the International Energy Agency (IEA) shows that contrary to conventional energy sources, renewables were the only source that experienced a growth in demand in the aftermath of COVID-19 pandemic. According to IEA [
41], renewable energy would still increase, making renewable energy sources the most Covid-19 resilient. Akhtaruzzaman et al. [
42] claim that oil-substitute industries, i.e., alternative energy, alternative fuels, and alternative energy equipment and infrastructure, have positive exposure to oil price risk, and the level of a vulnerability is much lower than those of oil supply and infrastructure provider industries. The evidence shows that investment in solar and wind energy has not stopped growing through the last oil price mitigation in 2020 as most investment funding in renewables come from outside the conventional energy sector [
43]. Corbet et al. [
44] claim that, during the COVID-19 time, investors found alternative energy as more reliable to generate long-term supply than fossil fuels, particularly oil.
The novel coronavirus pandemic’s complete consequences are still uncertain but they are expected to heavily affect the fuel demand (might lead to the aviation sector collapse), and curb short and medium-term industrial and financial investments in the energy sector [
45]. The COVID-19 pandemic is considered a global test of national governments and companies’ commitment to clean energy transition [
46]. The post-novel pandemic investments should be directed to accelerate towards low carbon and circular economies [
47].
Our study focuses on the alternative energy sector stock market’s reaction to two COVID-19–related indicators, i.e., the epidemic status measured by the number of COVID-19 new infections and the stringency of governmental anti-COVID-19 policy measured by the stringency index.
The majority of studies report that the number of lab-confirmed COVID-19 cases has a negative impact on financial market behaviour. According to Liu et al. [
48], the novel coronavirus pandemic’s outbreak negatively impacted stock market returns across all affected countries, and the numbers of COVID-19 infections substantially hit the major stock indices’ performances. Ashraf [
18], based on daily panel data from 64 countries on confirmed COVID-19 cases and deaths and stock market returns, finds that stock markets quickly responded to the novel coronavirus pandemic, and the response varied over time in the first phase of COVID-19. However, the stock markets reacted more proactively to the increase of the confirmed COVID-19 cases than the increasing number of deaths. Baig et al. [
49] indicate that the growing number of confirmed cases and deaths due to COVID-19 are linked to a significant increase in market volatility and illiquidity. However, Onali [
50], based on the U.S. and six other countries majorly affected by the first phase of the pandemic, shows that changes in the number of COVID-19 cases and deaths do not affect the stock market returns. In the paper, we analyse the impact of the novel coronavirus on the stock prices of companies related to the energy sector. Narayan [
51] observes the significant effect of the number of COVID-19 cases on oil prices. However, Sharif et al. [
52] show no significant oil prices reaction to the number of COVID-19 infections in the pandemic’s first phase.
The second COVID-19–related indicator to affect the energy sector during the novel coronavirus pandemic is government anti-COVID-19 policy’s stringency. Baker et al. [
11] indicate that government restrictions and social distancing are the key factors affecting stock markets in the first phase of COVID-19. Ashraf [
14] finds that government anti-COVID-19 measures’ implementation caused the decline in stock market returns. Eleftheriou and Patsoulis [
53] observe the existence of adverse direct and spillover effects of governments’ anti-COVID-19 social distancing measures, including lockdowns, in the initial phase of the pandemic. Baig et al. [
49] suggest that anti-COVID restrictions and lockdowns significantly contribute to increased market illiquidity and volatility. Zaremba et al. [
54] show that government anti-COVID-19 reactions induce increased global stock market volatility. We did not find any study focusing on the impact of government anti-COVID-19 responses on the alternative energy sector.
This paper aims to assess the impact of COVID-19 on the stock market indices related to the alternative and conventional energy sector. Our contribution is that, applying the Markov-switching model, we assess the reaction of the alternative energy sector to the COVID-19 pandemic in comparison to the conventional energy sector response. To the best of our knowledge, no other studies investigate how the novel coronavirus affects the alternative energy sector considering the key COVID-19–related indicators, particularly government anti-COVID-19 policy. It should be stressed that we are the first who develop the Average-49 Stringency Index based on country-level data from Blavatnik School of Government, Oxford University, and Average-49 COVID-19 New Cases Index.
The outline of our paper proceeds as follows.
Section 2 presents the study’s aim, research hypotheses, material description, and research methods used.
Section 3 reports the empirical findings and provides the discussion. Finally,
Section 4 offers our conclusions.
2. Materials and Methods
We analyse the alternative energy sector in comparison to the conventional energy sector in the time of the novel coronavirus pandemic. Considering that the broad macroeconomic assessment is difficult due to lack of data yet, we focus on stock market reaction (companies from the alternative energy industry and conventional energy industry). It is worth mentioning that stock prices reflect market-level, industry-level, and company-specific information [
55].
To achieve the main aim of the study, we build the following research hypotheses:
H1: The alternative energy sector (measured by the Morgan Stanley Capital International (MSCI) Global Alternative Energy Index) is more resistant to the COVID-19 pandemic than the conventional energy sector (measured by the MSCI All Country World Index (ACWI) Energy Index).
H2: Epidemic status (measured by the self-developed Average-49 COVID-19 New Cases Index) does not significantly affect the alternative energy sector.
H3: The stringency of government anti-COVID-19 policy (measured by the self-developed Average-49 Stringency Index) has a significant and negative impact on the alternative energy sector.
To investigate the alternative and conventional sectors’ reaction, we use daily data on the MSCI Global Alternative Energy Index (the index includes large, mid, and small-cap companies that derive 50% or more of their revenues from products and services in alternative energy), and the MSCI ACWI Energy Index (the index includes large, mid, and small-cap companies from the conventional energy sector, including oil, gas, and coal and consumable fuels). MSCI stands as an acronym for Morgan Stanley Capital International, an investment research company providing stock indices, as well as portfolio risk analyses, and governance tools for institutional investors and hedge funds. ACWI is an acronym for All Country World Index, a stock index designed to track equity-market performance from a broad global perspective. The term alternative includes renewable energy sources, particularly solar, wind, geothermal, tidal, and alternatives to fossil fuels, i.e., biofuels, biomass, hydrogen, landfill methane, natural gas-based fuels, and fuel cells. Two above mentioned indices contain companies from 23 developed and 26 emerging economies. The
Appendix A contains the full list of countries.
The COVID-19 pandemic is characterised by daily data on the number of new confirmed COVID-19 cases and the stringency of government anti-COVID-19 policy in 49 analysed countries. The number of COVID-19 confirmed cases belongs to the three key indicators of the novel coronavirus pandemic besides the number of COVID-19 deaths and the total number of tests. The applied Average-49 COVID-19 New Cases Index is as follows:
where
is the number of single-country new COVID-19 cases at time
t, where
,
is a single country’s population divided by one million at time
, and
is the number of countries. In the study, we assume that
t = 1 reflects the date—1 January 2020, and
represents 31 October 2020. We build the Average-49 COVID-19 New Cases Index (AC) based on 49 country-level data. Data come from World Bank statistics and Worldometer Coronavirus Update database. We use data on 2019 country population.
To measure the stringency of government anti-COVID-19 policy, we use data on the Stringency Index developed by the Blavatnik School of Government from Oxford University. The Stringency Index provides a systematic measure of tracking the stringency level of government reaction to COVID-19 in time across more than 170 countries worldwide. The Stringency Index is based on the individual government anti-COVID-19 response measures, including school closing, workplace closing, public events cancellations, gathering restrictions, public transport closing, stay-at-home policies, internal and international movements restrictions, and public information campaign. The index ranges from 0 to 100 [
56]. The applied Average-49 Stringency Index is as follows:
where
is a single-country Stringency Index at time
t, where
,
is a single-country annual gross domestic product in constant prices at time
, and
is the number of countries. In the study, we assume that
reflects the date—1 January 2020, and
represents 30 October 2020. We build the Average-49 Stringency Index based on 49 country-level Stringency Indices and GDPs covering all the countries included in both analysed MSCI indices. Data come from World Bank statistics and the Oxford COVID-19 Government Response Tracker database. We use data on annual 2019 GDP values at constant 2010 USD.
The research covers the period from 1 January until 31 October 2020.
We assume that the link between analysed equity indices and COVID-19 related variables such as the stringency of the global anti-COVID-19 policy and epidemic status depends on the regime which prevails at a certain period during the first phase of the novel coronavirus pandemic. In the paper, we apply the Markov-switching models proven to be useful in commodity market analysis [
57]. Fong and See [
58], based on crude oil prices, showed that the volatility regimes appear to correlate well with major events affecting supply and demand for oil, particularly in times of severe shortages and backwardation. Alizadeh et al. [
59], applying a Markov regime-switching approach for energy commodities’ prices, indicate a visible asymmetry in both conditional means and conditional volatilities under different market conditions, which justifies the application of this model in our study.
The Markov-switching model embraces multiple structures that can characterise the time series behaviour in different regimes. The Markov-switching model belongs to the class of regime-switching models. A characteristic feature of Markov-switching models is that the switching process is a first-order Markov process. Although the regimes are not observed, probabilistic statements can be made about their occurrence’s relative likelihood. The Markov-switching model includes a description of probability law governing the change in regimes. The Markov-switching model was introduced by Hamilton [
60]. In the paper, we apply a two-regime Markov-switching model (3).
In the model (3),
denotes an unobservable state variable assuming the discrete values, i.e., one or two. The Markov-switching model assumes that
evolves according to a first-order Markov process which means that the probability that
equals some particular value depends on the regime at time
t−1 (
). We denote a transition probabilities matrix for a two-regime model as matrix P (4).
The row j, column i element of P is the transition probability . Transition probability gives the probability that state i will be followed by state j. The process is in regime 1 when equals 1, while the process is in regime 2 when equals 2. All elements of matrix P are nonnegative, and the elements of each row sum to one.
The unconditional probability that the process will be in regime 1 (
) or regime 2 (
) at any given date is given by (5):
The expected duration of each regime (6) is derived from the estimated transition probabilities (4):
The Equation (4) implies that the closer the transition probability () is to one, the longer is expected to be the duration of regime 1 (3).
We build two Markov-switching models (3), model I for alternative energy commodity market where dependent variable
is represented by the MSCI Global Alternative Energy Index and model II for traditional energy commodity market where dependent variable
is represented by the MSCI ACWI Energy Index. The independent variables are the Average-49 COVID-19 New Cases (AC) and the Average-49 Stringency Index (ASI). The model (3) allows for the switching of volatility between high-volatility and low-volatility regimes. In the model (3), the innovation of the noise process
is scaled by
. When
, the noise component is heteroscedastic. We assume that the intercept
is constant and there are simultaneous switches in slope coefficients
,
, and volatility parameter
(model (3)). When
equals 1, process is in regime 1 and is described by the equation
. When
equals 2, process is in regime 2 and is described by the equation
. The parameters of the likelihood are computed based on the Broyden, Fletcher, Goldfarb, and Shanno (BFGS) [
61,
62,
63] algorithm. The coefficient covariance is calculated using the Huber–White robust covariance matrix estimator known as the sandwich estimator [
64,
65].
The series stationarity is checked based on the augmented Dickey–Fuller (ADF) [
66,
67] and Kwiatkowski–Phillips–Schmidt–Shin (KPSS) [
68] tests. The ADF test verifies the null hypothesis that a time series is I(1). That means that the process contains a unit root and therefore is non-stationary, against the alternative hypothesis that the process is stationary. On the other hand, the KPSS test verifies the null hypothesis that a time series is stationary (I(0)) against the hypothesis that the process is non-stationary.
3. Results and Discussion
COVID-19 pandemic hit the stock markets worldwide, regardless of the sector [
12]. This paper focuses on the energy sector. The energy sector faced specific problems in 2020 as, apart from an adverse effect of the COVID-19 pandemic, it substantially felt the consequences of the 2020 Russia–Saudi Arabia oil price conflict [
34].
Figure 1 presents the MSCI Global Alternative Energy Index and the MSCI ACWI Energy Index levels linked to the alternative and conventional energy sectors’ joint-stock companies in 2019–2020.
Figure 1 depicts the visible differences between the two analysed indices in 2020 compared to 2019 and might indicate that the COVID-19 pandemic has induced substantial changes in alternative and conventional energy markets. Similar to the MSCI ACWI Energy Index, the MSCI Global Alternative Energy Index fell sharply in February–March 2020. However, since April, it has quickly recovered and started climbing, reaching its all-time high, i.e., 101.93, in mid-October 2020. However, the Energy Index was much lower than before the COVID-19 pandemic until the end of the studied period.
Table 1 presents descriptive statistics for the MSCI Global Alternative Energy Index and the MSCI ACWI Energy Index data in the analysed period. The average value of the alternative energy sector index in the COVID-19 year was almost a quarter higher than in 2019, contrary to the conventional energy sector index whose average level fell by 31 percent in the same period. Moreover,
Table 1 indicates a substantial increase in both indices’ volatility. The coefficient of variation (CV) in 2020 is almost five times higher than in 2019. Both
Figure 1 and
Table 1 results imply that the novel coronavirus pandemic has affected the energy sector. However, the alternative energy sector seems to be more COVID-19–resistant.
As our goal is to investigate the COVID-19 impact on the alternative energy market (measured by the MSCI Global Alternative Energy Index), we focus on the 2020 and COVID-19–related variables, i.e., epidemic status measured by the Average-49 COVID-19 New Cases Index (AC) based on a formula (1), and the governments’ responses measured by the Average-49 Stringency Index (ASI) based on a formula (2). We calculate the two indicators for 49 countries from which the examined joint-listed companies come.
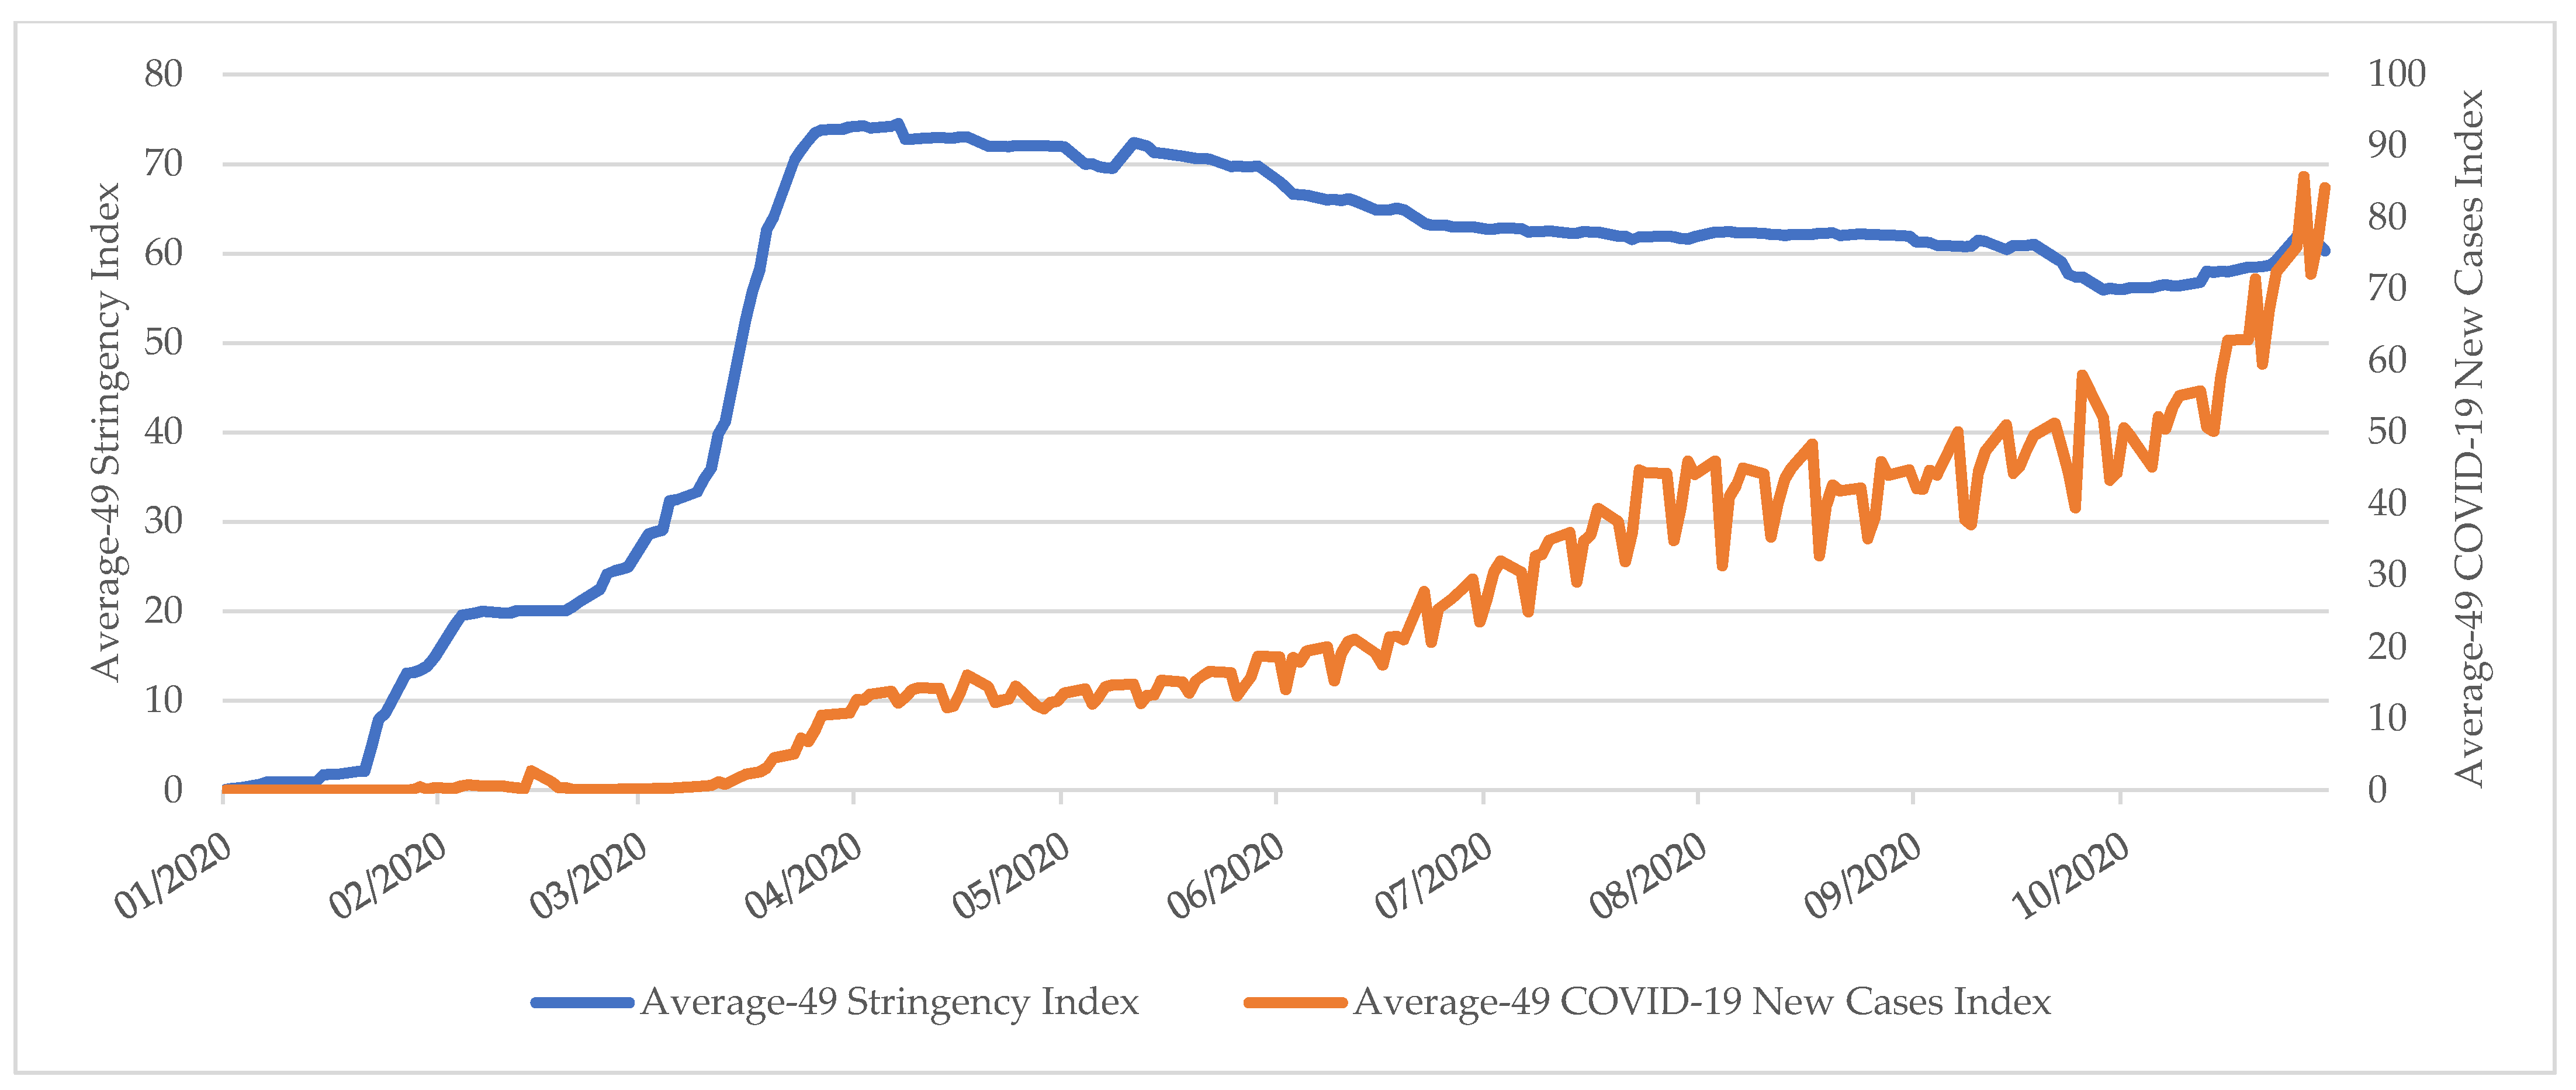
Figure 2 indicates a substantial and persistent increase in the average number of new confirmed COVID-19 cases per one million population from the mid-March 2020. Since mid-October 2020, the upward trend of the new COVID-19 infections has been steeper. It might be connected to the second wave of the novel coronavirus pandemic. The visible daily seasonality in the number of new infections depends on the day-of-week that could be linked to the total number of COVID-19 tests. Usually, during the weekends, the numbers are substantially lower. Moreover,
Figure 2 depicts visible changes of the Average-49 Stringency Index in the analysed period. As the first confirmed cases of COVID-19 infections were recorded in the U.S. and Europe, subsequent government restrictions started to be implemented worldwide, which is reflected in the Average-49 Stringency Index upward trend. Starting from the second half of February to the end of March 2020, we observe a rapid increase in the severity of national governments’ anti-COVID-19 policy, including economies’ lockdown. From early April to the end of September 2020, the ASI levels remained high. However, we see a mild and gradual decline in the ASI index resulting from government regulations’ easing. Growth of the ASI index in the last month of the analysed period, i.e., October 2020, might reflect the outbreak of the second wave of the novel coronavirus pandemic.
The initial graphical and descriptive statistics analysis indicates that the COVID-19 pandemic has affected the shares prices of companies related to the energy sector. We assume that the link between the COVID-19–related variables, i.e., the Average-49 COVID-19 New Cases Index, Average-49 Stringency Index, and the MSCI Global Alternative Energy Index, varies in the analysed COVID-19 period and is regime-dependent. In further analysis, we apply the Markov-switching model (2). The Markov-switching model is built for stationary series.
Table 2 presents the estimated t-statistic for ADF unit root test and Kwiatkowski–Phillips–Schmidt–Shin test statistic for the KPSS stationarity test.
The combination of ADF and KPSS tests suggests that the analysed time series are integrated of order 1 (I(1)). We obtain the stationary processes by applying the first differences of original series of
and
indicators and the first differences of logarithmic values of the MSCI Global Alternative Energy Index and the MSCI ACWI Energy Index. Based on the stationary series, we build two separate two-regime Markov-switching models (3). The models differ with the applied dependent variable, i.e., the MSCI Global Alternative Energy Index and the MSCI ACWI Energy Index, respectively, in model I and model II. We assume that the intercept
is constant and there are simultaneous switches in slope coefficients
, and volatility parameter
. When
, the noise component is heteroscedastic. We label the state of volatility such that
. Therefore, regime 1 represents the high-volatility state, and regime 2 represents the low-volatility state.
Table 3 reports the estimation results of the Markov-switching model (3).
Based on the estimated transition probabilities, we assume that distinguished regimes are persistent. There is a much higher probability that the system stays in the same regime than that it switches to the second one. For two estimated models, the results indicate a 94% probability of staying in regime 1 (p11) and 4% probability of switching to regime 2 (p12). On the other hand, when the system is in regime 2, there is 98–99% probability of staying in regime 2 (p22) and just 1–2% probability of switching to regime 1 (p21).
The results presented in
Table 3 show that all volatility coefficients (σ) are significant at the 1% significance level. The estimated volatility coefficient in regime 1 equals 0.046 and 0.052 in model I and II, respectively, and is much higher than in lower-volatility regime 2 (
). We assume that regime 1 represents the regime of crisis when we observe higher analysed indices’ volatility.
Model I, through investigating the impact of the COVID-19 pandemic on the MSCI Global Alternative Energy Index, reveals a non-significant epidemic status effect on the alternative energy commodity prices. The estimated slope coefficient β is positive and statistically insignificant in the high-volatility regime 1, and negative and statistically insignificant in the low-volatility regime 2. The results indicate that alternative energy commodity prices are not significantly affected by the global epidemic status, which is consistent with research hypothesis 2. Moreover, the results suggest significant and negative alternative energy commodity prices’ reaction to the severity level of the anti-COVID-19 government responses only in the high-volatility regime 1. In the low-volatility regime 2, the estimated slope coefficient . is negative and statistically insignificant. Furthermore, the absolute values of estimated slope coefficients indicate a stronger relationship between alternative energy prices and the Average-49 Stringency Index in the high-volatility regime 1. The results imply that during the high-volatility period in the alternative energy sector, the anti-COVID-19 government policy affects shares prices adversely and significantly, which is consistent with research hypothesis 3.
Model II, investigating the impact of the COVID-19 pandemic on the MSCI ACWI Energy Index, reveals a non-significant impact of epidemic status on the share prices of companies related to the conventional energy sector. The estimated slope coefficient β is negative and statistically insignificant both in the high-volatility regime 1 and low-volatility regime 2. Moreover, we reveal a significant and negative MSCI ACWI Energy Index relationship with the stringency level of the anti-COVID-19 government responses only in the high-volatility regime 1. In the low-volatility regime 2, the estimated slope coefficient is negative and statistically insignificant. Similar to the results obtained in model I, we show that during the higher price volatility periods in the conventional energy sector, the anti-COVID-19 government policy affects joint-stock companies listed on the stock exchanges in 49 analysed countries adversely and significantly.
The results of model I and II indicate that both analysed indices, i.e., the MSCI Global Alternative and the MSCI ACWI Energy, are not significantly affected by the global epidemic status. It should be stressed that we have not found similar studies for stock indices related to conventional and alternative energy sectors. The results are indirectly in line with Sharif et al. [
52] and Onali [
50] but are in contrast to those of Narayan [
51] and Liu et al. [
48], and Ashraf [
18].
Moreover, models I and II indicate that both indices, i.e., the MSCI Global Alternative Energy Index and the MSCI ACWI Energy Index, decline as the government anti-COVID-19 policy becomes more stringent, but the relationship is significant only in the high-volatility regime. To our knowledge, there are no other studies that investigate this particular issue directly. Our results correspond to Baker et al. [
11], Ashraf et al. [
14], and Eleftheriou and Patsoulis [
53] who observe the negative impact of government policy on the stock market, and are indirectly in line with Baig et al. [
49] and Zaremba et al. [
54], who prove the significant contribution of government restrictions and lockdowns to increased market illiquidity and volatility.
Filtered probability of staying in high-volatility regime 1 and low-volatility regime 2 differ substantially in models I and II (
Appendix B,
Appendix C). The results of model I, related to the alternative energy sector, suggest that there was just one switch to high-volatility regime 1 in March 2020 (M3), the month when the WHO announced COVID-19 as a pandemic. On the other hand, the results of model II, linked to the conventional energy sector, indicate the existence of several switches to the high-volatility regime 1 between March and June 2020. Moreover, there is a substantial difference in the duration of the low-volatility regime 2 between two analysed models. In model I, the expected duration of low-volatility regime 2 (d
2) equals 190 days, while in model II, only 48 days.
The Markov-switching model analysis indicates that the alternative energy sector companies are more resistant to the COVID-19 pandemic than the ones from the conventional energy sector. The MSCI Global Alternative Energy Index stays for most of its time in the low-volatility regime 2 without being adversely and significantly affected by the COVID-19–related indicators and only once switches to the high-volatility regime 1. Our results correspond to Akhtaruzzaman et al. [
42] and Corbet et al. [
44]. Moreover, the results are consistent with the IEA Global Energy Review 2020 [
41], which showed that the COVID-19 pandemic did not hamper the alternative energy industry in comparison to the conventional energy sector, and renewable energy sources are the most Covid-19 resilient.
4. Conclusions
The COVID-19 pandemic outbreak has affected financial markets, including share prices of the companies listed on the stock exchanges. This paper focuses on the energy sector, particularly the alternative energy sector. Alternative energy belongs to the economy’s key sectors concerning the problem of climate change and environmental pollution. This paper examines the relationship between share prices of companies related to the alternative and conventional energy sectors and COVID-19–related indicators, i.e., epidemic status and stringency of government anti-COVID-19 policy.
The graphic and descriptive analysis shows that the alternative energy sector is more resistant to the novel coronavirus than the conventional energy one. The average level of the MSCI Global Alternative Energy Index in the COVID-19 year was more than a quarter higher than in 2019, while the average level of the MSCI ACWI Energy Index fell almost one-third in the same period.
We assume that the relationship between above-mentioned variables is regime-dependent. We apply the two-regime Markov-switching model in which we assume that there are simultaneous switches in slope coefficients and the volatility parameter. We distinguish two regimes: high-volatility regime 1, representing the higher index volatility state, and low-volatility regime 2. We build two separate Markov-switching models, i.e., model I and model II for the MSCI Global Alternative Energy Index and the MSCI ACWI Energy Index, respectively. The results indicate that both analysed indices are not significantly affected by the epidemic status but decline as the government anti-COVID-19 policy becomes more stringent. The relationship between the MSCI Global Alternative Energy Index and the MSCI ACWI Energy Index and the Average-49 Stringency Index is statistically significant only in the high-volatility regime. However, the Markov-switching model analysis indicates a substantial difference in the low-volatility regime duration between alternative and conventional energy sectors. The MSCI Global Alternative Energy Index stays most of its time in the low-volatility regime without being adversely and significantly affected by the COVID-19–related indicators and only once switches to the high-volatility regime.
Our analysis reveals that the alternative energy sector, represented by the MSCI Global Alternative Energy Index, is more resistant to COVID-19 than the conventional energy sector. It seems that the novel coronavirus pandemic has not depreciated but emphasised the growing concern about climate change and environmental pollution. This might be illustrated by the record-high level of the MSCI Global Alternative Energy Index in the 2020 pandemic time.
Investigating the alternative energy sector’s reaction to the second wave of the COVID-19 pandemic is a challenge for future research.


