
Environmental Performance of Noise Reduction System in Cogeneration Plants—A Life Cycle Assessment Study


Abstract
:1. Introduction
- Fate analysis—reflecting the increase of the toxic substance concentration in the environment due to the emission of a specific amount of pollutant,
- Exposure analysis—describing the number of people affected by concentration increase,
- Effect analysis—determining the incremental effect of a certain concentration increase during a specific period on human health,
- Damage analysis—expressing the total magnitude of health damage.
- Definition of the noise characterization model,
- Choosing the reference flow for noise in LCI,
- Selecting the impact midpoint in LCIA,
- Choosing the LCIA modeling perspective,
- Computation of the characterization factors (CF).
2. Materials and Methods
2.1. Goal and Scope Definition
2.2. Life Cycle Inventory
2.3. Life Cycle Impact Assessment
3. Results and Discussion
3.1. Baseline Scenario
3.2. Uncertainty Analysis
3.3. Sensitivity Analysis
4. Conclusions
Author Contributions
Funding
Institutional Review Board Statement
Informed Consent Statement
Data Availability Statement
Conflicts of Interest
References
- US Environmental Protection Agency. Information on Levels of Environmental Noise Requisite to Protect Public Health and Welfare with an Adequate Margin of Safety; EPA: Washington, DC, USA, 1974.
- Stansfeld, S.A. Noise Effects on Health in the Context of Air Pollution Exposure. Int. J. Environ. Res. Public Health 2015, 12, 12735–12760. [Google Scholar] [CrossRef] [PubMed]
- Roovers, C.; van Blokland, G.; Psychas, K. Road Traffic Noise Mapping on a European Scale. In Proceedings of the 29th International Congress and Exhibition on Noise Control Engineering InterNoise 2000, Nice, France, 27–30 August 2000; Cassereau, D., Ed.; Volume 6, pp. 3587–3590. [Google Scholar]
- Stewart, J.; McManus, F.; Rodgers, N.; Weedon, V.; Bronzaft, A. Why Noise Matters: A Worldwide Perspective on the Problems, Policies and Solutions; Routledge: Abington, UK, 2011. [Google Scholar]
- Cucurachi, S.; Schiess, S.; Froemelt, A.; Hellweg, S. Noise footprint from personal land-basedmobility. J. Ind. Ecol. 2019, 23, 1028–1038. [Google Scholar] [CrossRef]
- International Organization for Standardization. ISO 14044: 2006, Environmental Management—Life Cycle Assessment—Requirements and Guidelines; International Organization for Standardization: Geneva, Switzerland, 2006. [Google Scholar]
- Cucurachi, S.; Heijungs, R.; Ohlau, K. Towards a general framework for including noise impacts in LCA. Int. J. Life Cycle Assess. 2012, 17, 471–487. [Google Scholar] [CrossRef] [PubMed] [Green Version]
- Meyer, R.; Benetto, E.; Mauny, F.; Lavandier, C. Characterization of damages from road traffic noise in life cycle impact assessment: A method based on emission and propagation models. J. Clean Prod. 2019, 231, 121–131. [Google Scholar] [CrossRef]
- Wernet, G.; Bauer, C.; Steubing, B.; Reinhard, J.; Moreno-Ruiz, E.; Weidema, B. The ecoinvent database version 3 (part I): Overview and methodology. Int. J. Life Cycle Assess. 2016, 21, 1218–1230. [Google Scholar] [CrossRef]
- Steen, B. A Systematic Approach to Environmental Priority Strategies in Product Development (EPS): Version 2000—General System Characteristics; Chalmers University of Technology: Goteborg, Sweden, 1999. [Google Scholar]
- Steen, B. A Systematic Approach to Environmental Priority Strategies in Product Development (EPS): Version 2000—Models and Data of the Default Method; Chalmers University of Technology: Goteborg, Sweden, 1999. [Google Scholar]
- Müller-Wenk, R. Life-Cycle Impact Assessment of Road Transport Noise; Universität St. Gallen: St. Gallen, Switzerland, 1999. [Google Scholar]
- Müller-Wenk, R. Attribution to Road Traffic of the Impact of Noise on Health. Int J. Life Cycle Assess. 2002, 7, 376. [Google Scholar] [CrossRef]
- Müller-Wenk, R. A method to include in lca road traffic noise and its health effects. Int J. Life Cycle Assess. 2004, 9, 76–85. [Google Scholar] [CrossRef]
- SAEFL. Strassenlarmmodell für überbaute Gebeite. Swiss Agency for Environment, Forest and Landscape; SAEFL: Bern, Switzerland, 1991. [Google Scholar]
- Oliva, C. Belastungen der Bevolkerung durch Flug und Strassenlarm; Duncker & Humblot: Berlin, Germany, 1998. [Google Scholar]
- Doka, G. Ergänzung der Gewichtungsmethode für Ökobilanzen Umweltbelastungspunkte’97 zu Mobilitäts-UBP’97; Doka Ökobilanzen: Zurich, Switzerland, 2003. [Google Scholar]
- Heutschi, K. SonRoad: New Swiss road traffic noise model. Acta Acust. United Acust. 2004, 90, 548–554. [Google Scholar]
- Althaus, H.J.; De Haan, P.; Scholz, R.W. A methodological framework for consistent context-sensitive integration of noise effects from road transports in LCA. Part 1. Requirement profile and state-of-science. Int. J. Life Cycle Assess. 2009, 1, 218–220. [Google Scholar]
- Althaus, H.J.; De Haan, P.; Scholz, R.W. Traffic noise in LCA: Part 2: Analysis of existing methods and proposition of a new framework for consistent, context-sensitive LCI modeling of road transport noise emission. Int. J. of Life Cycle Assess. 2009, 14, 676–686. [Google Scholar] [CrossRef] [Green Version]
- Steven, H. Ermittlung der Geräuschemission von Kfz im Straßenverkehr; TÜV Nord: Würselen, Germany, 2005. [Google Scholar]
- Franco, V.; Garraín, D.; Vidal, R. Methodological proposals for improved assessments of the impact of traffic noise upon human health. Int. J. Life Cycle Assess. 2010, 15, 869–882. [Google Scholar] [CrossRef]
- Miedema, H.M.E.; Oudshoorn, C.G.M. Annoyance from Transportation Noise: Relationships with Exposure Metrics DNL and DENL and Their Confidence Intervals. Environ. Health Perspect 2001, 109, 409–416. [Google Scholar] [CrossRef] [PubMed]
- European Communities. Position Paper on Dose Response Relationships between Transportation Noise and Annoyance; Office for Official Publications of the European Communities: Luxembourg, 2002. [Google Scholar]
- Moliner, E.; Vidal, R.; Franco, V.; Garraín, D. A Method to Assess the Impact of Road Transport Noise within the Framework of Life Cycle Assessment. DYNA Ingenieria Industria 2013, 1, 1–12. [Google Scholar]
- Cucurachi, S.; Heijungs, R. Characterisation factors for life cycle impact assessment of sound emissions. Sci. Total Environ. 2014, 468, 280–291. [Google Scholar] [CrossRef] [PubMed]
- Meyer, R.; Benetto, E.; Igos, E.; Lavandier, C. Analysis of the different techniques to include noise damage in life cycle assessment. A case study for car tires. Int. J. Life Cycle Assess. 2017, 22, 744–757. [Google Scholar] [CrossRef]
- Ongel, A. Inclusion of noise in environmental assessment of road transportation. Environ. Model. Assess. 2016, 21, 181–192. [Google Scholar] [CrossRef]
- Babisch, W. Road traffic noise and cardiovascular risk. Noise Health 2008, 10, 27–33. [Google Scholar] [CrossRef] [PubMed]
- Miedema, H.M.E.; Passchier-Vermeer, W.; Vos, H. Elements for a Position Paper on Night-Time Transportation Noise and Sleep Disturbance TNO Inro Report 2002-59; Netherlands Organization for Applied Scientific Research: Delft, The Netherlands, 2002. [Google Scholar]
- Van Zelm, R.; Huijbregts, M.A.J. European characterization factors for human health damage of PM10 and ozone in life cycle impact assessment. Atmos Environ. 2008, 42, 441–453. [Google Scholar] [CrossRef]
- Heijungs, R.; Cucurachi, S. Life Cycle Assessment of Noise Emissions: Comment on a Recent Publication. Environ. Model. Assess. 2017, 22, 184. [Google Scholar] [CrossRef] [Green Version]
- Meyer, R. Development of Time-Dependent Characterisation Factors for Life Cycle Impact Assessment of Road Traffic Noise on Human Health. Human Health and Pathology. Ph.D. Thesis, Université de Cergy Pontoise, Cergy-Pontoise, France, 10 November 2017. [Google Scholar]
- Besnard, F.; Le Duc, E. Road Noise Prediction 2-Noise Propagation Computation Method Including Meteorological Effects (NMPB 2008); SETRA: Bagneux, France, 2009. [Google Scholar]
- The European Parliament and of the Council. Directive 2002/49/EC of 25 June 2002 Relating to the Assessment and Management of Environmental Noise; The European Parliament and of the Council: Brussels, Belgium, 2002. [Google Scholar]
- Kephalopoulos, S.; Paviotti, M.; Ledee, F.A. Common Noise Assessment Methods in Europe (CNOSSOS-EU); Publications Office of the European Union: Luxembourg, 2012. [Google Scholar]
- Miedema, H.M.E.; Vos, H. Noise annoyance from stationary sources: Relationships with exposure metric day–evening–night level (DENL) and their confidence intervals. J. Acoust Soc. Am. 2004, 116, 334–343. [Google Scholar] [CrossRef] [PubMed]
- Tupov, V.B.; Chugunkov, D.V. Noise Silencers on Discharge Lines of Steam from Power-Generating Boilers. Therm. Eng. 2009, 56, 660–664. [Google Scholar] [CrossRef]
- Zroichikov, N.A.; Prokhorov, V.B.; Tupov, V.B.; Arkhipov, A.M.; Fomenko, M.V. Possible Ways of Reducing the Effect of Thermal Power Facilities on the Environment. Therm. Eng. 2015, 62, 146–153. [Google Scholar] [CrossRef]
- International Organization for Standardization. ISO 14040: 2006, Environmental Management—Life Cycle Assessment—Principles and Framework; International Organization for Standardization: Geneva, Switzerland, 2006. [Google Scholar]
- Tupov, V.B.; Taratorin, A.A. New steam silencers developed at MPÉI. Power Technol. Eng. 2015, 49, 301–303. [Google Scholar] [CrossRef]
- International Organization for Standardization. ISO 1996-2: 1987 Acoustics—Description and Measurement of Environmental Noise—Part 2: Acquisition of Data Pertinent to Land Use; International Organization for Standardization: Geneva, Switzerland, 1987. [Google Scholar]
- City of Lodz Office. Acoustic Map of the City of Lodz for 2017–2022. 2017. Available online: https://mapa.lodz.pl/akustyczna (accessed on 20 May 2020). (In Polish).
- GUS. Residential Conditions in Poland in 2017; Central Statistical Office: Warsaw, Poland, 2018. [Google Scholar]
- World Health Organization. Burden of Disease from Environmental Noise. Quantification of Healthy Life Years Lost in Europe; The WHO European Centre for Environment and Health: Bonn, Germany, 2011. [Google Scholar]
- Hischier, R.; Weidema, B.; Althaus, H.J.; Bauer, C.; Doka, G.; Dones, R.; Frischknecht, R.; Hellweg, S.; Humbert, S.; Jungbluth, N.; et al. Implementation of Life Cycle Impact Assessment Methods. Data v2.2. Ecoinvent Report No. 3. Dübendorf; Swiss Centre for Life Cycle Inventories: Dübendorf, Switzerland, 2010. [Google Scholar]


| Noise Sources | Midpoint Human Health Indicator (HAP/year) | Endpoint Human Health Indicator (DALY) |
|---|---|---|
| Background | 29,420 | 5884 |
| Background + steam discharge without the silencer | 40,508 | 8102 |
| Background + steam discharge with the silencer | 29,603 | 5921 |
| Steam discharge without the silencer (excluding background) | 11,088 | 2218 |
| Steam discharge with the silencer (excluding background) | 184 | 36.7 |
| Reduction due to the silencer | 10,905 | 2181 |
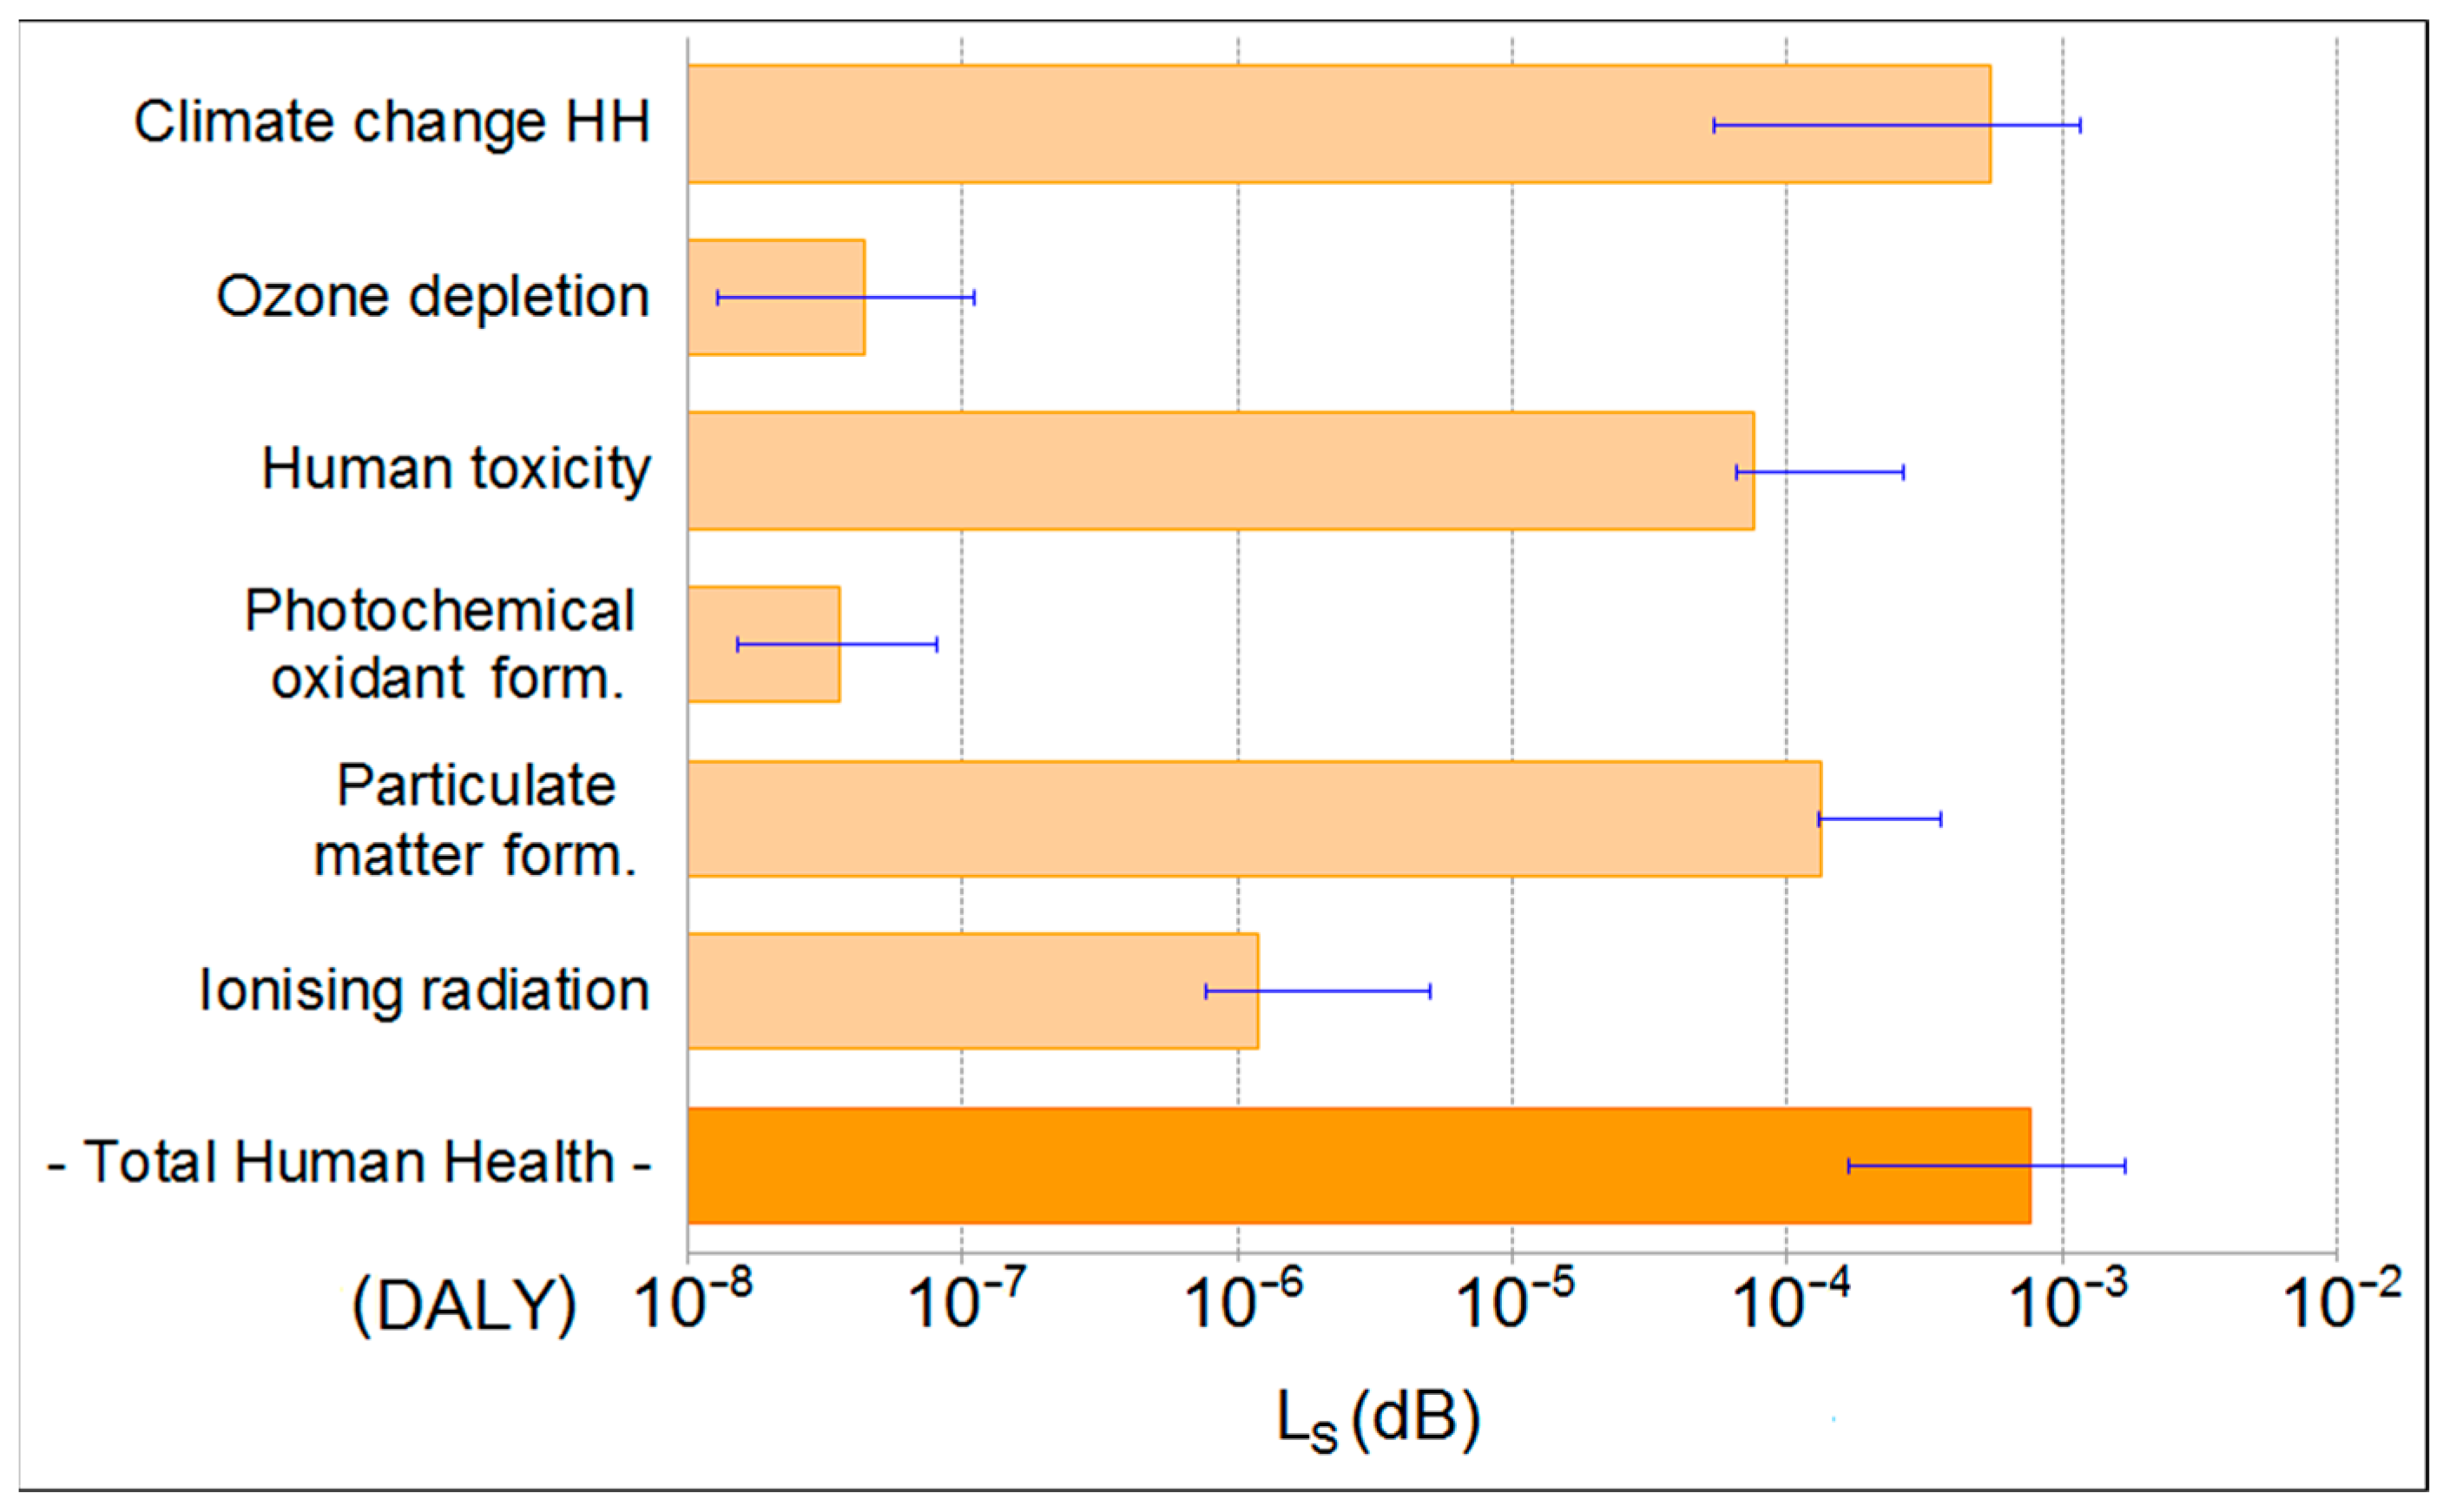
| Endpoint Characterization Indicator (DALY) | |||
|---|---|---|---|
| Impact Category | Production | Disposal | Total |
| Climate change Human Health | 8.58 × 10⁻⁴ | −3.06 × 10⁻⁴ | 5.52 × 10⁻⁴ |
| Ozone depletion | 5.26 × 10⁻⁸ | −8.53 × 10⁻⁹ | 4.41 × 10⁻⁸ |
| Human toxicity | 1.30 × 10⁻⁴ | −5.60 × 10⁻⁵ | 7.41 × 10⁻⁵ |
| Photochemical oxidant formation | 6.43 × 10⁻⁸ | −2.81 × 10⁻⁸ | 3.62 × 10⁻⁸ |
| Particulate matter formation | 3.63 × 10⁻⁴ | −2.31 × 10⁻⁴ | 1.32 × 10⁻⁴ |
| Ionizing radiation | 1.40 × 10⁻⁶ | −1.78 × 10⁻⁷ | 1.32 × 10⁻⁴ |
| sum: | 1.35 × 10⁻³ | −5.93 × 10⁻⁴ | 7.59 × 10⁻⁴ |
| Scenario | Baseline Scenario | Overestimation of LS and Underestimation of LB | Overestimation of LB and Underestimation of LS |
|---|---|---|---|
| HH without the silencer (DALY) | 2218 | 2370 | 2069 |
| HH with the silencer (DALY) | 36.7 | 46.0 | 28.1 |
| HH reduction (DALY) | 2181 | 2324 (+6.6%) | 2041 (−6.4%) |
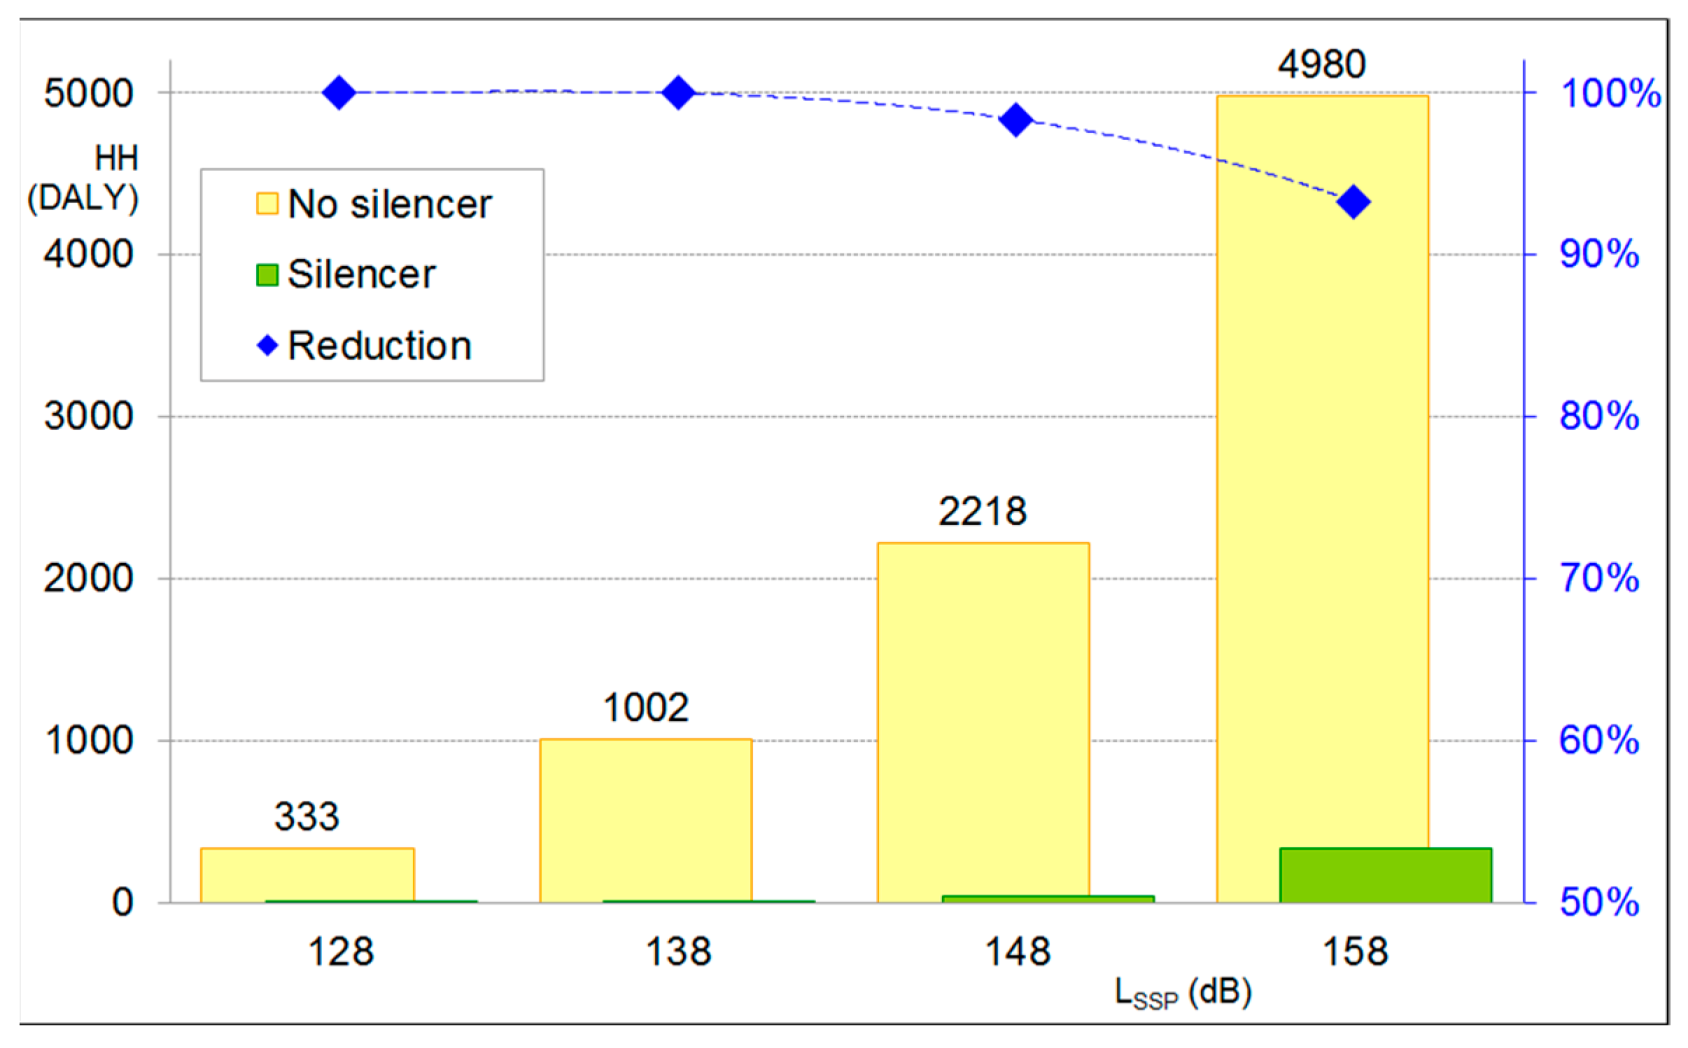
| Scenario | Unit | Acoustic Reduction Efficiency, dB | |||
|---|---|---|---|---|---|
| 20 | 25 | 30 | 35 | ||
| HH without the silencer | DALY | 2218 | |||
| HH with the silencer | DALY | 333 | 122 | 36.7 | 6.5 |
| HH reduction | DALY | 1884 | 2096 | 2181 | 2211 |
| % | 85 | 95 | 98 | 100 | |
| LCIA Method | Climate Change (kg CO2 eq) | Ozone Depletion (kg CFC-11 eq) | Endpoint (DALY) | Relative Difference |
|---|---|---|---|---|
| ReCiPe H/A | 3.94 × 10² | 1.88 × 10⁻⁵ | 5.52 × 10⁻⁴ | - |
| CML 2001 | 3.94 × 10² | 1.73 × 10⁻⁵ | 5.53 × 10⁻⁴ | +0.08% |
| TRACI 2 | 3.94 × 10² | 1.90 × 10⁻⁵ | 5.53 × 10⁻⁴ | +0.09% |
| IMPACT 2002+ | 3.93 × 10² | 1.90 × 10⁻⁵ | 5.51 × 10⁻⁴ | −0.20% |
| EDIP 2003 | 3.95 × 10² | 1.87 × 10⁻⁵ | 5.54 × 10⁻⁴ | +0.27% |
Publisher’s Note: MDPI stays neutral with regard to jurisdictional claims in published maps and institutional affiliations. |
© 2021 by the authors. Licensee MDPI, Basel, Switzerland. This article is an open access article distributed under the terms and conditions of the Creative Commons Attribution (CC BY) license (http://creativecommons.org/licenses/by/4.0/).
Share and Cite
Marcinkowski, A.; Kopania, J. Environmental Performance of Noise Reduction System in Cogeneration Plants—A Life Cycle Assessment Study. Energies 2021, 14, 1324. https://doi.org/10.3390/en14051324
Marcinkowski A, Kopania J. Environmental Performance of Noise Reduction System in Cogeneration Plants—A Life Cycle Assessment Study. Energies. 2021; 14(5):1324. https://doi.org/10.3390/en14051324
Chicago/Turabian StyleMarcinkowski, Andrzej, and Joanna Kopania. 2021. "Environmental Performance of Noise Reduction System in Cogeneration Plants—A Life Cycle Assessment Study" Energies 14, no. 5: 1324. https://doi.org/10.3390/en14051324