Abstract
This article presents a comparative analysis for the design considerations for a solar power generation transformer. One of the main existing problems in transformer manufacturing is in the renewable energy field, specifically the solar power generation, where the transformer connected to the inverter is operated under a certain harmonic content and operating conditions. The operating conditions of the transformer connected to the inverter are particularly unknown for each solar power plant; thus, the transformer will be subject to a particular harmonic content, which is defined by the inverter of the solar power plant. First, the fundamental calculations for solar power plant transformer and the proposed methodology for the design calculation of the distribution pad-mounted three phase transformer are presented. Then, a design study case is described where a distribution transformer and an inverter of a particular solar power plant are used for the analysis. Next, the transformer under analysis is modeled using finite element analysis in ANSYS Maxwell® software, where the transformer will be designed for a non-harmonic and harmonic content application. Lastly, the main design parameters, flux density, the core losses and the winding excitation voltage of the transformer are calculated and presented in results and discussion section.
1. Introduction
The operation conditions and grid integration of solar power generation (SPG) are very particular, similarly to other renewable energy generation systems such as wind power plants (WPP). Solar power generation using photovoltaics involves several technical specifications for its primary equipment, mainly for the selection and sizing of the power transformer connected to the inverter of the solar power plant (SPP). One main aspect of the power transformer operation in SPP is the current harmonic content caused by the inverter. The power transformer should be designed for specific operation conditions of SPP generation, specifically the harmonic frequencies generated by the inverter. Thus, this is the main interest of performing this study. As is well known, the study of harmonics in transformers is not a new topic in the field of research. Previous work has already used correction factors for transformer losses [1] as a tool to demonstrate how these are increased due to harmonic content and thus achieve a better understanding of the operation of the device under these conditions [2,3]; Yazdani-Asrami et al. [4] evaluate the effects of harmonic distortion on the performance of the transformers and other electrical elements are analyzed, as well as the effect harmonics have in various electrical elements that affect the electrical systems; Yazdani-Asrami et al. [5] studied the harmonics impacts on alternating current (AC) losses of superconductors. Sadati, S.B. et al. [6], estimated and evaluated the losses, the remained lifetime and loadability on the transformer considering the effects of current harmonics and ambient temperature. The impact of harmonics in transformer lifetime is important because the lifetime can be affected if the correction factors show a significant change in losses [1]. Additionally, finite element analysis software has been used to simulate the aforementioned correction factors, and to corroborate the calculation of the increase in losses and currents for a transformer [7,8], Yazdani-Asrami et al. [9] uses simulation of finite element method (FEM) to analyze non-sinusoidal voltage effects on no-load loss of transformers, such as different electromagnetic parameters such as flux lines, flux density, losses under different input sources and with high accuracy. The proposed methodology in this work will include the results of the correction factors in the manufacturer’s design system, particularly in the estimation calculation of loss increase, the volts per turn for each winding, the magnetic field density, and the induction currents. If the RMS value of the load current increases due to a non-sinusoidal load with specific harmonic content, the losses increase. If the losses increase, the flux density in the magnetic core increases, so it will behave as an internal source of harmonic generation, causing a reduction in the power factor [10]. Thus, it is feasible that the design will require an oversize of the magnetic core and coil based on a “k factor” to withstand the increase in flux density and prevent premature transformer failure [11,12]. However, the purpose of this research is to show that a “k factor” is not necessary, and considering the proposed methodology, the SPP transformer design can withstand the inverter harmonic load.
The proposed methodology included in the manufacturer’s design system with the use of ANSYS Maxwell® (specialized simulation software in finite element method) will enable evaluation of whether the dimensions and quantity of the materials proposed for the magnetic core and coils of a transformer design are affected due to specific harmonic content of an inverter of an SPP, so the manufacturer can assure the efficiency and stability of the transformer during operation in an SPP. Another important aspect is that an SPP could be connected and disconnected at least three times a day, and also a disconnection of the SPP at full load or partial load condition of the transformer could occur, so the design of an SPP transformer must accomplish the operation requirements of a specific SPP.
In a specific SPP design, the use of electrostatic shield between primary and secondary winding should also be considered to reduce the probability of an insulation failure due to voltage distortion, which can reduce the lifetime of a step-up transformer in an SPP [13]. The electrostatic shielding it is aimed to attenuate noise and transients and reduce high frequency components transferred between windings in the transformer. Therefore, the SPP transformers in comparison with standard design transformers should be designed to withstand these conditions. However, in the case for distribution transformers, there is a debate about the use of electrostatic shields and its performance, arguing that they could add unwanted capacitance causing potential resonances during transients, it has already been proven that a ground connection in the secondary winding is enough to avoid the most damaging harmonics and the use of electrostatic shield only reduces the remaining noise [14]. Said, D.M et al. [1,2] clarifies how the shielding tends to reduce capacitive values between the windings resulting in less heating, less conduction of eddy currents, and consequently, a harmonic filtering. However, it is clarified that the electrostatic shield should be considered in the design, if an analysis for a particular transformer design is performed previously, and preferably considered for those applications where the secondary winding has no ground connection.
Existing research has analyzed the impact of solar panels and its harmonic effects on transformers and distribution networks through software simulations and laboratory tests [15,16]. Queiroz, H. et al. [17] shows the impacts of distributed generation in order to reduce transformer aging in a distribution transformer. Fortes, R.R.A et al. [18] and Ayub, M. et al. [19], analyze the impact of photovoltaic (PV) inverters in distribution networks and reinforces that PV inverters’ current harmonic injection should be considered for analysis. Additionally, Gray, M.K. et al. [20] evaluates the effect of rooftop solar photovoltaic penetrations and its impact in distribution transformers, and the results presented reveal that solar photovoltaic generation reduces transformer aging without significant reductions in neutral current. Thus, the main contribution of this article is to establish and validate the design methodology for SPP transformers which will work under a specific harmonic content (mostly when the third, fifth and seventh harmonics are dominant) due to operation requirements of an SPP.
2. Fundamental Calculations Required for SPP
In this section, fundamental calculations required for the transformer design of an SPP will be presented. The total losses of a transformer (PLL) involve the losses (P), the winding eddy–current losses (PEC), and other stray losses (POSL) [1,2]. The equation for total losses in a transformer is presented in Equation (1):
In Equation (2), the per-unit load loss (PLL-R), under rated conditions is calculated per unit, considering the sum of the per-unit losses (1 p.u.), the per-unit winding eddy–current loss (PEC-R), and the per-unit other stray loss (POSL-R).
The winding eddy–current losses under rated conditions (PEC-R), are defined as a portion of the total stray loss under rated conditions (PTSL-R), where 33% of the total stray loss is assumed to be winding eddy losses for liquid-filled transformers and 67% for dry-type transformers [2]. Nevertheless, it should be mentioned that in this analysis the winding eddy current losses under rated conditions (PEC-R) and other stray losses (POSL-R) will be calculated with the design tool of the transformer manufacturer. In order to estimate the increase in winding eddy current stray losses and other stray losses due to non-sinusoidal load, two correction factors for each type of loss are used, which is the ratio of the total winding eddy current losses due to the harmonics (), to the winding eddy current losses at the power frequency, when no harmonic currents exist (), and the harmonic loss factor for other stray losses ) [2]. The harmonic loss factor equations are presented in Equations (3) and (4):
where is the RMS current at harmonic order “h”, is the highest significant harmonic number, I is the RMS load current, and I1 is the RMS fundamental load current. As a result of considering the harmonic loss correction factors, the per-unit total load loss in Equation (2) now becomes Equation (5):
Consequently, the maximum current in the windings needs to be obtained, and therefore the maximum current of the winding is calculated with Equation (6). It should be mentioned that other stray losses do not exist in the windings, so is not considered in Equation (6).
Non-sinusoidal loads with a particular harmonic content, can provoke an increase in the magnetic flux of a transformer [7,8]; with this consideration and knowing that in the software design tool of the manufacturer the magnetic flux density (B) directly affects the no-load losses (), as shown in Equation (7), the calculation of the must be updated integrating the harmonic content in the calculation of B.
where the Manufacturer Material Factor (MMF) is a calculation from the software design tool based on the core properties.
For the integration of the harmonic content in B, first, the calculation of B is shown in Equation (8).
where Ac is the cross-sectional area of the magnetic core, and is the volts per turn in the winding, whether it is high voltage (HV) winding or low voltage (LV) winding [21]. Then, in order to obtain the volts per turn, the current increase in the windings due to the maximum current in presented in Equation (6) is considered; this current, defined as , creates a minimum but measurable increase in the winding voltage which is needed to ascertain the volts per phase (, and consecutively the volts per turn ). The volts per turn directly affect B and is used as an input for the finite element modeling (FEM).
The for both windings is also an input for the FEM simulation, and it is shown in Equation (9):
where is the calculated current using the software design tool under rated conditions for each winding (high or low voltage). The volts per phase of the windings () can be obtained by using Equation (10):
where Smax is the max apparent power resulting from the calculation of the maximum current in per-unit, and the Number of phases is three for a three-phase transformer. The volts per turn of the windings ) are calculated using Equation (11).
It should be mentioned that the , from the primary and secondary winding, respectively, is obtained according to the winding dimensions calculated from the software design tool of the manufacturer.
In Figure 1, the proposed methodology for SPP transformer design for a specific harmonic profile is presented. In the spreadsheet section of Figure 1, the calculation of new variables are included in the design software tool for the SPP transformer. The proposed methodology in Figure 1 consists, in the first step, of obtaining values for core, winding and tank losses from the design tool of the manufacturer for the standard transformer design (also obtaining the efficiency, apparent power, impedance and data of interest), this without altering the default calculations of the design tool. In the second step, based on equations from Richard Marek et al. [2], the equations are adapted into the design tool formulas for the winding current and voltage values to arithmetically estimate the increase in the magnetic flux density due to the harmonic load profile, and thus obtain the increase in core losses. Consequently, changes in the winding and tank losses will be reflected, obtaining new values for efficiency, apparent power, and other data of interest. Both sets of values will serve as input data for the FEM simulations, and finally the data results for both scenarios (with and without harmonic loading) are obtained for its comparison and analysis.
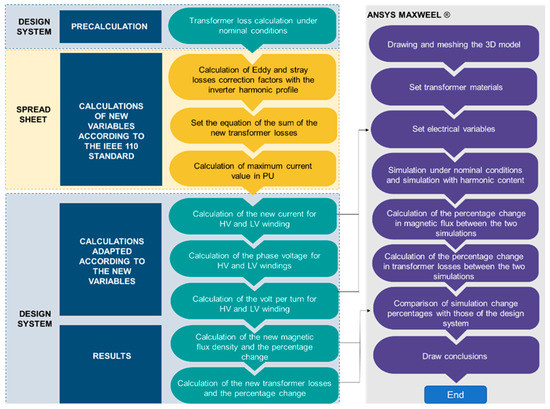
Figure 1.
Proposed methodology for solar power plant (SPP) transformer design with a specific harmonic profile.
3. Study Case for SPP Transformer Design
In this section, a study case of a transformer design using the proposed methodology is presented. First, the specification data of an inverter and its maximum harmonic profile is required (see Appendix A, Table A1 and Table A3). With this information, the design software tool can be updated and a specific design for a particular application can be achieved and meet the specified operation requirements; for this particular case, the flux density should be 1.72 Tesla as the minimum design requirement, the efficiency should be above of 99%, and the percentage impedance should be 5.75 ± 7.5%. In the following sections, the analysis is based on an actual standard transformer design (see Table A2), where the calculated variables for a standard design are compared with the calculated variables of a specific design which considers the inclusion of the maximum harmonic profile required according to the proposed methodology in Figure 1.
3.1. Assessment of Standard Design vs. Specific Harmonic Profile Design
3.1.1. Standard Design
The data required for the analysis are as follows, inverter data, transformer nameplate data, and transformer core magnetizing data curves. The detailed information of data required for the analysis is presented in the Appendix A.
In Table A2, the nameplate data for a standard design are presented. The standard design used for the analysis is modeled in ANSYS Maxwell®, where the design geometries required for the software are the interior dimensions of core, coil, and steel holders and hardware, so a model can be stablished for FEM analysis. In Figure 2, the 3D model of the standard design for analysis is presented.
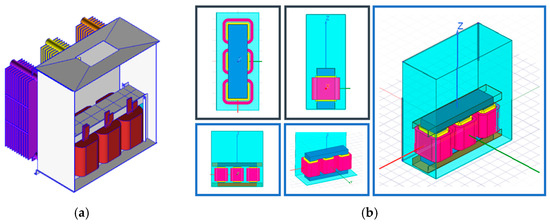
Figure 2.
Standard design transformer 3D model for analysis: (a) transformer geometry using design system tool of the manufacturer; (b) equivalent geometry of the transformer in ANSYS Maxwell®.
First, loss calculations of the transformer were performed in the manufacturer’s design system tool, and the total losses at no load and load conditions were obtained before applying the correction factors. The calculated losses are presented in Table 1.

Table 1.
Transformer standard design calculated losses.
For the calculation of specific harmonic profile transformer design, first, the standard design calculated losses are obtained in Section 3.1.1. Then, the manufacturer’s design system tool is used again and the and correction factors, and , are calculated. Additionally, the increase in the apparent power is calculated, multiplying the nominal apparent power by the calculated in order to subsequently obtain the increase in the HV winding and LV winding currents, which are the inputs required for the finite element simulation in ANSYS Maxwell®. The calculated apparent power and HV and LV winding currents are presented in Table 2.
Table 2.
Apparent power and winding currents in the transformer design calculated under the harmonic profile.
With the calculated apparent power and winding currents, the and can be obtained using Equations (10) and (11); it should be mentioned that for this design, the number of turns of secondary winding was nine. The calculated was 42.41 V, and the results are presented in Table 3. By using Equation (8) and considering the calculated, the flux density B was 1.7989 T. Next, the transformer losses including the harmonic profile were calculated and are presented in Table 4. Additionally, the transformer efficiency was calculated by using the manufacturer design software tool considering different load percentages to ensure the proper operation under different conditions. The results are presented in Table 5.
Table 3.
Transformer winding voltages calculated under the harmonic profile.
Table 4.
Transformer losses with harmonic profile design calculated.
Table 5.
Transformer efficiency with harmonic profile calculated.
3.1.2. Manufacturer Design System Parameters Results
The calculation results for standard design and harmonic profile design are presented. In Figure 3, the results obtained are summarized and presented for both designs, standard and harmonic profile.
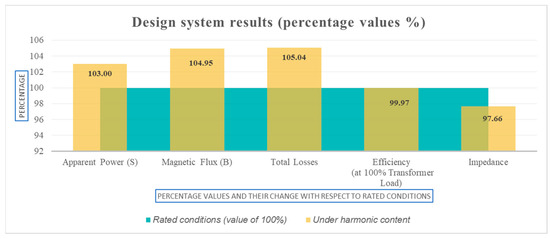
Figure 3.
Percentage changes between transformer standard design and harmonic profile design.
As shown in Figure 3, the Harmonic Profile Design showed a difference in all the design parameters considered including the calculated impedance percentage, which was 4.27 for standard design and 4.17 for harmonic profile design.
In Figure 4, a percentage change in losses calculation can be observed; this percentage change for Harmonic Profile Design is adequate and meets the requirements for this particular SPP. Therefore, the minimum design requirements are fulfilled for this stage of the design.
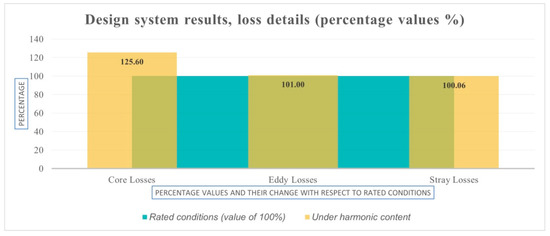
Figure 4.
Percentage changes in losses between transformer standard design and harmonic profile design.
3.1.3. FEM Analysis Using ANSYS Maxwell®
FEM analysis using the input variables from the previous section such as , in Equation (9) and in Equation (11) was performed using ANSYS Maxwell®. The objective was that the meshed models of the core, winding, tank, and steel holders were generated correctly, so the winding voltages, the flux density, and the core losses could be calculated by the software and a final design could be defined by comparing the results from ANSYS Maxwell® and the manufacturer Design System.
Finite element solvers such as ANSYS Maxwell® have their own methodology and formulation to converge into a result in electromagnetic problems. For this work, the formulation A-phi [22] offered by ANSYS Maxwell® was used as a solver in the study, which, in its mathematical formulation, converges Maxwell’s equations for its solution [23].
For the meshing, based on the type of data of interest for the study, the adaptive mesh with tetrahedral elements offered by ANSYS Maxwell® was used, ensuring that the meshing was identical for each simulation.
3.1.4. Simulation Results for a Standard Design
The simulation was performed using, as input data, the parameters obtained from the manufacturer design system software. In Figure 5, the winding excitation voltage results from the simulation are presented, where the maximum peak value for HV winding is 33.75 kV and for LV winding is 500 V. These results are adequate, mainly because they are similar to the nominal voltages of the study case transformer in Table A2.
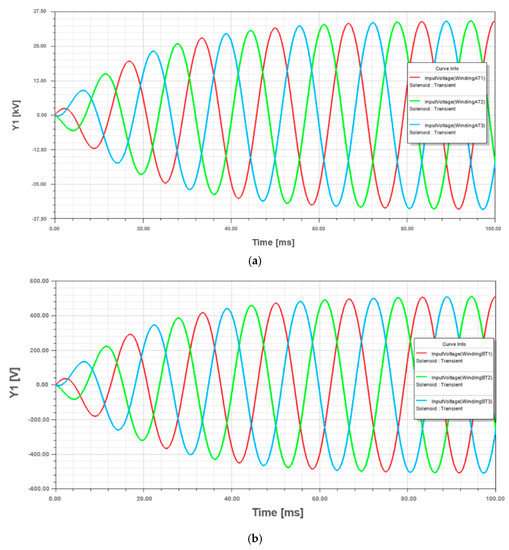
Figure 5.
Winding voltage waveforms of the standard design transformer: (a) HV winding; (b) LV winding.
In Figure 6, it can be observed the generated meshed model of the transformer under study (see Appendix A, Table A2 and Figure A1). The flux density simulation distribution in the core of the transformer had a maximum value of 1.7911 Tesla and the maximum value of flux density in the tank was 7.43 Tesla. In Figure 6a, the maximum value is observed between phase A and phase B in the upper and lower interval core section; this occurs mainly due to magnetic induction concentration in the core due to the current flow through the windings of each phase. During the continuous simulation results, it could be seen how the magnetic induction concentrates and alternates between phase A and B and then concentrates between phase B and C, which is how the transformer works during operation. In Figure 6, the images presented are considered only in a time frame, which allows us to appreciate the maximum value of magnetic flux density in the core.
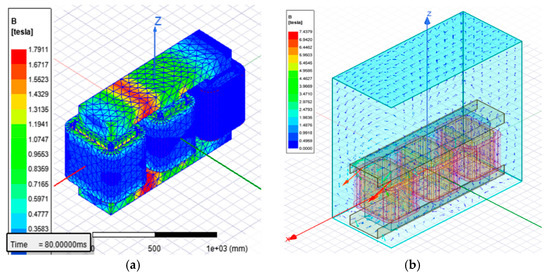
Figure 6.
Flux density simulations of standard design transformer: (a) core; (b) tank.
As shown in Figure 7, the total losses (Core Loss), eddy current losses, and hysteresis losses are calculated. The total losses calculation had a maximum value of 1.04 kW.
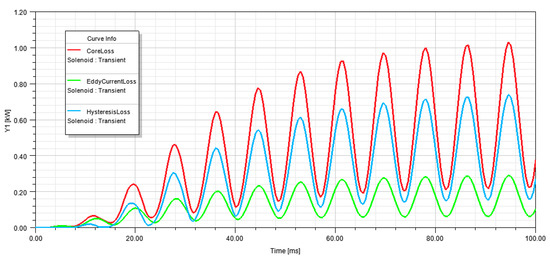
Figure 7.
Core losses of standard design transformer.
3.1.5. Simulation Result for Harmonic Profile Design
In this section, the simulation was performed using the harmonic profile design data parameters obtained from the manufacturer design system software in Section 3. In Figure 8, the winding excitation voltage results from the simulation are presented, where the maximum peak value for HV winding is 36.25 kV and for LV winding is 512 V. These results are adequate because they present a similar percentage increase according to the previous calculation in the design system manufacturer’s tool.
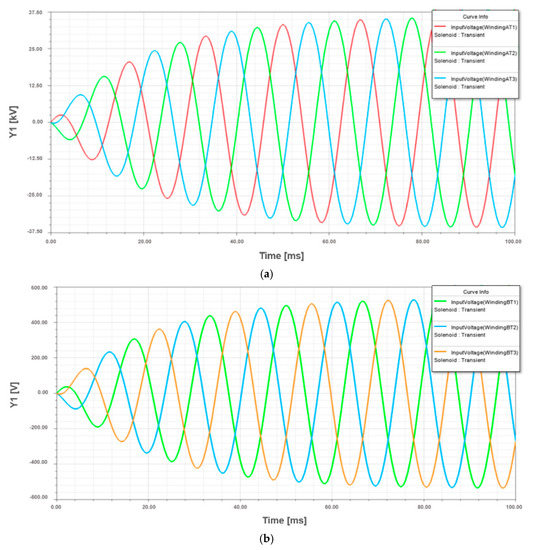
Figure 8.
Winding voltage waveforms of harmonic profile design transformer: (a) HV winding; (b) LV winding.
As presented in Figure 9, the flux density simulation distribution in the core of the transformer has a maximum value of 1.8614 Tesla and the maximum value of flux density in the tank is 7.8069 Tesla. In Figure 9a, the maximum value is observed between phase A and phase B in the upper and lower interval core section; this occurs during the continuous simulation results as described in Section 3.1.5, where the magnetic induction is concentrated and alternated between phases.
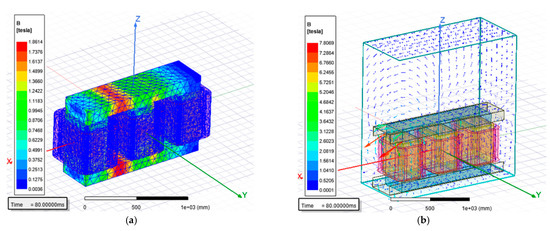
Figure 9.
Flux density simulation of harmonic profile design transformer: (a) core; (b) tank.
As shown in Figure 10, the total losses (CoreLoss), eddy current losses, and hysteresis losses are calculated. The total loss calculation had a maximum value of 1.12 kW.

Figure 10.
Core losses of harmonic profile design transformer.
The data results obtained in FEM simulation were compared between the standard design and harmonic profile design to obtain a percentage change, as shown in Figure 11. The results show a similarity with the results using the manufacturer’s design software in Figure 3 and Figure 4, where an increase in magnetic flux density and loss is noticed, mainly in the core losses. It should be noted that the increase in total losses in the FEM analysis is 4.72% (close to 5.04% when using manufacturer’s design system tool calculations shown in Figure 3) and is an indication that the design will meet the required efficiency even with the harmonic profile considered.
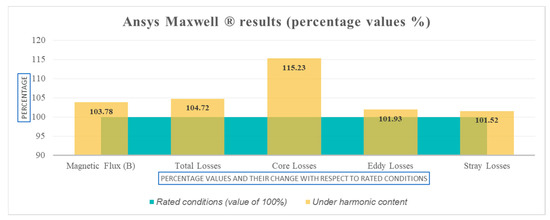
Figure 11.
Ansys Maxwell® percentage changes in main design parameters between transformer standard design and harmonic profile design.
Additionally, in Figure 11, the FEM simulation results show an increase in the percentage of flux and are similar to the value calculated by the manufacturer’s design system tool in Figure 3. However, the increase in the flux density in the core, calculated in both cases, could be dangerous for the core’s material type. This may be an indication that other considerations in the design such as the electrostatic shielding could be required. These results evidence the requirement of analyzing different types of core material for SPP distribution transformer design for future studies or field experiments and knowledge of how the core material behaves for a particular harmonic profile.
4. Results and Discussion
The magnetic flux density in the core is the parameter that stands out in the design, and according to the calculations performed by the manufacturer’s design system in Section 3, it is observed that during rated operating conditions with the harmonic profile presented the transformer design meets the material specifications, where the flux density is below the maximum flux density of the core material (see Figure A1). In Table 6, a summary of results for main design parameters for the standard design and harmonic profile design is presented.
Table 6.
Summary of design parameter results.
The percentage difference results from ANSYS Maxwell® simulation in Figure 11 corroborate the proportionality of change in the analysis, which concludes that the harmonic profile of the inverter does not represent a major problem for the transformer efficiency during rated operating conditions. However, the proposed methodology for SPP distribution transformers, where the harmonic profile current injection of the inverter (see Table A3) is used in the analysis, could affect the volt per turn in the windings; the results indicate an increase in the magnetic flux density above 1.72 Tesla, which is the minimum requirement for the design.
Regarding the comparison of the obtained results in this proposal with respect to other works, we find the following: in [24], the technical requirements for a step-up transformer in a photovoltaic distribution system are outlined and the design characteristics that must be considered to guarantee the correct operation of the transformer are included. However, the percentage variation in aspects such as capacity, magnetic flux, total losses, efficiency and impedance of the proposed design with respect to a conventional design is not reported. In this work, the percentage variation is considered (see Figure 11), so we cannot contrast the benefits or deficiencies of this work with the mentioned reference.
5. Conclusions
The calculations and analysis carried out in this work indicate that the harmonic profile considered in the design process (see Figure 1) concludes that the final transformer design will operate correctly at the particular operating conditions in an SPP being considered without the requirement of a “k” factor design and without any filter inside the transformer.
For a specific harmonic profile design, it is suggested to use the loss correction factors mentioned in Section 2 to estimate the increase in apparent power and loss of the transformer design, and the harmonic profile should be indicated by the user of the SPP distribution transformer.
For future work and recommendations, it is suggested to perform physical experimentation for the designs. The scope of ANSYS Maxwell® software can add greater value if it is correlated with laboratory tests. Additionally, it should be mentioned that, in this type of transformer, an electrostatic shield is usually considered to reduce the harmonic effect into the core and coil. With the appropriate shield design, the transformer design could be robust enough to withstand harmonic loads for SPP applications. Nevertheless, in this work the electrostatic shield was not considered in the design, and the use of an electrostatic shield could be analyzed in future work, including ANSYS Maxwell® simulations in order to determine the effect of the shield in the magnetic flux density.
Therefore, physical tests on transformers designed for SPP with and without electrostatic shields with a star delta connection should be performed to evaluate their performance. In the same way, an integration of the FEM simulations is recommended as an external module in the design system tool of the transformer manufacturer.
Author Contributions
Conceptualization, methodology, software, validation, resources, data curation, visualization, investigation, writing—original draft preparation, writing—review and editing, I.R.M.R.; supervision, investigation, writing—original draft preparation, writing—review and editing, L.A.T.G.; data curation, visualization, investigation, writing—review and editing. L.H.R.A., F.S.S., J.R.M. and M.A.G.V. All authors have read and agreed to the published version of the manuscript.
Funding
This research received no external funding.
Institutional Review Board Statement
Not applicable.
Informed Consent Statement
Not applicable.
Data Availability Statement
Not applicable.
Acknowledgments
The authors would like to thank PROLEC GE for allowing us to model one of their distribution transformers, as well as the use of their design system tool for the corresponding analysis. This work was supported by the Ministry of Public Education of Mexico in accordance with the financial support of the PRODEP project Fortalecimiento de Cuerpos Académicos 2019 UANL-CA-432.
Conflicts of Interest
The authors declare no conflict of interest.
Nomenclature
| Abbreviation | Definition |
| B | Magnetic Flux Density |
| FEM | Finite Element Modeling |
| Correction Factor for Winding Eddy–Current Losses | |
| Correction Factor for Other Stray Losses | |
| HV | High Voltage |
| Current | |
| Resistance | |
| LV | Low Voltage |
| MMF | Manufacturer Material Factor |
| Losses | |
| Winding Eddy–Current Losses | |
| Per-unit Winding Eddy–Current Losses | |
| Winding Eddy–Current Losses when no Harmonic Currents exist | |
| Total Losses of a Transformer | |
| Per-unit Load Losses | |
| No Load Losses | |
| Other Stray Losses | |
| Per-unit Other Stray Losses | |
| Per-unit Total Stray Losses | |
| PV | Photovoltaic |
| RMS | Root Mean Square or Effective |
| Apparent Power | |
| SPG | Solar Power Generation |
| SPP | Solar Power Plant |
| Voltage | |
| W | Watts |
| WPP | Wind Power Plants |
Appendix A
Table A1.
Inverter data.
Table A1.
Inverter data.
| AC Output Side | Rated Power | 2.7/2.7 | MW/MVA |
| AC Rated Voltage (3-Phase) | 600 + 10% | V | |
| Rated Frequency | 60/50 | Hz | |
| Rated Current | 2598 | A RMS | |
| Power Factor | 0.926 | Lead/Lag | |
| Maximum Current | 2598 | A RMS | |
| Maximum Efficiency | 98.80 | % | |
| Rated Efficiency | 98.50 | % | |
| DC Input Side | Maximum DC voltage | 1500 | V |
| DC Voltage operation range | 875–1200 | V |
Table A2.
Distribution transformer required data.
Table A2.
Distribution transformer required data.
| Distribution Transformer Data | ||
|---|---|---|
| Operation Configuration | Step-up low voltage input and high voltage output | |
| Rated Voltage | 34.5/0.630 | kV |
| Rated Power | 2.7 | MVA |
| Rise Temperature | 65 | °C |
| Rated Frequency | 60 | Hz |
| Impedance | 4.27 | % |
| Efficiency | 99.25 | % |
| Connection | Delta/Star-Grounded | |
| HV and LV Winding material | Aluminum |
Table A3.
Inverter data—harmonic profile.
Table A3.
Inverter data—harmonic profile.
| Harmonic Order | Phase A (A) | Phase A (%) | Phase B (A) | Phase B (%) | Phase C (A) | Phase C (%) |
|---|---|---|---|---|---|---|
| 1 | 2610.37 | 99.988 | 2572.83 | 99.981 | 2661.82 | 99.989 |
| 2 | 10.93 | 0.418 | 21.5 | 0.835 | 6.45 | 0.242 |
| 3 | 15.14 | 0.58 | 25.49 | 0.991 | 20.7 | 0.778 |
| 4 | 3.57 | 0.137 | 5.84 | 0.227 | 6.05 | 0.227 |
| 5 | 31.78 | 1.217 | 32.94 | 1.28 | 29.07 | 1.092 |
| 6 | 1.51 | 0.058 | 1.86 | 0.072 | 1.16 | 0.044 |
| 7 | 9.96 | 0.382 | 9.89 | 0.384 | 11.33 | 0.426 |
| 8 | 3.9 | 0.149 | 2.06 | 0.08 | 2.48 | 0.093 |
| 9 | 0.8 | 0.031 | 1.03 | 0.04 | 1.69 | 0.064 |
| 10 | 0.3 | 0.011 | 2.24 | 0.087 | 1.93 | 0.073 |
| 11 | 4.81 | 0.184 | 5.0 | 0.195 | 4.4 | 0.165 |
| 12 | 0.86 | 0.033 | 1.02 | 0.04 | 0.76 | 0.028 |
| 13 | 1.31 | 0.05 | 0.77 | 0.03 | 1.47 | 0.055 |
| 14 | 0.19 | 0.007 | 1.94 | 0.075 | 2.12 | 0.08 |
| 15 | 0.5 | 0.019 | 1.04 | 0.04 | 1.23 | 0.046 |
| 16 | 1.18 | 0.045 | 1.08 | 0.042 | 2.01 | 0.075 |
| 17 | 2.27 | 0.087 | 3.05 | 0.118 | 0.77 | 0.029 |
| 18 | 0.75 | 0.029 | 0.22 | 0.009 | 0.94 | 0.035 |
| 19 | 2.53 | 0.097 | 4.09 | 0.159 | 2.91 | 0.109 |
| 20 | 2.9 | 0.111 | 1.69 | 0.066 | 1.67 | 0.063 |
| 21 | 1.08 | 0.041 | 1.02 | 0.04 | 0.07 | 0.003 |
| 22 | 3.34 | 0.128 | 3.78 | 0.147 | 3.22 | 0.121 |
| 23 | 0.9 | 0.034 | 1.16 | 0.045 | 0.43 | 0.016 |
| 24 | 0.13 | 0.005 | 0.43 | 0.017 | 0.46 | 0.017 |
| 25 | 0.63 | 0.024 | 0.57 | 0.022 | 0.46 | 0.017 |
| 26 | 1.76 | 0.067 | 2.15 | 0.084 | 2.02 | 0.076 |
| 27 | 0.24 | 0.009 | 0.27 | 0.011 | 0.31 | 0.011 |
| 28 | 0.54 | 0.021 | 0.98 | 0.038 | 0.89 | 0.034 |
| 29 | 0.22 | 0.008 | 0.25 | 0.01 | 0.05 | 0.002 |
| 30 | 0.09 | 0.003 | 0.26 | 0.01 | 0.28 | 0.011 |
| 31 | 0.09 | 0.003 | 0.11 | 0.004 | 0.05 | 0.002 |
| 32 | 0.22 | 0.009 | 0.21 | 0.008 | 0.32 | 0.012 |
| 33 | 0.12 | 0.005 | 0.02 | 0.001 | 0.15 | 0.006 |
| 34 | 0.05 | 0.002 | 0.22 | 0.009 | 0.21 | 0.008 |
| 35 | 0.03 | 0.001 | 0.07 | 0.003 | 0.08 | 0.003 |
| 36 | 0.17 | 0.006 | 0.14 | 0.005 | 0.16 | 0.006 |
| 37 | 0.13 | 0.005 | 0.23 | 0.009 | 0.19 | 0.007 |
| 38 | 0.19 | 0.007 | 0.26 | 0.01 | 0.18 | 0.007 |
| 39 | 0.05 | 0.002 | 0.06 | 0.002 | 0.08 | 0.003 |
| 40 | 0.1 | 0.004 | 0.25 | 0.01 | 0.25 | 0.01 |
| 41 | 0.12 | 0.005 | 0.1 | 0.004 | 0.15 | 0.006 |
| 42 | 0.07 | 0.002 | 0.04 | 0.001 | 0.03 | 0.001 |
| 43 | 0.1 | 0.004 | 0.12 | 0.005 | 0.07 | 0.003 |
| 44 | 0.25 | 0.01 | 0.22 | 0.009 | 0.24 | 0.009 |
| 45 | 0.06 | 0.002 | 0.08 | 0.003 | 0.01 | 0 |
| 46 | 0.81 | 0.031 | 0.94 | 0.037 | 0.81 | 0.03 |
| 47 | 0.06 | 0.002 | 0.06 | 0.002 | 0.06 | 0.002 |

Figure A1.
Magnetization curves of selected transformer magnetic core: (a) magnetization curve (hysteresis); (b) magnetization curve (material quantity relationship).
Figure A1.
Magnetization curves of selected transformer magnetic core: (a) magnetization curve (hysteresis); (b) magnetization curve (material quantity relationship).

References
- Said, D.M.; Nor, K.M. Effects of harmonics on distribution transformers. In Proceedings of the 2008 Australasian Universities Power Engineering Conference (AUPEC’08), Sydney, Australia, 14–17 December 2008. [Google Scholar]
- IEEE Std. C. 57-110. IEEE Recommended Practice for Establishing Liquid-Filled and Dry-Type Power and Distribution Transformer Capability When Supplying Non-Sinusoidal Load Currents; IEEE Press and Publication: Piscataway, NJ, USA, 2018; pp. 1–68. [Google Scholar]
- Yazdani-Asramia, M.; Mirzaiea, M.; Akmal, A.A.S. Investigation on Impact of Current Harmonic Contents on the Distribution Transformer Losses and Remaining Life. In Proceedings of the IEEE International Conference on Power and Energy (PECon2010), Kuala Lumpur, Malaysia, 29 November–1 December 2010. [Google Scholar]
- Yazdani-Asrami, M.; Sadati, S.M.B.; Samadaei, E. Harmonic Study for MDF Industries: A Case Study. In Proceedings of the IEEE Applied Power Electronics Colloquium (IAPEC), Johor Bahru, Malaysia, 18–19 April 2011. [Google Scholar]
- Yazdani-Asrami, M.; Song, W.; Zhang, M.; Yuan, W.; Pei, X. AC Transport Loss in Superconductors Carrying Harmonic Current with Different Phase Angles for Large-Scale Power Components. IEEE Trans. Appl. Supercond. 2021, 31, 1–5. [Google Scholar] [CrossRef]
- Sadati, S.B.; Yazdani-Asrami, M.; Taghipour, M. Effects of Harmonic Current Content and Ambient Temperature on Load Ability and Life Time of Distribution Transformers. Int. Rev. Electr. Eng. 2010, 5, 1444–1451. [Google Scholar]
- Mirzaie, M.; Yazdani-Asrami, M.; Sadati, S.B.; Akmal, A.S. Impacts of Non-Sinusoidal Load Currents on Distribution Transformer Losses-Part I: Theoretical Aspects and Finite Element Based Simulation. Int. Rev. Electr. Eng. 2011, 6, 2207–2214. [Google Scholar]
- Mirzaie, M.; Yazdani-Asrami, M.; Sadati, S.B.; Akmal, A.S. Impacts of Non-Sinusoidal Load Currents on Distribution Transformer Losses-Part II: Standard Aspects and Experimental Measurement. Int. Rev. Electr. Eng. 2011, 6, 2215–2220. [Google Scholar]
- Yazdani-Asrami, M.; Mirzaiea, M.; Akmal, A.A.S. No-load loss calculation of distribution transformers supplied by nonsinusoidal voltage using three-dimensional finite element analysis. Energy 2013, 50, 205–219. [Google Scholar] [CrossRef]
- Daut, I.; Hasan, S.; Taib, S. Magnetizing Current, Harmonic Content and Power Factor as the Indicators of Transformer Core Saturation. J. Clean Energy Technol. 2013, 1, 304–307. [Google Scholar] [CrossRef]
- Jayasinghe, N.R.; Lucas, J.R.; Perera, K.B.I.M. Power System Harmonic Effects on Distribution Transformers and New Design Consideration for k Factor Transformers; IEE Sri Lanka Annual Sessions; Lanka Transformers Ltd.: Moratuwa, Sri Lanka; University of Moratuwa Lanka: Moratuwa, Sri Lanka, September 2003. [Google Scholar]
- Zeraatparvar, A.; Sami, T.; Raheli, F.A. Evaluation of performance of distribution transformers supplying non linear loads currents: Effect of oversizing. In Proceedings of the 2011 10th International Conference on Environment and Electrical Engineering, Rome, Italy, 8–11 May 2011. [Google Scholar]
- Wijayapala, W.D.A.S.; Karunananda, H.S.C. Mitigation of Lightning Surge Stresses in the High Voltage Windings of Distribution Transformers by Introducing an Electrostatic Shield. Eng. J. Inst. Eng. 2015, XLVIII, 1–11. [Google Scholar] [CrossRef]
- Shneider Electric USA Inc. Transformer Electrostatic Shields. Data Bulletin. Available online: https://download.schneider-electric.com/files?p_enDocType=Data+Bulletin&p_File_Name=0150DB1601.pdf&p_Doc_Ref=0150DB1601 (accessed on 22 October 2020).
- Semantic Scholar. The Effects of Harmonics Produced by Grid Connected Photovoltaic Systems on Electrical Networks. Available online: https://www.semanticscholar.org/paper/THE-EFFECTS-OF-HARMONICS-PRODUCED-BY-GRID-CONNECTED-%C3%87elebi-%C3%87olak/d6d99baec1526ebeab0ace33930796b0d6b9c2a8 (accessed on 10 June 2019).
- Awadallah, M.; Venkatesh, B.; Singh, B. Impact of Solar Panels on Power Quality of Distribution Networks and Transformers. Can. J. Electr. Comput. Eng. 2015, 38, 45–51. [Google Scholar] [CrossRef]
- Queiroz, H.; Lopes, R.A.; Martins, J. Automated energy storage and curtailment system to mitigate distribution transformer aging due to high renewable energy penetration. Electr. Power Syst. Res. 2020, 182, 106199. [Google Scholar] [CrossRef]
- Fortes, R.R.A.; Buzo, R.F.; de Oliveira, L.C.O. Harmonic distortion assessment in power distribution networks considering DC component injection from PV inverters. Electr. Power Syst. Res. 2020, 188, 106521. [Google Scholar] [CrossRef]
- Ayub, M.; Gan, C.K.; Fazliana, A.; Kadir, A. The impact of grid-connected PV systems on Harmonic Distortion. In Proceedings of the 2014 IEEE Innovative Smart Grid Technologies—Asia (ISGT ASIA), Kuala Lumpur, Malaysia, 20–23 May 2014. [Google Scholar]
- Gray, M.K.; Morsi, W.G. On the impact of single-phase plug-in electric vehicles charging and rooftop solar photovoltaic on distribution transformer aging. Electr. Power Syst. Res. 2017, 148, 202–209. [Google Scholar] [CrossRef]
- Bodger, P.S.; Liew, M.C.; Johnstone, P.T. A Comparison of Conventional and Reverse Transformer Design. In Proceedings of the Australasian Universities Power Engineering Conference (AUPEC), Brisbane, Australia, 24–27 September 2000. [Google Scholar]
- Iwashita, T.; Mifune, T.; Shimasaki, M. Similarities between Implicit Correction Multigrid Method and Formulation in Electromagnetic Field Analysis. IEEE Trans. Magn. 2008, 44, 946–949. [Google Scholar] [CrossRef]
- Sarrate, J.; Clarisó, R. El Método de los Elementos Finitos en problemas electromagnéticos: Planteamiento y aplicaciones. Rev. Int. Métod. Numéri. Cálculo Diseño de Ing. 2001, 17, 219–248. [Google Scholar]
- Krishnan, R.; Nair, K.R.M. Transformer for Distributed Photovoltaic (DPV) Generation. In Proceedings of the 2018 International Conference on Electrical, Electronics, Communication, Computer, and Optimization Techniques (ICEECCOT), Msyuru, India, 14–15 December 2018. [Google Scholar]


Publisher’s Note: MDPI stays neutral with regard to jurisdictional claims in published maps and institutional affiliations. |
© 2021 by the authors. Licensee MDPI, Basel, Switzerland. This article is an open access article distributed under the terms and conditions of the Creative Commons Attribution (CC BY) license (http://creativecommons.org/licenses/by/4.0/).