A Novel Data Management Methodology and Case Study for Monitoring and Performance Analysis of Large-Scale Ground Source Heat Pump (GSHP) and Borehole Thermal Energy Storage (BTES) System
Abstract
:1. Introduction
2. Materials and Methods
2.1. Description of the University Complex
2.2. GSHP–BTES Tandem as Core of the Energy System
2.3. Measurements, Monitoring Equipment, and Performance Indicators
2.3.1. Power Meters
2.3.2. Thermal Energy Meters
- The accuracy of energy meters depends on different factors: errors related to the flow, sensors’ delta T, calculator, quality of installation, proximity to disturbances and pumps, dirt in fluid, gas entrainment, sampling interval, etc. [19].
- ANCC meters record data only once per hour regarding flow, temperature, and energy (instead of doing it more frequently, with reduced sampling interval). This can generate significant errors, which are difficult to estimate without calibration.
- The location of most of the energy meters is far away (sometimes hundreds of meters of pipe connections) from the main HVAC room; thus, heat losses/gains in distribution pipes and heat exchangers are not accounted for and can introduce additional errors.
2.3.3. Seasonal Performance Factors (SPF)
2.3.4. Calculation of Heat Pump COP
2.4. Measured Data Management through Uncertainty Factors
2.4.1. Uncertainty Factors
2.4.2. Optimization Problem for Data Management
- , where
- , ≥ 0 (non-negative condition)
- Evaporator side: Qspa-cool,12 = −1020; QAHU-cool,12 = 0; QBTES,12 = −9345
- Condenser side: Qspa-heat,12 = 9458; QAHU-heat,12 = 6385; Qsnow-melt,12 = 97; QDH,12 = 655; Qdiss,12 = 0
- GSHP power demand: WHP,12 = 4360
- fcool,12 = 1.0028; fBTES,12 = 1.0256; fheat,12 = 0.9801; fdiss,12 = 1; Qcond,12 = 14967
- Qspa-cool,12 = −1020 × 1.0028 = −1023; QAHU-cool,12 = 0 × 1.0028 = 0
- QBTES,12 = −9345 × 1.0256 = −9584
- Qspa-heat,12 = 9458 × 0.9801 = 9269; QAHU-heat,12 = 6385 × 0.9801 = 6258; Qsnow-melt,12 = 97 × 0.9801 = 95
- Qdiss,12 = 0 × 1 = 0
- Evaporator: −1023 − 9584 + 10607 = 0
- Condenser: 14967 + 655 − (9269 + 6258 + 95) − 0 = 0
2.5. Reconstruction of Missing Data Measurements
2.5.1. HVAC Pumps
- Pumps of the BTES field account for more than half of the total consumption (51%).
- All pumps on the BTES and heating circuits are used very intensively for around 64–70% of the time of the studied period, followed by space cooling (44–45%).
- Pumps on the AHU-cooling circuit (used only during the summer period) are active for around 12% of the time, indicating that summer mode is very short.
- Dissipation pumps are used very sporadically, only for 4% of the time.
2.5.2. BTES Field and Dissipation
3. Results and Discussion
3.1. Raw Measured Data
3.2. Results and Analysis of the Evaporator Side
3.3. Results and Analysis of the Condenser Side
3.4. Results and Analysis of the Uncertainty Factors
3.5. Performance of the Energy System
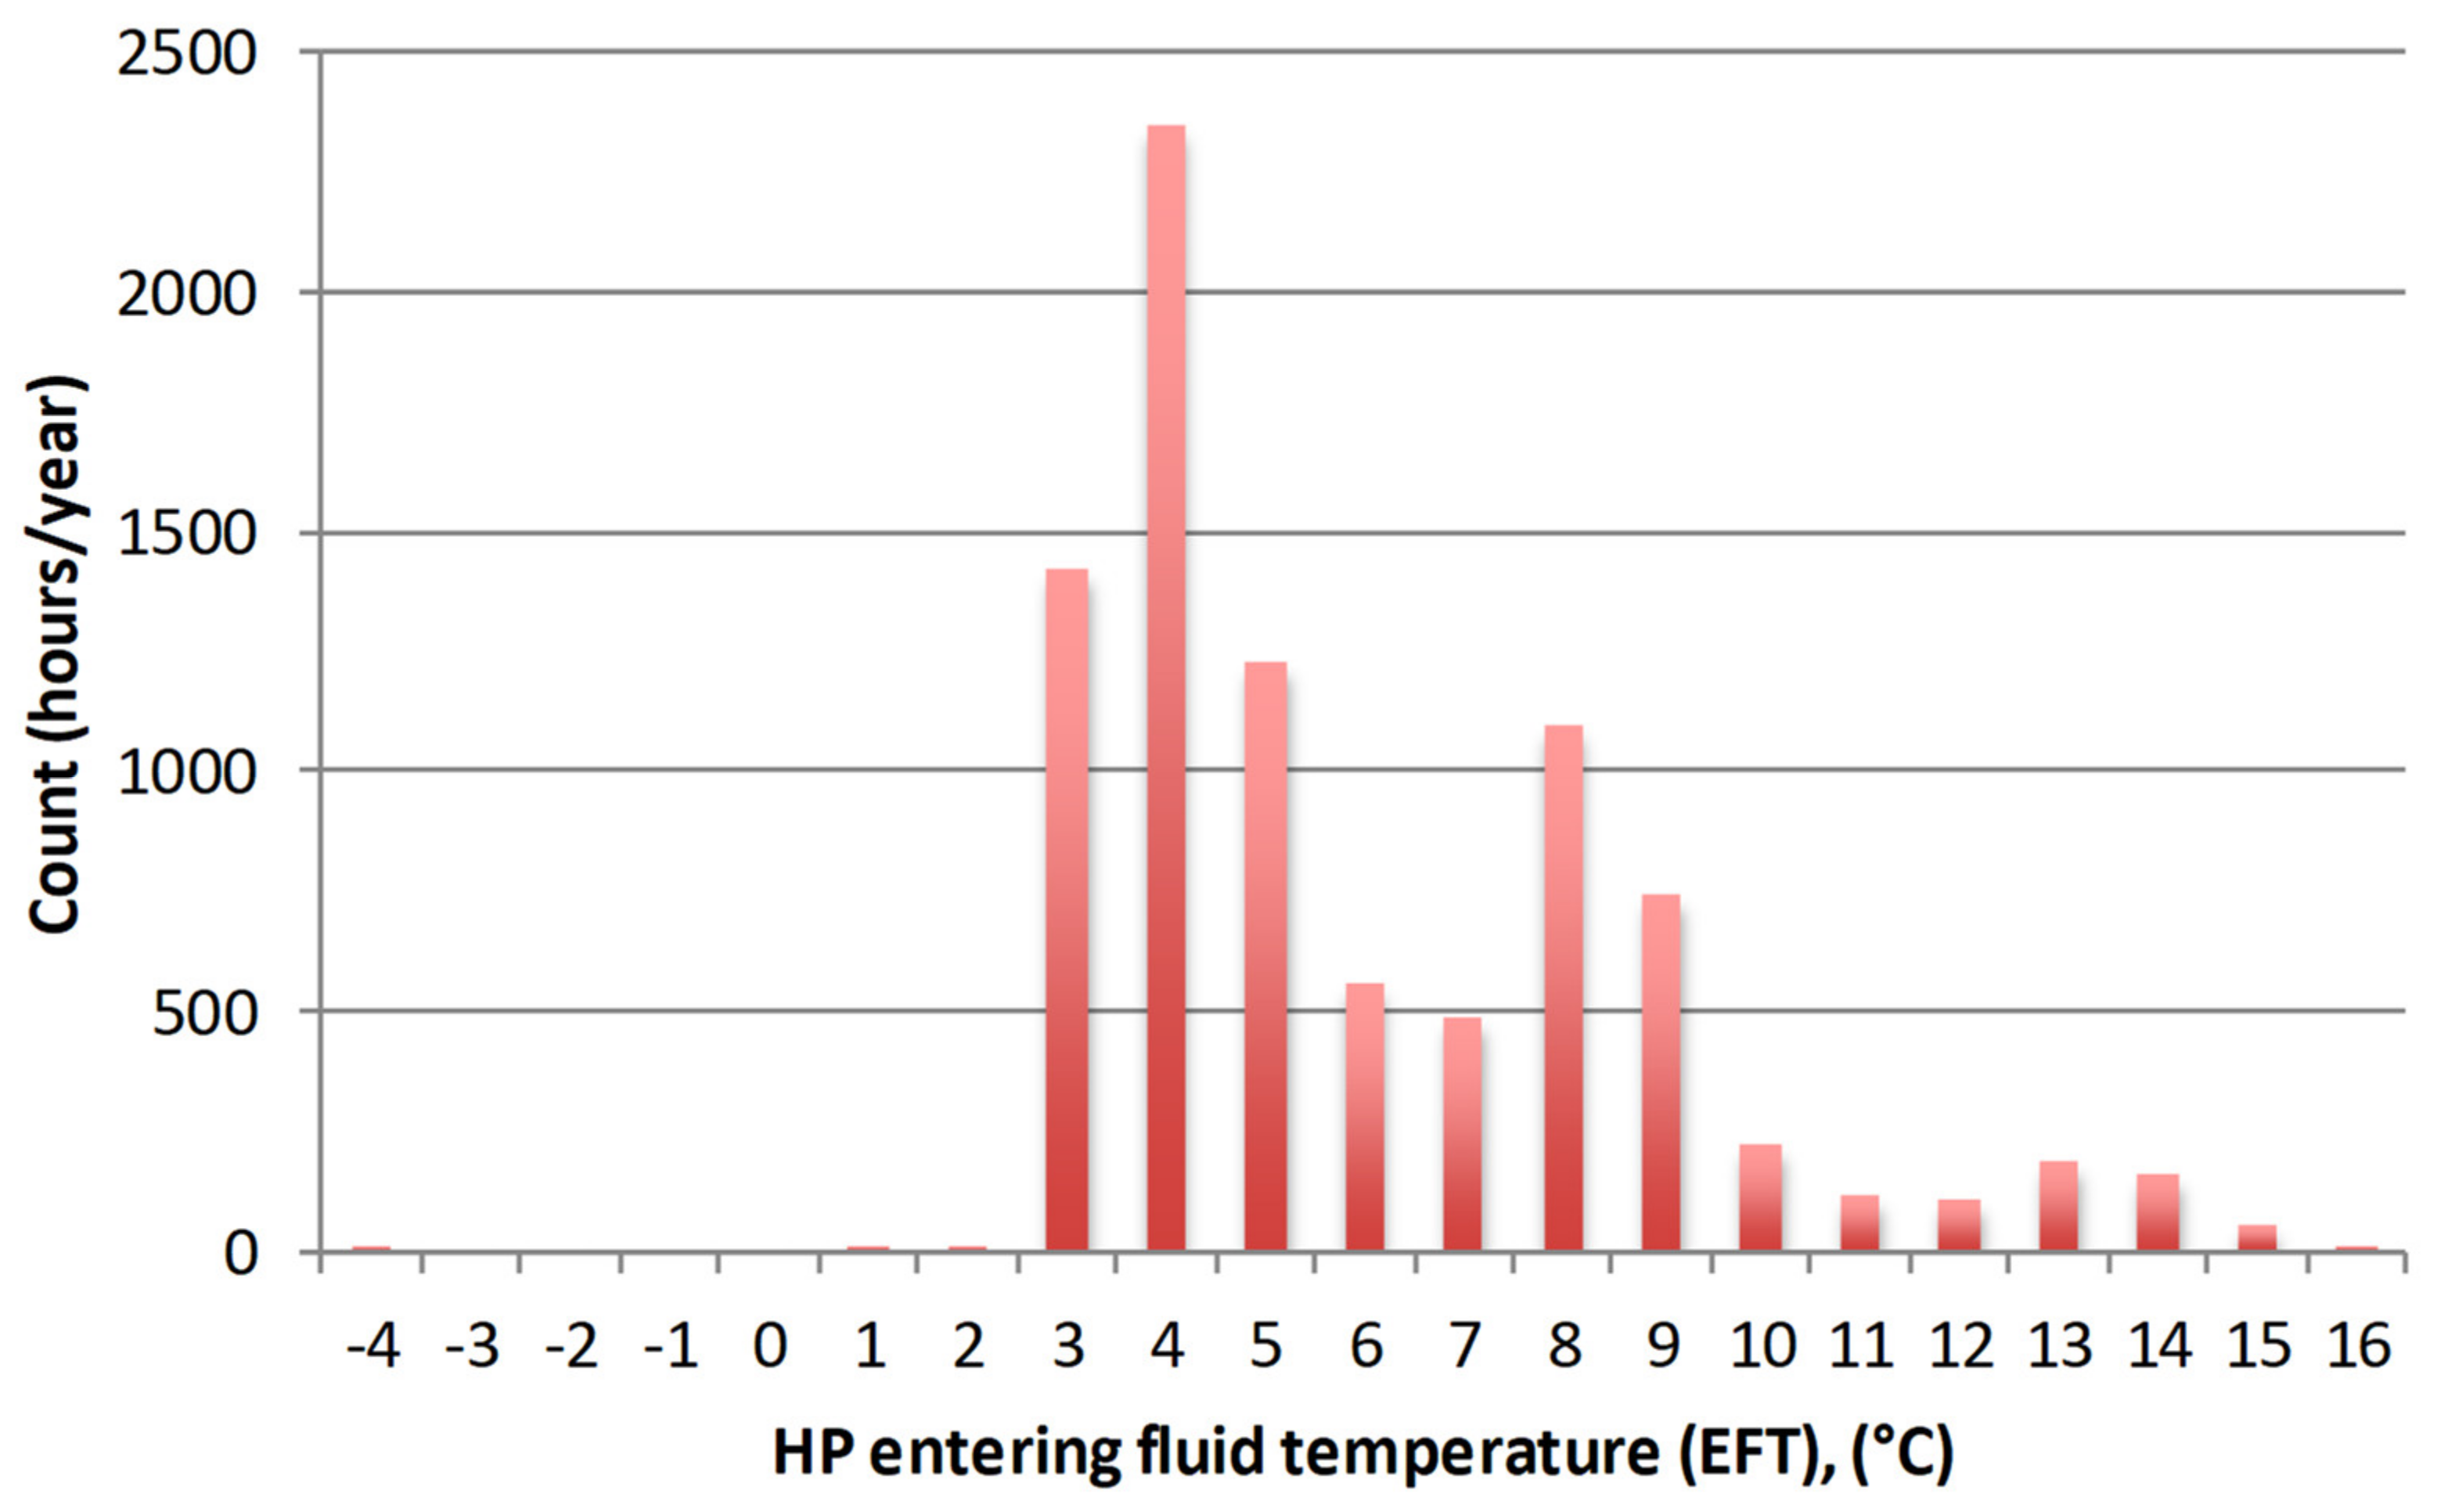
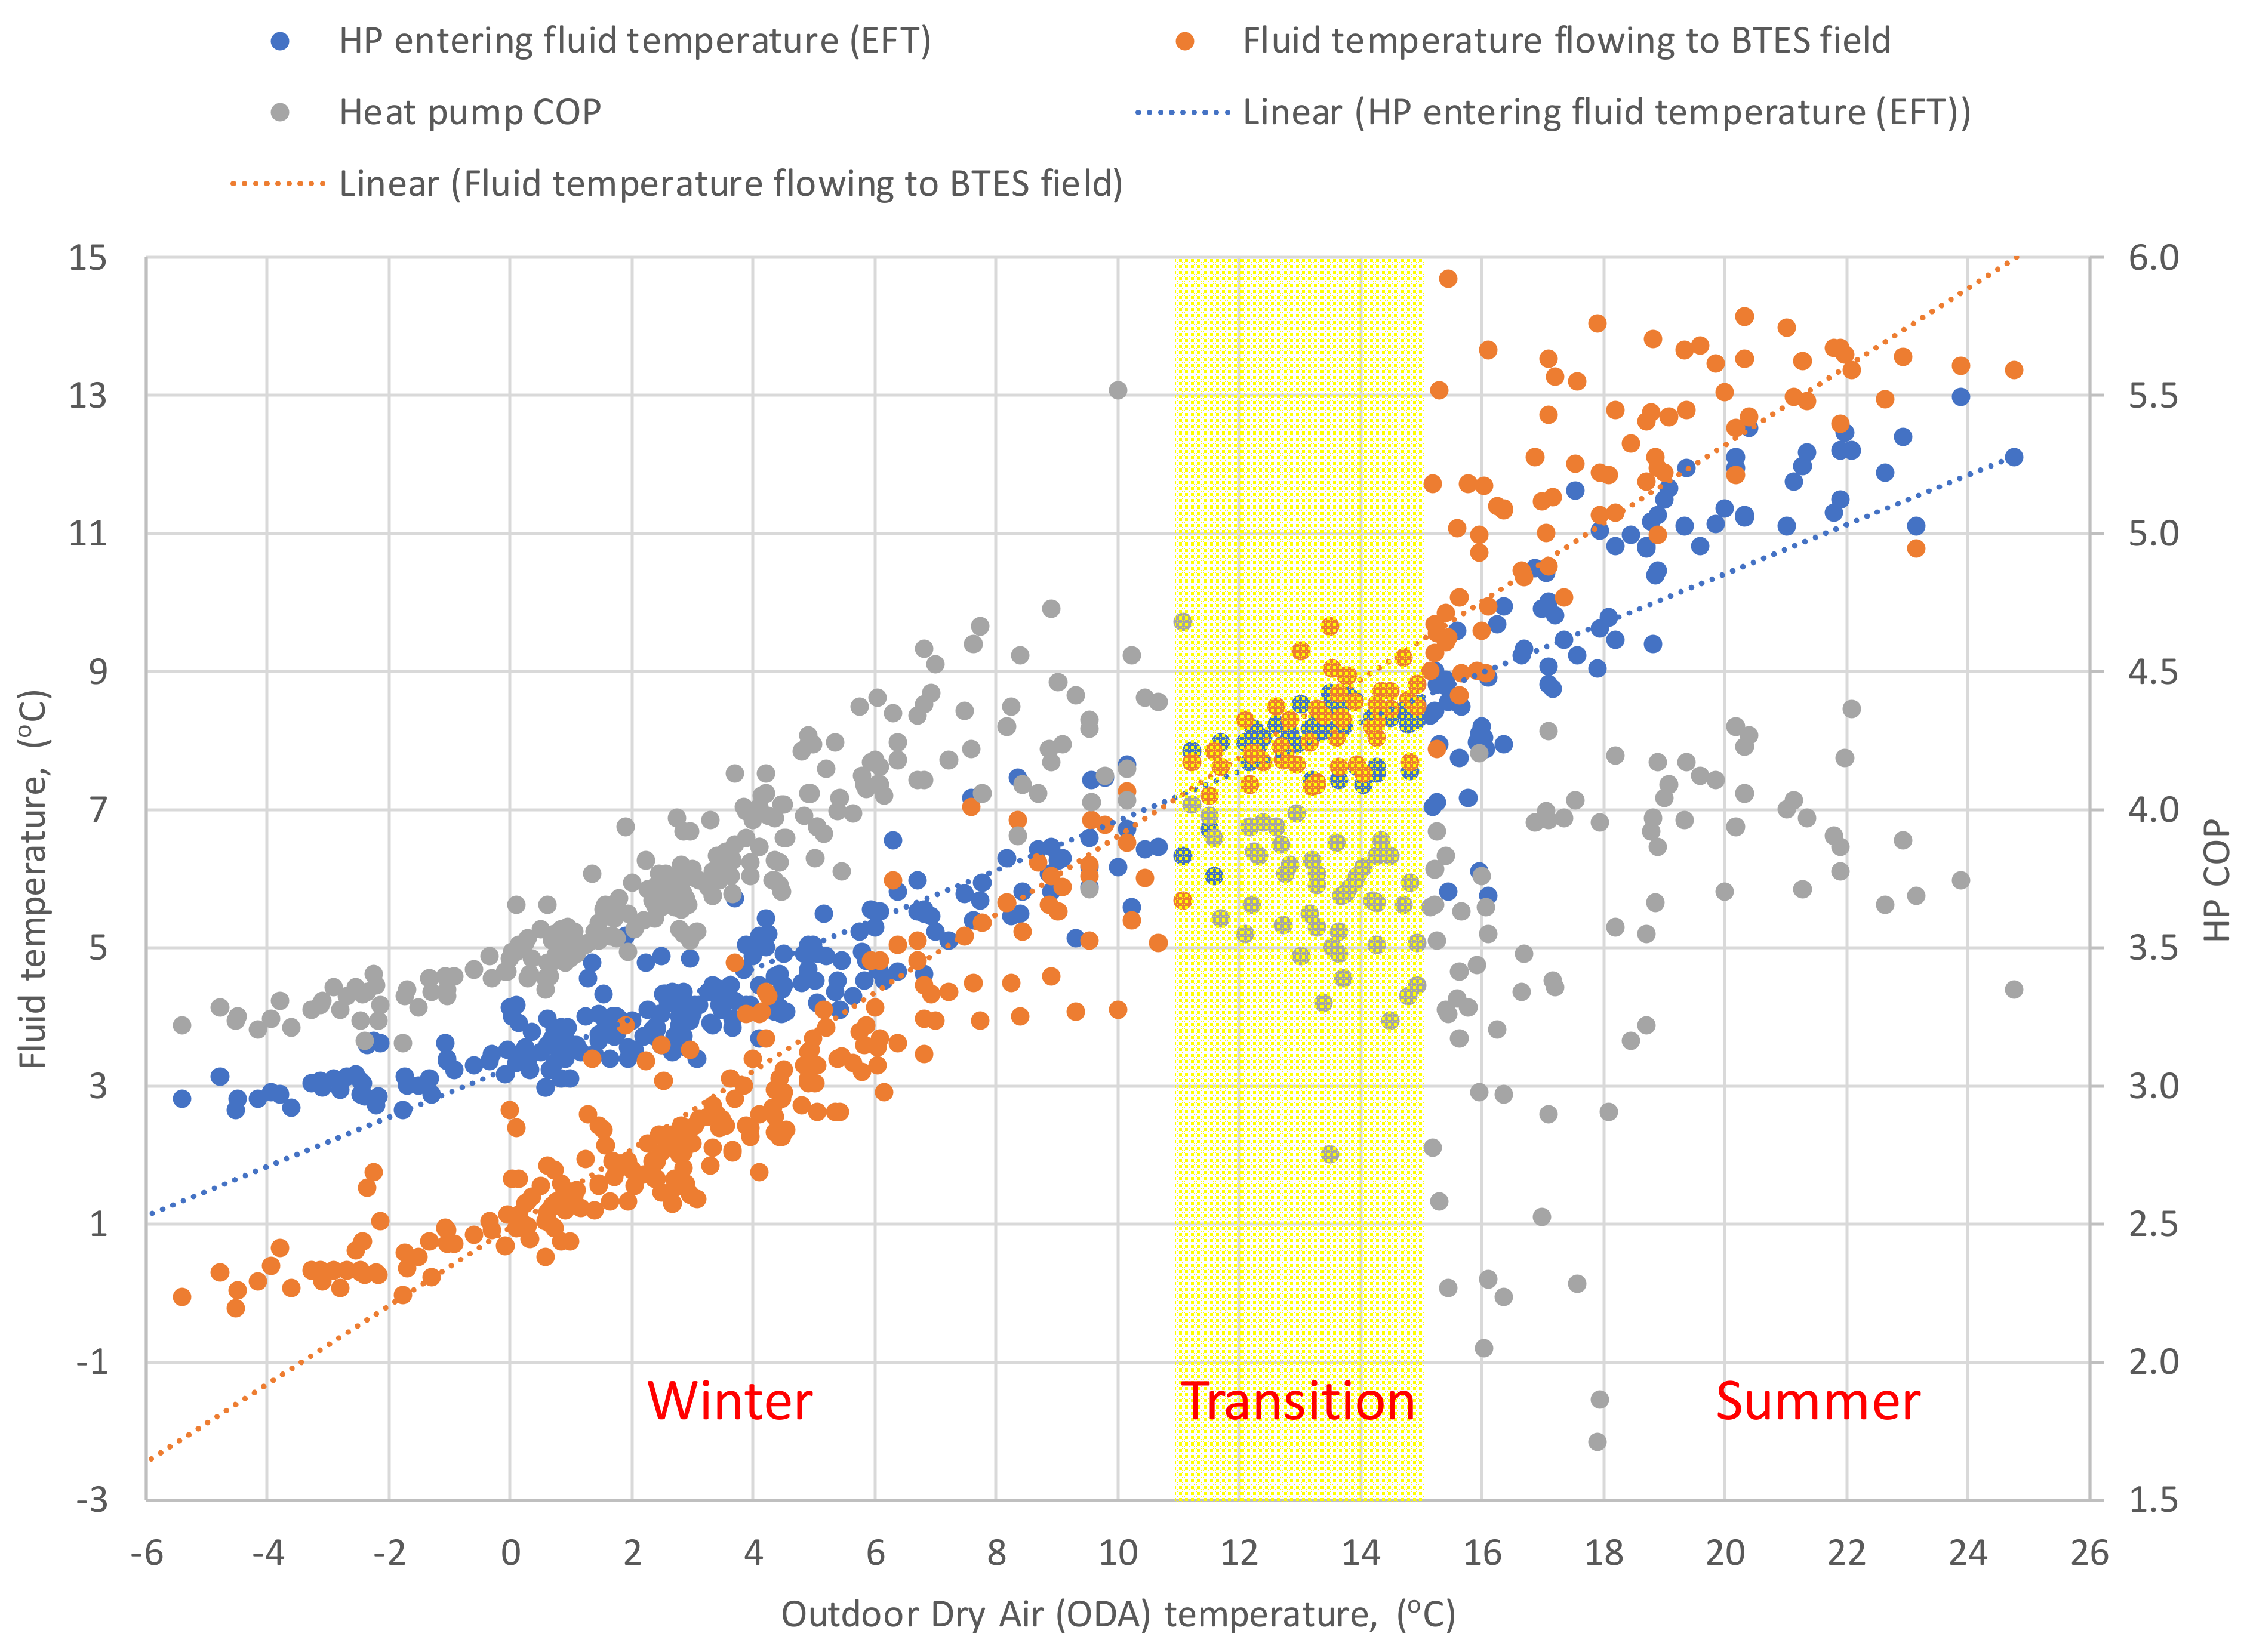
3.6. GSHP Entering Fluid Temperature (EFT)
3.7. Heat Pump COP
3.8. Effect of GSHP Partial Load Operation
4. Conclusions
Author Contributions
Funding
Institutional Review Board Statement
Informed Consent Statement
Data Availability Statement
Acknowledgments
Conflicts of Interest
Abbreviations
| AHU | Air Handling Unit |
| ANCC | Aalto New Campus Complex |
| BTES | Borehole Thermal Energy Storage |
| CP | Circulation Pump |
| COP | Coefficient of Performance |
| COPCar | Carnot COP |
| COPLor | Lorentz COP |
| DH | District Heating |
| DHW | Domestic Hot Water |
| DVR | Data Validation and Reconciliation |
| EFT | Entering Fluid Temperature (GSHP evaporator) |
| GRGGSHP | Generalized Reduced GradientGround Source Heat pump |
| HP | Heat Pump |
| HVAC | Heat, Ventilation, and Air Conditioning |
| ODA | Outdoor Dry Air Temperature |
| SPF | Seasonal Performance Factor |
| SEPEMO | Seasonal Performance factor and Monitoring for heat pump systems |
| VFD | Variable Frequency Drive |
| UTES | Underground Thermal Energy Storage |
Nomenclature
| CFF (-) | Combined frequency factor |
| FP (%) | Frequency percentage (pumps) |
| ∑QHP,cond (MWh) | Sum of HP condenser loads |
| ∑Qheat (MWh) | Sum of total heating demand |
| ∑QDH,heat (MWh) | Sum of DH input for heating |
| ∑Qnet,heat (MWh) | Sum of total net heating demand |
| ∑Qcool (MWh) | Sum of total cooling demand |
| ∑WHP (MWh) | Sum of HP power demand (additional indices indicate its allocation for heating and cooling, respectively) |
| ∑WCP,BTES (MWh) | Sum of BTES CP power demand (additional indices indicate its allocation for heating and cooling, respectively) |
| fcool,i, fBTES,i (-) | Uncertainty factors for total cooling demand and BTES loads |
| fheat,i, fdiss,i (-) | Uncertainty factors for total heating demand and dissipation loads |
| ∆cond,i (-) | Relative error on the condenser side |
| ∆evap,i (-) | Relative error on the evaporator side |
| Qcond,i (MWh) | Daily loads of the condenser (GSHP) |
| Qevap,i (MWh) | Daily loads of the evaporator (GSHP) |
| Qcool,i (MWh) | Measured daily total cooling demand |
| Qspa-cool,i (MWh) | Measured daily space cooling demand |
| QAHU-cool,i (MWh) | Measured daily AHU cooling demand |
| Qheat,i (MWh) | Measured daily total heating demand |
| Qspa-heat,i (MWh) | Measured daily space heating demand |
| QAHU-heat,i (MWh) | Measured daily AHU heating demand |
| Qsnow-melt,i (MWh) | Measured daily snow melting demand |
| QBTES,I (MWh) | Measured daily BTES loads |
| QDH,i (MWh) | Measured daily net DH input for heating |
| Qdiss,i (MWh) | Measured daily dissipation loads |
| WHP,i (MWh) | Measured daily GSHP power demand |
| WCP,BTES (MWh) | Measured daily power demand of BTES circulation pumps |
| THPE,I/THPE,O (K) | HP evaporator inlet/outlet temperature |
| THPC,S/THPC,R (K) | HP condenser supply/return temperature |
| Tlm,H/Tlm,L (K) | HP condenser/evaporator logarithmic mean temperature |
References
- BP Energy Outlook 2020 Edition. Available online: https://www.bp.com/content/dam/bp/business-sites/en/global/corporate/pdfs/energy-economics/energy-outlook/bp-energy-outlook-2020.pdf (accessed on 13 January 2021).
- Communication from the Commission to the European Parliament, the Council, the European Economic and Social Committee and the Committee of the Regions an eu Strategy on Heating and Cooling (COM/2016/051 final). Available online: https://eur-lex.europa.eu/legal-content/EN/TXT/?qid=1575551754568&uri=CELEX:52016DC0051 (accessed on 13 January 2021).
- Connolly, D.; Lund, H.; Mathiesen, B.; Werner, S.; Möller, B.; Persson, U.; Boermans, T.; Trier, D.; Østergaard, P.; Nielsen, S. Heat Roadmap Europe: Combining district heating with heat savings to decarbonise the EU energy system. Energy Policy 2014, 65, 475–489. [Google Scholar] [CrossRef]
- Todorov, O.; Alanne, K.; Virtanen, M.; Kosonen, R. Aquifer Thermal Energy Storage (ATES) for District Heating and Cooling: A Novel Modeling Approach Applied in a Case Study of a Finnish Urban District. Energies 2020, 13, 2478. [Google Scholar] [CrossRef]
- Zhang, Y.; Qi, H.; Zhou, Y.; Zhang, Z.; Wang, X. Exploring the Impact of a District Sharing Strategy on Application Capacity and Carbon Emissions for Heating and Cooling with GSHP Systems. Appl. Sci. 2020, 10, 5543. [Google Scholar] [CrossRef]
- Lund, J.W.; Toth, A.N. Direct utilization of geothermal energy 2020 worldwide review. Geothermics 2021, 90, 101915. [Google Scholar] [CrossRef]
- Kallio, J. Geothermal Energy Use, Country Update for Finland. Available online: http://europeangeothermalcongress.eu/wp-content/uploads/2019/07/CUR-10-Finland.pdf (accessed on 11 December 2020).
- Spitler, J.D.; Gehlin, S. Measured Performance of a Mixed-Use Commercial-Building Ground Source Heat Pump System in Sweden. Energies 2019, 12, 2020. [Google Scholar] [CrossRef] [Green Version]
- Spitler, J.D. Addressing the building energy performance gap with measurements. Sci. Technol. Built Environ. 2020, 26, 283–284. [Google Scholar] [CrossRef] [Green Version]
- Zhou, K.; Fu, C.; Yang, S. Big data driven smart energy management: From big data to big insights. Renew. Sustain. Energy Rev. 2016, 56, 215–225. [Google Scholar] [CrossRef]
- Nordman, R. Seasonal Performance Factor and Monitoring for Heat Pump Systems in the Building SectorSEPEMO-Build. Available online: https://ec.europa.eu/energy/intelligent/projects/sites/iee-projects/files/projects/documents/sepemo-build_final_report_sepemo_build_en.pdf (accessed on 11 January 2021).
- Heat Pumping Technologies MAGAZINE-Integration of Heat Pumps into the Future Energy System. Available online: https://issuu.com/hptmagazine/docs/hpt_magazine_no1_2020 (accessed on 25 January 2021).
- Naicker, S.S.; Rees, S.J. Performance analysis of a large geothermal heating and cooling system. Renew. Energy 2018, 122, 429–442. [Google Scholar] [CrossRef] [Green Version]
- Raftery, P.; Keane, M.; Costa, A. Calibrating whole building energy models: Detailed case study using hourly measured data. Energy Build. 2011, 43, 3666–3679. [Google Scholar] [CrossRef]
- Cuerda, E.; Guerra-Santin, O.; Sendra, J.J.; Neila, F.J. Understanding the performance gap in energy retrofitting: Measured input data for adjusting building simulation models. Energy Build. 2020, 209, 109688. [Google Scholar] [CrossRef]
- Yang, T.; Pan, Y.; Mao, J.; Wang, Y.; Huang, Z. An automated optimization method for calibrating building energy simulation models with measured data: Orientation and a case study. Appl. Energy 2016, 179, 1220–1231. [Google Scholar] [CrossRef]
- Szega, M. Methodology of advanced data validation and reconciliation application in industrial thermal processes. Energy 2020, 198, 117326. [Google Scholar] [CrossRef]
- Guo, S.; Liu, P.; Li, Z. Data reconciliation for the overall thermal system of a steam turbine power plant. Appl. Energy 2016, 165, 1037–1051. [Google Scholar] [CrossRef]
- Butler, D.; Abela, A.; Martin, C. Heat Meter Accuracy Testing (UK Government, Department for Business, Energy & Industrial Strategy). Available online: https://assets.publishing.service.gov.uk/government/uploads/system/uploads/attachment_data/file/576680/Heat_Meter_Accuracy_Testing_Final_Report_16_Jun_incAnxG_for_publication.pdf (accessed on 15 January 2021).
- Zottl, A.; Nordman, R.; Miara, M.; Huber, H. System boundaries for SPF calculation. In Proceedings of the 10th IEA Heat Pump Conference, Tokyo, Japan, 27 June–31 August 2011. [Google Scholar]
- Reinholdt, L.; Kristófersson, J.; Zühlsdorf, B.; Elmegaard, B.; Jensen, J.; Ommen, T.; Jørgensen, P.H. Heat pump COP, part 1: Generalized Method for Screening of System Integration Potentials. In Proceedings of the Refrigeration Science and Technology, Valencia, Spain, 18–20 June 2018. [Google Scholar]
- Finland Experiencing Mildest Winter in 100 Years. Available online: https://yle.fi/uutiset/osasto/news/finland_experiencing_mildest_winter_in_100_years/11160303 (accessed on 18 January 2021).
- Bockelmann, F.; Fisch, M.N. It Works—Long-Term Performance Measurement and Optimization of Six Ground Source Heat Pump Systems in Germany. Energies 2019, 12, 4691. [Google Scholar] [CrossRef]
- Luo, J.; Rohn, J.; Bayer, M.; Priess, A.; Wilkmann, L.; Xiang, W. Heating and cooling performance analysis of a ground source heat pump system in Southern Germany. Geothermics 2015, 53, 57–66. [Google Scholar] [CrossRef]
- Piechurski, K.; Szulgowska-Zgrzywa, M.; Danielewicz, J. The impact of the work under partial load on the energy efficiency of an air-to-water heat pump. In Proceedings of the E3S Web of Conferences, Boguszów-Gorce, Poland, 23–25 April 2017; EDP Sciences: Les Ulis, France, 2017; Volume 17, p. 72. [Google Scholar]
- Watanabe, C.; Ohashi, E.-I.; Hirota, M.; Nagamatsu, K.; Nakayama, H. Evaluation of Annual Performance of Multi-type Air-conditioners for Buildings. J. Therm. Sci. Technol. 2009, 4, 483–493. [Google Scholar] [CrossRef]
- Fahlén, P. Capacity control of heat pumps. REHVA J. 2012, 49, 28–31. [Google Scholar]
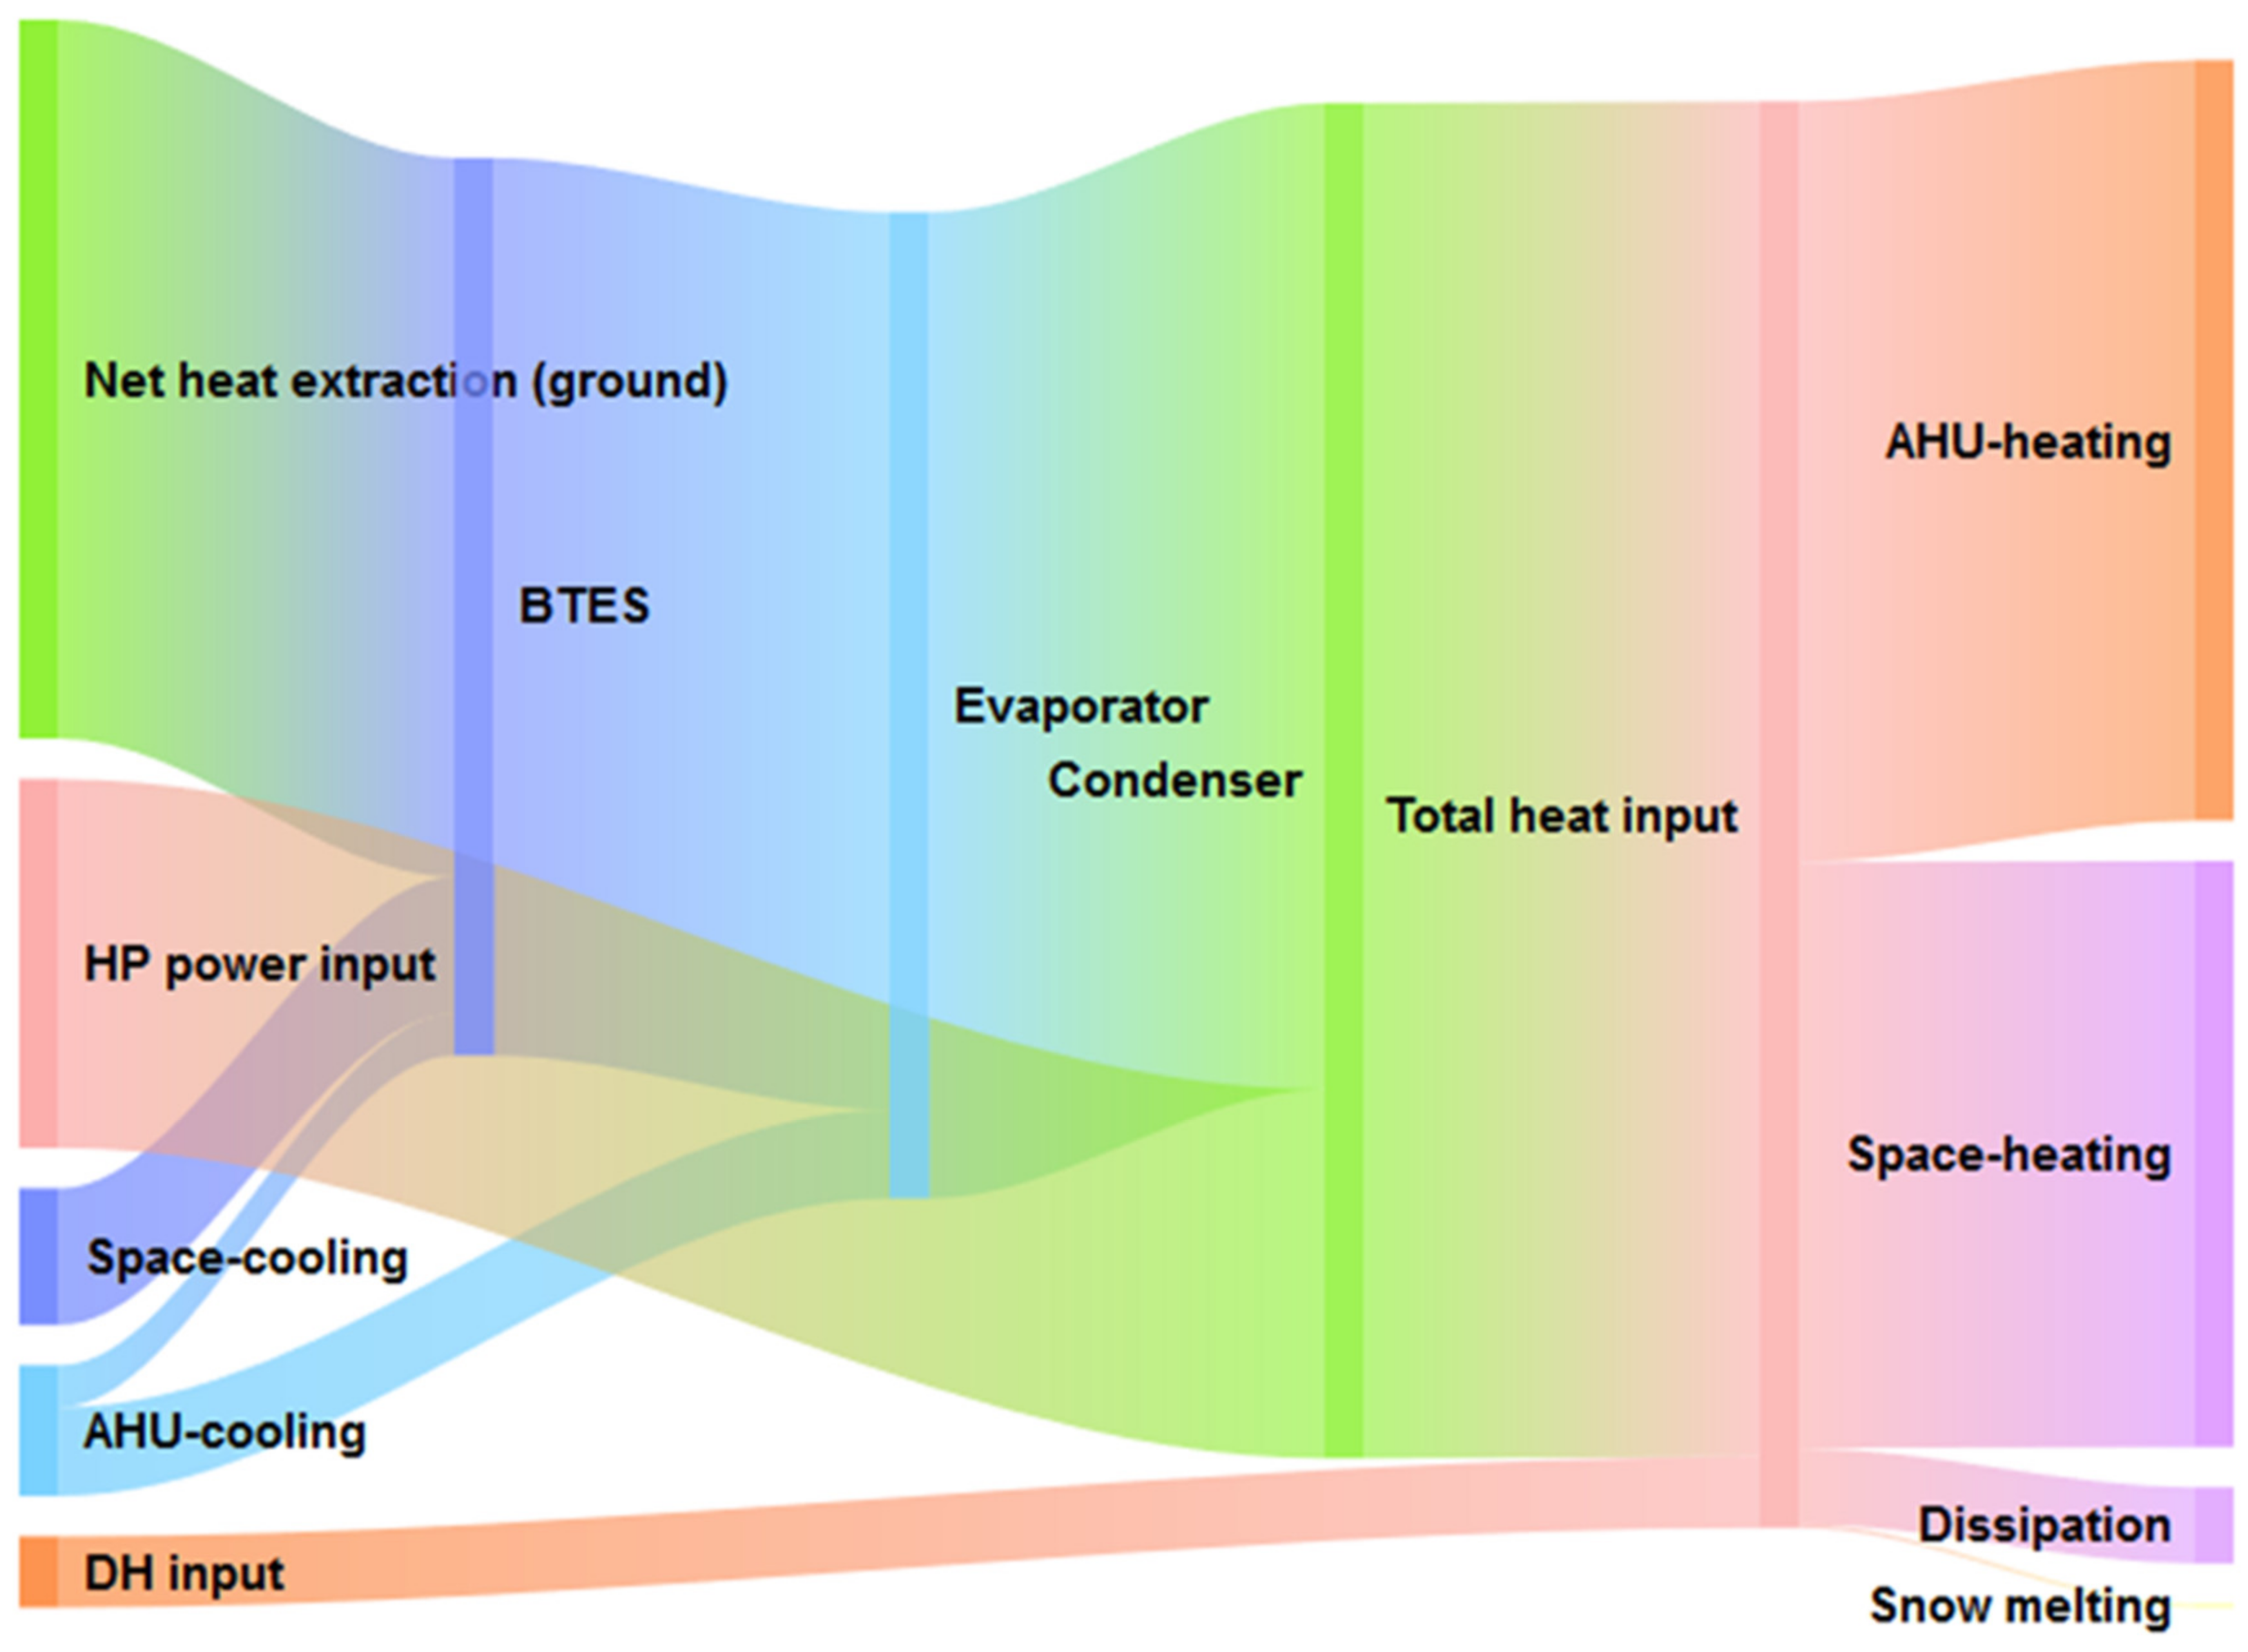

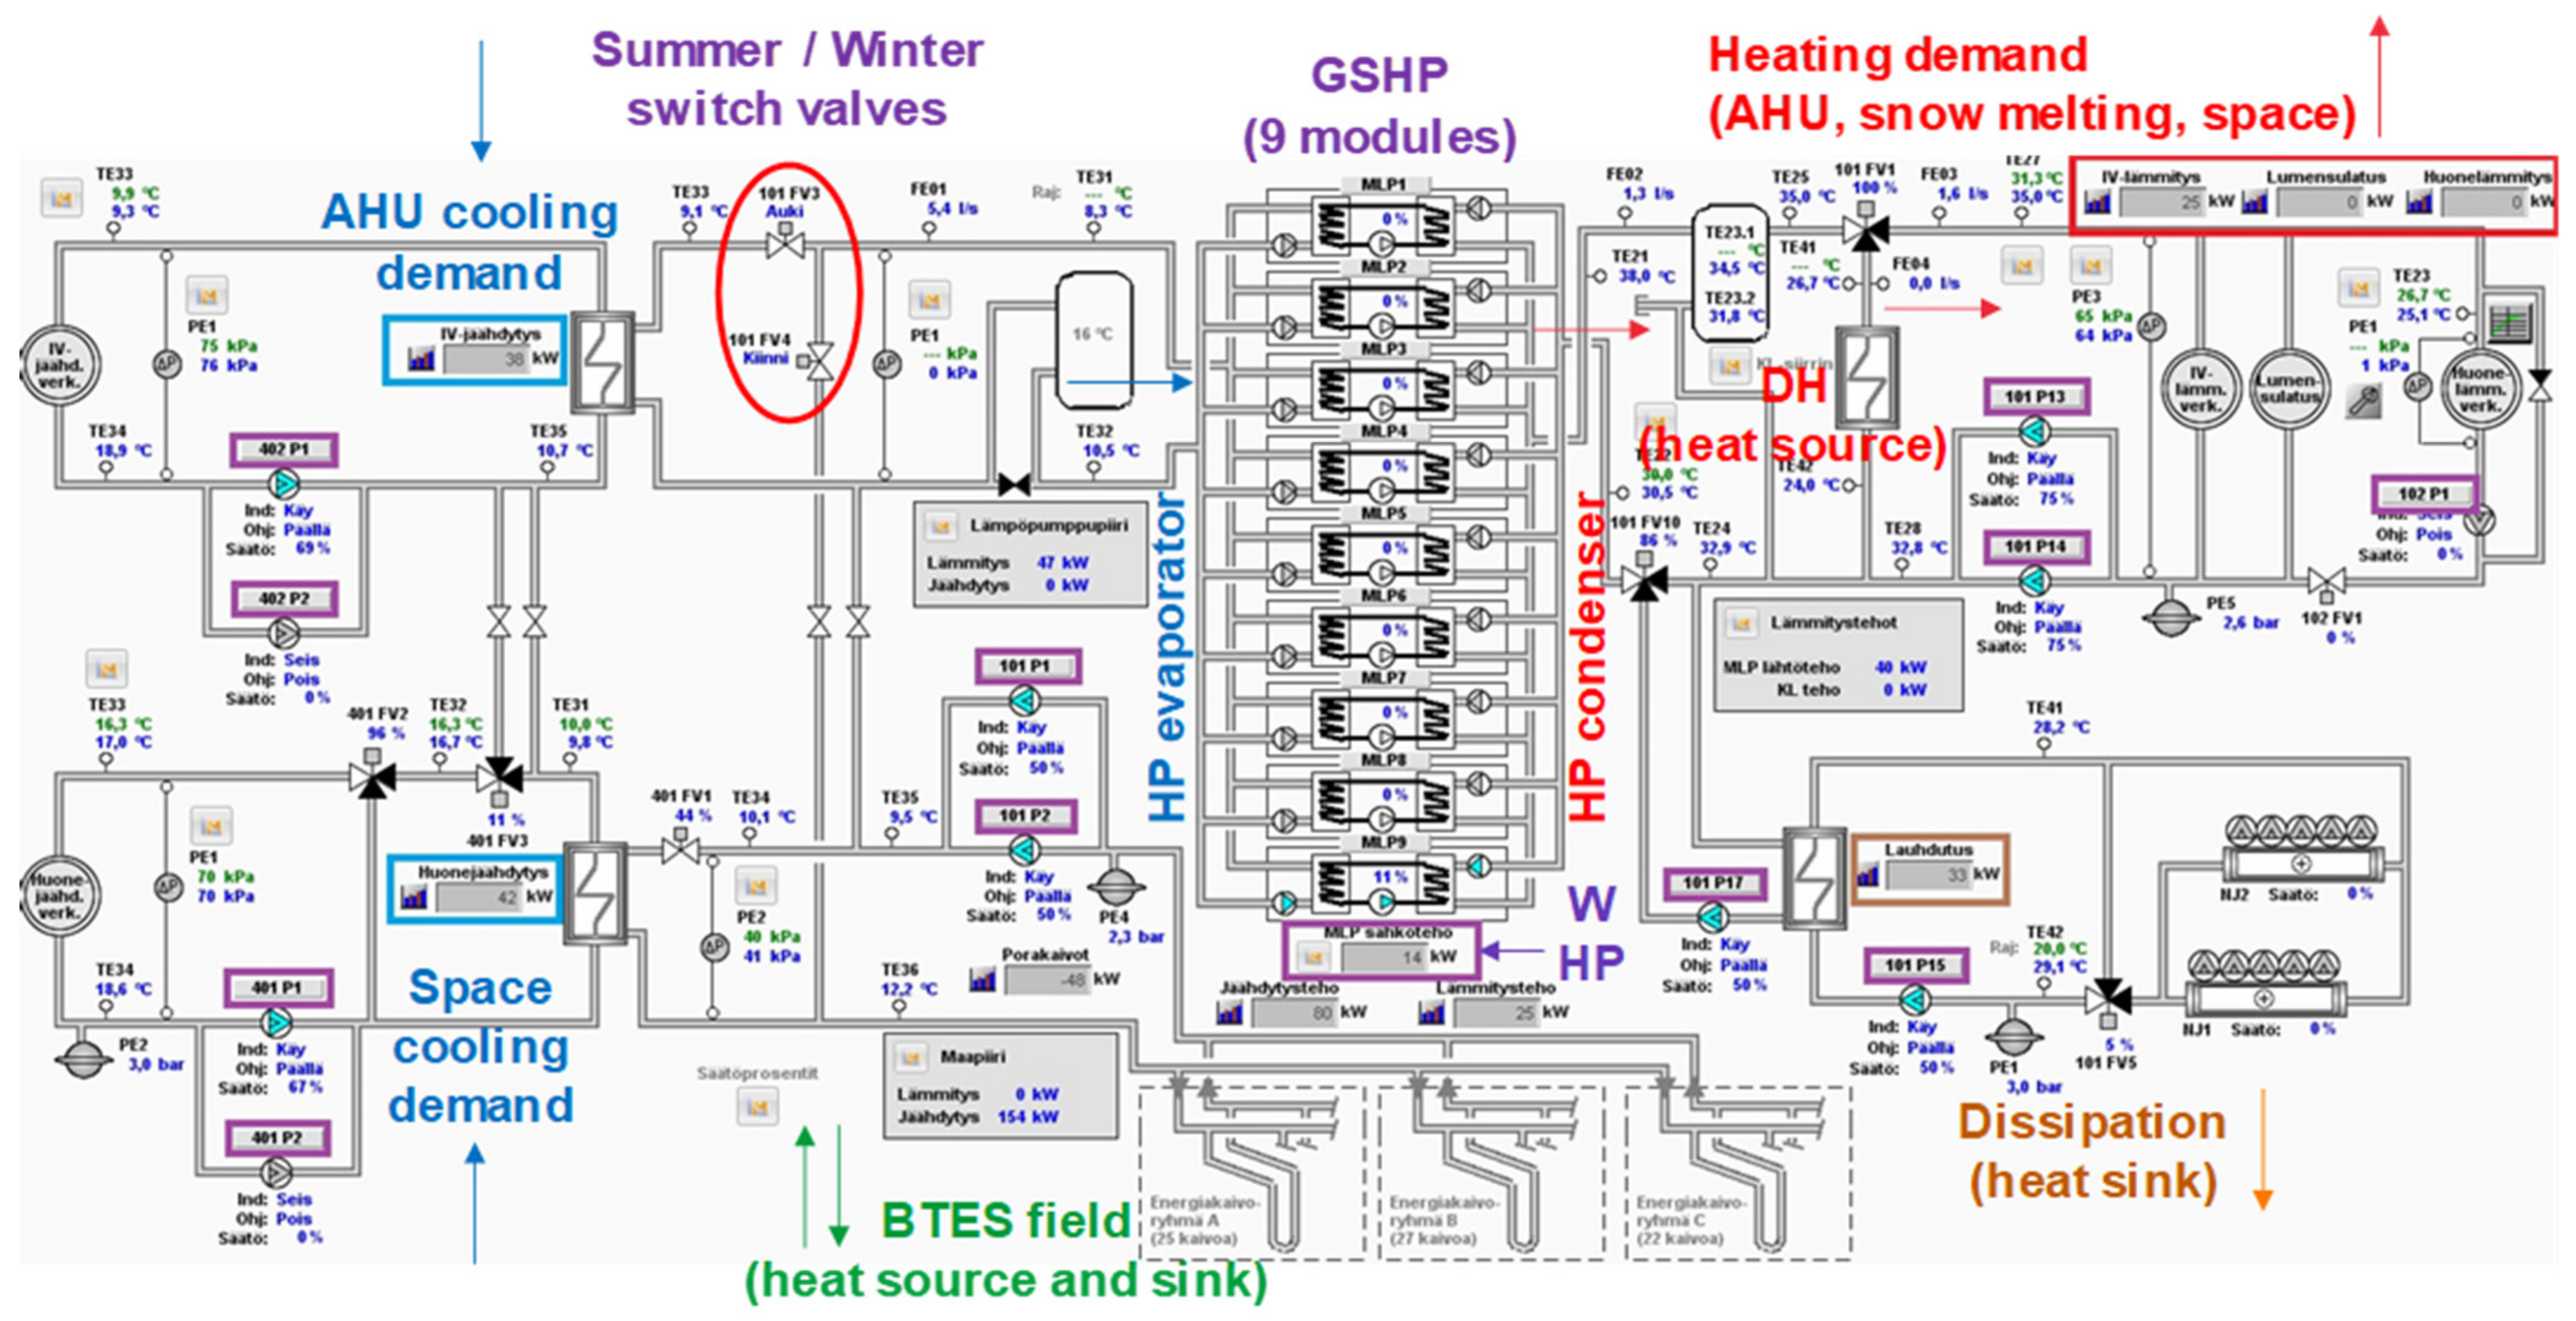


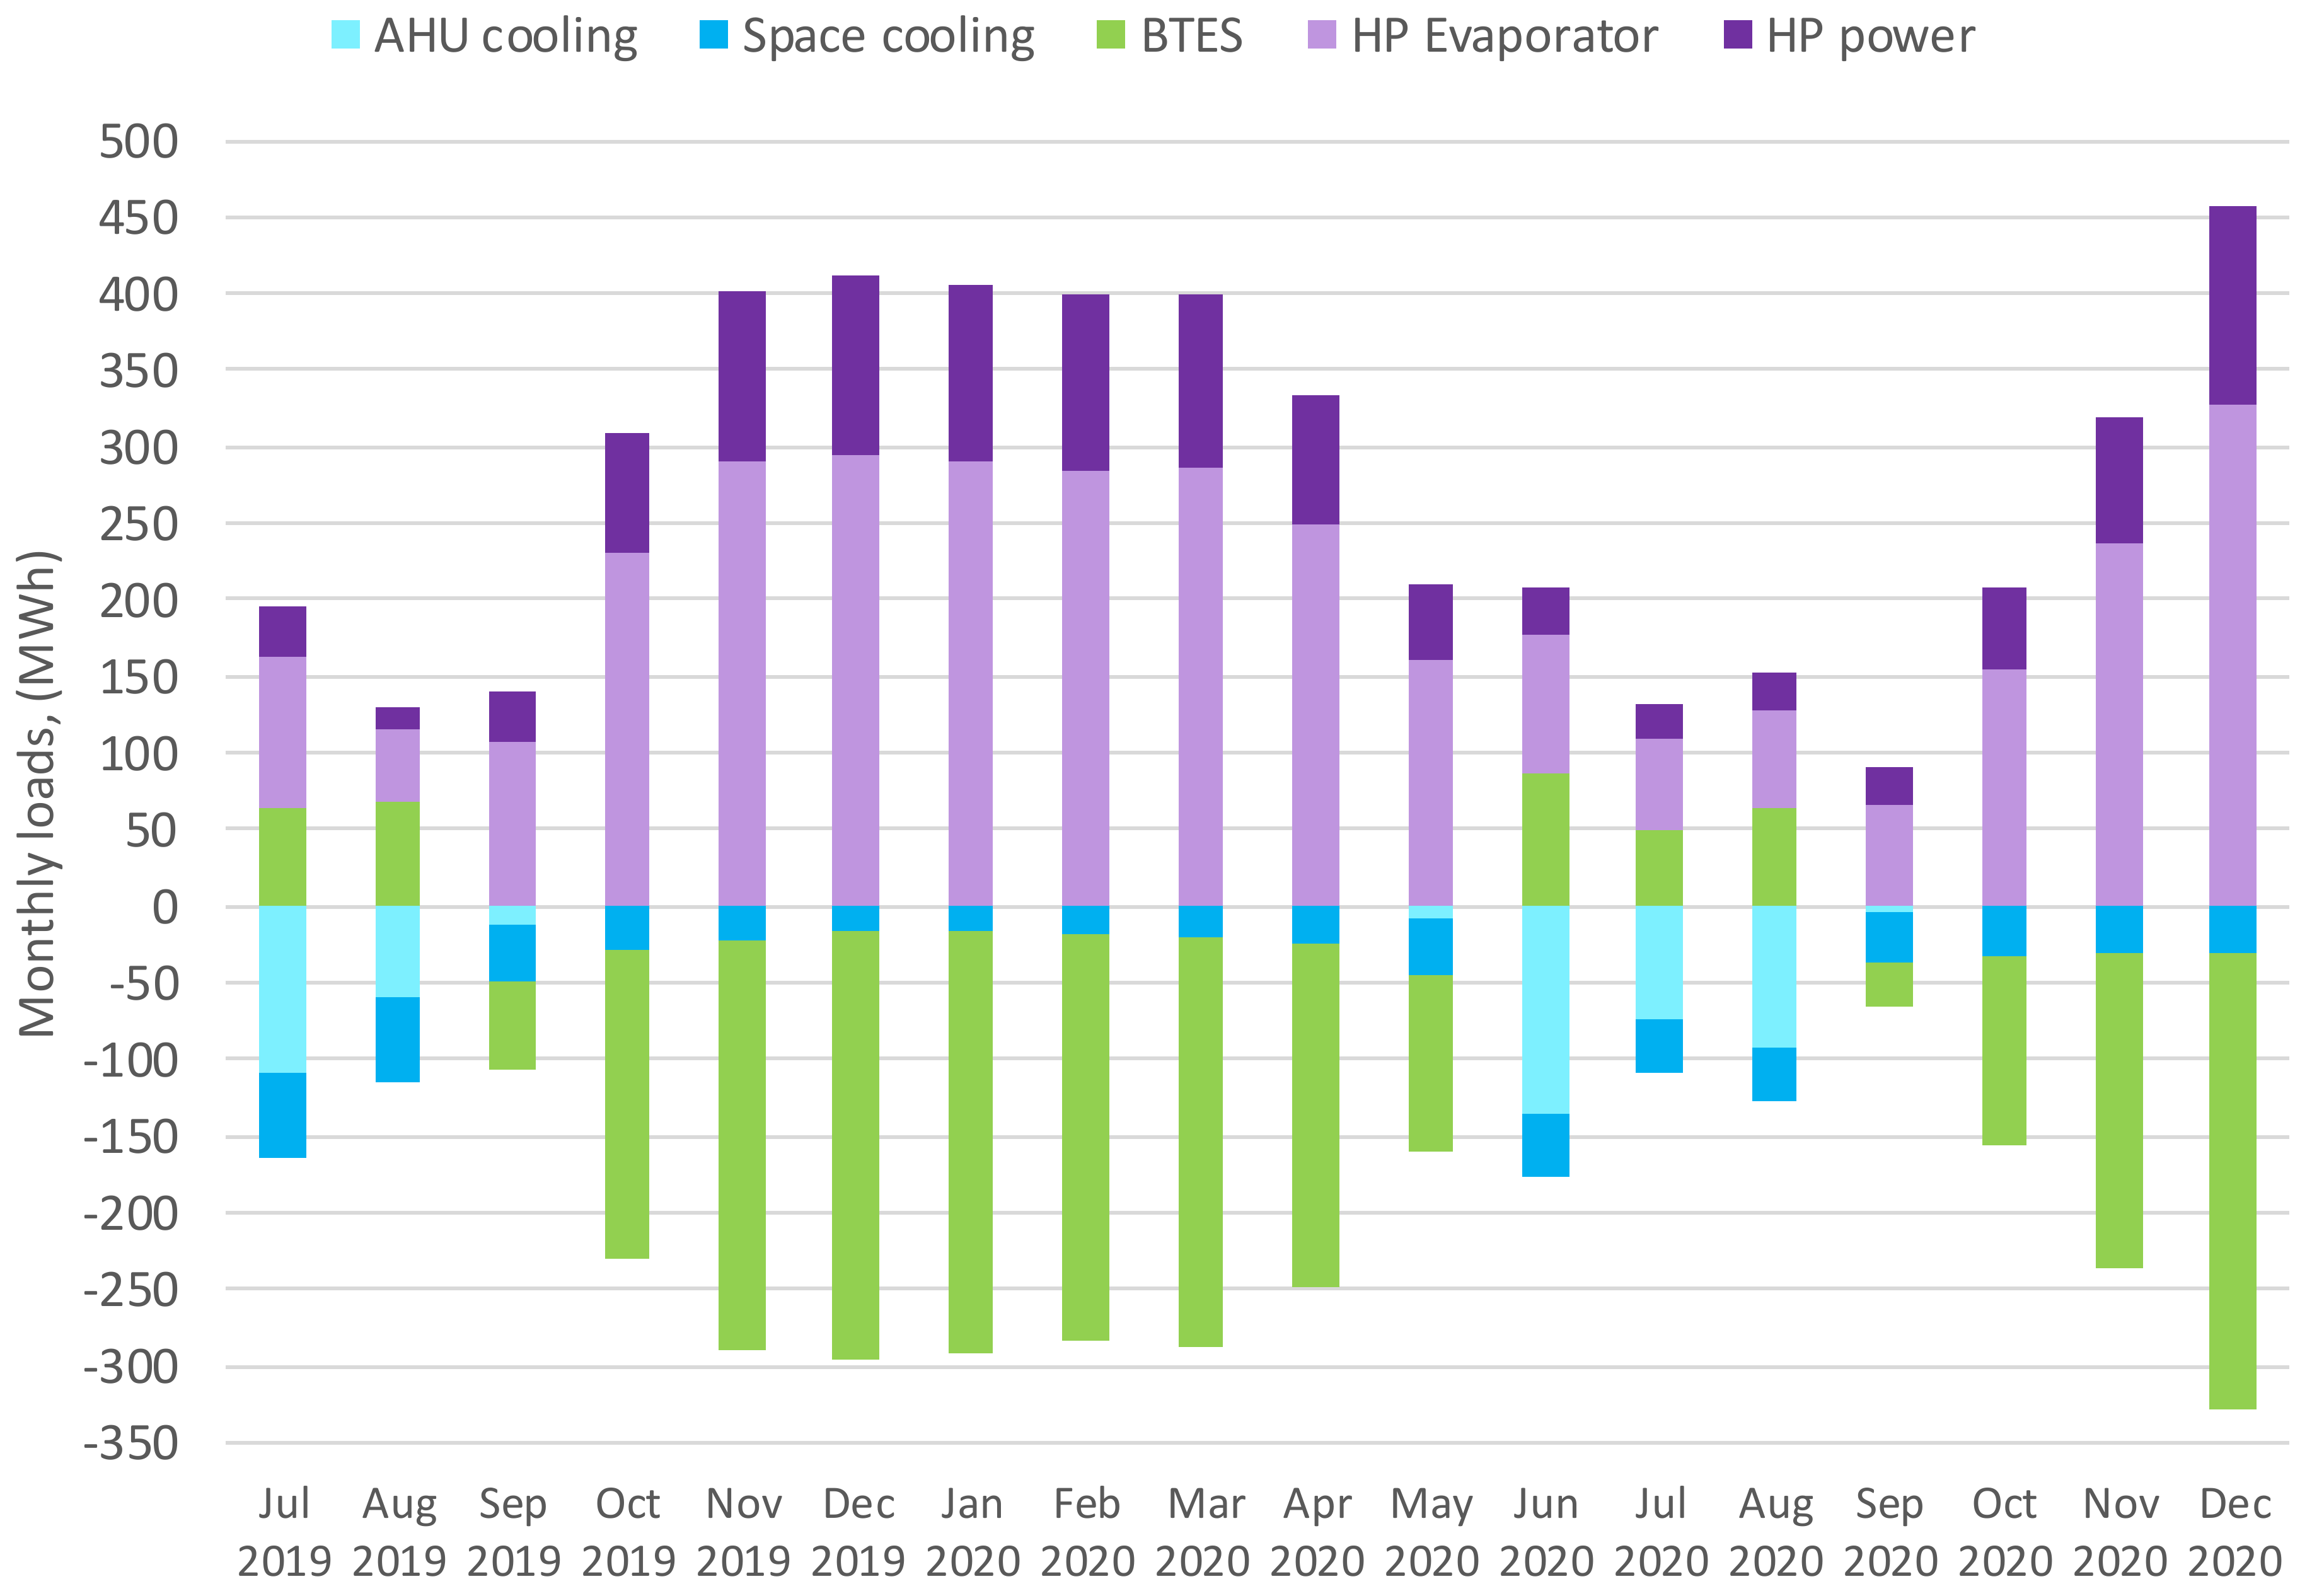


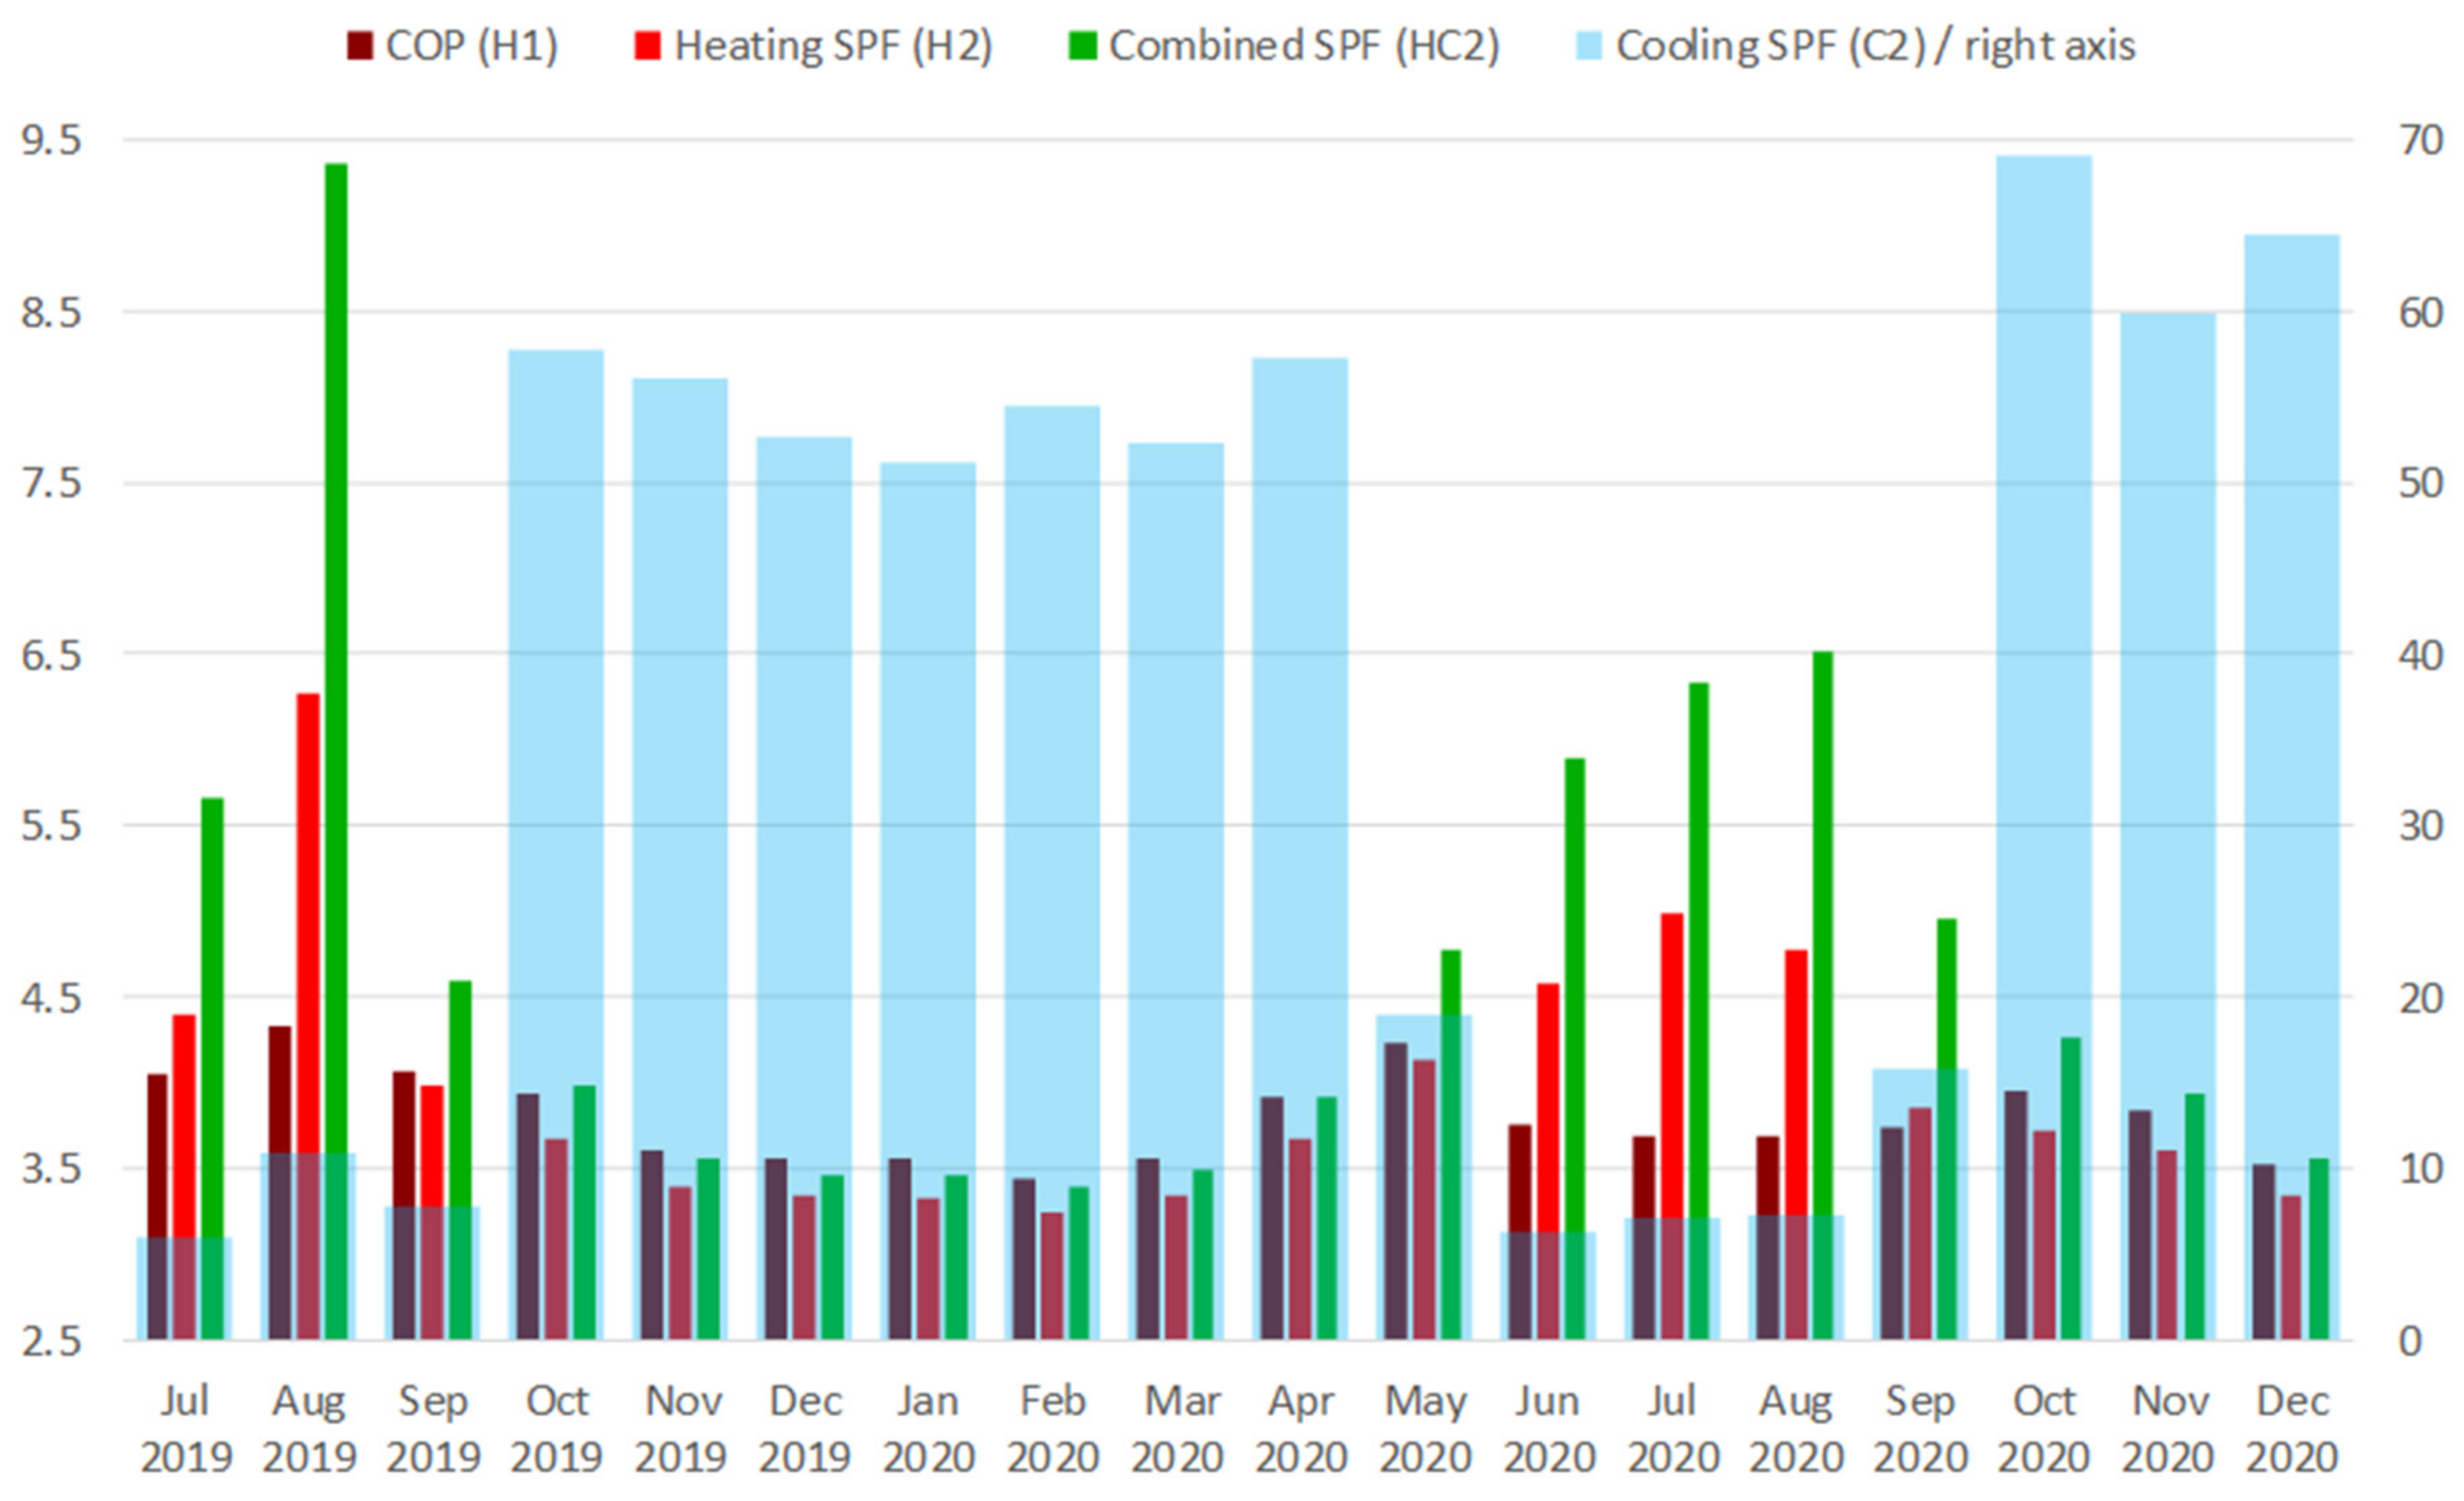


| Zone/Type | AHU-Cooling | Space Cooling | AHU-Heating | Space Heating | Others |
|---|---|---|---|---|---|
| ARTS + BIZ | 402 LM01 | 401 LM01 | 101 LM03 | 102 LM01 | - |
| METRO | 402 LM02 | 401 LM02 | 101 LM04 | 102 LM02 | - |
| BIZ | 402 LM03 | 401 LM03 | 101 LM05 | 102 LM03 | - |
| BTES field | - | - | - | - | 101 LM01 |
| Dissipation | - | - | - | - | 101 LM02 |
| Snow melting | - | - | - | - | 191 LM01 |
| Pump | Type | Overall kWh | Hours of Operation | % of Total Demand | Average Power, kW |
|---|---|---|---|---|---|
| 101 P1 | BTES field (1) | 56235 | 13895 | 25.5% | 4.05 |
| 101 P2 | BTES field (2) | 57007 | 13761 | 25.9% | 4.14 |
| 101 P13 | Heating circuit (1) | 23127 | 14032 | 10.5% | 1.65 |
| 101 P14 | Heating circuit (2) | 23386 | 13988 | 10.6% | 1.67 |
| 102 P1 | Space heating | 22597 | 12743 | 10.3% | 1.77 |
| 401 P1 | Space cooling (1) | 14888 | 8822 | 6.8% | 1.69 |
| 401 P2 | Space cooling (2) | 13526 | 8624 | 6.1% | 1.57 |
| 402 P1 | AHU cooling (1) | 2926 | 2154 | 1.3% | 1.36 |
| 402 P2 | AHU cooling (2) | 3557 | 2473 | 1.6% | 1.44 |
| 101 P15 | Dissipation (external circuit) | 2032 | 818 | 0.9% | 2.48 |
| 101 P17 | Dissipation (internal circuit) | 1017 | 797 | 0.5% | 1.28 |
| Pump | Description | Number of Data Points | Regression Equation (x is the Frequency Factor) | R2 | Standard Error, % |
|---|---|---|---|---|---|
| 101 P1 | BTES field (1) | 22189 | P (kW) = 7.952x | 0.993 | 5.4% |
| 101 P2 | BTES field (2) | 22189 | P (kW) = 8.073x | 0.994 | 5.1% |
| 101 P13 | Heating circuit (1) | 17084 | P (kW) = 5.008x − 0.977 | 0.905 | 4.4% |
| 101 P14 | Heating circuit (2) | 17084 | P (kW) = 4.890x − 0.873 | 0.905 | 4.2% |
| 102 P1 | Space heating | 15403 | P (kW) = 2.049x | 0.943 | 1.2% |
| 401 P1 | Space cooling (1) | 10269 | P (kW) = 7.346x − 0.996 | 0.891 | 5.7% |
| 401 P2 | Space cooling (2) | 10269 | P (kW) = 7.684x − 0.860 | 0.860 | 6.6% |
| 402 P1 | AHU cooling (1) | 5122 | P (kW) = 11.850x − 2.767 | 0.719 | 10.2% |
| 402 P2 | AHU cooling (2) | 5122 | P (kW) = 11.400x − 2.484 | 0.837 | 9.0% |
| 101 P15 | Dissipation (ext. c.) | 2846 | P (kW) = 7.600x | 0.995 | 5.1% |
| 101 P17 | Dissipation (int. c.) | 2826 | P (kW) = 4.009x | 0.994 | 6.6% |
| Description | Number of Data Points | Regression Equation (CFF is the Combined Frequency Factor, ∆T is Temperature Drop, TE24 is Dissipation Entering Temperature) | R2 | Standard Error, % |
|---|---|---|---|---|
| BTES field (heat extraction, negative) | 1127 | Q (kW) = 152.726 − 208.334∗CFF + 99.957∗∆T | 0.945 | 16.1% |
| BTES field (heat injection, positive) | 998 | Q (kW) = −166.1 + 285.313∗CFF + 59.382∗∆T | 0.959 | 13.2% |
| Dissipation heat | 507 | Q (kW) = −4212.6 + 182.4∗TE24 − 1.569∗TE224 | 0.732 | 42.7% |
| Month/Year | AHU Cooling (MWh) | Space Cooling (MWh) | Total Cooling (MWh) | BTES (MWh) | AHU Heating (MWh) | Space Heating (MWh) | Snow Melting (MWh) | Total Heating (MWh) | Total DH (MWh) | DH for Heating (MWh) | DISSIPATION (MWh) | HVAC Room (MWhe) | Pumps Power (MWhe) | GSHP Power (MWhe) |
|---|---|---|---|---|---|---|---|---|---|---|---|---|---|---|
| Jul 2019 | −82.9 | −40.6 | −123.5 | 92.3 | 20.8 | 25.3 | 0 | 46 | 35.5 | 8.8 | 110.1 | 44.1 | 11.5 | 32.6 |
| Aug 2019 | −47 | −44.4 | −91.3 | 106.3 | 18.9 | 21.3 | 0 | 40.2 | 42.1 | 8.6 | 30.3 | 24.3 | 10 | 14.3 |
| Sep 2019 | −9.3 | −34.3 | −43.5 | −47.1 | 69.4 | 82.2 | 0 | 151.6 | 49.8 | 10.2 | 6.7 | 47 | 12.3 | 34.7 |
| Oct 2019 | 0 | −28.6 | −28.6 | −189.9 | 187.1 | 150.3 | 0.2 | 337.7 | 56.1 | 12.2 | 0.9 | 90.8 | 12 | 78.7 |
| Nov 2019 | 0 | −21.9 | −21.9 | −251.6 | 266.3 | 180.7 | 1.7 | 448.6 | 67.4 | 23.8 | 0.1 | 125 | 13.3 | 111.6 |
| Dec 2019 | 0 | −15.4 | −15.4 | −263.1 | 264.3 | 185.5 | 2.7 | 452.5 | 56.3 | 20.3 | 0 | 128.4 | 12.9 | 115.5 |
| Jan 2020 | 0 | −16.1 | −16.1 | −259.6 | 250.5 | 186.8 | 2 | 439.3 | 59.3 | 15.7 | 0 | 127 | 13.1 | 113.9 |
| Feb 2020 | 0 | −18.4 | −18.4 | −249.9 | 270.1 | 176.1 | 2.1 | 448.3 | 70.7 | 26.8 | 0 | 128.4 | 12.4 | 116.1 |
| Mar 2020 | 0 | −20.4 | −20.4 | −252.4 | 258.7 | 171.6 | 0.8 | 431.2 | 50.3 | 14.5 | 0 | 124.9 | 12.8 | 112.1 |
| Apr 2020 | 0 | −23.6 | −23.6 | −203.9 | 211.9 | 160.9 | 0.1 | 372.8 | 25.9 | 10 | 0.1 | 96.1 | 10.8 | 85.3 |
| May 2020 | −7.3 | −34.2 | −41.5 | −100.4 | 121.1 | 128 | 0 | 249 | 26.9 | 10 | 0.7 | 57.8 | 8.1 | 49.7 |
| Jun 2020 | −137.1 | −40.7 | −177.8 | 86.5 | 22.3 | 18.4 | 0 | 40.8 | 32.2 | 9.5 | 91.6 | 40.2 | 7.5 | 32.7 |
| Jul 2020 | −74.6 | −34 | −108.6 | 50.5 | 19.2 | 33.6 | 0 | 52.8 | 34.1 | 9.6 | 39.3 | 29.3 | 7 | 22.3 |
| Aug 2020 | −91.6 | −35 | −126.6 | 65.4 | 19.4 | 29.7 | 0 | 49.1 | 34.4 | 9.6 | 48.8 | 30.8 | 7.2 | 23.6 |
| Sep 2020 | −4.3 | −31.5 | −35.8 | −27.8 | 37.3 | 65.4 | 0 | 102.7 | 39.2 | 9.4 | 0.4 | 30.4 | 6.3 | 24.1 |
| Oct 2020 | −0.1 | −32.2 | −32.3 | −119.9 | 114.8 | 108.2 | 0 | 223 | 41.1 | 10 | 0 | 60.9 | 8.2 | 52.7 |
| Nov 2020 | 0 | −30.4 | −30.4 | −200.3 | 150.8 | 188.3 | 0 | 339.1 | 41.2 | 11.3 | 0 | 93.7 | 10.3 | 83.4 |
| Dec 2020 | 0 | −30.8 | −30.8 | −291.1 | 199.2 | 301.8 | 1.5 | 502.5 | 62.6 | 37 | 0 | 142.6 | 12.8 | 129.9 |
| Month/Year | Average Outdoor Temp. (°C) | AHU Cooling (MWh) | Space Cooling (MWh) | Total Cooling (MWh) | Average Cooling Factors (±stdev) | BTES (MWh) | Average BTES Factors (±stdev) | Evaporator (MWh) |
|---|---|---|---|---|---|---|---|---|
| Jul 2019 | 17.9 | −108.8 | −54.7 | −163.5 | 1.36 ± 0.20 | 64.3 | 0.73 ± 0.20 | 99.5 |
| Aug 2019 | 17.0 | −58.4 | −57.2 | −115.7 | 1.36 ± 0.49 | 67.9 | 0.63 ± 0.17 | 47.8 |
| Sep 2019 | 11.4 | −11.0 | −38.2 | −49.2 | 1.10 ± 0.15 | −56.8 | 0.92 ± 0.20 | 106.4 |
| Oct 2019 | 5.2 | 0.0 | −28.8 | −28.8 | 1.01 ± 0.01 | −202.0 | 1.06 ± 0.03 | 230.8 |
| Nov 2019 | 1.9 | 0.0 | −22.0 | −22.0 | 1.00 ± 0.00 | −268.5 | 1.02 ± 0.01 | 290.6 |
| Dec 2019 | 1.3 | 0.0 | −15.5 | −15.5 | 1.00 ± 0.00 | −279.9 | 1.06 ± 0.02 | 295.4 |
| Jan 2020 | 1.7 | 0.0 | −16.2 | −16.2 | 1.00 ± 0.00 | −274.7 | 1.06 ± 0.02 | 290.9 |
| Feb 2020 | 0.3 | 0.0 | −18.5 | −18.5 | 1.00 ± 0.00 | −265.6 | 1.06 ± 0.02 | 284.1 |
| Mar 2020 | 1.6 | 0.0 | −20.5 | −20.5 | 1.00 ± 0.00 | −266.3 | 1.06 ± 0.02 | 286.8 |
| Apr 2020 | 4.6 | 0.0 | −24.2 | −24.2 | 1.02 ± 0.04 | −224.7 | 1.11 ± 0.04 | 249.0 |
| May 2020 | 9.5 | −7.7 | −36.7 | −44.4 | 1.07 ± 0.08 | −116.4 | 1.11 ± 0.10 | 160.9 |
| Jun 2020 | 18.6 | −135.1 | −41.4 | −176.5 | 1.02 ± 0.07 | 86.6 | 0.99 ± 0.04 | 89.8 |
| Jul 2020 | 16.8 | −74.6 | −35.0 | −109.6 | 1.03 ± 0.07 | 49.6 | 0.98 ± 0.05 | 60.0 |
| Aug 2020 | 17.0 | −92.0 | −36.1 | −128.1 | 1.04 ± 0.07 | 64.6 | 0.99 ± 0.04 | 63.6 |
| Sep 2020 | 12.9 | −4.5 | −32.8 | −37.3 | 1.04 ± 0.05 | −28.6 | 1.01 ± 0.05 | 65.9 |
| Oct 2020 | 8.3 | −0.1 | −32.5 | −32.6 | 1.01 ± 0.01 | −122.8 | 1.03 ± 0.03 | 155.4 |
| Nov 2020 | 4.3 | 0.0 | −30.6 | −30.6 | 1.00 ± 0.00 | −206.1 | 1.03 ± 0.02 | 236.7 |
| Dec 2020 | 0.8 | 0.0 | −30.9 | −30.9 | 1.00 ± 0.00 | −297.0 | 1.02 ± 0.02 | 327.8 |
| Last 12 months | 8.0 | −314 | −355 | −669 | 1.02 ± 0.05 | −1601 | 1.04 ± 0.06 | 2271 |
| Month/Year | Condenser (MWh) | AHU Heating (MWh) | Space Heating (MWh) | Snow Melting (MWh) | Total Heating (MWh) | Average Heating Factors (±stdev) | DH for Heating (MWh) | Dissipation (MWh) | Average Dissipation Factors (±stdev) |
|---|---|---|---|---|---|---|---|---|---|
| Jul 2019 | 132.1 | 19.3 | 21.6 | 0.0 | 40.9 | 0.99 ± 0.29 | 8.8 | 99.8 | 0.96 ± 0.07 |
| Aug 2019 | 62.1 | 19.4 | 21.0 | 0.0 | 40.4 | 1.03 ± 0.11 | 8.6 | 30.4 | 1.04 ± 0.19 |
| Sep 2019 | 141.1 | 66.4 | 78.7 | 0.0 | 145.1 | 0.97 ± 0.10 | 10.2 | 6.7 | 1.01 ± 0.07 |
| Oct 2019 | 309.6 | 177.5 | 143.1 | 0.2 | 320.9 | 0.95 ± 0.02 | 12.2 | 0.9 | 1.00 ± 0.00 |
| Nov 2019 | 402.2 | 252.6 | 171.7 | 1.6 | 425.8 | 0.98 ± 0.02 | 23.8 | 0.1 | 1.00 ± 0.00 |
| Dec 2019 | 410.9 | 251.6 | 177.0 | 2.6 | 431.2 | 0.96 ± 0.02 | 20.3 | 0.0 | 1.00 ± 0.00 |
| Jan 2020 | 404.8 | 239.7 | 178.9 | 1.9 | 420.4 | 0.96 ± 0.01 | 15.7 | 0.0 | 1.00 ± 0.00 |
| Feb 2020 | 400.2 | 257.1 | 167.9 | 2.0 | 427.0 | 0.95 ± 0.02 | 26.8 | 0.0 | 1.00 ± 0.00 |
| Mar 2020 | 398.9 | 248.1 | 164.6 | 0.8 | 413.4 | 0.96 ± 0.01 | 14.5 | 0.0 | 1.00 ± 0.00 |
| Apr 2020 | 334.3 | 196.2 | 148.0 | 0.1 | 344.3 | 0.92 ± 0.03 | 10.0 | 0.1 | 1.00 ± 0.00 |
| May 2020 | 210.6 | 107.5 | 113.0 | 0.0 | 220.5 | 0.90 ± 0.07 | 10.1 | 0.7 | 1.00 ± 0.00 |
| Jun 2020 | 122.5 | 21.8 | 17.8 | 0.0 | 39.7 | 0.99 ± 0.05 | 9.5 | 92.3 | 1.00 ± 0.01 |
| Jul 2020 | 82.3 | 19.3 | 32.9 | 0.0 | 52.2 | 1.02 ± 0.19 | 9.6 | 39.6 | 1.00 ± 0.01 |
| Aug 2020 | 87.2 | 19.0 | 28.8 | 0.0 | 47.8 | 0.98 ± 0.03 | 9.6 | 49.0 | 1.00 ± 0.01 |
| Sep 2020 | 90.0 | 36.1 | 63.0 | 0.0 | 99.1 | 0.97 ± 0.05 | 9.4 | 0.4 | 1.00 ± 0.00 |
| Oct 2020 | 208.1 | 112.2 | 105.9 | 0.0 | 218.1 | 0.98 ± 0.03 | 10.0 | 0.0 | 1.00 ± 0.00 |
| Nov 2020 | 320.1 | 147.5 | 183.9 | 0.0 | 331.4 | 0.98 ± 0.02 | 11.3 | 0.0 | 1.00 ± 0.00 |
| Dec 2020 | 457.7 | 196.1 | 297.1 | 1.5 | 494.7 | 0.98 ± 0.01 | 37.0 | 0.0 | 1.00 ± 0.00 |
| Last 12 months | 3117 | 1600 | 1502 | 6 | 3109 | 0.97 ± 0.07 | 173 | 182 | 1.00 ± 0.00 |
Publisher’s Note: MDPI stays neutral with regard to jurisdictional claims in published maps and institutional affiliations. |
© 2021 by the authors. Licensee MDPI, Basel, Switzerland. This article is an open access article distributed under the terms and conditions of the Creative Commons Attribution (CC BY) license (http://creativecommons.org/licenses/by/4.0/).
Share and Cite
Todorov, O.; Alanne, K.; Virtanen, M.; Kosonen, R. A Novel Data Management Methodology and Case Study for Monitoring and Performance Analysis of Large-Scale Ground Source Heat Pump (GSHP) and Borehole Thermal Energy Storage (BTES) System. Energies 2021, 14, 1523. https://doi.org/10.3390/en14061523
Todorov O, Alanne K, Virtanen M, Kosonen R. A Novel Data Management Methodology and Case Study for Monitoring and Performance Analysis of Large-Scale Ground Source Heat Pump (GSHP) and Borehole Thermal Energy Storage (BTES) System. Energies. 2021; 14(6):1523. https://doi.org/10.3390/en14061523
Chicago/Turabian StyleTodorov, Oleg, Kari Alanne, Markku Virtanen, and Risto Kosonen. 2021. "A Novel Data Management Methodology and Case Study for Monitoring and Performance Analysis of Large-Scale Ground Source Heat Pump (GSHP) and Borehole Thermal Energy Storage (BTES) System" Energies 14, no. 6: 1523. https://doi.org/10.3390/en14061523
APA StyleTodorov, O., Alanne, K., Virtanen, M., & Kosonen, R. (2021). A Novel Data Management Methodology and Case Study for Monitoring and Performance Analysis of Large-Scale Ground Source Heat Pump (GSHP) and Borehole Thermal Energy Storage (BTES) System. Energies, 14(6), 1523. https://doi.org/10.3390/en14061523


