Article

Design and Performance Evaluation of a Home Energy Management System for Power Saving

Department of Automation, Technical University of Cluj Napoca, 400114 Cluj-Napoca, Romania
*
Author to whom correspondence should be addressed.
Energies 2021, 14(6), 1668; https://doi.org/10.3390/en14061668
Submission received: 18 February 2021 / Revised: 11 March 2021 / Accepted: 14 March 2021 / Published: 17 March 2021
(This article belongs to the Section G: Energy and Buildings)

Abstract

:
In the context of the ongoing global warming, with environmental concerns regarding the greenhouse gas emissions due to our increasing energy consumption, smart energy management solutions have gained popularity as they have the potential to reduce our impact on the environment and also on our budgets. This paper proposes one of the most affordable designs for an autonomous, microcontroller-based demand-side energy management system to be installed in a home environment where it reduces the standby power consumed by the controlled devices. As a secondary function, it monitors and controls the lights to further save energy. The proposed system is designed to operate independently and also to limit the new wireless sources of electro-magnetic radiation introduced in the home environment. Six homes have been analyzed in terms of the measured energy consumption and to evaluate the energy management capabilities of the system, a prototype was built and tested. Promising results have been obtained and are detailed in the Results and Conclusion sections. A very low purchase price and good performance make this design a viable solution for intelligent home energy management, in today’s economic context.

Graphical Abstract

1. Introduction

The world population is constantly increasing, having reached the 7 billion inhabitants milestone in 2011. This growth is expected to continue with demographers estimating that the next milestone of 8 billion inhabitants could be reached as early as 2023. According to data published by the World Bank, the global energy consumption also increased between the years 1971 and 2014, when the World’s electricity consumption per capita rose 2.6 times, from 1200 kWh to 3132 kWh, with the trend remaining ascendant. Production of electricity increased accordingly, keeping up with demand and so has the negative impact on the environment, as 89.6% of this energy production comes from non-renewable sources [1], mainly oil, coal and natural gas. Renewable energy sources such as wind and solar started to have a notable contribution in the energy mix only after the year 2000 [2], with biofuels and hydroelectric still being the most common sources of renewable electricity. It is expected that in the years to come, most of our electric energy will still be produced from non-renewable sources thus, harming the environment. This is one of the reasons why researchers look at ways to minimize our energy consumption as discussed in [3,4,5].
A human activity pattern survey conducted in the United States of America and in Canada found that interviewed subjects spent 87% of their time indoors while in the European Union, according to a World Health Organization report, millions of citizens also spend 90% of their time indoors. Spending more time indoors also leads to increased energy consumption in residential buildings. It was observed that, during a one-year period, in the USA residential buildings accounted for 40% of the total energy consumption [6] while in the EU, residential buildings consumed 27% [7]. Analyzing further, it was discovered that a significant amount of the electricity consumed in residential buildings was attributed to devices that were left plugged into the power sockets while in sleep, idle or in standby modes. Throughout this paper, we will refer to this wasted electric energy as “standby energy”. This is the amount of electricity consumed by a device that is not in use (not performing its main function) as it waits to be turned on or activated. Devices that are remote-controlled usually have “standby modes” where they are not in active use but electronic circuits responsible for the remote control are still consuming a small amount of energy. Devices such as microwave ovens or stereos remain in “idle modes”, usually with some type of display such as a clock still drawing energy. Computer monitors or printers have “sleep modes” where their power adaptors consume a small amount of energy. In these cases, the device itself is not in use, yet it still consumes a small amount of electricity.
This standby energy was measured by researchers both in the EU and in the USA (among other places) and several research papers discussed the finding. It was suggested that out of the total energy consumption of a home, between 5% and 30% represents “standby energy” [8,9,10,11]. This is quite a broad interval as the results are influenced by multiple factors such as the location of the residence, the time of the year when measurements were conducted, the number of surveyed locations or the accuracy of the measurement device used. The EU financed project Selina to assess standby energy losses in appliances and concluded that, in a one-year period, across the entire union approximately 43 TWh are wasted, equivalent to around 19 million tons of CO2 being released in the environment [10]. To reduce this energy wastage, the EU introduced requirements that new appliances should have lower standby energy consumption than those previously available on the market and for older devices already in use, consumers were advised [10] to unplug these when not utilized instead of leaving them in standby modes. While doing so would be efficient in saving energy, it rarely happens for two main reasons. Firstly, it’s impractical due to the high number of devices always keep plugged-in. Secondly, even though environmental awareness and energy conservation are very popular topics, in everyday life most people choose comfort and security over environmental protection, as outlined by a 2017 study [12] from Singapore. The same study suggested that in order to efficiently reduce energy consumption we must implement smart technologies, systems designed to proactively and autonomously take energy-saving actions.
In this context, following a comprehensive literature review identifying current trends in this field, we designed and successfully tested a smart Home Energy Management System (HEMS) that manages the power supply to household appliances to reduce their standby power. The system can also monitor and control the lights to avoid electricity wastage due to user negligence, this way reducing the overall consumption. For reasons explained in the literature review section, we decided to implement a wired communication method within the home environment and GSM communication for long-distance interaction. An external memory card is used to record configuration and consumption data to improve the system’s efficiency. Using motion and light sensors the system detects environment changes, acting without interference to user comfort or lifestyle. Based on real-world measurements combined with a system prototype implementation, the proposed system’s efficiency was evaluated as we analyzed its potential impact on reducing energy consumption in several home environments over a one-year time period.
This manuscript is organized into six main sections. Section 1 introduces the reader to the general context of the World’s increasing energy demand and its impact on the environment. Section 2 presents to the reduction of energy consumption by implementing different HEMS solutions. Section 3 proposes the author’s own HEMS architecture, providing detailed diagrams of both hardware and software components. A system prototype was built and tested with all relevant stages covered by Section 4 and the system’s evaluation results are all discussed in Section 5. Closing the manuscript, Section 6 presents the main findings of this study and possible further development directions.

2. Literature Review

Studies conducted around the World prove that implementing HEMS is an efficient way to reduce a home’s energy consumption or at least to reschedule it to lower tariff intervals, reducing electricity bills. Focusing on power supply measurement and management, reference [5] noted that using a HEMS may achieve a potential 41–54% reduction of the standby energy consumed by controlled devices. Besides controlling appliances, the authors of [4] considered a HEMS controlling the lighting system as well, with a 39.97% per year reduction in standby energy consumption. Analyzing energy conservation in smart homes, the 2016 study in reference [3] compares electricity consumptions in the same home, with and without implementing a smart gateway control, results suggesting that smart control could reduce energy consumption by a calculated 18.69%, based on provided values. While the objective is the same, achieving a reduction in energy consumption, we found numerous approaches to achieving it. The next paragraph will briefly present the most popular approaches to reducing energy consumption in a smart home.
The electric power socket is where electric and electronic devices are connected to access the electricity needed to operate. By turning the power supply on and off we can in turn switch most devices on and off, exerting a simple type of control. This simple way to reduce the standby power of devices through direct human intervention is seen in consumers that are environmentally aware and unplug unused devices. Simple programmable power sockets can also be used to ensure that large electricity consumers (such as water heaters) only operate during off-peak times. More complex sockets, as discussed next, provide additional power measuring and communication capabilities. These are built around microcontrollers and use both wired and wireless technologies for communication. Users can view power consumption data and control power sockets from a distance. Researchers developed smart power sockets that operate individually while others have built-in communication methods, allowing for long-distance control and for setting up networks. Some smart sockets are connected to a control module capable of synchronizing them. Other systems integrate sensors to record movement, temperature or light brightness in the home environment, to increase the system’s efficiency in reducing energy consumption. State-of-the-art systems often have the ability to manage the home’s own power production (from wind generators or solar panels) and schedule consumption based on this information or on the reduced energy tariffs in certain time intervals. This increases the HEMS’s efficiency but also its price.
In reference [13] for example, a network of smart power outlets measuring the energy consumed by attached devices and sending it to a PC wirelessly via XBee is presented. The PC provides a graphical user interface (GUI) that facilitates the on/off control of sockets. Using both a Bluetooth beacon and Wi-Fi, the smart power sockets proposed by the authors of [14] allow the implementation of automatic control when the user leaves or returns. A web-based system is discussed in reference [15], the monitoring and control of appliances are performed through the power lines and data is being sent to a server linked to a web page user interface, allowing users to access the system via the internet. Taking advantage of Android’s popularity, the authors of [16] suggested an Internet of Things (IoT) approach with smart power sockets that allow users to monitor and control the connected devices via a mobile App, allowing functions such as delayed control or power limitations. The energy management solution put forward in reference [17] shows a remote control power outlet network using both Bluetooth and Ethernet to communicate data and introducing GSM capabilities for long-distance control.
Without constantly relying on users to decide and in order to be more efficient, some smart sockets and HEMS have built-in functions allowing to automatically disconnect power supplies in certain situations. This automatic control can target either all connected devices or only those in standby mode. Both these solutions are discussed next. The smart socket system in reference [18] uses existing power lines to communicate between components, a feature seen in several reviewed systems. When a device connected to a smart socket goes into standby, this event is identified and the power supply to that device is disconnected. The authors of [19] also focus on reducing the standby power of appliances, only they opt for wireless XBee communication between components. They proposed to remotely control several smart sockets using the infra-red remote control. A similar design is proposed in reference [20], integrating infra-red remote code learning and light control. Adding to the complexity of HEMS and using popular power lines communication methods, references [21,22] use microcontroller-based modules to measure energy consumption in real-time and control the power supply to connected appliances in order to optimize the overall energy consumption. The control is not limited to devices in standby modes and extends to all connected devices regardless of their state. Using wireless communication methods, the HEMS presented by the authors of [23] implements both GSM and Zigbee technologies to monitor and manage the power supply, taking into consideration peak demand times and optimizing consumption to benefit from “off-peak” pricing in order to reduce energy costs. Another wireless communication approach using Wi-Fi is seen in [24], where energy consumption measurements are sent to a server, logged and analyzed in order to identify consumption patterns and further increase efficiency. This data is made available to users via mobile phone. In [25], Bluetooth low energy communication is used in conjunction with a fuzzy logic controller to reduce peak load demand.
Energy management systems reviewed above acted on user commands or independently based on measured energy consumption. To extend functionalities and efficiency, intelligent power control systems can benefit from adding sensor modules as seen in our design and in the following. Most commonly added to HEMS are passive infrared motion detection sensors (PIR). They provide information that makes it possible to control devices based on the presence or absence of potential users in the area. The system in reference [26] pairs this type of sensor with RF/Zigbee wireless communication modules to transmit measurements to controllers and receive control instructions. The authors of [27] added light sensors to create an intelligent HEMS that can perform lighting control based on light intensity. By integrating light sensors, a reduction in standby energy consumption was noted. Additional to the previously-mentioned sensors, the web-based HEMS in reference [28] incorporates many others, such as temperature and smoke level, measuring up to eight parameters. Data collection is also performed by the HEMS presented in reference [29], with flow, movement, lights and temperature measurements are taken in addition to reading the status of various loads around the house and combining human activity and load status data with user preferences and real-time pricing to apply machine learning and pattern recognition as it optimizes control.
State-of-the-art HEMS are found in smart houses that have renewable energy generators deployed, e.g., reference [30] where both energy production and consumption are simultaneously managed in order to reduce energy bills. ZigBee-based modules observe energy consumption and communicate to a home server that creates usage patterns. Weather forecast information is utilized to estimate energy production and schedule consumption in such a way as to reduce energy costs as much as possible. As discussed by the authors of [31,32], these HEMS improving energy efficiency at the consumption side by introducing new and better materials and methods or rescheduling consumption to periods with lower tariffs can be referred to as Demand Side Management systems. In general, more complex systems incorporating numerous sensors and functionalities are better at precisely detecting, measuring and predicting energy production and consumption while also implementing accurate and efficient scheduling and control, as seen in reference [33]. The tradeoffs however are the higher initial purchase and installation costs of these systems and the increased own energy consumption, as numerous components bring new loads to the household, this being occasionally overlooked when assessing the HEMS efficiency.
Some HEMS are designed to only act as main control hubs for other appliances but rely on direct human input (through a type of user interface) to activate/deactivate them. This approach has the advantage of providing ease of control to elder users or to those with reduced mobility but the system itself has little to no ability to act autonomously thus, not being very efficient in reducing energy consumption. To overcome such drawbacks, our HEMS design proposes the control of power sockets in two ways, directly as instructed by users from a dedicated computer App. or automatically as instructed by the system’s control software. Newly developed software enables the HEMS to perform autonomous control based on data from sensors integrated into its architecture. Most reviewed systems use wireless communication technologies to exchange information between components. The main advantage of this approach is a quick and simple installation, but each system component that acts as a wireless transmitter represents a new source of EM radiation inside the home environment. Residents considering that we already have too many sources of EM radiation in our homes can perceive this as a health-related concern. Wired HEMS overcome this potential radiation issue by moving all communications through dedicated lines however, these systems are generally more expensive and difficult to install. Another potential disadvantage of wired systems (especially the popular cheap domotics using the X10 protocol) is the lack of speed as devices can only transmit one at a time. There is also the risk of interference with neighboring systems when using the power line communication method in places such as apartment buildings. Our proposed design uses dedicated communication lines, avoiding the potential drawbacks of systems using the power line communication but the higher installation costs cannot be avoided.
Regarding long-distance HEMS interaction, internet-based alternatives, systems based on IoT devices or other approaches that rely on constant internet connection have the advantage of providing vast amounts of data and can benefit of cloud storage and computing but were avoided for security reasons, as internet-connected devices are more vulnerable to cyber-attacks and instead, our proposed design includes GSM module for occasional long-distance interaction and allows future extensions to system functions if desired. The number of components in our HEMS proposed design was kept minimum and those used are energy efficient, this way avoiding the potential drawbacks associated with the higher energy consumption of more complex designs. Our system’s own power consumption was also measured during the prototype evaluation in the Results section.
Cost related, by using the cheap open-source Arduino platform, the system’s components are low cost and easy to procure, an important advantage over other proprietary solutions.

3. The Home Energy Management System’s Design

3.1. The Hardware Architecture of this System

The system we developed is best suited to be installed in small homes or apartments as found in many highly populated cities. Figure 1a shows the location of modules inside such homes. In this configuration, the system’s main function is controlling power sockets to prevent the waste of standby energy. To minimize losses due to user negligence, its secondary function is to monitor the lights and in certain situations, switch them off automatically.
As a central component for our automated system, the popular Arduino Uno board was chosen. It is a low-cost solution integrating an AtMega328P microcontroller at 16 Mhz with 32 kb flash and 2 kb dynamic memory. For interfacing sensors and actuators we use 14 digital and 6 analog pins. Figure 1b shows the pin-module association, arrows pointing towards the controller indicate input pins while arrows pointing away indicate output pins. For detecting user presence, three PIC HC-SR501 modules are connected to digital input pins. These energy-efficient modules have fast 0.2s detection rates up to 7m away. Light intensity changes in the home are detected using light-dependent resistors (LDR) associated to fixed-value ones (10 kΩ), creating voltage dividers, as in Figure 2a. Their output is changing as the light intensity fluctuates, according to the equation:
V o u t   =   R f i x e d R L D R + R f i x e d V i n .
Illuminating the LDR causes its resistance to decrease while shading it causes its resistance to increase. Knowing the voltage divider’s 5 V input, the minim and maxim output voltages were calculated using Equation (1). In absolute darkness, the LDR has its highest resistance causing the divider to output its lowest value:
V m i n   =   10   k   + 10   k 5   V 0   V ,
while a fully lighted LDR will have a 0 Ω resistance causing the divider to output its highest value:
V m a x   =   10   k 0   + 10   k 5   V   =   5   V .
Falling between Vmin and Vmax, other output values can be calculated with Equation (1) (Figure 2b).
By connecting each voltage divider to the controller via an analog input pin, the received signal pass through 10-bit analog->digital converters, mapping the 0–5 volts to integer values/units between 0 (absolute darkness) and 1023 (absolute brightness) with a resolution of 0.0049 V/unit. These integer values are used by the system’s control software. As seen in Figure 3, light intensity variations in real-world conditions were recorded every 10 s for consecutive 24 h intervals and we observed that absolute values are not encountered, with A/D converter output between 430–980. The natural light intensity changed by no more than 10 units over 10 s.
Four relay modules (as seen in Figure 4) are included to allow the on/off control of lights and power sockets where non-essential appliances are connected. The diode was introduced to protect the switch against excess currents forming in the relay coil. Once a relay disconnects an appliance/load from the main supply, its standby energy consumption drops to zero.
If alerting the residents becomes necessary (lights forgotten on, system failure) the integrated buzzer produces a 2 kHz sound. The data-logger shield used to store configuration and energy-saving data also integrates a real-time clock (RTC) module used for time-related control functions.

3.2. Software Developed for this System

A substantial amount of time went into developing the software associated with this HEMS. Two software applications were written, one running the Arduino board and one acting as GUI, running on a PC. A dedicated communication protocol was implemented to standardized and enable data exchange between them.

3.2.1. Arduino Control Code

The proposed HEMS is programmed to operate autonomously, without notable interference with the resident’s activities. The control software was written in C/C++ using the open-source Arduino IDE (Integrated Development Environment) and uploaded onto the board via USB. The main functions performed by the control software (Figure 5) are: power sockets control, lights control, management of energy-saving data, system initialization and data back-up.
When the system powers-up it executes an initialization routine where the serial communication, RTC and SD memory card are initialized. System variables are configured by users at any time using a PC-GUI. These variables are the timers for power socket control, occupancy status and whether the GSM and buzzer modules are activated or not. When these variables change, they are automatically saved onto the memory card. The onboard RTC module provides time and date. In each run cycle the time is converted from an “hour: minutes” format to an only “minutes” format using Equation (4), thus a 0–24 h interval becomes a 0–1440 min one.
C t i m e   =   C h o u r × 60 + C m i n .
We implemented this time-keeping solution as it utilizes fewer variables, reducing the number of operations performed in each run-cycle, increasing the software’s efficiency in terms of memory use. All the time-stamps associated with the system’s actions are expressed in a minutes-only format. Figure 6 presents an overview of the system’s initialization and data back-up functions.
Light-dependent resistor (LDR) modules are used to detect light intensity variations, making it possible to monitor and control the indoor lights. Figure 3 illustrates light intensity variations as measured and recorded by the HEMS. When sudden fluctuations are encountered (more than 30 units over a 10 s interval) the system identifies the lights being switched on (sharp rising edge) or turned off (sharp falling edge). Associating motion detection data, the system can determine if the lights were (forgotten) left on and notify users via the active buzzer. If users left the house, it will automatically switch off all lights. This control method is detailed in Figure 7.
Using motion sensors inside the house, the system can identify whether somebody is at home or not and after the elapse of a user-defined timer, it will take energy-saving actions as seen in Figure 8. Optionally, by pressing the physical button integrated into the HEMS (e.g., when leaving the house), this timer can be instantly reduced to a minimum, prompting the system to switch off all the connected devices without further delay, making the system more efficient on that occasion. A shorter delay makes the system act sooner, producing higher energy savings, but it might interfere with the user’s lifestyle. A longer time delay makes the system less efficient in reducing standby power but is less intrusive. Each zone’s timer can be independently set by users. The system has a built-in function allowing it to record energy-saving data that can later be presented to the user.
Seen in Figure 9, one important function of the control software is the energy-saving data management. By multiplying the standby power of devices with the total disconnection time, at the end of each day, the system calculates the amount of energy saved in each zone and records the results on the SD memory card. Each month the total savings are calculated (Equation (5)), compared with the previous month’s result and the energy-saving trend presented to the user.
E M o n t h   =   E D a y × 30   =   P S t a n d B y × t H o u r s × 30 ÷ 1000

3.2.2. The Visual C# App.

Because of the limited number of input-output pins available and because all are used to interface sensors and relays, it was not possible to include a keyboard or display in the system’s architecture. The memory resources and processing power that would have been used to implement a local user interface were redirected to allow for an autonomously operating HEMS. To facilitate the initial system setup, testing and occasional reconfigurations, a Windows-based Visual C# GUI-Application (Figure 10) was developed. It allows users to check and set timers as desired and makes it possible to activate/deactivate or test different modules. To avoid communication errors and ensure that the Arduino board receives valid data and instructions, multiple checks are implemented. For example, when introducing new timers, all values are checked to be within a valid 0–1440 interval. Certain App buttons, such as the ones activating or deactivating modules are enabled only when using that function is permitted. The same is true for text boxes, enabled only when introducing text is allowed.
During testing, we observed that concomitant use of the microcontroller’s serial pins by the GSM module and Windows App was leading to communication errors. This was solved by placing two switches on the GSM module’s communication lines, disconnecting them while the system communicates with the Windows App. Once the system is unplugged from the PC, these lines can be easily reconnected by changing the switch position thus reestablishing the microcontroller to GSM module communication. The wired USB connection is utilized for reasons already discussed in the Literature review section and Windows was chosen as the target OS for the configuration App because as the HEMS was developed, it had over 75% market share in the PC segment.

3.2.3. The Communication Protocol

The control software checks during each loop to see if any commands are received via serial communication. If the instruction to connect to the Windows App. is received, the HEMS control software brings the entire system into a configuration and testing mode, executing only instructions received from the Windows App. This is a type of Master–Slave communication, with the Windows App. acting as Master, initiating all communication, sending instructions or data requests, and the HEMS control software acting as Slave, responding to these requests. The information exchanged between these two software programs is structured according to a specific communication protocol, as successfully developed and implemented in [34]. Data packages begin with a specific character, the exclamation mark “!” followed by a five-character command. If additional data is transmitted, it is included after the command and followed by the “\n” end marker. Figure 11 shows the structure of a data package containing the command to set a new 30 min timer for Zone 1.
Communication not structured according to this format will be ignored. The sequence of received data packages is also relevant as the Arduino board will not respond to any instruction until the command to connect to the Windows App is received and executed. When disconnecting the HEMS from the PC, it is compulsory to issue a disconnect command and close the serial port to avoid future potential communication issues with the GSM module. Both HEMS control software and Windows App have built-in checks to ensure the above rules are followed.

4. System Implementation and Testing

4.1. Prototype Implementation

Each system component and corresponding software were first individually tested and validated to ensure correct operation before the entire (completed) system prototype (see Figure 12) was assembled and evaluated. The control software specially developed for the HEMS was uploaded onto the Arduino Uno board and the system’s configuration was done using the Visual C# App as previously presented. Next, the completed system prototype was evaluated in multiple real-life utilization scenarios both at the University’s laboratory and at the author’s home.

4.2. The Testing Method

Numerous appliances and electronic devices are permanently connected to power sockets within our homes and while they are not in use, they still consume small amounts of electricity waiting in standby modes. There are time intervals throughout the day when these devices will certainly not be used, such as during the night when residents are asleep or during work hours when nobody is home. Even when residents are home, they are not always using all appliances. For example, the TV set in the bedroom might not be used until late at night but it is still connected to a power socket, wasting electricity. In such cases, our HEMS design can automatically disconnect the device from power supplies and by doing so, eliminate that device’s standby energy consumption.
The standby power of most devices is small but still measurable, so we began by recording the standby power of home appliances and other electronic devices in five homes where access was granted. For reasons related to the ongoing Covid-19 pandemic and to minimize any potential spread of this virus, multiple visits to install, monitor and remove the system prototype in these homes were not possible, so we had to limit our interaction to one short visit per home to conduct measurements and then correlate these with the observed behavior of the system in laboratory simulations. Measurements were conducted using a Unitec EIM15-056 device, capable of precisely measuring the standby power of connected devices. We were interested in those “non-essential” appliances and electronic devices that can be switched on/off without affecting the user’s comfort and wellbeing. The standby power of refrigerators and surveillance or alarm systems was not measured as these are “essential” devices that cannot be disconnected from the power supply and as such, are not controlled by this HEMS. Saving energy by switching them off is not possible.
A list of non-essential devices commonly found in homes was compiled and for those types of devices, the average standby power was recorded, as measured and listed online by the Lawrence Berkeley National Laboratory of the University of California-USA [35] and by the Canstar Blue energy consultant platform in Australia. For comparison, a generic house was added to our study. For several time intervals (one hour, one day, one year) Table 1 presents the standby energy consumption of non-essential devices found in the five visited houses plus in the generic one.
The results presented in Table 1 are correct as long as the appliances remain in standby mode for that respective time period. Without any power-saving actions, these values represent the lowest amount of electricity consumed by these appliances while plugged in, but not in active use. Our HEMS aims to reduce this energy consumption without intruding on the user’s lifestyle, so the residents of the five visited homes were interviewed to identify the time intervals when they are usually at work or at sleep and the HEMS was configured accordingly. During these time periods is when non-essential appliances will certainly not be used thus could be unplugged without residents noticing. For the generic home, the time period was chosen based on the average work and rest times detailed on the European Commission’s website. The results are listed in Table 2.
The residents of the analyzed homes work on average 8 h per day and adding the lunch break and commute times leads to a period of 9–10 h when nobody is at home during workdays. At night, the average rest time was 8 h. Using Equation (6) and the values A and B taken from Table 2, with 251 being the number of working days and 366 the total number of days for the leap-year 2020, it is possible to average how long would the appliances be kept in standby modes during one year, needlessly consuming energy as residents are sleeping or away at work:
C = 251 * A + 366 * B.
During prototype evaluation, the HEMS was programmed to disconnect the power supply to non-essential devices in a zone after 15 min of inactivity (based on motion detection) and all the results presented in this paper are based on this system setup. Changing this configuration will modify the results, as larger timers make the system slow to act, reducing its efficiency and smaller ones make the system act sooner, saving more energy (but might interfere with the user’s lifestyle).
Affecting the system’s overall results in lowering a home’s electricity usage is the system’s own energy consumption, with our design requiring approximately 1.5 Wh (transformed to kWh in row E of Table 3). This value is not fixed and can fluctuate depending on the way the system is configured. For example, if the GSM module is always in use or if the buzzer is often activated, this will increase the system’s energy requirements. For each house, Table 3 also contains the standby energy consumption per hour (row D) and the number of hours when the appliances can be disconnected by the HEMS (row C). Using these values and Equation (7), it is possible to calculate the amount of energy saved by the system’s energy-saving actions in one year (row F).
F   =   C × D E .
G   =   F × 0.2159 .  
To calculate the financial savings generated in each house by using our proposed HEMS, we used Equation (8) and the mean electricity price in European countries as reported for the first half of 2019 by Eurostat (0.2159 euro per kWh). The results are listed on the last row G of Table 3.

5. System Evaluation Results

5.1. Results Analysis

Based on measurements taken in five visited homes, and adding calculations done for a generic one, before installing our proposed HEMS the average standby energy consumption of non-essential appliances in one year is 293.81 kWh per house, as seen in Table 4. Comparing our results with those obtained at an EU level by the comprehensive review [10], a small 3.66% offset is noted.
With a standby consumption of non-essential devices of 301.29 kWh per year and a smaller 1.21% offset, results obtained for the generic home are even closer to those published by the same study.
C   =   A B
The results of our study so far are grouped in Table 5. Row A presents the total standby energy consumption per household per year with no type of energy management implemented. With the proposed HEMS installed, on row B we observe lower standby energy consumptions.
Using Equation (9) and the values listed on rows A and B in Table 5, the energy savings generated in one year by using the proposed HEMS are calculated and presented on row C for each house. Row D contains the percentage of energy saved in relation only to the standby energy consumed (not in relation to the entire home energy consumed, this will be done next), with the average value for all homes being 52.77% as seen in Figure 13a. A similar result was reached by the authors of [5] that found a 41–54% potential decrease in standby energy consumption by controlled devices, when using an energy management system. Figure 14 illustrates the standby energy savings achievable by implementing the proposed HEMS in the analyzed houses. It can be seen that the amount of energy saved by the HEMS is more than the standby energy still consumed.
Until this point, when presenting the result we focused on the standby power reduction of non-essential appliances controlled by the HEMS. In order to further integrate our findings in the broader context of other articles, next, we take into consideration the overall energy consumption of all appliances (essential and non-essential) in the studied homes, for a one-year period. This is necessary as some authors present their findings as a percentage of energy reduction in relation to the total consumption, not only to the standby consumption as seen above in our discussion and in the results put forward by study [6]. Table 6 presents the energy savings achievable by implementing our proposed HEMS in reference to the total energy consumption in each household in one year. As seen in Figure 13b, the average amount of energy saved for the analyzed homes was 5.8%.
Several studies [8,9,10,11] concluded that standby energy represents between 5–30% of the total amount of energy used in typical households. In this context, the energy reduction achievable by using our proposed HEMS (5.8%) is closer to the lower end. However, it must be noted that when presenting our results, only the energy saved by disconnecting the supply to non-essential appliances was considered. Not included in this evaluation is the system’s function to monitor and control the indoor lights. The reason these energy-saving function was not included in the prototype evaluation is that human negligence (ex: lights forgotten on) and human behavior (ex: user not in a room but deliberately wanting to leave the TV on) are very hard to predict both in terms of frequency and duration of occurrence. As such, over the course of one year, in real-life usage, the efficiency of the proposed HEMS will be higher than the minimal value that was presented, however, it would be subject to countless random factors.

5.2. Cost Analysis

A list of components, their function and purchase price is contained in Table 7.
The prices are expressed in EUR, as they were in April 2020 and do not include shipping or labor. The total cost of components is 37.3 EUR, making it very affordable to a large segment of EU population. Comparing the initial purchase cost of the system with the yearly energy savings generated by its use (on average 33.5 EUR), it is observed that the savings outweigh the initial cost shortly after the first year of use (not including delivery and labor). This time-frame is however subject to slight variations being affected by the electricity market prices. As the electricity price increases, the savings generated by the HEMS become more valuable, outweighing the initial costs sooner, making it an even better investment both for one’s budget and for the environment.

6. Conclusions

The reduction of home energy consumption by limiting or avoiding the standby power of appliances is a topic that received increasing attention in recent years. This article presents the result of such a study that aimed to achieve the above while taking a different approach from most other studies. While popular trends are to use all wireless communication methods, we used wired ones (serial, UART) to address the health-related concerns of people believing that there are already too many sources of electromagnetic radiation in the home environment. Most other home energy management systems are designed to reduce energy consumption as much as possible, thus increasing the probability of the system’s actions becoming intrusive in the user’s lifestyle. We however designed a system that has minimal interference with users, ensuring their comfort is maintained, at the cost of lower reductions in energy savings, but savings are still achieved.
A system prototype was assembled and evaluated. Energy consumption measurements were taken in five different households and for a sixth generic house, were calculated. Using these measurements and the system prototype build, the efficiency of this energy management system in reducing the overall energy consumption of the home by limiting the standby power of controlled non-essential appliances was evaluated. Extrapolating the results to a one-year period, the standby energy consumption was reduced on average by 52.77% and the overall energy consumption reduced by 5.8%. This is achievable by controlling the standby energy consumption of non-essential household appliances when users are away or at sleep and without considering the lights’ control.
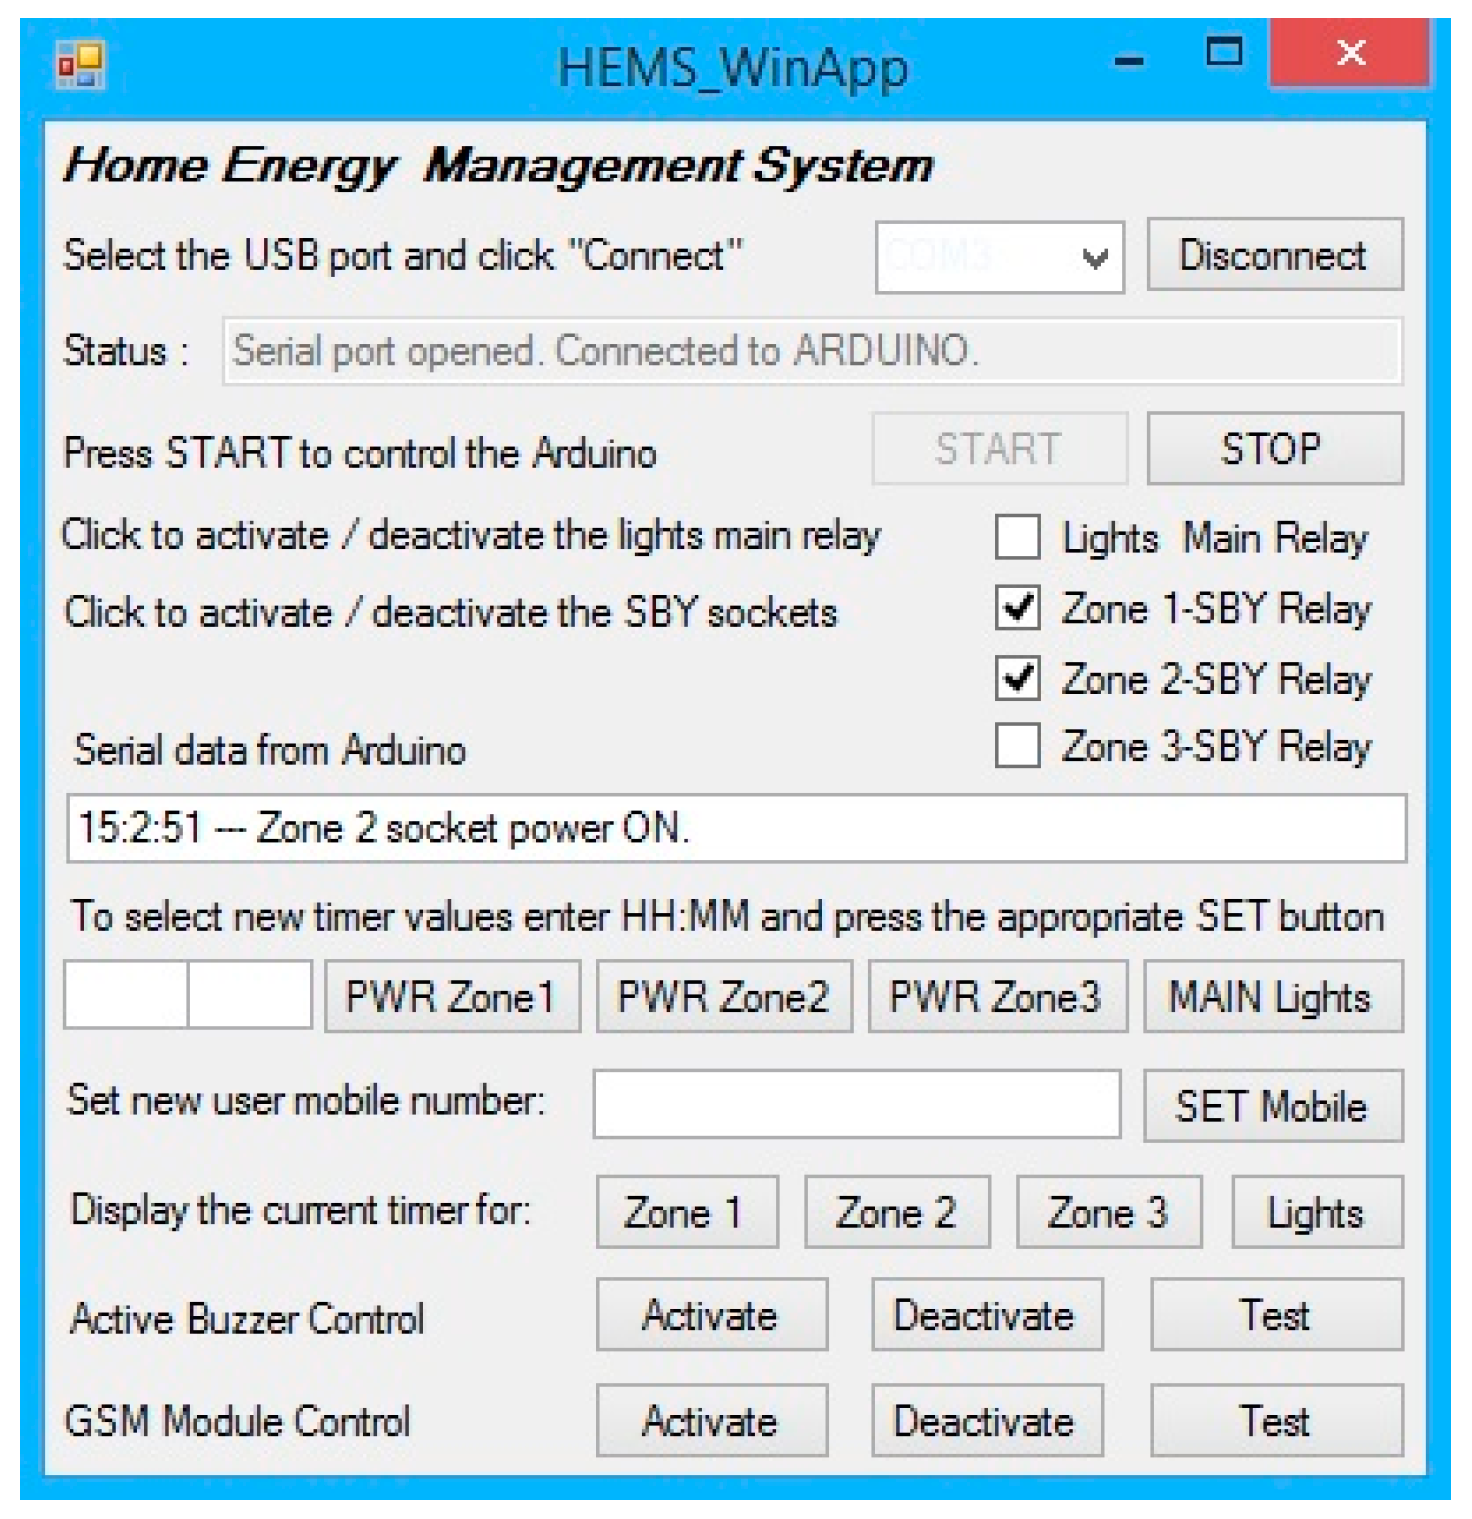
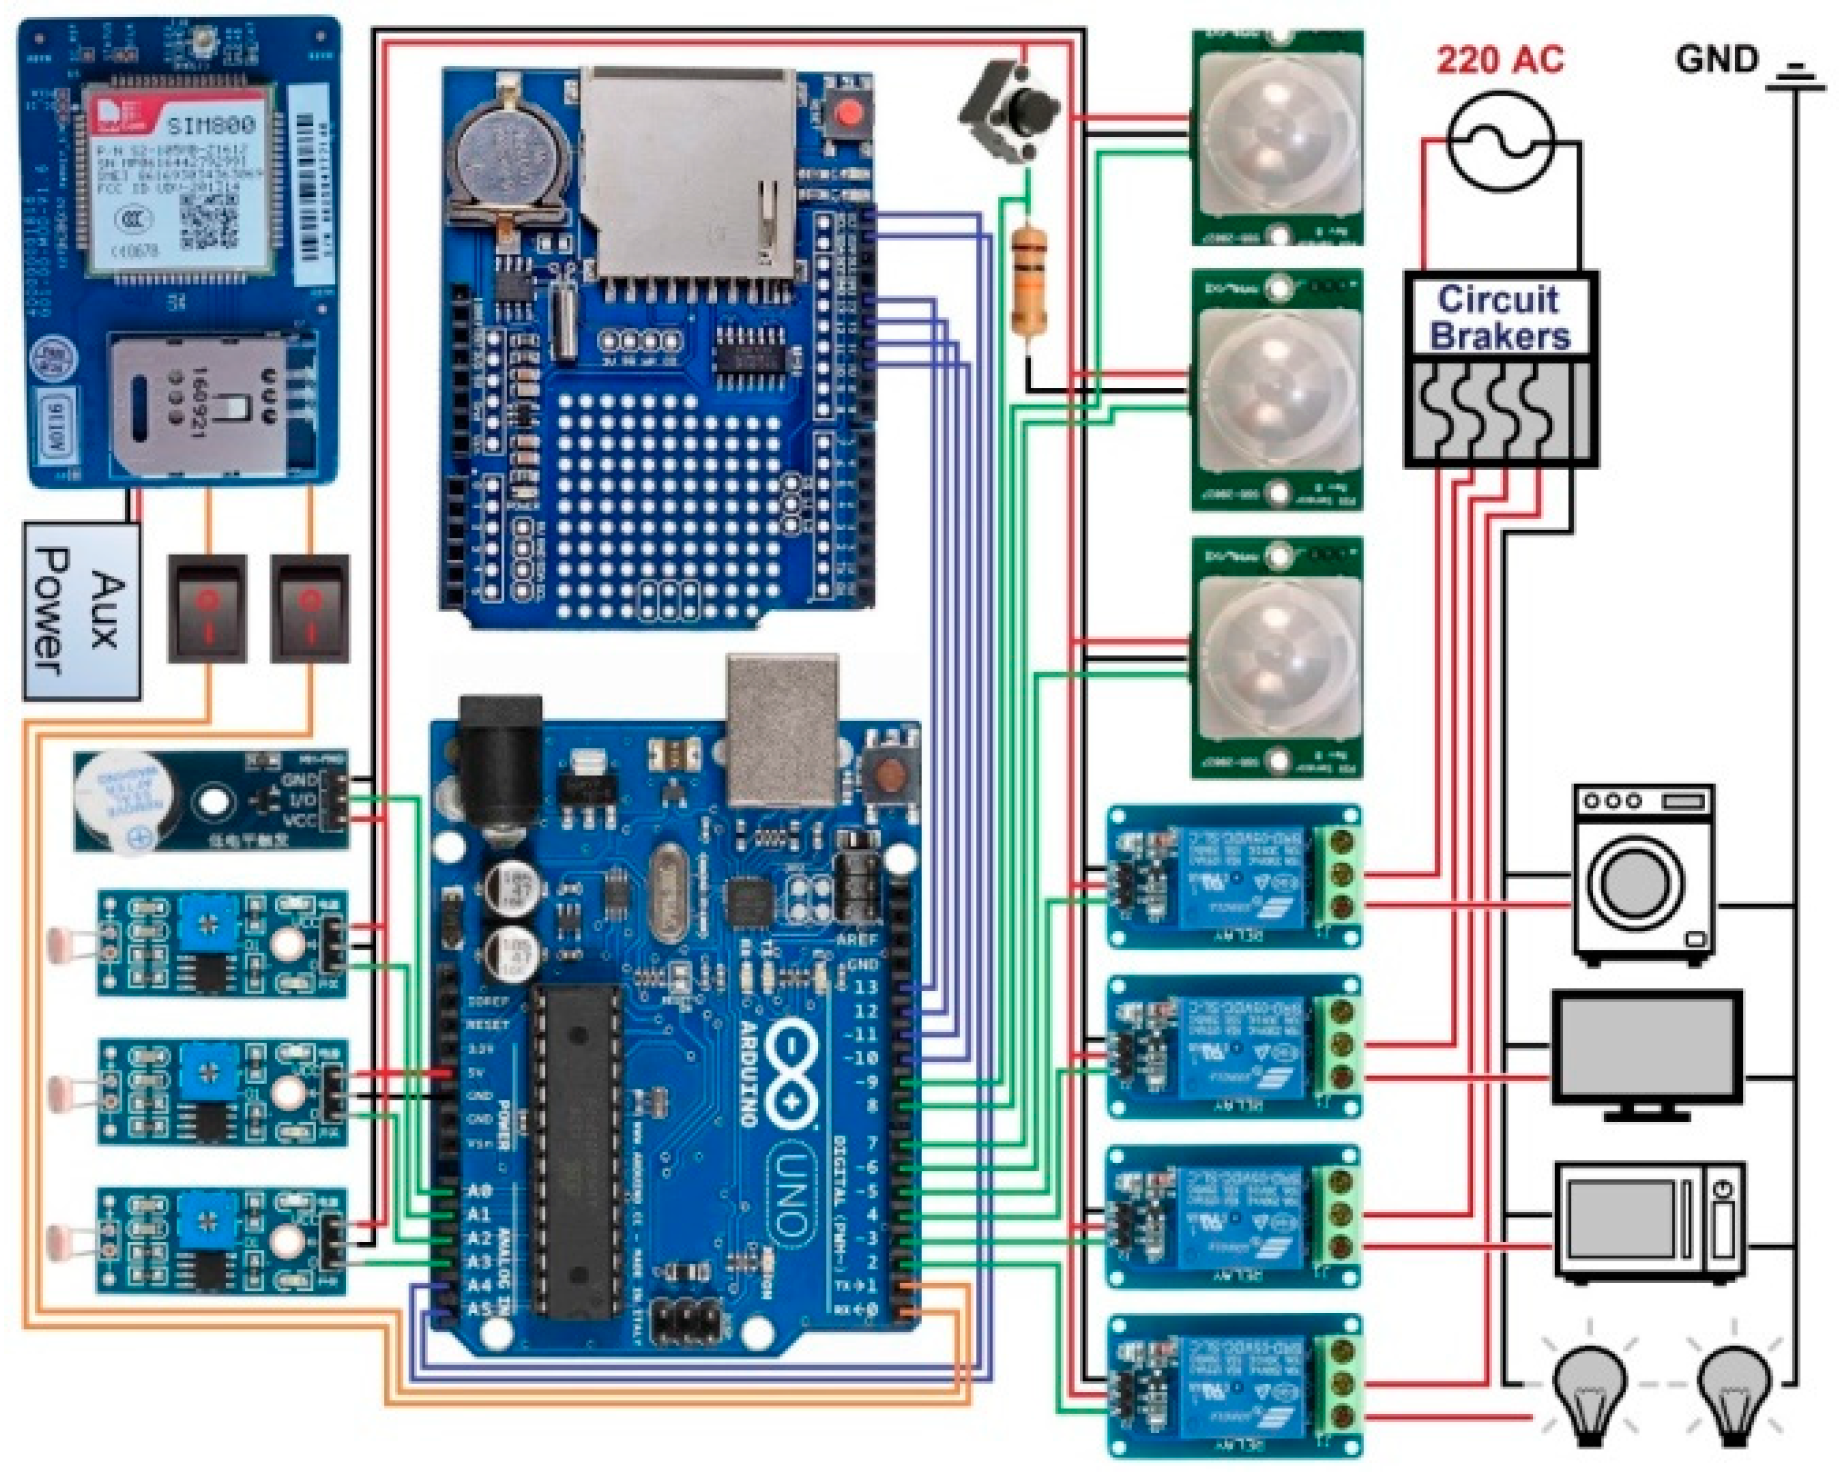
The HEMS is controlled by an AtMega328P microcontroller running a C/C++ control software specifically developed for this task and configured using a Visual C# written, Windows App. especially designed and developed for this purpose.
Cost related, the system components have a price tag of 37.3 Eur and considering the average price of electricity in 2019 in Europe and the generated power savings, it was found that in just over one year, the HEMS pays itself only from the generated savings. It was possible to design such a low-cost system by using popular and inexpensive Arduino compatible modules and board.
Our current HEMS design could serve as starting point to build future upgraded versions that could include more peripherals such as a touchscreen display for user interaction or a wider array of sensors (temperature, humidity) and implementing additional control functions, however such modifications to the current design would increase the system’s own power consumption and overall purchase costs, making it less affordable when initially purchased. However, more sensors would mean more measurements and opportunities to identify new energy-saving contexts, the cost/profit analysis of such changes would be an interesting direction for further study. It should be noted that there is no perfect HEMS design to simultaneously meet everyone’s needs and expectations. System features desired by some are not necessarily desired by others. As an example, our system limits the sources of EM radiation in the environment by implementing a wired communication method that is both reliable and less prone to interference. While some encourage this approach, others might argue that it makes the system more complex and expensive to install compared to all wireless alternatives. Another example is related to the low-cost nature of our design, with the Arduino board and compatible modules having only two-year warranties. This could be perceived by some as short periods, especially if compared to industrial-grade systems that have much longer warranties, but also much higher costs.
Considering the above, it can be safely stated that the perfect HEMS design is the one that best meets one’s budget, needs and expectations, with this paper proposing one of the most affordable HEMS design, capable of reducing a home’s energy consumption while not interfering with the user’s lifestyle and also limiting the new sources of EM radiation in the environment.

Author Contributions

Conceptualization, D.C.; Data curation, D.C.; Formal analysis, D.C.; Investigation, D.C. and H.V.; Methodology, D.C.; Project administration, H.V.; Resources, D.C. and H.V.; Software, D.C.; Supervision, H.V.; Validation, D.C. and H.V.; Visualization, D.C. and H.V.; Writing—original draft, D.C.; Writing—review & editing, D.C. and H.V. All authors have read and agreed to the published version of the manuscript.

Funding

This research received no external funding.

Institutional Review Board Statement

Not applicable.

Informed Consent Statement

Not applicable.

Data Availability Statement

Not applicable.

Acknowledgments

The authors appreciate and thank PhD. Prof. Chioran Viorica for her administrative support and Eng. Chioran Ioan for his technical support. Special thanks also go towards the unnamed home-owners that granted access to their homes for energy consumption measurements.

Conflicts of Interest

The authors declare no conflict of interest.

References

  1. Elavarasan, R.M. The Motivation for Renewable Energy and its Comparison with Other Energy Sources: A Review. Eur. J. Sustain. Dev. 2019, 3, 1–19. [Google Scholar] [CrossRef]
  2. Ritchie, H.; Roser, M. Renewable Energy. Published online at OurWorldInData.org. 2020. Available online: https://ourworldindata.org/renewable-energy (accessed on 15 May 2020).
  3. Cao, X.; Dai, X.; Liu, J. Building energy consumption status worldwide and the state of the technologies for zero-energy buildings during the past decade. Energy Build. 2016, 128, 198–213. [Google Scholar] [CrossRef]
  4. Attia, I.I.; Ashour, H.; Inji, E. Energy Saving Through Smart Home. Online J. Power Energy Eng. OJPEE 2017, 2, 223–227. [Google Scholar]
  5. Ryan, P.; Pavia, M. Evaluation of the standby energy savings potential of power control devices. ECEEE 2011, 6, 1539–1545. [Google Scholar]
  6. U.S. Energy Information Administration—Electricity in the United States. Available online: https://www.eia.gov/energyexplained/index.php?page=electricity_in_the_united_states (accessed on 11 May 2020).
  7. European Commission, Eurostat, Statistics on the Energy Consumption in Households. Available online: https://ec.europa.eu/eurostat/statisticsexplained/index.php/Energy_consumption_in_households#Energy_consumption_in_households_by_type_of_end-use (accessed on 13 May 2020).
  8. Pierre Delforge (The Natural Resources Defense Council, San Francisco, CA, USA); Lisa and Steve Schmidt (Home Energy Analytics, Los Altos, CA, USA). Home Idle Load: Devices Wasting Huge Amounts of Electricity When Not in Active Use, A report by the Natural Resources Defense Council. 2015. Available online: https://www.nrdc.org/sites/default/files/home-idle-load-IP.pdf (accessed on 11 May 2020).
  9. Pano, M. Measurements of Standby Power Consumption of Domestic Appliances in Albania. Eur. J. Interdiscip. Stud. 2017, 3, 71–74. [Google Scholar] [CrossRef]
  10. European Commission. Selina Project—Standby and Off-Mode Energy Losses in New Appliances. Available online: https://ec.europa.eu/energy/intelligent/projects/sites/iee-projects/files/projects/documents/selina_book_en.pdf (accessed on 13 May 2020).
  11. Gerber, D.L.; Meier, A.; Liou, R.; Hosbach, R. Emerging Zero-Standby Solutions for Miscellaneous Electric Loads and the Internet of Things. Electronics 2019, 8, 570. [Google Scholar] [CrossRef] [Green Version]
  12. Bhati, A.; Hansen, M.; Chan, C.M. Energy conservation through smart homes in a smart city: A lesson for Singapore households. Energy Policy 2017, 104, 230–239. [Google Scholar] [CrossRef]
  13. Chobot, E.; Newby, D.; Chandler, R.; Abu-Mulaweh, N.; Chen, C.; Pomalaza-Ráez, C. Design and implementation of a wireless sensor and actuator network for energy measurement and control at home. IJESA 2013, 3, 1–15. [Google Scholar] [CrossRef]
  14. Santhoshsivan, N.V.; Senthilkumar, S.; Arunkumar, K.; Umasankar, S.; Jagadeeshraja, M. Home automation using smartplug. IRJET 2019, 6, 8173–8177. [Google Scholar]
  15. Lien, C.H.; Chen, H.C.; Bai, Y.W.; Lin, M.B. Power monitoring and control for electric home appliances based on power line communication. In Proceedings of the 2008 IEEE Instrumentation and Measurement Technology Conference, Victoria, BC, Canada, 12–15 May 2008. [Google Scholar]
  16. Horvat, I.; Lukac, N.; Pavlovic, R.; Starcevic, D. Smart plug solution based on Bluetooth low energy. In Proceedings of the IEEE 5th International Conf. on Consumer Electronics, Berlin, Germany, 6–9 September 2015. [Google Scholar]
  17. Lien, C.H.; Bai, Y.W.; Lin, M.B. Remote-controllable power outlet system for home power management. IEEE Trans. Consum. Electron. 2007, 53, 1634–1641. [Google Scholar] [CrossRef]
  18. Ma, M.; Huang, B.; Wang, B.; Chen, J.; Liao, L. Development of an Energy-Efficient Smart Socket Based on STM32F103. Appl. Sci. 2018, 8, 2276. [Google Scholar] [CrossRef] [Green Version]
  19. Girish, M.; Chandan, G.N.; Pavithra, A.C. XBee based Remote-Controllable and Energy-Saving Room Architecture. IRJET 2016, 3, 2455–2459. [Google Scholar]
  20. Han, J.; Lee, H.; Park, K.R. Remote—Controllable and energy—Saving room architecture based on ZigBee communication. IEEE Trans. Consum. Electron. 2009, 55, 264–268. [Google Scholar] [CrossRef]
  21. Krishna, A.B.; George, A.T.; Nasreen, N.F. Home energy management system based on power line communication. IRJET 2017, 4, 2532–2535. [Google Scholar]
  22. Tripathi, A.; Mukhi, A.; Poojary, R.; Samudre, N. Home Energy Management System Based on Power Line Communication. IOSR JEN 2019, 8, 50–53. [Google Scholar]
  23. Sudarsanan, C.; Manivannan, M.S.; Divya, A.C. Automation of Home Energy Management System and Energy Monitoring Using ZIGBEE and GSM. IJRASET 2015, 3, 323–327. [Google Scholar]
  24. Rajpoot, S.S.; Khandelwal, A. Home Energy Control System Using Wireless Smart Socket and IoT. IJEECE 2018, 7, 14–20. [Google Scholar]
  25. Collotta, M.; Pau, G. A Solution Based on Bluetooth Low Energy for Smart Home Energy Management. Energies 2015, 8, 11917–11938. [Google Scholar] [CrossRef] [Green Version]
  26. Jithin, M.G.; Krishnan, A.; Sukumaran, S. Smart Energy Saving System Based On Standby Power Reduction. IJIRAS 2015, 2, 65–68. [Google Scholar]
  27. Lee, M.; Uhm, Y.; Kim, Y.; Kim, G.; Park, S. Intelligent power management device with middleware based living pattern learning for power reduction. IEEE Trans. Consum. Electron. 2009, 55, 2081–2089. [Google Scholar] [CrossRef]
  28. Tripathi, A.; Selvam, C.; Srinivas, K. Building Energy Management System Using Powerline Communication. Int. J. Sci. Eng. Res. 2014, 5, 998–1003. [Google Scholar]
  29. Hu, Q.R.; Li, F.X. Hardware design of smart home energy management system with dynamic price response. IEEE Trans. Smart Grid 2013, 4, 1878–1887. [Google Scholar] [CrossRef]
  30. Modi, L.; Dhakar, K.S.; Ram, L. Smart Home Energy Management System Including Renewable Energy Based on ZigBee and PLC. SSRG-IJEEE 2016, 3, 84–88. [Google Scholar]
  31. Palensky, P.; Dietrich, D. Demand side management: Demand response, intelligent energy systems, and smart loads. IEEE Trans. Ind. Inf. 2011, 7, 381–388. [Google Scholar] [CrossRef] [Green Version]
  32. Apostolopoulos, P.A.; Tsiropoulou, E.E.; Papavassiliou, S. Demand response management in smart grid networks: A two-stage game-theoretic learning-based approach. Mob. Netw. Appl. 2018, 10, 1–14. [Google Scholar] [CrossRef] [Green Version]
  33. Tsai, K.L.; Leu, F.Y.; You, I. Residence energy control system based on wireless smart socket and IoT. IEEE Access 2016, 4, 2885–2894. [Google Scholar] [CrossRef]
  34. Chioran, D.; Valean, H. Arduino based Smart Home Automation System. IJACSA 2020, 11, 67–73. [Google Scholar] [CrossRef]
  35. Lawrence Berkeley National Laboratory, U.S. Department of Energy, University of California. Available online: https://standby.lbl.gov/data/summary-table/ (accessed on 15 May 2020).
Figure 1. Home energy management system. (a) The placement of system components in typical homes. (b) Home energy management system’s architecture.
Energies 14 01668 g001
Figure 2. Converting brightness fluctuations in voltage variations. (a) The voltage divider’s diagram; (b) voltage variation as a function of resistance.
Energies 14 01668 g002
Figure 3. Indoor light intensity fluctuation in 24 h.
Energies 14 01668 g003
Figure 4. Diagram of the relay modules used to control different loads in the home.
Energies 14 01668 g004
Figure 5. Flow diagram of the system’s main software components.
Energies 14 01668 g005
Figure 6. Flow diagram of the system’s data management and back-up functions.
Energies 14 01668 g006
Figure 7. Flow diagram of the system’s lights monitor and control function.
Energies 14 01668 g007
Figure 8. Flow diagram of the power sockets control function.
Energies 14 01668 g008
Figure 9. Flow diagram of the system’s data management function.
Energies 14 01668 g009
Figure 10. Windows-based Visual C# App.
Energies 14 01668 g010
Figure 11. Structure of a data package.
Energies 14 01668 g011
Figure 12. Wiring diagram of the system’s components.
Energies 14 01668 g012
Figure 13. Graphical representation of the obtained results: (a) The percentage of energy saved in relation only to the standby energy consumption in households; (b) the percentage of energy saved in relation to the total energy consumption in households.
Energies 14 01668 g013
Figure 14. Comparison between the power consumption in the analyzed houses.
Energies 14 01668 g014
Table 1. Measured and calculated standby (Sby) energy consumption.
UnitHouse 1House 2House 3House 4House 5Generic House
Appliancespieces111212101212
Sby Energy Used /1 hkWh0.02820.02760.03380.03220.04460.0343
Sby Energy Used/24 hkWh0.67680.66240.81120.77281.07040.8232
Sby Energy Used/year *kWh247.70242.43296.89282.84391.76301.29
* 2020 was a leap year with 366 days.
Table 2. The total time when non-essential appliances can be switched off.
UnitHouse 1House 2House 3House 4House 5Generic House
A = During one day H:Min9:309:409:009:3010:009:00
B = During one nightH:Min7:157:457:157:307:007:00
C = During one year *H:Min5038:005262:504912:305129:305072:004821:00
* 2020 was a leap year with 366 days.
Table 3. The amount of energy that can be saved in one year using the proposed Home Energy Management System (HEMS).
UnitHouse 1House 2House 3House 4House 5Generic House
CH:Min5038:005262:504912:305129:305072:004821:00
DkWh0.02820.02760.03380.03220.04460.0343
EkWh0.00150.00150.00150.00150.00150.0015
F = C × (D − E)kWh142.07145.25166.04165.17226.21165.36
G = F × 0.2159Euro27.8328.513332.8145.9932.85
C = The total time when non-essential appliances (in standby) can be switched off. D = Energy consumption per hour by appliances in standby modes. E = The system’s own energy consumption per hour. F = Energy that can be saved/year using HEMS. G = Financial savings/year using HEMS.
Table 4. The average standby energy consumption per year without using HEMS.
UnitHouse 1House 2House 3House 4House 5Generic House
Individual/year *kWh247.70242.43296.89282.84391.76301.29
Average/year *kWh293.81
* 2020 was a leap year with 366 days.
Table 5. Comparison between the energy consumption in the same house, with and without HEMS installed.
UnitHouse 1House 2House 3House 4House 5Generic House
AkWh247.70242.43296.89282.84391.76301.29
BkWh118.8110.35144.02130.84178.72149.1
C = A − BkWh128.9132.08152.87152213.04152.19
D = (100 × C)/A%52.0354.4851.4953.7454.3850.51
A = The standby energy consumption per year with No HEMS installed. B = The standby energy consumption per year With HEMS installed. C = Total energy saved per year by using the proposed HEMS. D = Percentage of the initial energy consumption saved.
Table 6. The total energy reduction achievable in one year in relation to the total energy consumption of that respective home.
UnitHouse 1House 2House 3House 4House 5Generic House
AkWh2251.812203.926992571.273561.452739
BkWh128.9132.08152.87152213.04152.19
C = (100 × B)/A%5.725.995.665.915.985.55
A = Total energy consumption in one year for each analyzed home. B = Energy saved in one year by the proposed HEMS. C = Percentage of the initial energy consumption saved by the proposed HEMS.
Table 7. The total cost of the system’s components.
ModuleQuantityFunctionUnit PriceTotal Price
PICHC-SR5013Motion detection module1.24 €3.72 €
LM3933Light detection module0.74 €2.22 €
Power Relay4Switch power circuits on/off1.66 €6.64 €
Active Buzzer1Acoustic alert device0.83 €0.83 €
Push Button
+ 10 k ohm res.
1Signals the HEMS to switch between operating modes0.41 €0.41 €
GSM module1Facilitates the long-distance control13.99 €13.99 €
Data logger shield1Saves data on the SD card4.50 €4.50 €
Arduino Uno1Microcontroller board4.99 €4.99 €
TOTAL15n/an/a37.3 €
Publisher’s Note: MDPI stays neutral with regard to jurisdictional claims in published maps and institutional affiliations.

