Article

Impact of the Reduction of Diesel Fuel Subsidy in the Design of an Off-Grid Hybrid Power System: A Case Study of the Bellavista Community in Ecuador

1
Centro de Energías Renovables y Alternativas (CERA), Escuela Superior Politécnica del Litoral (ESPOL), Km. 30.5 Vía Perimetral, Guayaquil EC90902, Ecuador
2
Architecture, Built Environment and Construction Engineering Department, Politecnico di Milano, Via Bonardi 9, 20133 Milano, Italy
3
Electric and Computer Engineering Department, Villanova University, Villanova, PA 19085, USA
4
Facultad de Ingeniería en Electricidad y Computación (FIEC), Escuela Superior Politécnica del Litoral (ESPOL), Km. 30.5 Vía Perimetral, Guayaquil EC90902, Ecuador
*
Author to whom correspondence should be addressed.
Energies 2021, 14(6), 1730; https://doi.org/10.3390/en14061730
Submission received: 25 February 2021 / Revised: 8 March 2021 / Accepted: 17 March 2021 / Published: 20 March 2021

Abstract

:
This paper presents a technical, economic, and environmental analysis and optimization of the impact of the reduction of diesel fuel subsidy in the design of an off-grid hybrid power system (OHPS). The OHPS includes a diesel generator, battery energy storage system (BESS), and a solar power system (SPS). This impact will focus on the electricity production levels of each of the OHPS components according to the increase of the fuel price and the SPS size. The Bellavista community in Ecuador was selected as the case study for this work. In this South American country, the government has begun a gradual increase in the diesel fuel price until it reaches international prices. Fifteen scenarios of OHPSs were simulated, in Homer Pro software, considering three SPS sizes and varying the diesel fuel price in five values. The annual load profile for the simulations was built based on the information of a previous study in this community. The results showed that for lower fuel prices (USD$0.26/L and USD$0.35/L), the OHPSs worked mostly with their diesel generators with reduced use of their BESSs. However, there was a higher penetration of the power delivered from the SPSs and BESSs, with higher fuel prices (USD$0.44/L, USD$0.53/L, and USD$0.62/L). These OHPSs considerably reduced their CO2 emissions compared with the standalone diesel generator scenario.

1. Introduction

Access to affordable, clean, and reliable energy has attracted much attention from the research as well as the humanitarian community in recent years. Driven by the United Nation’s Sustainable Development Goals (SDGs) [1], researchers and practitioners are exploring innovative approaches to provide access to electricity, particularly for remote and isolated areas removed from a viable utility grid. Remote isolated areas usually rely on standalone diesel generators (DGs) to supply the electricity demand in these communities. However, fuel security is a great concern for community members, as fuel prices and transportation costs can vary dramatically and unexpectedly. This is more evident in the current global pandemic, where the effects of COVID-19, such as reduction of gasoline and fuel consumption, as well as reduction in electricity demand and CO2 emissions, are still being analyzed [2,3]. Renewable energy sources, particularly solar and wind energy, have been implemented in isolated communities to reduce greenhouse gas (GHG) emissions. Nonetheless, the intermittent nature of renewable resources can limit the efficiency and reliability of such systems. Hybrid systems combine various power sources such as diesel generators, solar power systems, and battery energy storage systems (BESSs) to provide a reliable, more efficient electricity production, with fewer emissions and maintenance requirements when compared to a standalone DG. Nevertheless, the techno-economic performance of these systems is also dependent on the conditions of the site to be installed, such as the dominant energy mix and the energy costs. In the Ecuadorian context, the government subsidized the price of diesel fuel until 2020. Nowadays, this subsidy is being gradually reduced until the fuel price reaches international market values. Then, the main contribution of this paper is to know the impact of the rise of diesel fuel price on the costs, electricity productions, renewable energy penetrations, and CO2 emissions in each analyzed scenario.

2. Literature Review

Hybrid systems have been extensively analyzed in the literature to determine techno-economic feasibility, sensitivity, and size and production optimization analysis of different combinations of power systems [4,5,6]. In [7], Lau et al. describe the performance analysis of a hybrid solar power system (SPS)/DG configuration in Malaysia. NREL’s Homer Pro was used to analyze the impact of SPS penetration and costs under various hybrid configurations. The emphasis of the analysis was on fuel savings and the reduction of carbon emissions. The optimization analysis results showed that the standalone DG design would produce the lowest cost of energy (COE) as well as the lowest total net present cost (NPC) given the price of diesel, however, the hybrid SPS/DG configuration provided significant carbon emission reductions and is still a viable option in remote locations in Malaysia. In [8], Hossain Lipu et al. describe the design optimization and sensitivity analysis for a Hybrid SPS/wind/DG configuration for Saint Martin Island in Bangladesh. Homer Pro is used to perform the simulation and optimization based on NPC and COE for different scenarios. The results show that a hybrid SPS/wind/DG configuration provides the lowest NPC and COE parameters than wind/DG, wind/SPS, SPS/DG, standalone SPS, and standalone wind scenarios. These results were validated and compared to other hybrid renewable energy systems in locations such as Bangladesh, India, Malaysia, Thailand, and Turkey, resulting in one of the minimum NPC and COE indicators of the projects analyzed.
In [9], the authors considered the performance analysis of an off-grid hybrid wind/SPS/DG and battery system for a remote area. The analysis was performed on Homer Pro using solar radiation and wind data for the site in Malaysia. The results show that an optimized system including an 18 kW SPS, 2–10 kW wind turbines, and a 15 kW DG produces a COE of USD$1.88/kWh, which is lower than conventional power plants. In addition, the hybrid system provides a reduction of CO2 and greenhouse gas (GHG) emissions, as well as limiting the requirements for fuel transportation which is an issue for remote locations. In [10], the authors present the feasibility study of a hybrid SPS/wind/biomass configuration including battery storage for an islanded microgrid in a rural location in Punjab, India. The optimal sizing of components was achieved through a swarm-based artificial bee colony (ABC) algorithm, to minimize the NPC to select the system with the least levelized cost of energy (LCOE). The optimization was also validated using Homer Pro. The results show that the ABC algorithm provides a better estimation for the optimal system showing a combination of 250 kW of solar PV, 19 kW of wind turbines, 1400 batteries, and a 40 kW gasifier with an annualized system cost of USD$63,006/year and an LCOE of USD$0.173/kWh. In [11], the authors propose a co-optimization scheme for distributed energy resource (DER) planning in community microgrids to minimize total annualized cost at maximal fuel savings. A combination of Lagrange multipliers, Fourier transform, and particle swarm optimization methods are used to determine the optimal system. The results are compared with a simulation using Homer Pro. The optimal system is sized by identifying renewable energy resources, considering fuel savings and CO2 emissions reductions as a first step; then, sizing dispatchable generation units such as BESSs; performing parity checks; and using technical and economical evaluation indices such as renewable energy utilization, fuel savings, and annualized cost. A case study of a village community in Ohio, USA, shows the validity of the model by sizing a hybrid wind/SPS/biomass configuration, which was validated through cost minimization using Homer Pro.
Ecuador is a country that has greatly subsidized fuel prices. Currently, the National Government is seeking to eliminate fuel subsidies progressively over the next few years [12], bringing the local fuel prices to match regional and international prices. Diesel fuel prices in neighboring countries such as Peru, Argentina, Colombia, Chile, and Brazil are over USD$0.57/L, at the start date of this work [13]. Having a current fuel price of USD$0.26/L, the Ecuadorian Government is subsidizing at least 50% of the real price of this oil derivative [14].
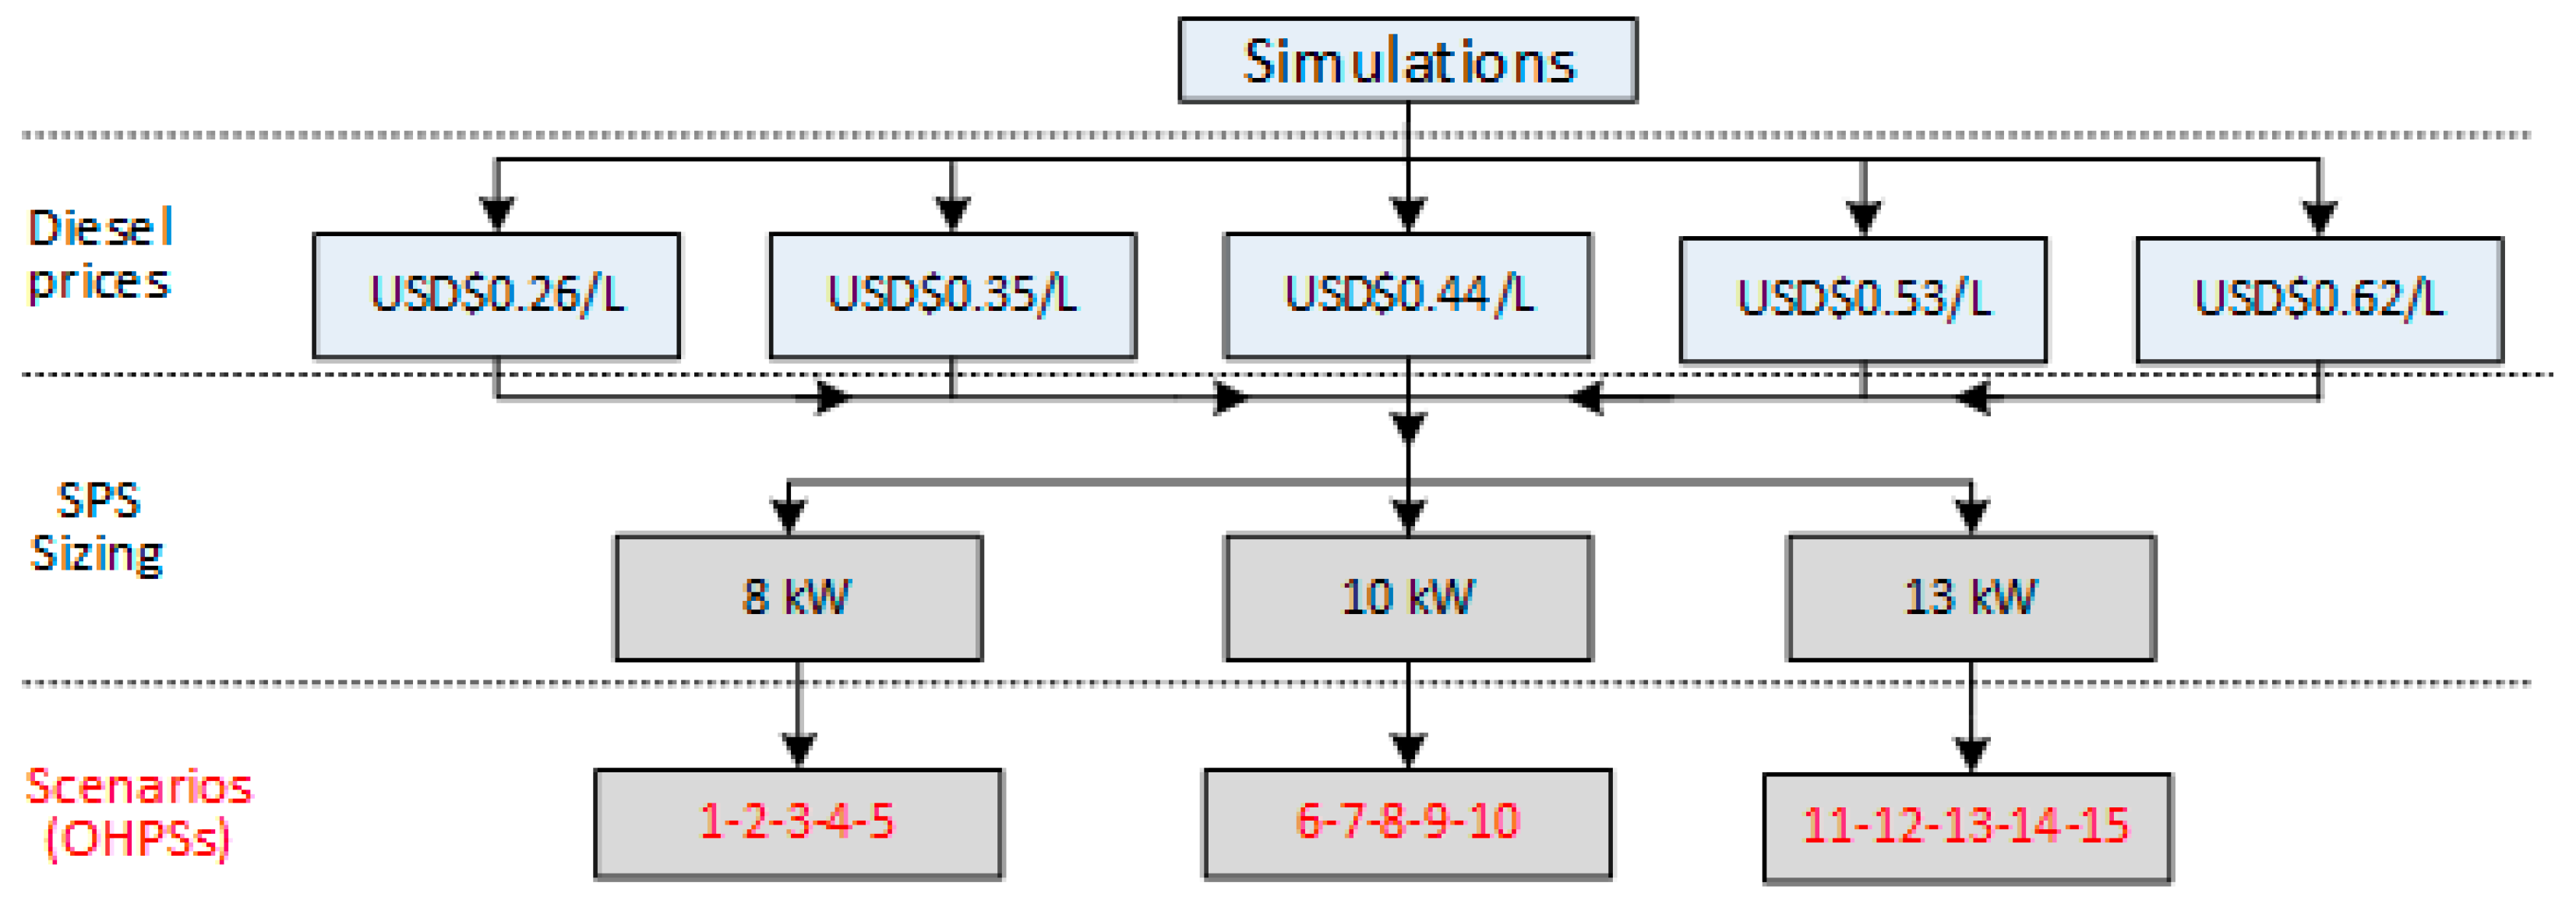
This paper presents a technical, economic, and environmental analysis and optimization of the impact of the reduction of diesel subsidy in the design of an off-grid hybrid power system (OHPS). The Bellavista community in Ecuador was selected as the case study for this work due to the ongoing relationship with stakeholders in neighboring islands built through the deployment of renewable energy projects. This impact will focus on the electricity production levels of each of the OHPS components (SPS, DG, and BESS) according to the increase of fuel price and the SPS size within the optimization model in Homer Pro [15]. The SPSs changed in three sizes, which were 8 kW, 10 kW, and 13 kW. The diesel fuel price was USD$0.26/L at the start time of this work [13], whose price was also increased in USD$0.35/L, USD$0.44/L, USD$0.53/L, and USD$0.62/L.

3. Methodology

The methodology of this study is divided into different subsections to provide a clear explanation of the methodological sequence. First, we describe the general characteristics of the site location and climate, where the studied community is located. Then, we introduce the case study, the aspects of the systems to be simulated in Homer Pro. Finally, we define the scenarios, which depend on the fuel price and the SPS size.

3.1. Site Location

The Bellavista community is a small settlement of people in an isolated island in the Gulf of Guayaquil, Province of Guayas—Ecuador (Figure 1). The GPS coordinates of this place are 2°27′33.09″ S and 79°55′21.33″ W with an elevation of 9 meters above sea level. The community has a population of 136 people where there are 22 homes [16]. Other buildings found in this place are a church, school, and health center. In addition, this community has street lighting, which has eight LED lamps (each of 150 W).

3.2. Climate Conditions

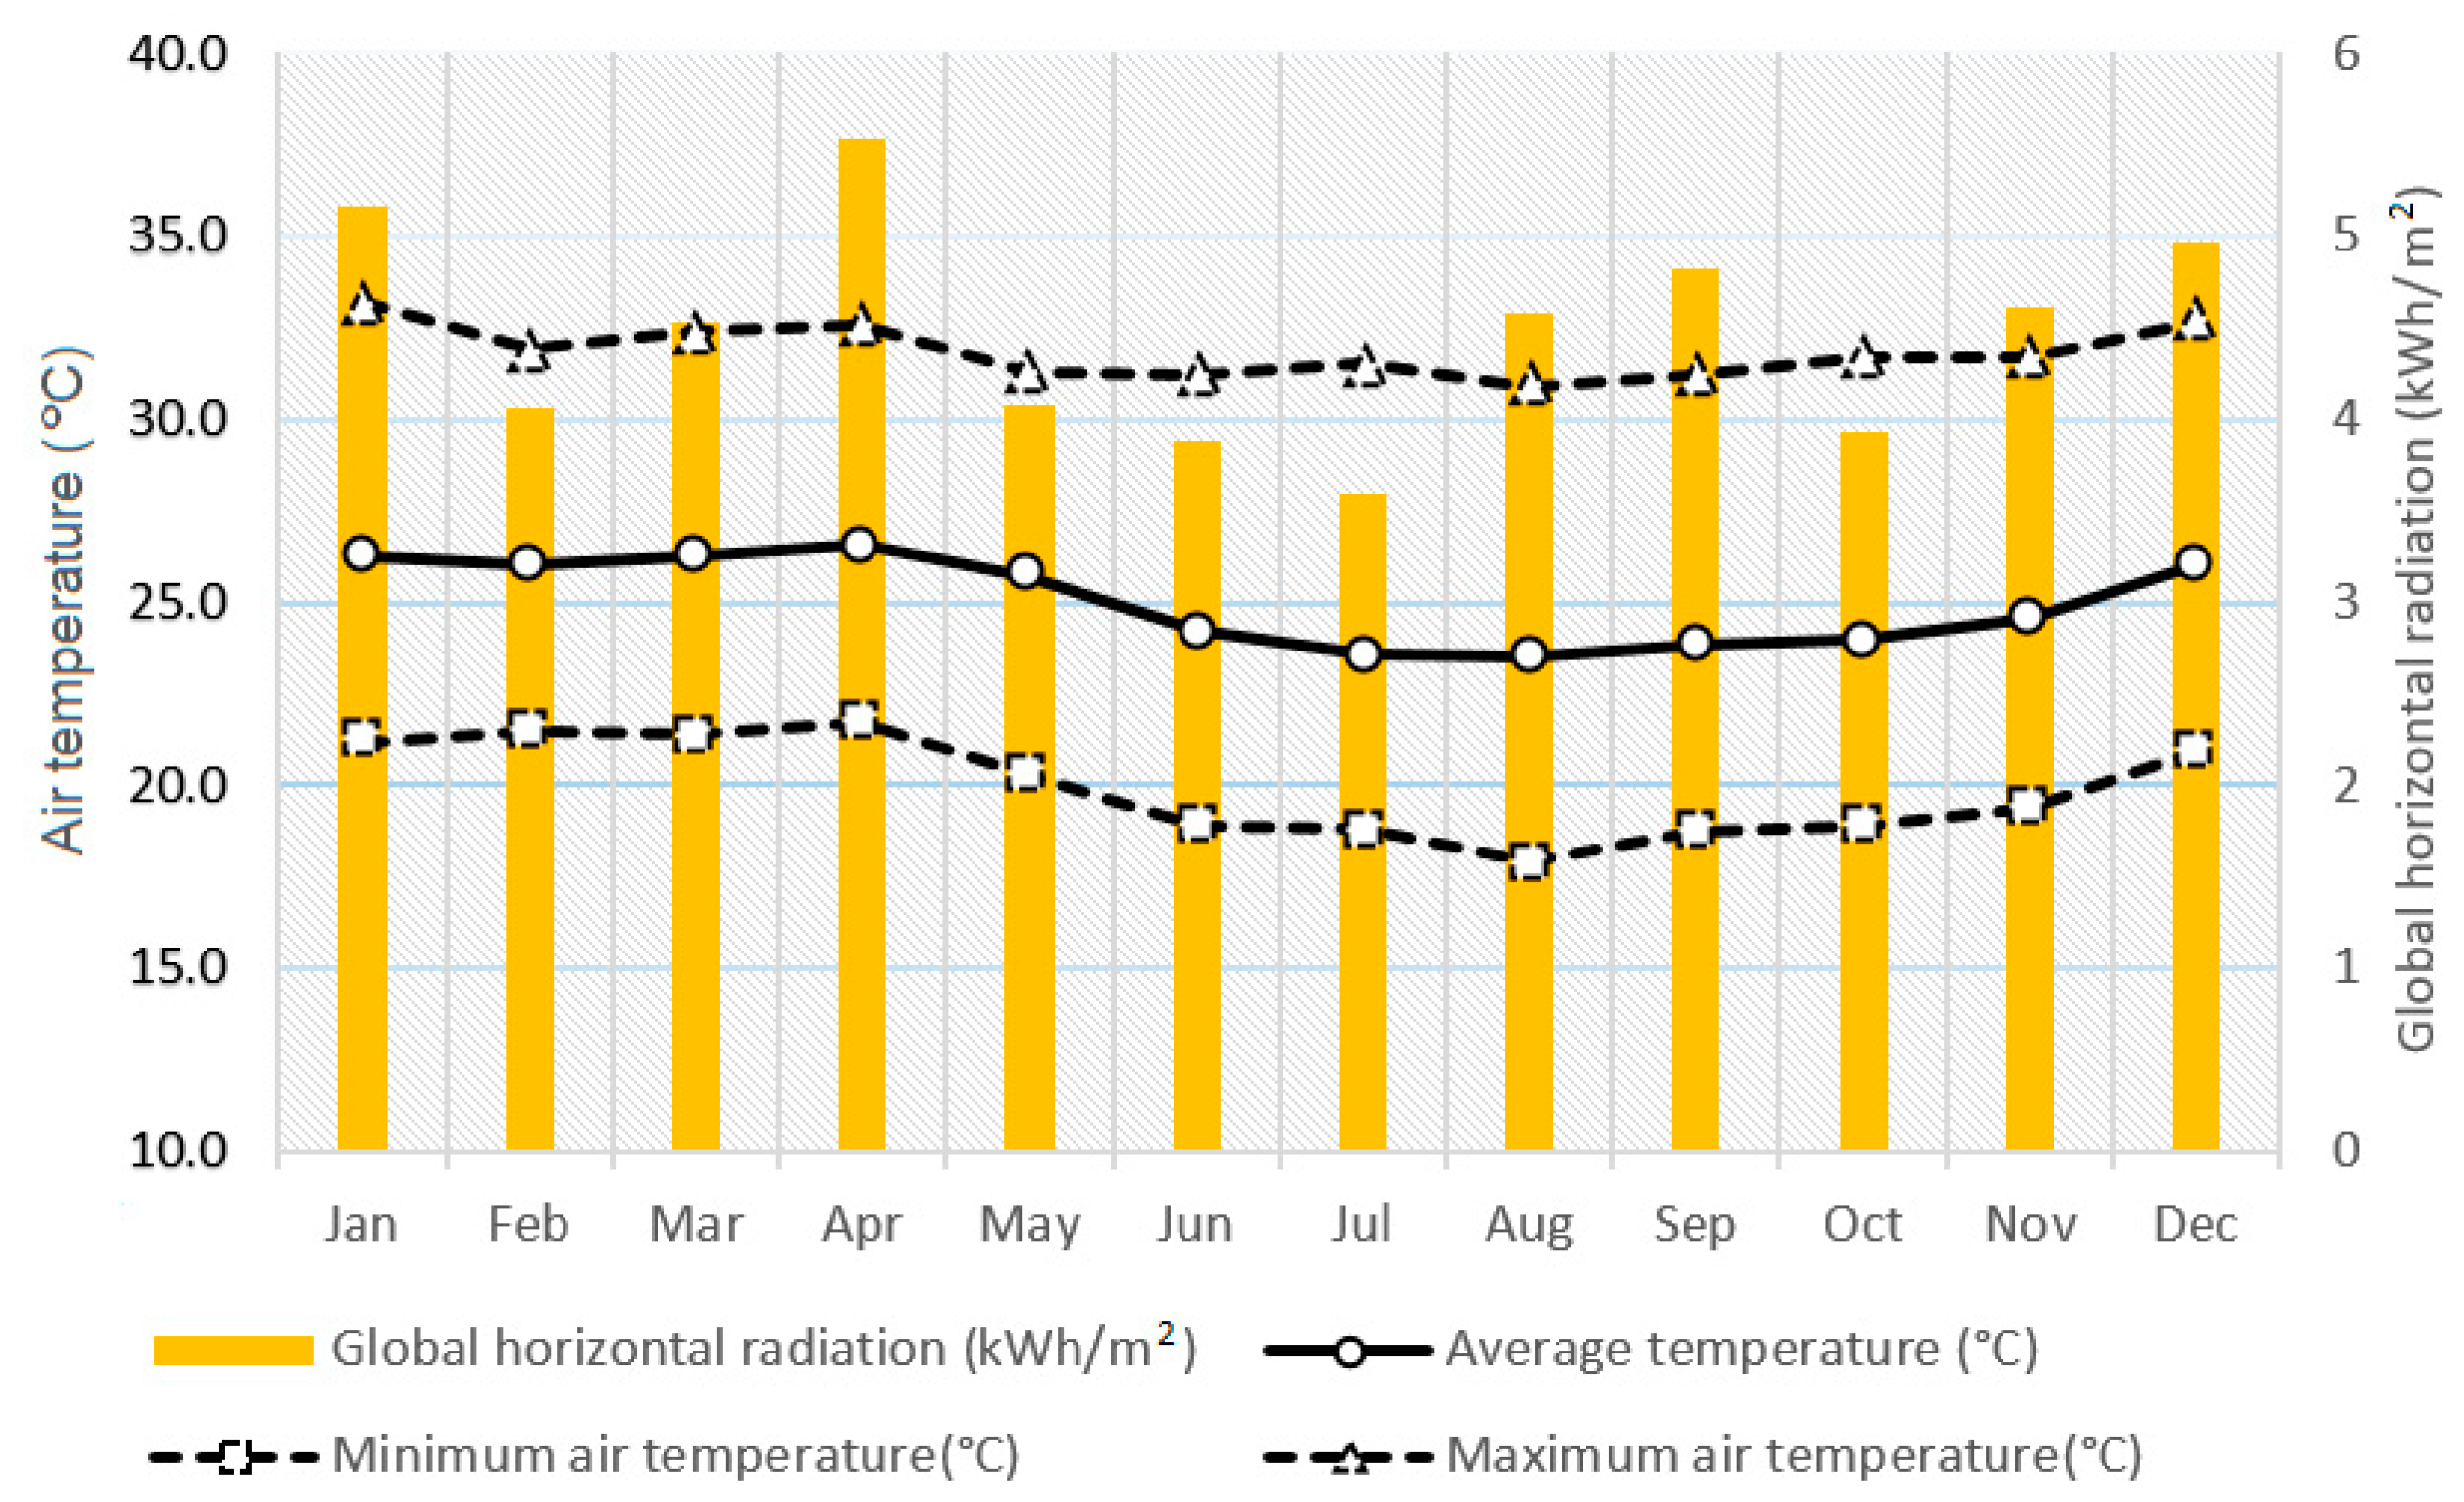
The Bellavista community is characterized by a semi-arid and hot climate according to the BSh group of the Köppen–Geiger classification [17]. In Ecuador, there are two well-defined seasons, the wet (Jan–Apr) and dry (May–Dec) seasons. Figure 2 shows the behavior of the air temperature (average, maximum, and minimum) and the global horizontal radiation during a typical year in this community [18]. In addition, the community has low wind speeds during the year with an annual average of less than 2 m/s.

3.3. Load Profile

Table 1 shows the electrical load of the 22 homes in the community. It is according to information obtained in the community during 2019 [16]. Here, we can identify five load sectors, which are the home sector, street lighting, school, health center, and church. The community annual load profile was estimated with a daily random variation of ±5% with a daily base electricity consumption of 56.22 kWh. With this profile, we obtained an annual average daily electricity consumption of 55.18 kWh, a maximum hourly peak power of 7.77 kW, and an hourly average power of 2.3 kW. Figure 3a shows the hourly power demand of the community through each month of the year. Figure 3b shows the daily electricity consumption for each month. It should be mentioned that the annual electricity consumption increased by 1% per year for design considerations for the 15-year time horizon.
Electricity in the community is currently being supplied by a 45 kW diesel generator [19]. According to information obtained from a survey administered to the inhabitants of this community, this generator is very old, and it is dealing with frequent breakdowns in its operation. This electric machine was donated by an Ecuadorian government entity several years ago.

3.4. Design Configuration of an Off-Grid Hybrid Power System

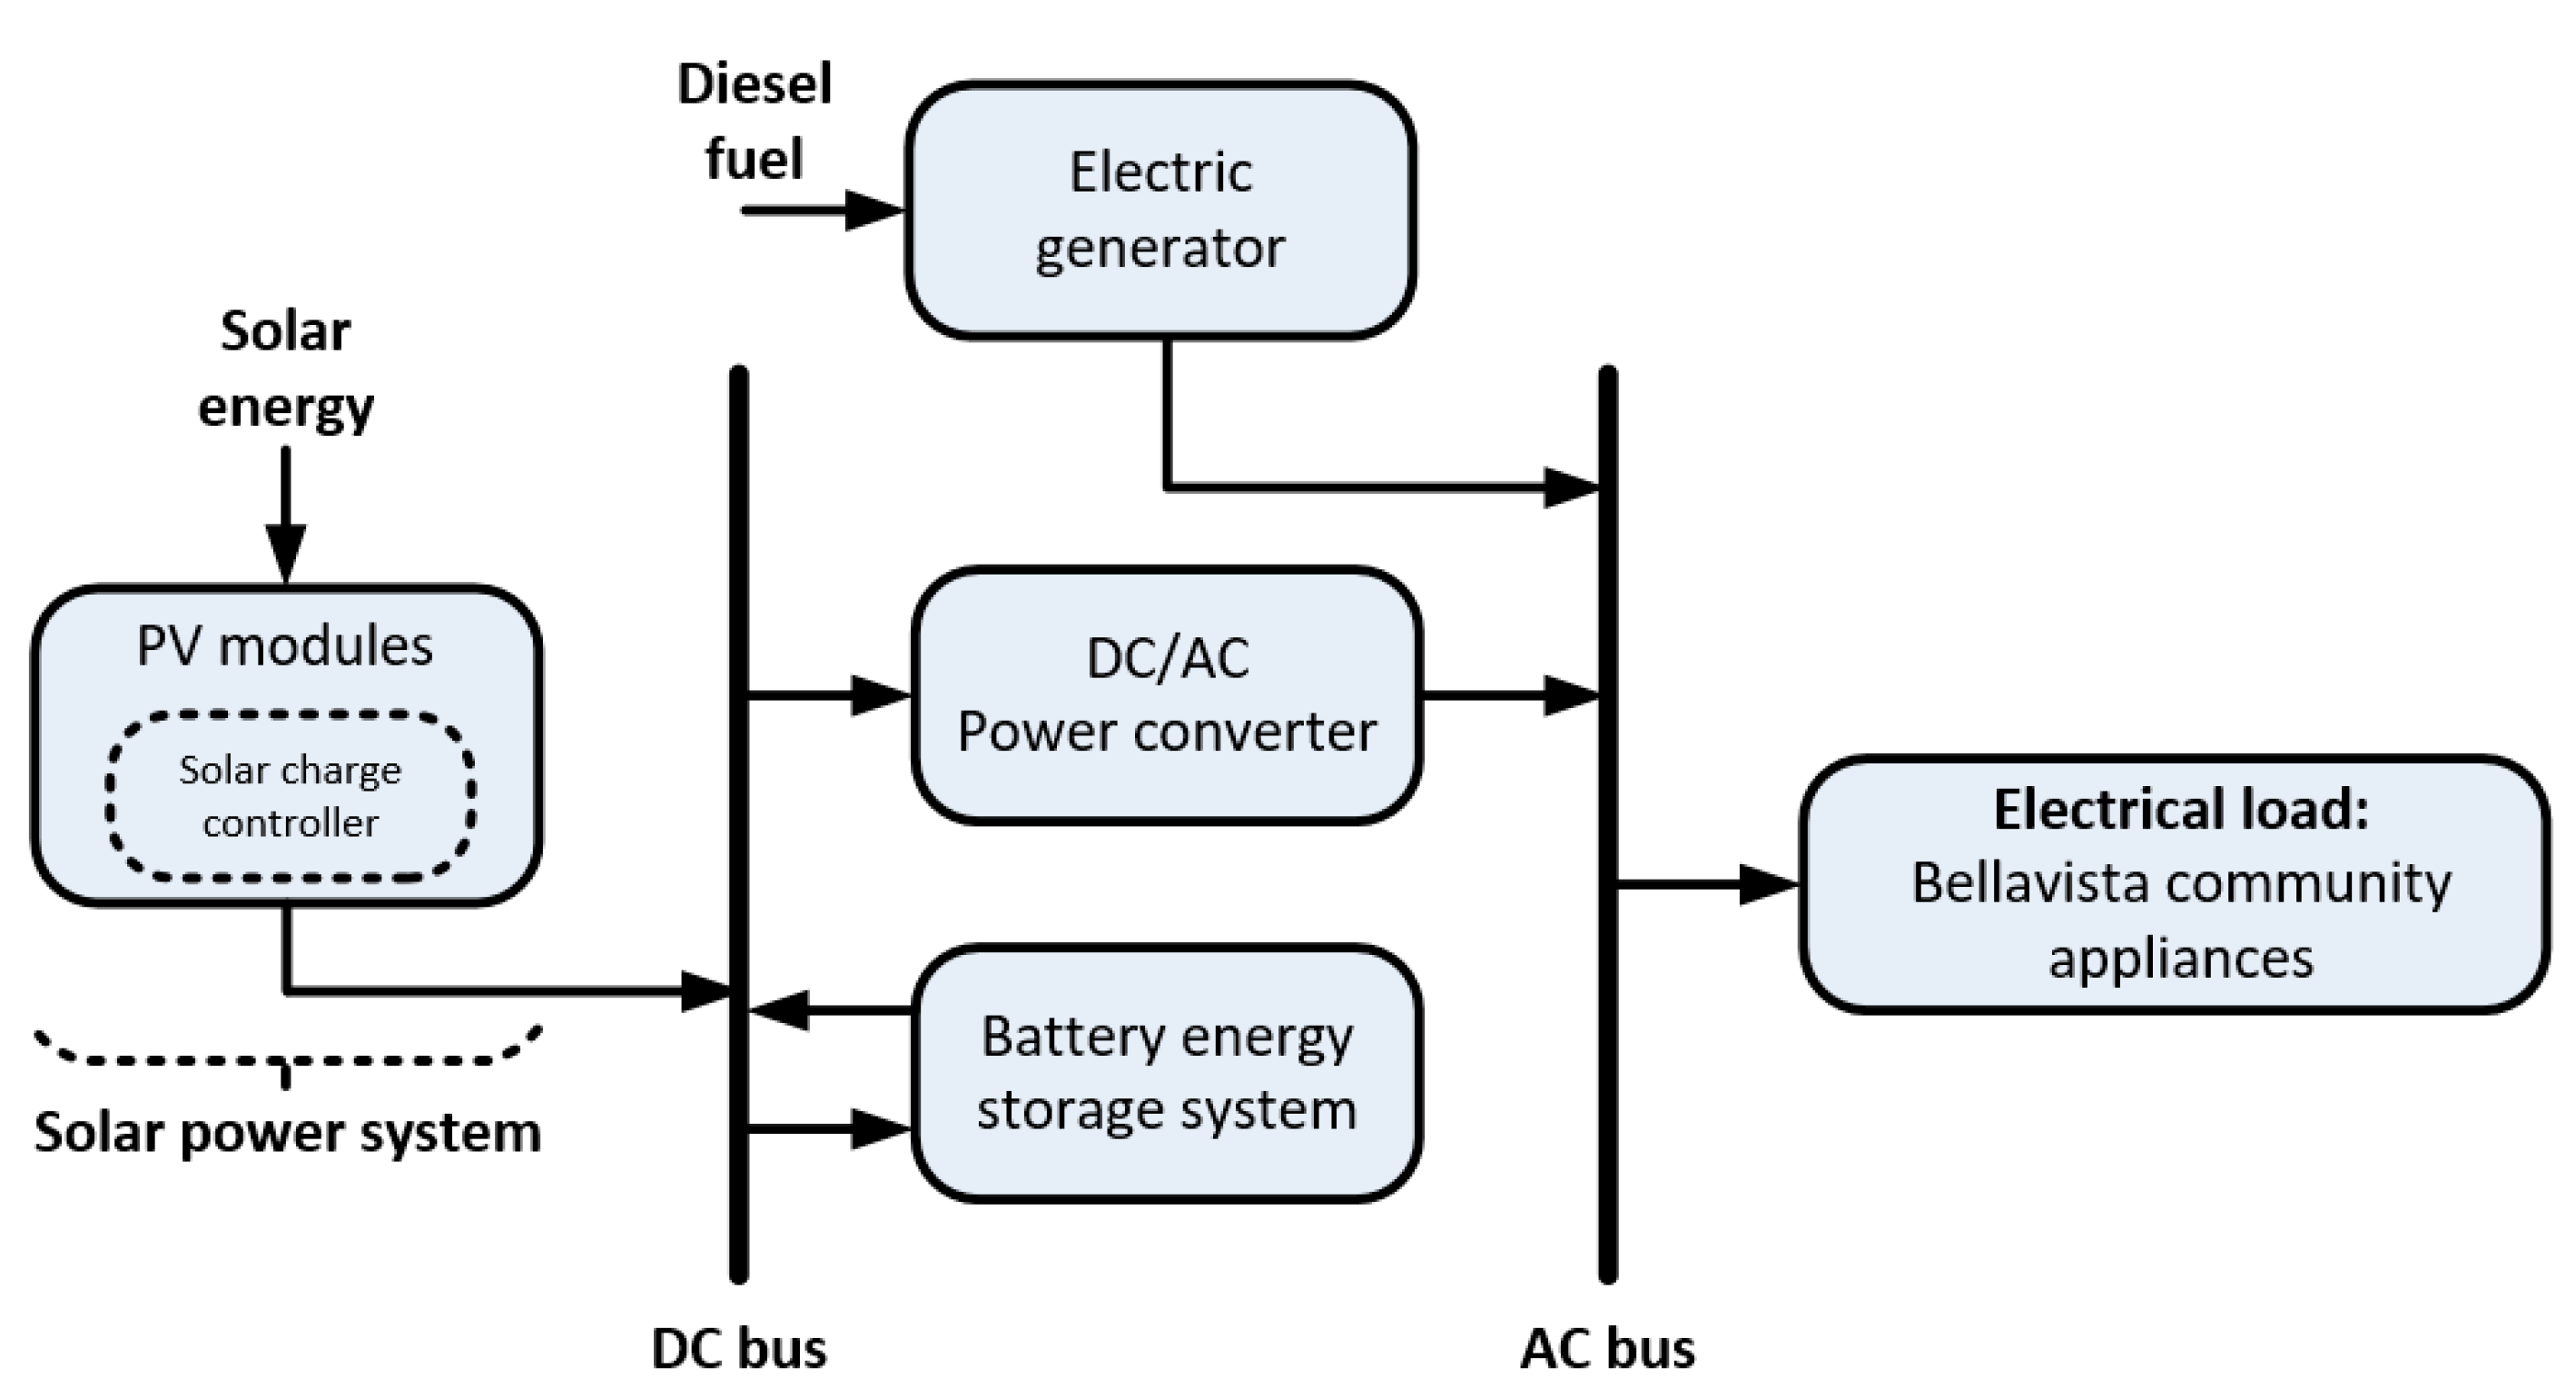
The configuration of the OHPS consists of an SPS (including solar charge controller), DG, DC/AC power converter, BESS, and the electrical load. Figure 4 shows the design of the proposed hybrid configuration, which was modeled in Homer Pro software. The fuel used by the electric generator is diesel.

3.5. Modeling in Homer Pro

Homer Pro software is a tool that optimizes renewable systems according to the different parameters taken into account in the proposed model [15]. Some of the main expressions considered in the modeling in Homer Pro are described below.

3.5.1. Solar Power System

The calculation of the power output of the SPS ( P o u t   S P S ) can be obtained by the following equation:
P o u t   S P S   = Y S P S f S P S ( G T G T , S T C ) ( 1 + α p ( T c T c , S T C ) )
where Y S P S is the nominal capacity of the SPS, f S P S is the derating factor of the SPS, G T is the incident radiation in the current time step (kW/m2), G T , S T C is the irradiation under standard test conditions (1 kW/m2), α p is the temperature coefficient of power (%/°C), T c is the cell temperature of the SPS (°C), and T c , S T C is the temperature of the SPS under standard test conditions (25 °C). For the model, data of hourly global horizontal irradiation and hourly ambient temperature of the community was obtained from the Meteonorm meteorological database [18].

3.5.2. Battery Energy Storage System (BESS)

The maximum power that can be accumulated ( P b a t t , d m a x , k b m ) and discharged ( P b a t t , c m a x , k b m ) in a specific length of time ( Δ t ) are given by Equations (2) and (3), respectively.
P b a t t , d m a x , k b m = k c Q m a x + k Q 1 e k Δ t + Q k c ( 1 e k Δ t ) 1 e k Δ t + c ( k Δ t 1 + e k Δ t )
P b a t t , c m a x , k b m = k Q 1 e k Δ t + Q k c ( 1 e k Δ t ) 1 e k Δ t + c ( k Δ t 1 + e k Δ t )
where k is the constant rate, c is the capacity rate, Q m a x is the maximum theoretical storage capacity, Q 1 is the available energy, and Q is the amount of energy stored in the storage component at any one time.

3.5.3. Net Present Cost (NPC)

The NPC is the present value of all the costs that a system obtains over its lifespan, minus the present value of all revenue it earns over its lifespan. It is given by the following expression:
N P C = [ i ( 1 + i ) N 1 ] C a n n , t o t 1 ( 1 + i ) N
where i is the real discount rate, N is the number of years in the project lifespan, and C a n n , t o t is the total annualized cost of all the system components. C a n n , t o t is expressed as follows [20]:
C a n n , t o t =   C a n n , c a p + C a n n , r e p + C a n n , O & M + C a n n , f u e l R a n n , s a l v
where C a n n , c a p is the annualized capital cost, C a n n , r e p is the replacement cost, C a n n , O & M is the cost of operation and maintenance, C a n n , f u e l is the cost of diesel used powering the generator, and R a n n , s a l v represents the annualized total salvage value. Each of the terms in Equation (5) are related to the costs of all the components.

3.5.4. Cost of Energy (COE)

The COE is the average cost of electricity per kWh of the electrical energy produced by the hybrid system. It is given by equation:
C O E =   C a n n , t o t E a e c
where E a e c is the total annual energy consumed by the electrical load.

3.5.5. Renewable Fraction ( R e n . F r a c . )

The renewable fraction ( R e n . F r a c . ) is the fraction of the energy delivered to the electrical load that is produced from microgrids or other renewable power systems. It is given by the expression:
R e n . F r a c . = 1 E g e n E a e c
where E g e n is the annual energy produced by the generator. This equation does not take into account thermal loads and energy production of this type.

3.6. Model Input Data

The input data for the simulations of SPS in Homer Pro are based on the information in Table 2.
All this information was obtained from the equipment’s technical data sheets [21,22,23,24]. Likewise, the estimated prices of all the equipment are according to the Ecuadorian market. Other economic–technical details are considered as follows:
  • The system’s fixed costs were considered to be USD$35,000, where these costs included solar charge controllers, energy management system (EMS), transportation of equipment to the community (via boat), their assembly, electrical wiring, etc.
  • The real interest rate was 8% with a simulation horizon of 15 years.
  • The SPSs for the OHPS change in three sizes, which are 8 kW, 10 kW, and 13 kW. The photovoltaic (PV) module used in Homer Pro has the characteristics found in [21]. The derating factor considered for each PV module of the SPS was 90% and a temperature effect on the power generation of −0.35%/C. Likewise, the degradation module was considered to be 0.32%/year.
  • The fuel prices considered were USD$0.26/L, USD$0.35/L, USD$0.44/L, USD$0.53/L, and USD$0.62/L.
  • The proposed battery was valve-regulated lead–acid (VRLA) which typically has a nominal voltage of 2 V and is maintenance-free [24]. The operating voltage of the DC bus is 48 V; thus, the BESS had 24 batteries. The minimum state of charge of the BESS is 20% and the maximum 100%.
  • Additional technical features of the DG and the DC/AC power converter can be found in [22,23], respectively.
  • The hourly data of the load profile, average air temperature, and global horizontal radiation of the community were loaded into the Homer Pro according to the information in Section 3.2 and Section 3.3.
  • The dispatch strategy used in the Homer Pro is load following (LF).

3.7. Fuel Characteristics

The characteristics of the fuel for the diesel generator are given in Table 3 [25]. These values are essential for the calculations of CO2 emissions from the generator. In the case of the Bellavista community, the fuel always arrives at this location in boats.

3.8. Simulation Scenarios

Each OHPS configuration is considered a different scenario (Figure 4), which depends on the fuel price and the SPS size. Figure 5 shows the scenarios that are simulated in the present work. Scenarios 1, 2, 3, 4, and 5 correspond to fuel prices of USD$0.26/L, USD$0.35/L, USD$0.44/L, USD$0.53/L, and USD$0.62/L, with an SPS size of 8 kW, respectively. The same corresponds to scenarios 6 through 10 and 11 through 15 with SPSs of 10 kW and 13 kW, respectively. The fuel price of USD$0.26/L is the current fuel price in Ecuador at start of this study.

4. Results

This section shows the results of the simulated scenarios in Homer Pro according to the configuration from Section 3.4.

4.1. Summary of Costs of the Scenarios

Table 4 shows the NPC, COE, mean operating costs, and mean fuel costs over the 15-year project period. In scenarios 1, 6, and 11, it can be seen that while the SPS increased in size, the fuel cost decreased in the generator, but with an increase in NPC and COE. Higher initial capital per scenario occurred with increasing of SPS size. Scenario 1 resulted in the optimal system with an NPC of USD$102,027, but with a fuel cost of USD$1576/year. Scenario 11 shows the lowest fuel cost compared with scenarios 1 and 6. The latter resulted in the higher presence of power delivered by the SPS. The trend in the scenarios with diesel price USD$0.26/L is maintained in scenarios with fuel price of USD$0.35/L. When the fuel price reached USD$0.44/L, scenario 8 was the optimal compared to scenarios 3 and 13. Scenario 8 had an NPC of USD$107,133 and a COE of USD$0.587 with SPS of 10 kW. However, scenario 13 had the lowest fuel cost. Similarly, the SPS of 10 kW was the optimal system for the scenarios with fuel prices of USD$0.53/L, scenario 14 being the one with the lowest fuel cost. In the scenarios with USD$0.62/L, scenario 15 with 13 kW of SPS had the lowest NPC (USD$113,053) but with a lower fuel cost (USD$2203/year). The increase in fuel costs in the scenarios for each SPS does not necessarily imply an increase in the amount of fuel. The optimal system of scenarios for each SPS ensures a reliable cost–benefit solution.
In the scenarios for each fuel price, we can also observe that while the SPS increased the installed capacity, the OHPS also reduced project operating costs due to the reduction of generator operation. For example, in scenarios 5, 10, and 15, scenario 15 with the higher SPS size had an operating cost of USD$3662, while the one with the smaller SPS size was USD$4232.

4.2. Energy Production of the Generator

Figure 6 shows the mean electricity production of DG according to diesel price and SPS size. As can be seen in the scenarios for each fuel price, while the SPS increased in installed capacity, the generator was required to produce less electricity. Likewise, we can also observe that the increase in fuel prices considerably reduced the generator’s electricity production between comparable scenarios. Comparing the scenarios with 8 kW of SPS and their different fuel prices, the reduction in the production was considerable from USD$0.44/L, whose values were similar for scenarios with USD$0.53/L and USD$0.62/L. Scenario 3 showed a reduction of 21.22% in the generator production compared to scenario 1. Similarly, in the scenarios with SPS of 10 kW, the production of this machine was reduced and kept almost constant from USD$0.44/L. The reduction in generator operation between the scenarios 6 and 8 was 29.16%. Similarly, for the scenarios with SPS of 13 kW, the maximum reduction in generator operation was 32.72% between scenarios 11 and 13.
The results obtained in this section show that the Homer Pro optimizes according to the price of the fuel, e.g., if the fuel has a low price, the generator produces more electricity because this option is more cost-effective. However, when the price increases to a certain value (USD$0.44/L), the penetration of solar energy considerably increases mainly for the SPSs of 10 kW and 13 kW.

4.3. Comparison between the Electricity Production of the SPS and DG

Table 5 shows the electricity production of DG, converter mean energy output, and BESS mean energy output according to each SPS size with its fuel prices. In addition, other operating details, such as mean fuel consumption and mean renewable fraction, are included in the table. As can be seen in the scenarios by each SPS, when the fuel price increased, the power converter increased its mean energy output as well as the BESS. These increases in energy outputs were considerable from USD$0.44/L. This latter can be reflected on renewable fraction where the highest renewable penetration occurred from this price or higher. For example, scenario 5 achieved a renewable fraction of 38.7% compared to scenario 1 with 22.3%, between all scenarios with SPS of 8 kW. Similarly, scenario 10 had 46.7% renewable penetration compared to 24.3% from scenario 6, for all scenarios with SPS of 10 kW. Scenario 15 achieved the highest penetration with 51.3% among all the scenarios with SPS of 13 kW. It should be highlighted that a higher penetration of electricity from the SPS and BESS leads to a reduction in the operating hours of the generator, which reduces the consumption of fuel used for this machine. Consequently, the latter helps to reduce the emissions of polluting gases from the generator.
Figure 7 shows the amount of total CO2 emissions by each SPS size with its fuel prices over the 15-year project period. The reduction of CO2 emissions is related to the decrement in fuel used by the generator (as shown in Table 5). As can be seen in the figure, when the price of fuel increased by each SPS, the generator produced fewer CO2 emissions. Comparing the scenarios with fuel prices of USD$0.26/L, CO2 emissions did not decrease considerably, while the SPS increased its size. A similar trend can be observed with the scenarios with fuel prices of USD$0.35/L. Considerable CO2 emissions reductions were achieved in scenarios with fuel prices of USD$0.44/L, USD$0.53/L, and USD$0.62/L, where the mean renewable fractions were over 35% (Table 5). The amount of emissions was similar, starting from USD$0.44/L in the scenarios by each SPS.

4.4. Analysis of Configurations with Fuel Price of USD$0.44/L in the 15th Year of the Project

Given how the Ecuadorian government is looking to eliminate the subsidy for diesel fuel in coming years, and the preliminary results shown in Section 4.1, Section 4.2 and Section 4.3, it is worth analyzing in more detail the performance of scenarios with a fuel price of USD$0.44/L (scenarios 3, 8, and 13). These scenarios appear to be the turning point for renewable energy penetration and CO2 emission reduction. This section looks at year 15 of operation of the project, where the electrical load of the Bellavista community is expected to be 23,151 kWh for each of these scenarios.

4.4.1. Operating Parameters of the Hybrid Systems

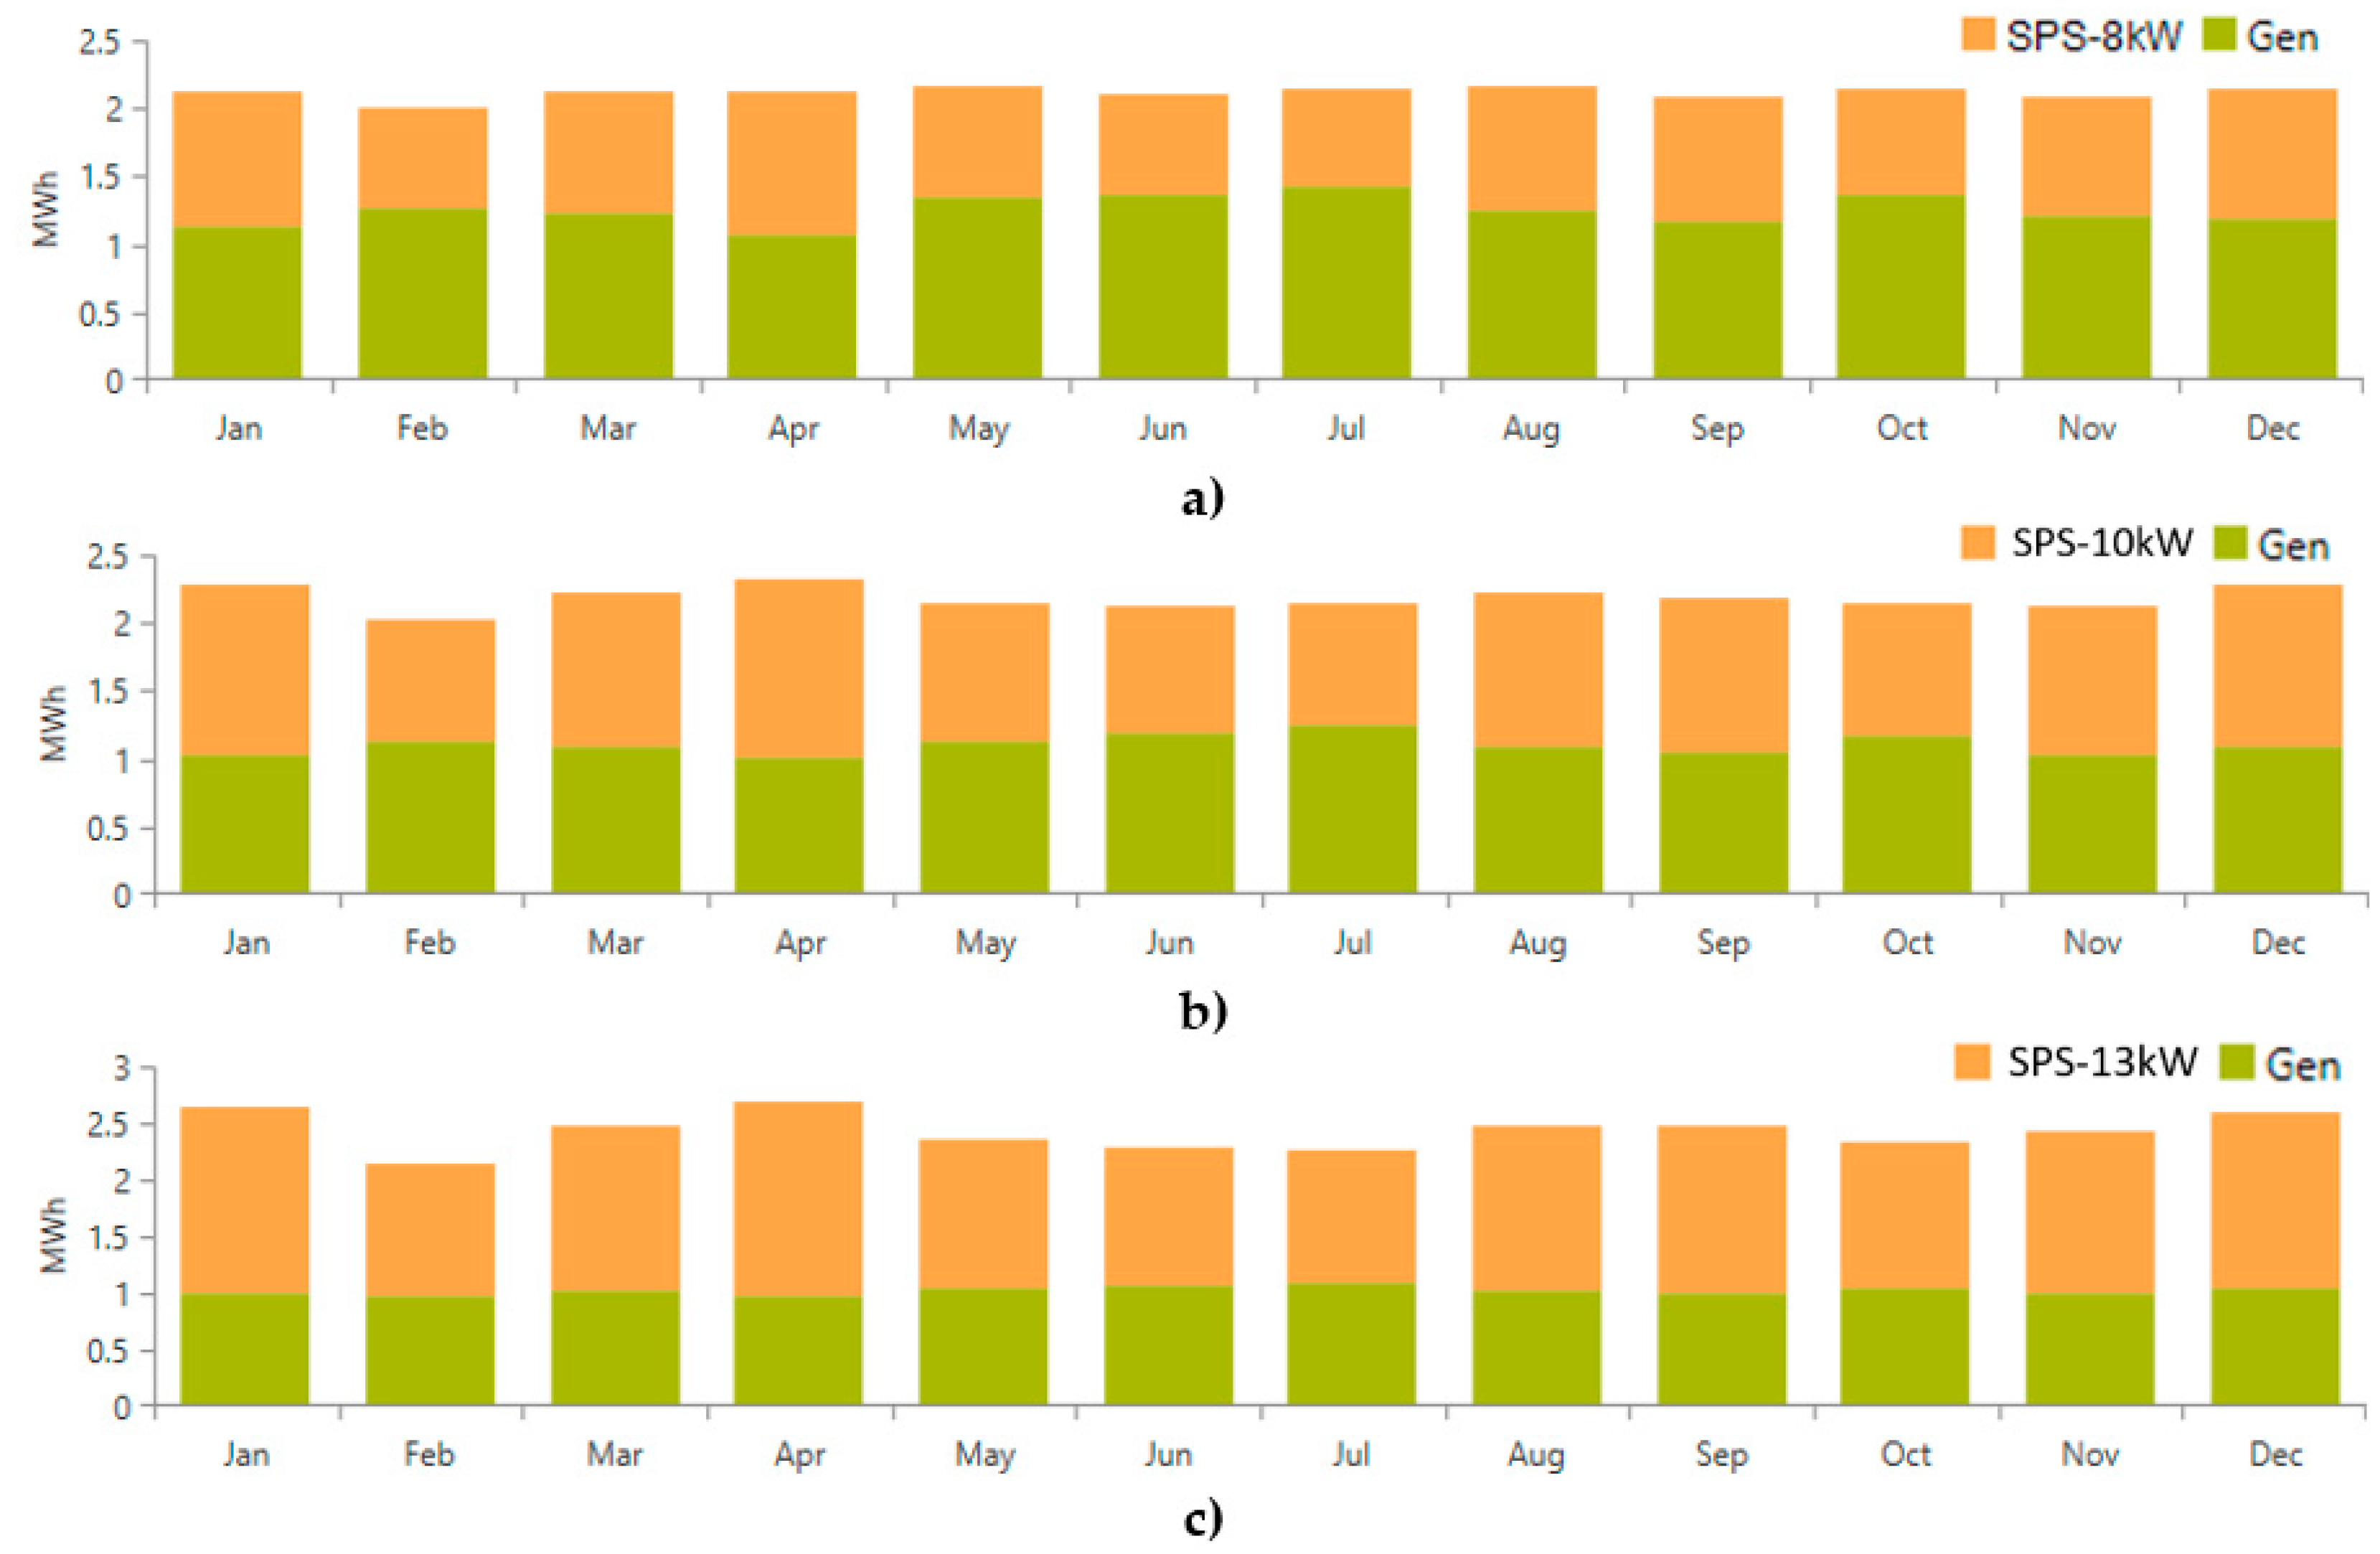
Figure 8 shows the electricity production of the SPS and the DG for scenarios 3, 8, and 13. Scenario 8 was the optimal system, according to the results of Table 4. As can be seen in the figure, when the SPS increases the size in each scenario, the DG decreases its electricity production.
Figure 8a shows the total electricity production of SPS which was 10,380 kWh/year, and the generator supplied total of 15,025 kWh/year. The excess electricity in this scenario was 1058 kWh/year (4.17%), with a renewable fraction of 35.1%. In the BESS, the energy input from the SPS was 4796 kWh/year and the energy output was 4077 kWh/year, with losses of 719 kWh/year. The DC/AC power converter delivered a maximum power output of 3.77 kW, with an energy input of 9517 kWh/year and energy output of 9041 kWh/year. The latter was due to losses produced by the efficiency of the power converter. In scenario 8 (Figure 8b), the electricity production from SPS of 10 kW was 12,974 kWh/year and DG delivered 13,277 kWh. The excess electricity in this scenario was 1736 kWh/year (6.61%) with a renewable fraction of 42.7%. The BESS had an energy input of 5469 kWh/year, 4649 kWh/year of energy output, and 820 kWh/year in losses. The power converter delivered a maximum output power of 4 kW, with an energy input of 10,869 kWh/year and energy output of 10,325 kWh/year. The mean power output of this equipment was 1.18 kW. Figure 8c shows the total electricity production of SPS which was 16,867 kWh/year and the generator supplied total of 12,316 kWh/year. The excess electricity in this scenario was 4614 kWh/year (15.8%) with a renewable fraction of 46.8%. In the BESS, the energy input from SPS was 5556 kWh/year and the energy output was 4723 kWh/year, with losses of 833 kWh/year. The DC/AC power converter delivered a maximum power output of 5.19 kW, with an energy input of 11,676 kWh/year and an energy output of 11,092 kWh/year.

4.4.2. CO2 Emissions for the Duration of the Project

Figure 9 shows CO2 emissions produced by the DG in each of the scenarios 3, 8, and 13 over the 15-year project period. In addition, emissions when the DG is in standalone configuration and is the only power source in this community were considered as a baseline. The value of emissions during the 15 years using only the DG was 425,617 kg of CO2 with an average annual value of 28,374 kg of CO2. The total emissions were 180,518 kg of CO2, 155,363 kg of CO2, and 142,708 kg of CO2 for scenarios 3, 8, and 13, respectively.
The rising trend in the CO2 emissions of each of the scenarios was due to the fact that the annual electricity consumption of the community is growing by 1% per year. Although scenario 8 was the optimal system among these scenarios (Table 4), scenario 13 presented the lowest emission levels.

5. Discussion

Hybrid systems based on SPS/DG/BESS configurations are viable options that have been explored to supply electricity to isolated communities such as Bellavista [5,26,27]. One of the main advantages of the SPS/DG/BESS configuration is that it can ensure uninterrupted power supply to the electrical load even at times of low solar radiation and during nighttime. In addition, the use of the BESS helps to improve the penetration of energy from renewable sources as well as to cope with their variabilities due to their intermittent nature [28].
The Bellavista community is a site with high potential for solar energy generation [29], while other sources, such as wind energy, are not suitable due to the low wind speeds (under 2 m/s) based on weather databases such as Meteonorm [18]. The study of hybrid systems based on renewable energy systems are relevant to ensure reliable electrification for remote locations such as the case of the Bellavista community [6,19,30].
In our analysis, the OHPSs provide technical–economic solutions to the community’s electricity access problem. These solutions depend on the size of the SPS and the price of fuel. The present hybrid system (SPS/DG/BESS) is a feasible configuration for this location. Other authors have analyzed the same configuration, such as Olatomiwa et al. [26], who compared two hybrid systems: (1) SPS/DG/BESS and (2) SPS/Wind/DG/BESS. Here, the first system had the lowest NPC with reduced CO2 emissions compared to the SPS/wind/DG/BESS configuration and standalone DG configuration. Likewise, the low diesel prices reduced the COE of simulated configurations. The latter situation is comparable to the analysis in Table 4, where the lowest COE values corresponded to the scenarios with the lowest fuel prices (USD$0.26/L and USD$0.35/L). In addition, these scenarios showed low NPC values but high pollution levels due to the fact that these configurations used higher amounts of electricity from the DGs. Although the scenarios with fuel prices USD$0.44/L, USD$0.53/L, and USD$0.62/L showed higher penetration of renewable energy with a considerable reduction in CO2 emissions, these scenarios had higher values of NPC and COE.
Likewise, Oulis Rousis et al. [27] studied an SPS/DG/BESS configuration, which presented better performance when it was compared to SPS/DG, SPS/BESS, DG, and DG/BESS configurations. Even the renewable fraction of this system was over 70% with a fuel consumption of 1905 L/year. Similarly, the SPS/DG systems presented high investment costs with high diesel fuel consumption, which produced high levels of pollution. In the present paper, scenarios 13, 14, and 15 from Table 5 had renewable fractions above 50%, whose scenarios had a mean annual fuel consumption of around 3600 L/year (Table 5). The SPS/BESS configuration was not considered in the present work due to certain inconveniences that may occur in its operation, such as the high excess power at times of peak SPS generation, low load consumption, and fully-loaded BESS. In grid-connected renewable power systems, these excesses can be injected into the public power grid [31]. In the case of the off-grid systems, if these surpluses are sizeable, they should be harnessed with initiatives such as additional water pumping systems [20]. Regarding the three scenarios studied in Section 4.4, the optimal system (scenario 8) achieved an electricity surplus of 6.61%. Given this relatively low surplus of electricity, it is not required to design complex configurations for harnessing this excess energy.

6. Conclusions

This paper presents a technical–economic–environmental analysis and optimization of the impact of the reduction of diesel subsidy in the design of an OHPS for the Bellavista community, Ecuador. This impact was focused on the electricity production levels of each of the OHPS components (SPS, DG, and BESS) according to the increase of fuel price and SPS size within the optimization model of Homer Pro. This configuration was simulated in 15 scenarios by varying both the size of the SPS and the fuel price. At the beginning of this study, USD$0.26/L was the price of fuel throughout Ecuador. Currently, the country is in a process of gradually eliminating fuel subsidies (gasoline and diesel) until these reach regional and international prices.
The scenarios with diesel prices of USD$0.26/L and USD$0.35/L showed the lowest levels of renewable energy penetration, which was reflected in the mean renewable fraction from Table 5. In addition, reduced power delivery from the BESS can be observed, which increases the electricity production of the generator as well as the emission of pollutant gases. However, these mean renewable fractions considerably increased for scenarios with prices of USD$0.44/L, USD$0.53/L, and USD$0.62/L, even though these scenarios reached percentages between 38% and 52%. These increases in the energy penetration from SPSs and BESSs allowed the reduction of costs associated with the hours of operation of the diesel generator, amount of fuel, and CO2 emissions. This can also be seen from the USD$0.44/L price in the scenarios for each SPS size (Table 5), the electricity production levels of the generator reduced and started to vary minimally compared to the obtained results in the scenarios of USD$0.53/L and USD$0.62/L. This trend was similar for the electricity output from the power converter and BESS.
Scenarios 3, 8, and 13 with the diesel price of USD$0.44/L were chosen to perform the analysis of these configurations in their 15th years (Section 4.4). This is because the generator electricity production of these scenarios was similar for the scenarios with the same SPS and fuel prices of USD$0.53/L and USD$0.62/L. Here, the performance of these three scenarios in their last year of operation was shown. Each scenario described the details of operation such as electricity production (DG, BESS, and SPS), renewable fraction, energy output/input from the converter, CO2 emissions, and losses. The SPSs supplied less electricity this year because the PV modules have a degradation of 0.32%/year, which was set as input in the model. In addition, scenario 8 was the optimal system, although scenario 13 showed lower CO2 emissions.
Finally, it can be concluded that with fuel prices of USD$0.26/L and USD$0.35/L, the NPCs and COEs of these scenarios are relatively low compared to those scenarios of higher prices. However, Homer Pro is a software that optimizes renewable projects, from a techno-economic perspective, which will favor generator electricity production due to low fuel prices. It would also reduce the use of energy from the BESS with an increase in CO2 emissions. It was observed that the BESSs in these scenarios had lifetimes that exceeded the 15-year horizon of the project. Even these lifetimes were of several decades due to the low discharge rates of these storage systems in each of these scenarios. In contrast, the scenarios with fuel prices of USD$0.44/L, USD$0.53/L, and USD$0.62/L showed higher penetration of renewable energy with a considerable reduction of CO2 emissions. Likewise, the BESSs of these scenarios had the respective replacement within the project horizon. These scenarios presented slightly higher investment costs compared to the two scenarios with lower fuel prices. The results obtained show that if the diesel price will increase over USD$0.62/L, the production of electricity to power the community will have similar values to the scenarios for each SPS with prices from USD$0.44/L. This price of USD$0.62/L is more likely to happen as subsidies for diesel get reduced to regional standards.

Author Contributions

Conceptualization, R.H.-L., F.A., and J.L.; methodology, R.H.-L., F.A., J.L., J.U., M.T., P.S., and G.S.; software, R.H.-L. and F.A.; validation, R.H.-L., P.S., J.U., M.T., and G.S.; formal analysis, R.H.-L., F.A., and J.L.; investigation, R.H.-L., F.A., J.U., and J.L.; resources, G.S.; data curation, R.H.-L., F.A., and J.L.; writing—original draft preparation, R.H.-L., F.A., J.U., and J.L.; writing—review and editing, P.S., M.T., and G.S.; visualization, R.H.-L.; supervision, P.S., M.T., and G.S. All authors have read and agreed to the published version of the manuscript.

Funding

This research received no external funding.

Institutional Review Board Statement

Not applicable.

Informed Consent Statement

Not applicable.

Data Availability Statement

Data sharing is not applicable to this article.

Acknowledgments

The authors would like to express their acknowledgements to the Office of the Dean of Research at ESPOL for supporting the funding for this study.

Conflicts of Interest

The authors declare no conflict of interest.

Abbreviations

The following acronyms are used in this manuscript:
OHPSOff-grid hybrid power system
DGDiesel generator
BESSBattery energy storage system
SPSSolar power system
CO2Carbon dioxide
SDGsSustainable Development Goals
COVID-19Coronavirus disease
GHGGreenhouse gas
NREL National Renewable Energy Laboratory
COECost of Energy
NPCNet Present Cost
ABCArtificial Bee Colony
LCOELevelized cost of energy
DERDistributed Energy Resource
GPSGlobal Positioning System
maslMeters above sea level
LEDLight-emitting diode
BShHot semi-arid climate
DCDirect current
ACAlternating current
PVPhotovoltaic
Ren.Frac.Renewable fraction
O&MOperation and Maintenance
EMSEnergy management system
LFLoad following
VRLAValve regulated lead-acid

References

  1. United Nations and Wbcsd. SDG 7: Ensure Access to Affordable, Reliable, Sustainable and Modern Energy for All. Available online: https://sdgcompass.org/wp-content/uploads/2016/04/Goal_7.pdf (accessed on 6 March 2021).
  2. Eroğlu, H. Effects of Covid-19 outbreak on environment and renewable energy sector. Environ. Dev. Sustain. 2020, 1–9. [Google Scholar] [CrossRef] [PubMed]
  3. Gillingham, K.T.; Knittel, C.R.; Li, J.; Ovaere, M.; Reguant, M. The Short-run and Long-run Effects of Covid-19 on Energy and the Environment. Joule 2020, 4, 1337–1341. [Google Scholar] [CrossRef] [PubMed]
  4. Bahramara, S.; Moghaddam, M.P.; Haghifam, M. Optimal planning of hybrid renewable energy systems using HOMER: A review. Renew. Sustain. Energy Rev. 2016, 62, 609–620. [Google Scholar] [CrossRef]
  5. Hidalgo, R.; Jacome, P.; Urquizo, J.; Soriano, G. Microgrid design for remote location in chile using a scenario-based methodology. In Proceedings of the 14th LACCEI International Multi-Conference for Engineering, Education, and Technology: Engineering Innovations for Global Sustainability, Boca Raton, FL, USA, 20–22 July 2016; pp. 20–22. [Google Scholar]
  6. Urquizo, J.; Singh, P.; Hidalgo-León, R.; Villavicencio, V.; Soriano, G. Rehabilitation of Solar Home Systems and Sustainable Development for an Island Community in Ecuador. In Proceedings of the 2019 IEEE Global Humanitarian Technology Conference (GHTC), Montego Bay, Jamaica, 24–26 July 2019; pp. 1–8. [Google Scholar]
  7. Lau, K.Y.; Yousof, M.; Arshad, S.; Anwari, M.; Yatim, A. Performance analysis of hybrid photovoltaic/diesel energy system under Malaysian conditions. Energy 2010, 35, 3245–3255. [Google Scholar] [CrossRef]
  8. Lipu, M.S.H.; Hafiz, M.G.; Ullah, M.S.; Hossain, A.; Munia, F.Y. Design optimization and sensitivity analysis of hybrid renewable energy systems: A case of Saint Martin Island in Bangladesh. Int. J. Renew. Energy Res. IJRER 2017, 7, 988–998. [Google Scholar]
  9. Shezan, S.A.; Julai, S.; Kibria, M.A.; Ullah, K.R.; Saidur, R.; Chong, W.T.; Akikur, R.K. Performance analysis of an off-grid wind-PV (photovoltaic)-diesel-battery hybrid energy system feasible for remote areas. J. Clean. Prod. 2016, 125, 121–132. [Google Scholar] [CrossRef]
  10. Singh, S.; Singh, M.; Kaushik, S.C. Feasibility study of an islanded microgrid in rural area consisting of PV, wind, biomass and battery energy storage system. Energy Convers. Manag. 2016, 128, 178–190. [Google Scholar] [CrossRef]
  11. Yuan, C.; Illindala, M.S.; Khalsa, A.S. Co-optimization scheme for distributed energy resource planning in community microgrids. IEEE Trans. Sustain. Energy 2017, 8, 1351–1360. [Google Scholar] [CrossRef] [Green Version]
  12. CIEC-ESPOL. Boletin de Politica Economica Nro. 6 Politica Fiscal y Monetaria. Centro de Investigaciones Económicas. Available online: http://www.ciec.espol.edu.ec/sites/default/files/BPE%206%20julio%20-%20DIGITAL.pdf (accessed on 29 January 2020).
  13. Global PetrolPrices. Diesel Prices, Liter. Available online: https://es.globalpetrolprices.com/dieselprices/ (accessed on 13 July 2020).
  14. Ventosa, I.P.; Sojos, A.M.; del Pozo, Z.V.; Vela, G.C.; Rivera, P.Á. Subsidios a los combustibles fósiles en Ecuador: Diagnosis y opciones para su progresiva reducción. REVIBEC-Rev. Iberoam. Econ. ECOLÓGICA 2018, 87–106. [Google Scholar]
  15. Homer Pro. Hybrid Optimization Model for Multiple Energy Resources. Available online: https://www.homerenergy.com/products/pro/index.html (accessed on 29 October 2020).
  16. Panchana, G.; Valverde, R. Diseño del Sistema de Energización Autónomo de la Isla Bellavista, localizada en el Golfo de Guayaquil; ESPOL: Guayaquil, Ecuador, 2018. [Google Scholar]
  17. Peel, M.C.; Finlayson, B.L.; McMahon, T.A. Updated world map of the Köppen-Geiger climate classification. Hydrol. Earth Syst. Sci. 2007, 11, 1633–1644. [Google Scholar] [CrossRef] [Green Version]
  18. Centro de Energías Renovables y Alternativas. Weather Report for the Bellavista Community. METEONORM V.7.3. Available online: https://meteonorm.meteotest.ch/en/meteonorm-version-8 (accessed on 13 July 2020).
  19. Amoroso, F.; Hidalgo-León, R.; Litardo, J.; Urquizo, J.; Villavicencio, V.; Torres, M.; Singh, P.; Soriano, G. Simulation of an off-grid solar system to provide reliable energy access to the Island Community of Bellavista in Ecuador. In 2020 IEEE ANDESCON; IEEE: Piscataway Township, NJ, USA, 2020; pp. 1–6. [Google Scholar]
  20. Yimen, N.; Hamandjoda, O.; Meva’a, L.; Ndzana, B.; Nganhou, J. Analyzing of a photovoltaic/wind/biogas/pumped-hydro off-grid hybrid system for rural electrification in Sub-Saharan Africa—Case study of Djoundé in Northern Cameroon. Energies 2018, 11, 2644. [Google Scholar] [CrossRef] [Green Version]
  21. Maxeon Solar Technologies. Sun Power Maxeon 2—360W. Singapore, 2020. Available online: https://www.europe-solarstore.com/download/sunpower/SunPower_SPR-MAX2-360_Datasheet_EN.pdf (accessed on 3 February 2021).
  22. MODASA. Grupo Electrogéno MP-10. Available online: https://modasa.com.pe/sistema-energia/grupos-electrogenos/24630/pdf/ (accessed on 22 February 2021).
  23. SMA. Sunny Island 4.4M/6.0H/8.0H for On-Grid and Off-Grid Applications. Available online: https://www.europe-solarstore.com/download/sma/SMA_Sunny_Island_4.4M_6.0H_8.0H_DATASHEET.pdf (accessed on 22 February 2021).
  24. HOPPECKE. OPzV Solar.Power Valve Regulated Lead-Acid Batteries for Cyclic Applications. Available online: https://www.europe-solarstore.com/download/hoppecke/opzv/OPzV_solar.power_en.pdf (accessed on 22 February 2021).
  25. Chávez, G.C.; Romo, S.M.; Moya, J.V.; Reyes, R.S. Composición elemental de mezclas biodiésel-diésel y análisis de sus emisiones de combustión. FIGEMPA Investig. Desarro. 2017, 1, 21–28. [Google Scholar] [CrossRef] [Green Version]
  26. Olatomiwa, L.; Mekhilef, S.; Huda, A.N.; Sanusi, K. Techno-economic analysis of hybrid PV–diesel–battery and PV–wind–diesel–battery power systems for mobile BTS: The way forward for rural development. Energy Sci. Eng. 2015, 3, 271–285. [Google Scholar] [CrossRef]
  27. Rousis, A.O.; Tzelepis, D.; Konstantelos, I.; Booth, C.; Strbac, G. Design of a hybrid AC/DC microgrid using HOMER Pro: Case study on an islanded residential application. Inventions 2018, 3, 55. [Google Scholar] [CrossRef] [Green Version]
  28. Hidalgo-León, R.; Siguenza, D.; Sanchez, C.; León, J.; Jácome-Ruiz, P.; Wu, J.; Ortiz, D. A survey of battery energy storage system (BESS), applications and environmental impacts in power systems. In Proceedings of the 2017 IEEE Second Ecuador Technical Chapters Meeting (ETCM), Salinas, Ecuador, 16–20 October 2017; pp. 1–6. [Google Scholar]
  29. Vaca-Revelo, D.; Ordoñez, F.; Mapa Solar del Ecuador 2019. Escuela Politecnica Nacional. Available online: https://www.researchgate.net/publication/338843581_Mapa_Solar_del_Ecuador_2019 (accessed on 15 February 2021).
  30. Villavicencio, V.; Hidalgo-León, R.; Urquizo, J.; Litardo, J.; Lema, A.; Singh, P.; Soriano, G. Impact Assessment of Solar Home System Rehabilitation in the Rural Community ‘Cerrito de los Morrenos’, Ecuador. In Proceedings of the 2020 IEEE Global Humanitarian Technology Conference (GHTC), Seattle, WA, USA, 29 October–1 November 2020. [Google Scholar]
  31. Litardo, J.; Palme, M.; Hidalgo-León, R.; Amoroso, F.; Soriano, G. Energy Saving Strategies and On-Site Power Generation in a University Building from a Tropical Climate. Appl. Sci. 2021, 11, 542. [Google Scholar] [CrossRef]
Figure 1. Google Maps view of the Bellavista community highlighting its location.
Energies 14 01730 g001
Figure 2. Climate conditions in the Bellavista community (from [18]).
Energies 14 01730 g002
Figure 3. Characteristics of the electrical load during the first year: (a) Hourly power demand by month, (b) daily electricity consumption by month.
Energies 14 01730 g003
Figure 4. Design configuration of the off-grid hybrid power system (OHPS) in the Bellavista community.
Energies 14 01730 g004
Figure 5. Simulation scenarios according to the diesel price and the solar power system (SPS) size.
Energies 14 01730 g005
Figure 6. Mean electricity production of diesel generator (DG) over 15-year project period considering fuel prices and SPS sizes.
Energies 14 01730 g006
Figure 7. Amount of total CO2 emissions by each SPS size with its fuel prices over the 15-year project period.
Energies 14 01730 g007
Figure 8. Production of the SPS and the diesel generator in the 15th year of the project: (a) scenario 3, (b) scenario 8, and (c) scenario 13.
Energies 14 01730 g008
Figure 9. CO2 emissions produced by the DG considering the scenarios 3, 8, 13, and standalone DG over the 15-year project period.
Energies 14 01730 g009
Table 1. Electrical load in Bellavista community (from [16]).
Load SectorAppliancesPower (kW/Unit)Quantity
Home sectorComputer0.0651
LED light0.00988
Washing machine0.40018
Cellphone0.01515
Electric iron1.2001
Refrigerator0.0258
TV0.09522
DVD player0.01011
Street lightingLED light0.1508
SchoolComputer0.0651
LED light0.01816
Health centerLED light0.0188
ChurchLED light0.0188
Table 2. Capacities, costs, lifetimes, and efficiencies of system components.
ComponentsCapacityCapital Cost (USD$)Replacement Cost (USD$/kW)O&M Cost (USD$/op.hour)Estimated Lifetime (Years)Efficiency (%)
PV module0.36 kW2200.000.002020
DG10 kW89000.000.252031
DC/AC power converter6 kW862586250.00895
BESS750 Ah8858850.008-1285
Table 3. Characteristics of the fuel for the diesel generator [25].
FuelLower Heating Value (MJ/kg)Density (kg/m3)Carbon Content (%)Sulfur Content (%)
Diesel43.9688081.210.184
Table 4. Costs of the scenarios over the 15-year project period.
ScenarioFuel Price (USD$)SPS Size (kW)NPC (USD$)COE (USD$/kWh/year)Mean Operating Cost (USD$/year)Mean Fuel Cost (USD$/year)
10.268102,0270.55927311576
610102,4440.56226371538
1113103,5150.56725481501
20.358104,3390.57230011837
710104,4780.57328741774
1213105,4220.57827701726
30.448107,7300.59133971995
810107,1330.58731841720
1313107,4670.58930091582
40.538111,3730.61138232409
910110,2600.60435502062
1413110,3030.61133411883
50.628114,8810.63042322820
1010113,2800.62139032413
1513113,0530.62036622202
Table 5. Electricity production from DG, power converter, and battery energy storage system (BESS) according to each SPS size with its fuel prices over the 15-year project period.
ScenarioFuel Price (USD$/L)SPS Size (kW)Converter Mean Energy Output (kWh/year)Mean Generator Production (kWh/year)Mean BESS Energy Output (kWh/year)Mean Fuel Consumption (L/year)Mean Ren. Frac. (%)
10.268481916,7921572612122.3
20.35644115,2462725548329.7
30.44842213,2294688465238.9
40.53837413,2644714466638.7
50.62837713,2694711466838.7
60.2610525316,3631391597024.3
70.35692314,7792554531831.9
80.4410,07411,5915250400346.5
90.5310,13311,5195352397446.8
100.6210,09711,5245355397646.7
110.2613570615,9081199582326.4
120.35672414,3552336518331.9
130.4410,96310,7035315367750.6
140.5311,10410,5415476361151.3
150.6211,10310,5405482361051.3
Publisher’s Note: MDPI stays neutral with regard to jurisdictional claims in published maps and institutional affiliations.