Article

Thermogravimetric Study of the Kinetics of the Reaction C + CO2 under Pore-Diffusion Control

Melentiev Energy Systems Institute of Siberian Branch of Russian Academy of Sciences, 130 Lermontova St., 664033 Irkutsk, Russia
*
Author to whom correspondence should be addressed.
Energies 2021, 14(7), 1886; https://doi.org/10.3390/en14071886
Submission received: 24 February 2021 / Revised: 11 March 2021 / Accepted: 16 March 2021 / Published: 29 March 2021
(This article belongs to the Special Issue Thermochemical Conversion for Energy Production)

Abstract

:
This study presents experimental studies of charcoal gasification with CO2 at different heating rates (1, 5, 10, 20, and 50 K min−1). The kinetics of the reaction C + CO2 under pore-diffusion control is studied. We propose a new method for the proper determination of activation energy during the processing of thermogravimetric curves of porous carbon gasification under conditions of pore-diffusion resistance. The results of the inverse kinetic problem solution are compared with different hypotheses about the regime of the investigated heterogeneous reaction process (kinetic, diffusion, pore-diffusion). The change of reaction regimes from kinetic to diffusion is detected during charcoal gasification at different heating rates. At heating rates of 5–20 K min−1, the values of activation energy of carbon gasification reaction in the carbon dioxide atmosphere, obtained by the proposed method, closely match the data found in the previous studies. The use of diffusion models in the processing of thermogravimetric curves determines the conditions under which conventional kinetic models fail to provide adequate information about the temperature dependence of the heterogeneous reaction rate.

1. Introduction

According to energy development projections (e.g., Reference [1]), solid fuel (coal and biomass) will remain one of the main energy sources for a long time to come. One of the ways to increase the environmental efficiency of solid fuel use is its gasification. The possibility of combining energy and chemical production (first of all, synthesis liquid hydrocarbons and oxygenates, as well as hydrogen) based on a single thermochemical process opens the prospects for the development of environment-friendly multipurpose plants with chemical energy storage and export [2,3]. The development of gasification technologies requires reliable information on the kinetics of reactions of carbon fuels with gaseous reagents (O2, CO2, H2O).
The observed carbon gasification rate factors often show high variability (e.g., see References [4,5]). It is due to a large number of simultaneously occurring physical and chemical processes that are not considered within the framework of the simplified analysis of processes of thermochemical conversion of fuel in real furnaces and gasifiers. Even for the same chemical reaction under different conditions (e.g., at different heating rates or gas flow rates), different kinetic patterns may be observed. As a rule, it is connected with carbon origin (for example, conditions of raw material pyrolysis) or with the effect of transfer processes.
Gasification kinetics is related to chemical reactions between bound and free forms of carbon and oxygen on the reactive surface [6,7], the state of which is determined by many factors. The type of original material is of key importance [8,9]. However, differences in reactivity of carbon are observed even when it is obtained from the same solid fuel, but under different conditions [10,11,12]. During pyrolysis, there is particle cracking under the pressure of released gases, contraction, or, on the contrary, swelling of particles, and bubbling of released gases in the semi-molten state. Higher temperatures facilitate cross-linking between carbon microcrystalline structures, which leads to a decrease in the reactivity of carbon [13,14]. In kinetic modeling of fuel processing, most often carbon gasification reactions are treated as single-stage heterogeneous transformations with an effective kinetic constant that covers the whole set of elementary stages without taking into account the peculiarities of the limiting stages [15].
Carbon dioxide is usually a “secondary” gasification agent that is formed when fuel carbon is oxidized with oxygen. On the other hand, CO2 is a greenhouse gas that is generated in energy production and chemical technology processes. Therefore, to balance its formation, it is necessary to develop suitable methods for its utilization. In this case, CO2 can act as a primary gasification agent (for example, in allothermic processes [16]).
There is a wide variety of laboratory reactors for carbon gasification kinetics studies. First of all, it is the drop tube reactor [17,18], and the quartz furnace [19,20]. The fluidized bed reactor makes it possible to achieve a high degree of isothermicity [21]. Fixed bed reactors are used less often because they are most exposed to the weakly controlled effects of transfer processes [22,23]. The least exposed to such influence are thermogravimetric (TG) furnaces whose design, due to high sensitivity, studies thermochemical transformations in small weighed quantities at high rates of heat and mass transfer [24].
An important issue in studying the kinetics of gasification processes is the precise control of temperature fields in the sample: The sample has to be of low thermal inertia, while maintaining, however, its representativeness. As is known from the work on the theory of thermal explosion [25,26], thermogravimetric measurements of exothermic processes require special conditions to avoid overheating, for example, very low rates of heating and dilution with inert filler. Estimates show that even in specialized laboratory devices used to study the kinetics of coal oxidation, it is possible to underestimate the temperature of the sample, due to internal heat generation: In Reference [27], the estimate of the peak temperature difference between the sample and the gas was several tens of degrees; in Reference [28], overheating was more than two hundred degrees at the maximum rate of mass loss. In the study of endothermic processes (such as evaporation and decomposition), deviations in the temperature of the sample from the ambient temperature are possible as well [29]. For more detailed analysis, detailed thermohydrodynamic models of such processes, including chemical heat sources, are being developed [30,31].
When reacting in the diffusion regime, the carbon particle interacts with the reacting gases only by its outer surface, the area of which can be estimated in a rather straightforward way. This proves way more difficult with the internal reacting surface. For example, the processes of pulverized carbon gasification in the atmosphere of carbon dioxide and water vapor even at high temperatures may proceed in pore-diffusion regimes [32,33]. Combustion and gasification at low temperatures (smoldering combustion) also take place in these regions.
Depending on the rate of change of the inner surface, carbon particles behave differently during the reaction: They can burn on the outside, maintaining their density, or, conversely, preserve their volume by reducing their density [34,35]. Oxidation is also affected by the mineral impurities: If the loose ash formed on the surface can be carried away by gas, the dense ash shell creates additional diffusion resistance. The rate of a heterogeneous chemical reaction is extremely sensitive to mass transfer conditions. Even under thermal analysis conditions, when the mass of the weighed quantity is about 10–20 mg, diffusion reaction regimes can be observed [36,37]. The papers [38,39,40] provide recommendations on the choice of experimental parameters (particle size, mass of samples, gas consumption, heating rate) to prevent transfer effects. In Reference [41], the method of estimation of diffusion influence on sample conversion by carrying out preliminary experiments with naphthalene evaporation to measure mass transfer coefficient was proposed. For thermogravimetric measurements, small particle size is usually used. In Reference [42], a comprehensive study of the effect of crucible geometry on the pyrolysis and gasification of coals was carried out: The authors detected a significant influence of crucible height on conversion kinetics at high temperatures.
Ya. B. Zeldovich [43] demonstrated that there can be an intermediate pore-diffusion regime between the kinetic and diffusion regimes of the heterogeneous reaction in porous material under certain conditions (high reactivity, high specific surface, large particles). One of the characteristic features of this regime is a twofold reduction of the observed activation energy. Pore diffusion is a typical mass transfer process for carbonous samples [44]. In Reference [45], it is shown that depending on the size of the particles, there are regimes of gasification with different degrees of utilization of the inner surface. Diffusion regimes of conversion under thermal analysis conditions were reproduced with detailed thermohydrodynamic models [46,47]. In Reference [48], a two-dimensional model of heat and mass transfer in a porous carbon sample during gasification under conditions of rapid heating and subsequent maintaining of the constant reaction temperature is proposed. In the present study, the case of a constant heating rate during the whole experiment will be considered.
A decrease in observed (effective) activation energy can be one of the signs of deviation of gasification regimes from occurring in the kinetic region (here, the kinetic region is understood as isothermal conditions with ideal mixing of components). Based on published research data, it is possible to set permissible limits for the activation energy of gasification reactions. Then, for example, it is possible to exclude from consideration obviously unphysical values (too high or too low), which are often given in the studies on the thermogravimetric analysis of solid fuels [49,50,51].
In the present paper, based on a simple theoretical model, we propose a new method for determining the activation energy of heterogeneous reactions from experimental data with diffusion-induced perturbations. The application of this method is demonstrated by the example of the well-known gasification reaction of porous carbon in carbon dioxide. A technique for the numerical processing of the TG signal is proposed. Results are compared with widely used kinetic models of a one-stage reaction. It is shown that the pore-diffusion model can be used to explain fluctuations in the experimentally observed values of activation energy.

2. Materials and Methods

2.1. Materials

In this study, we used charcoal produced from pine (Bétula). In order to produce the charcoal, we used a muffle furnace, placing an alumina crucible with a lid at 500 °C and holding it for 7 min. Then the crucible was pulled out and cooled down in the desiccator to room temperature. The isothermal holding time is sufficient for the complete devolatilization of the wood biomass. Technical characteristics and elemental composition of pine and charcoal are given in Table 1. The specifications were determined using the relevant standards (ASTM standard E871 (Standard Test Method for Moisture Analysis of Particulate Wood Fuels), E872 (Standard Test Method for Volatile Matter in the Analysis of Particulate Wood Fuels), and D1102-84 (2013) (Standard Test Method for Ash in Wood). The elemental composition was determined using the elemental analyzer (Flash EA 1112, ThermoFinigan, Rodano, Italy).

2.2. Thermal Analysis

Experimental studies were conducted with the NETZSCH STA 449 C simultaneous thermal analyzer (Netzsch, Ahlden, Germany). The samples we studied were heated at different rates of 1, 5, 10, 20, and 50 K min−1 in a mixture of argon (purity is 99.9998%) and carbon dioxide (purity is 99.99%). Argon serves as a shielding gas (10 mL min−1). The flow of carbon dioxide was 30 mL min−1. The process of charcoal conversion was studied in a broad temperature range from room temperature to 1273 K. The weight of the samples in all experiments was 9–10 mg. The studies were conducted using a TG holder and alumina crucibles shaped like a flat plate. The sample is placed in a flat crucible, after which, heating and gas flow are turned on (Figure 1). The temperature is automatically regulated by heating the walls. Throughout the experiment, the sample weight and crucible temperature are recorded. After reaching a temperature of 1273 K, experiments were stopped. This is due to limitations on the properties of the furnace materials and the onset of phase transitions in the mineral part of the samples.
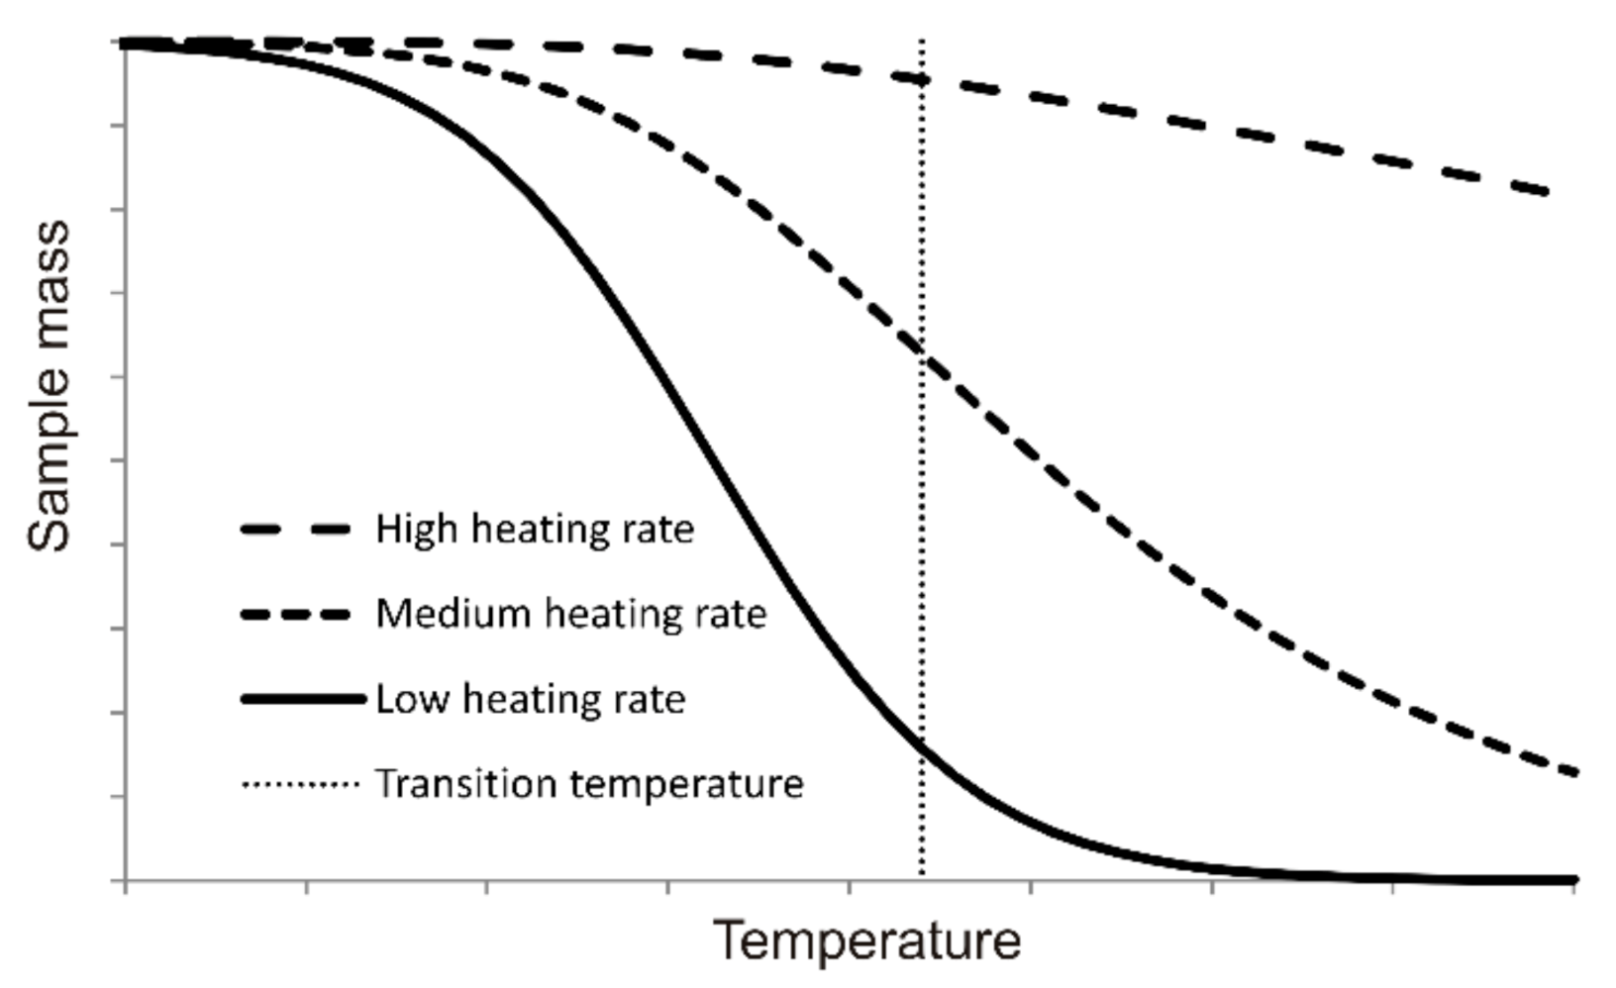
A constant heating rate simulates the initial stage of allothermal gasification. Selected heating rates can be observed in low-capacity reactors (for example, in moving bed gasifiers, where the residence time of particles may be up to tens of minutes [52]). The heating rate determines the ratio of the characteristic times of the chemical reaction (tR) and heating (tH). If in the course of heating the dependence of the reaction rate on temperature changes (for example, the transition from the kinetic regime to the diffusion regimes occurs), then at low tR/tH ratios, the heterogeneous reaction will proceed closer to the kinetic region, and at large tR/tH, the reaction will proceed closer to the diffusion region. This dependence is schematically presented in Figure 2—the higher the heating rate, the smaller the fraction of the sample is converted before transition temperature is achieved.
Charcoal has a developed surface, the state of which largely determines the reactivity. It is known that under heating conditions, the reactivity of carbon materials can decrease, due to thermal annealing. However, the studies on this effect as applied to lignocellulosic-origin chars show that it manifests itself at higher temperatures compared to those used in this work [53].

2.3. Kinetic Models for Processing TG Curves

The rate of charcoal gasification is proportional to the area of the reactive surface and the concentration of the gasification agent. The reaction rate constant can usually be represented in the Arrhenius-type form:
d m C d t = k 0 exp E a R T S r C C O 2
Here, mC—mass of carbon in the sample, Sr—area of reactive surface, m2; CCO2—concentration of carbon dioxide in gas flow. Equation (1) is often used in modeling solid fuel gasification processes [54]. The dependence of the reaction area on the sample mass is determined by the geometric parameters of the particles; in general, it is possible to assume the formula Sr/S0 = (mC/m0)n. The linearization of Equation (1) in view of this formula yields:
ln d m C d t 1 C C O 2 m C n = ln k 0 S 0 m 0 n E a R T
Under the external diffusion regime, the rate of gasification is determined by the rate of oxidizer diffusion to the carbon surface:
d m C d t = N u D D L S c C C O 2
Here NuD—mass transfer Nusselt number (Sherwood number), D—diffusion coefficient, L—characteristic crucible size, Sc—crucible cross-section. The diffusion coefficient depends on the temperature as its power function: D = D0Tp, where the exponent p is in the range of 1 to 2 [55]. Then linearization is carried out in logarithmic coordinates, not in Arrhenius coordinates:
ln d m C d t 1 C C O 2 = ln N u D D 0 S c L + p ln T
Under pore-diffusion regimes, gasification does not occur in the entire porous volume of the sample, but in the diffusion layer, the width of which depends on the ratio of the reaction rate constant and diffusion coefficient (Thiele number [56]). The quasi-stationary rate of the first-order reaction in a layer of particles is given as follows [43]:
d m C d t = S c C C O 2 k 0 exp E a R T D S p = S c C C O 2 exp E a 2 R T k 0 D S p
Here Sp—specific surface of particles, m−1. Converting this equation to Arrhenius coordinates produces the following expression:
ln d m C d t 1 C C O 2 2 = ln S c 2 k 0 D S p E a R T
It is important to note that Equation (5) takes into account diffusion processes under special conditions, rather than being a generalization of Equations (1) and (3). Therefore, the scope of applicability of Equation (6) to the processing of thermal analysis data is limited to pore-diffusion regimes. To the authors’ knowledge, there is no published research on the application of Equation (6) to the interpretation of thermal analysis results.
All models considered herein were used for processing kinetic curves of charcoal gasification in CO2. The pre-exponential factor is determined by the area of the reacting surface, which is usually measured with a high degree of uncertainty. Therefore, the main kinetic characteristic for comparing different models is the activation energy. As is known from published research data, the average activation energy is of the order of 200 kJ mol−1 [54,57,58]. Therefore, the gasification regime of samples under thermal analysis conditions can be identified by the proximity of the apparent activation energy to the anticipated value.

3. Results

3.1. Thermogravimetric Curves

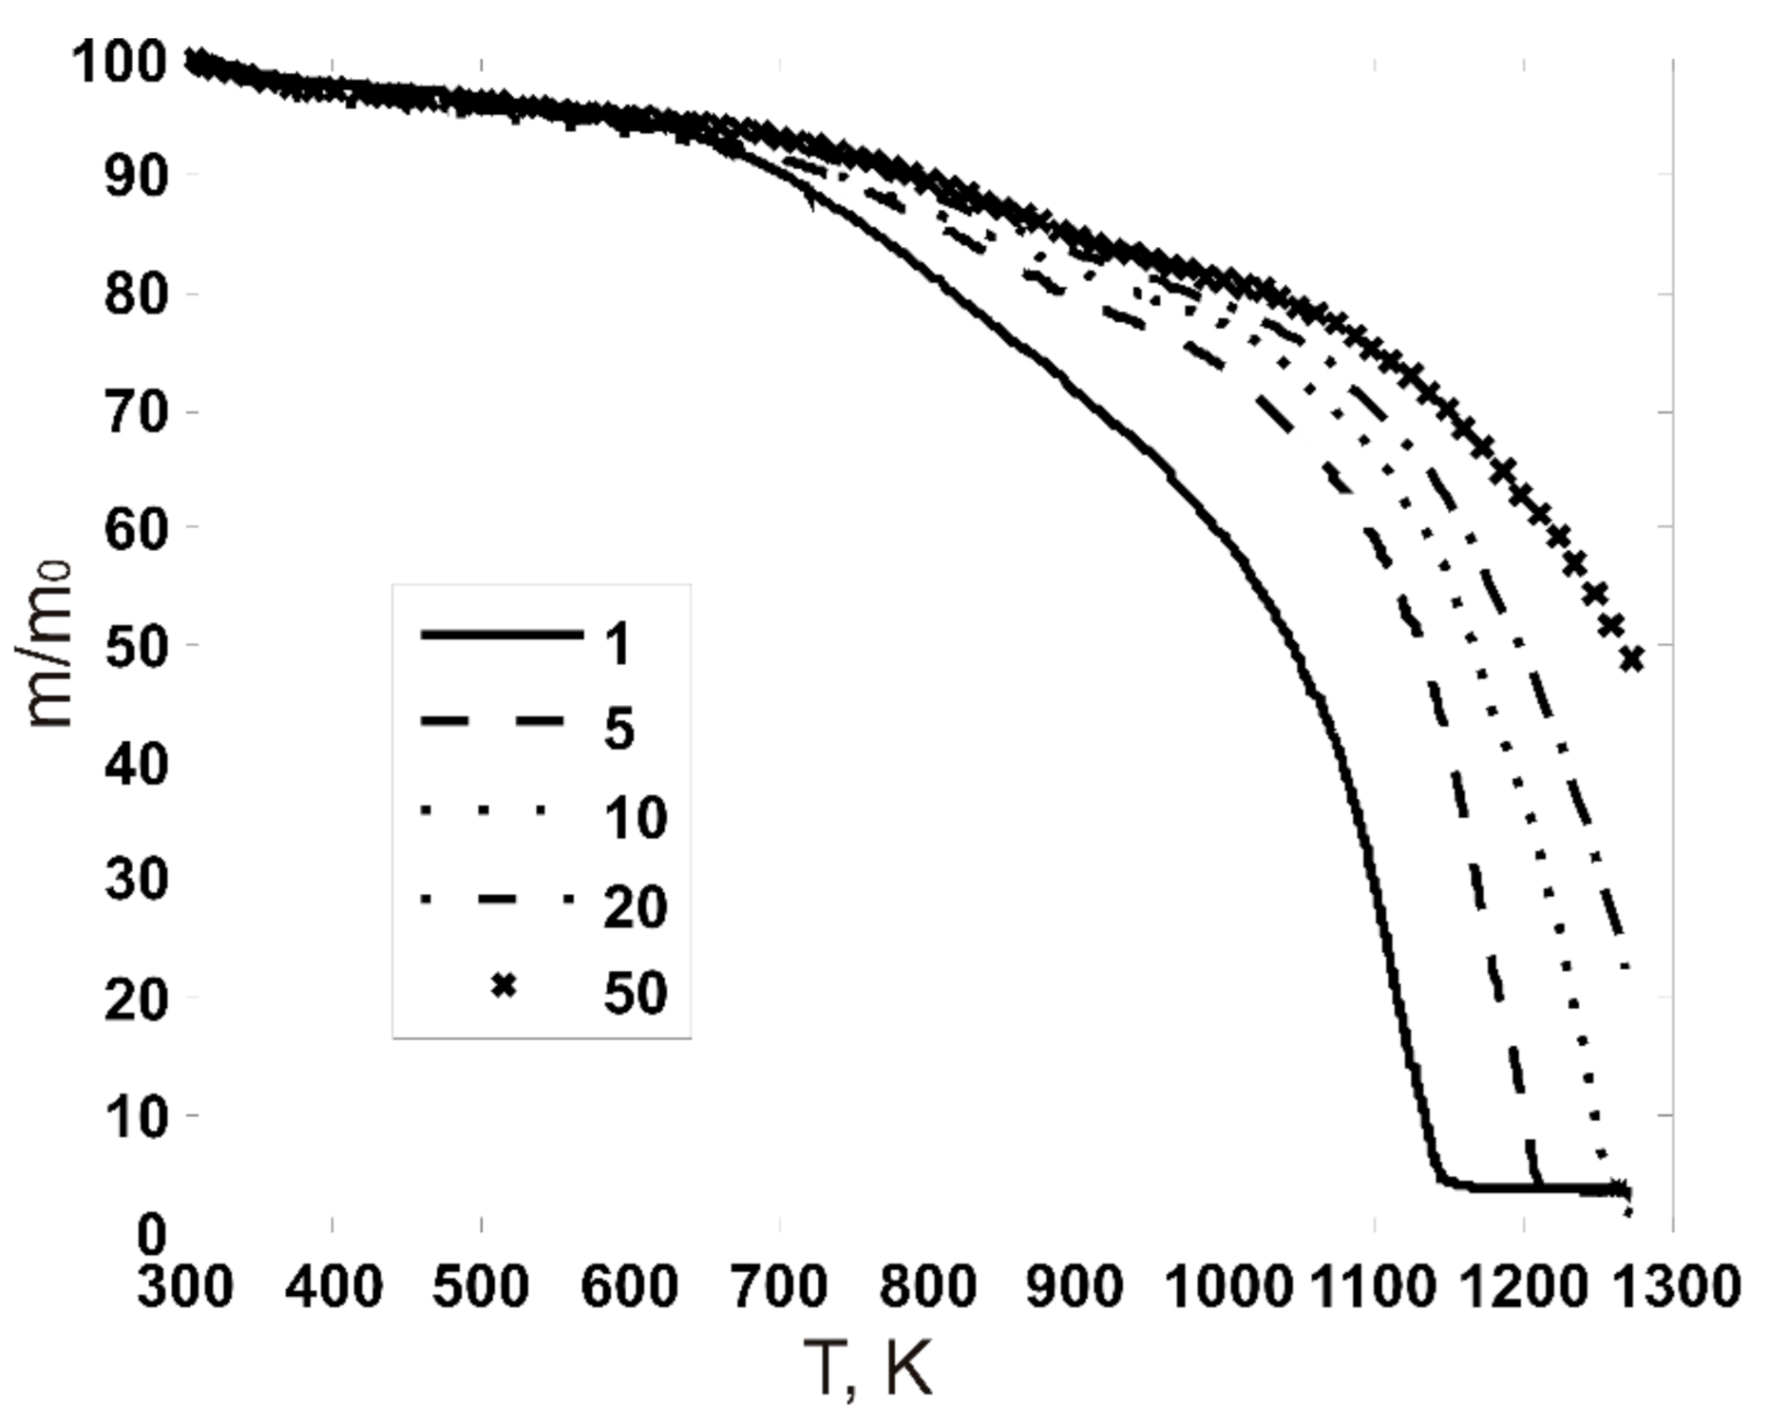
The obtained thermogravimetric curves are shown in Figure 3. With increasing heating rate, the experiment time decreases, so at heating rates of 20 and 50 K min−1, the sample does not have enough time to achieve full conversion (due to heat resistance limitations of the furnace unit). In addition, further heating can lead to ash melting, which can distort kinetic measurements. Moreover, the two stages are rather clearly distinguishable within the curves. The first one corresponds to the volatile residual yield. The second stage corresponds to carbon gasification, which begins from 850–1000 K.

3.2. Kinetic Analysis

3.2.1. External Diffusion Model

Let us consider the TG curve of charcoal gasification at a heating rate of 10 K min−1. Figure 4a shows the ln(−dm/dt)–ln(T/273) plot. The correlation proves quite good, but the exponent p determined by the slope of the regression line turns to be 11.9. The anticipated value of p for the diffusion regime of conversion, as stated above, is of the order of 1–2, so the diffusion model is not suitable for describing the gasification kinetics under the conditions of the experiment conducted.

3.2.2. Pore-Diffusion Model

Data processing within the framework of the pore-diffusion reaction model yields the activation energy value of 212 kJ mol−1, which is quite close to the anticipated value (Figure 4b). It can be concluded that in the case of charcoal gasification given a heating rate of 10 K min−1, the selected mass of the sample, and the flow rate values, the pore-diffusion regime is observed.

3.2.3. Kinetic Model

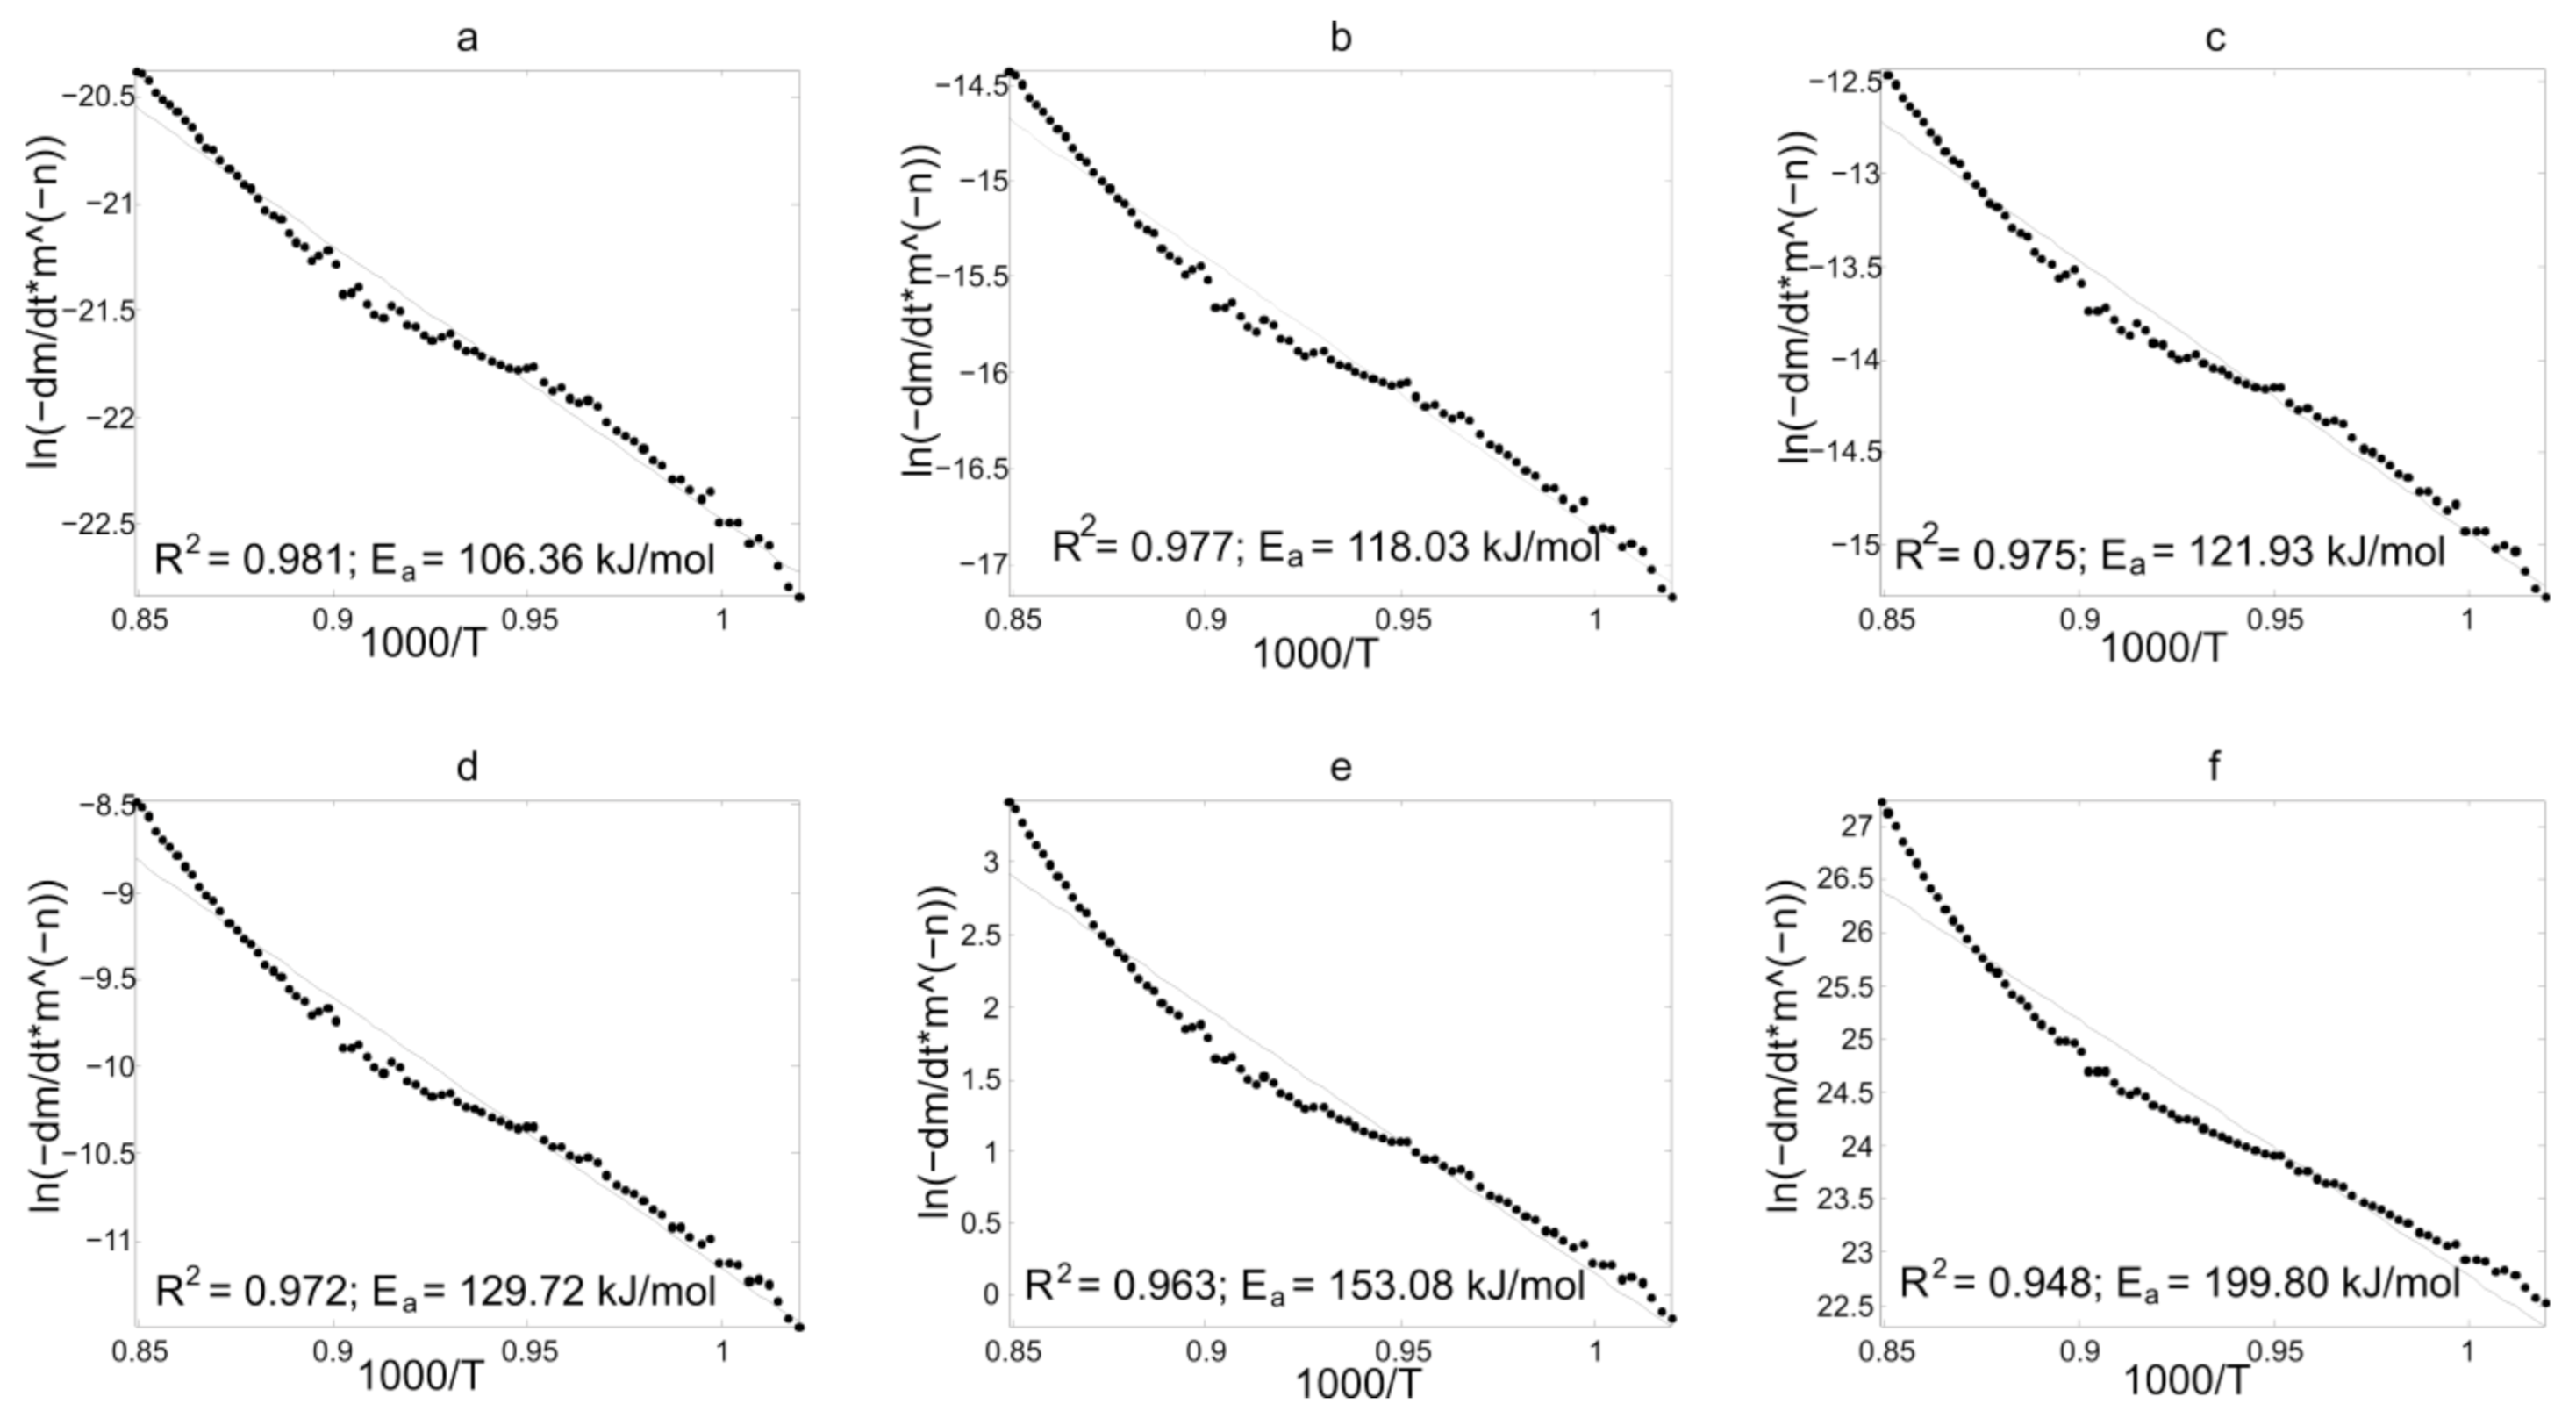
Linearization using Equation (2) with different exponents of the surface-mass relationship n (0 to 4) also generates the seemingly satisfactory results: Correlation coefficients for all models turn out to be at least 0.9 (Figure 5). However, the estimation of activation energy at values n equal to 1 yields the value of the order of 100–130 kJ mol−1, which is approximately half of the anticipated value [57]. A suitable activation energy value can be found given n = 4 (200 kJ mol−1), but it is difficult to physically justify this value of n.

3.3. Discussion of Kinetic Analysis Results

3.3.1. Results of Experimental TG-Curves Processing

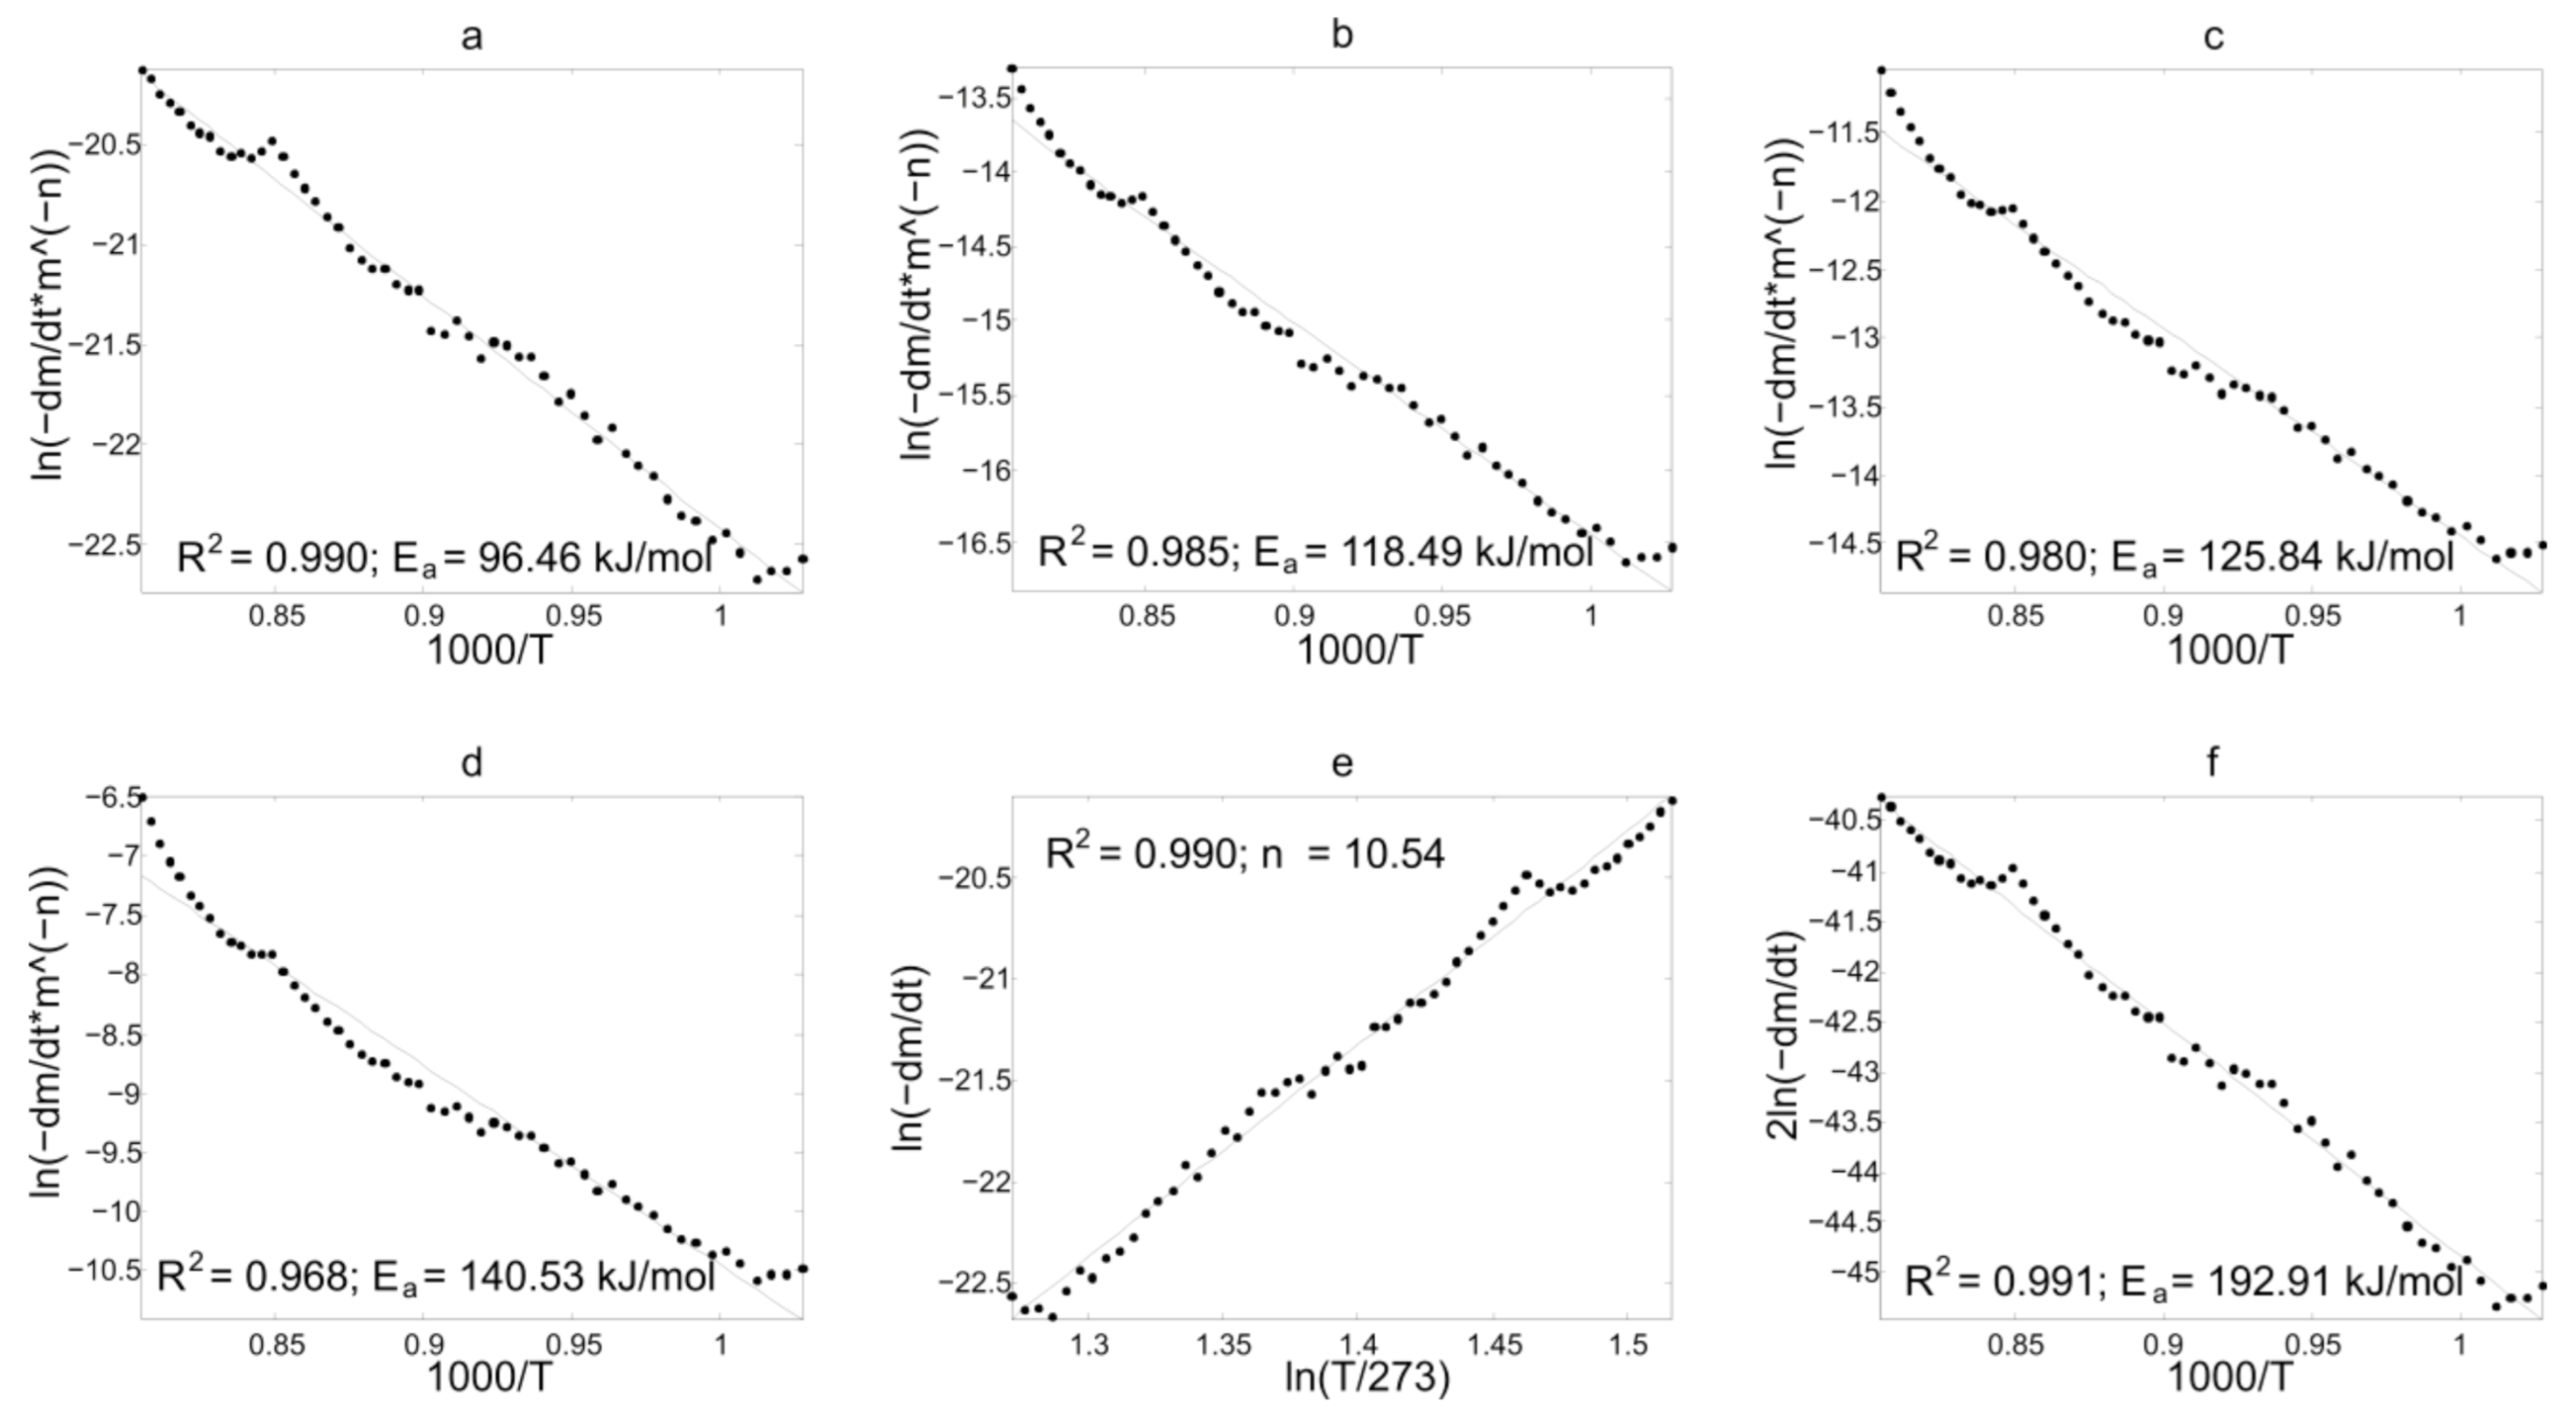
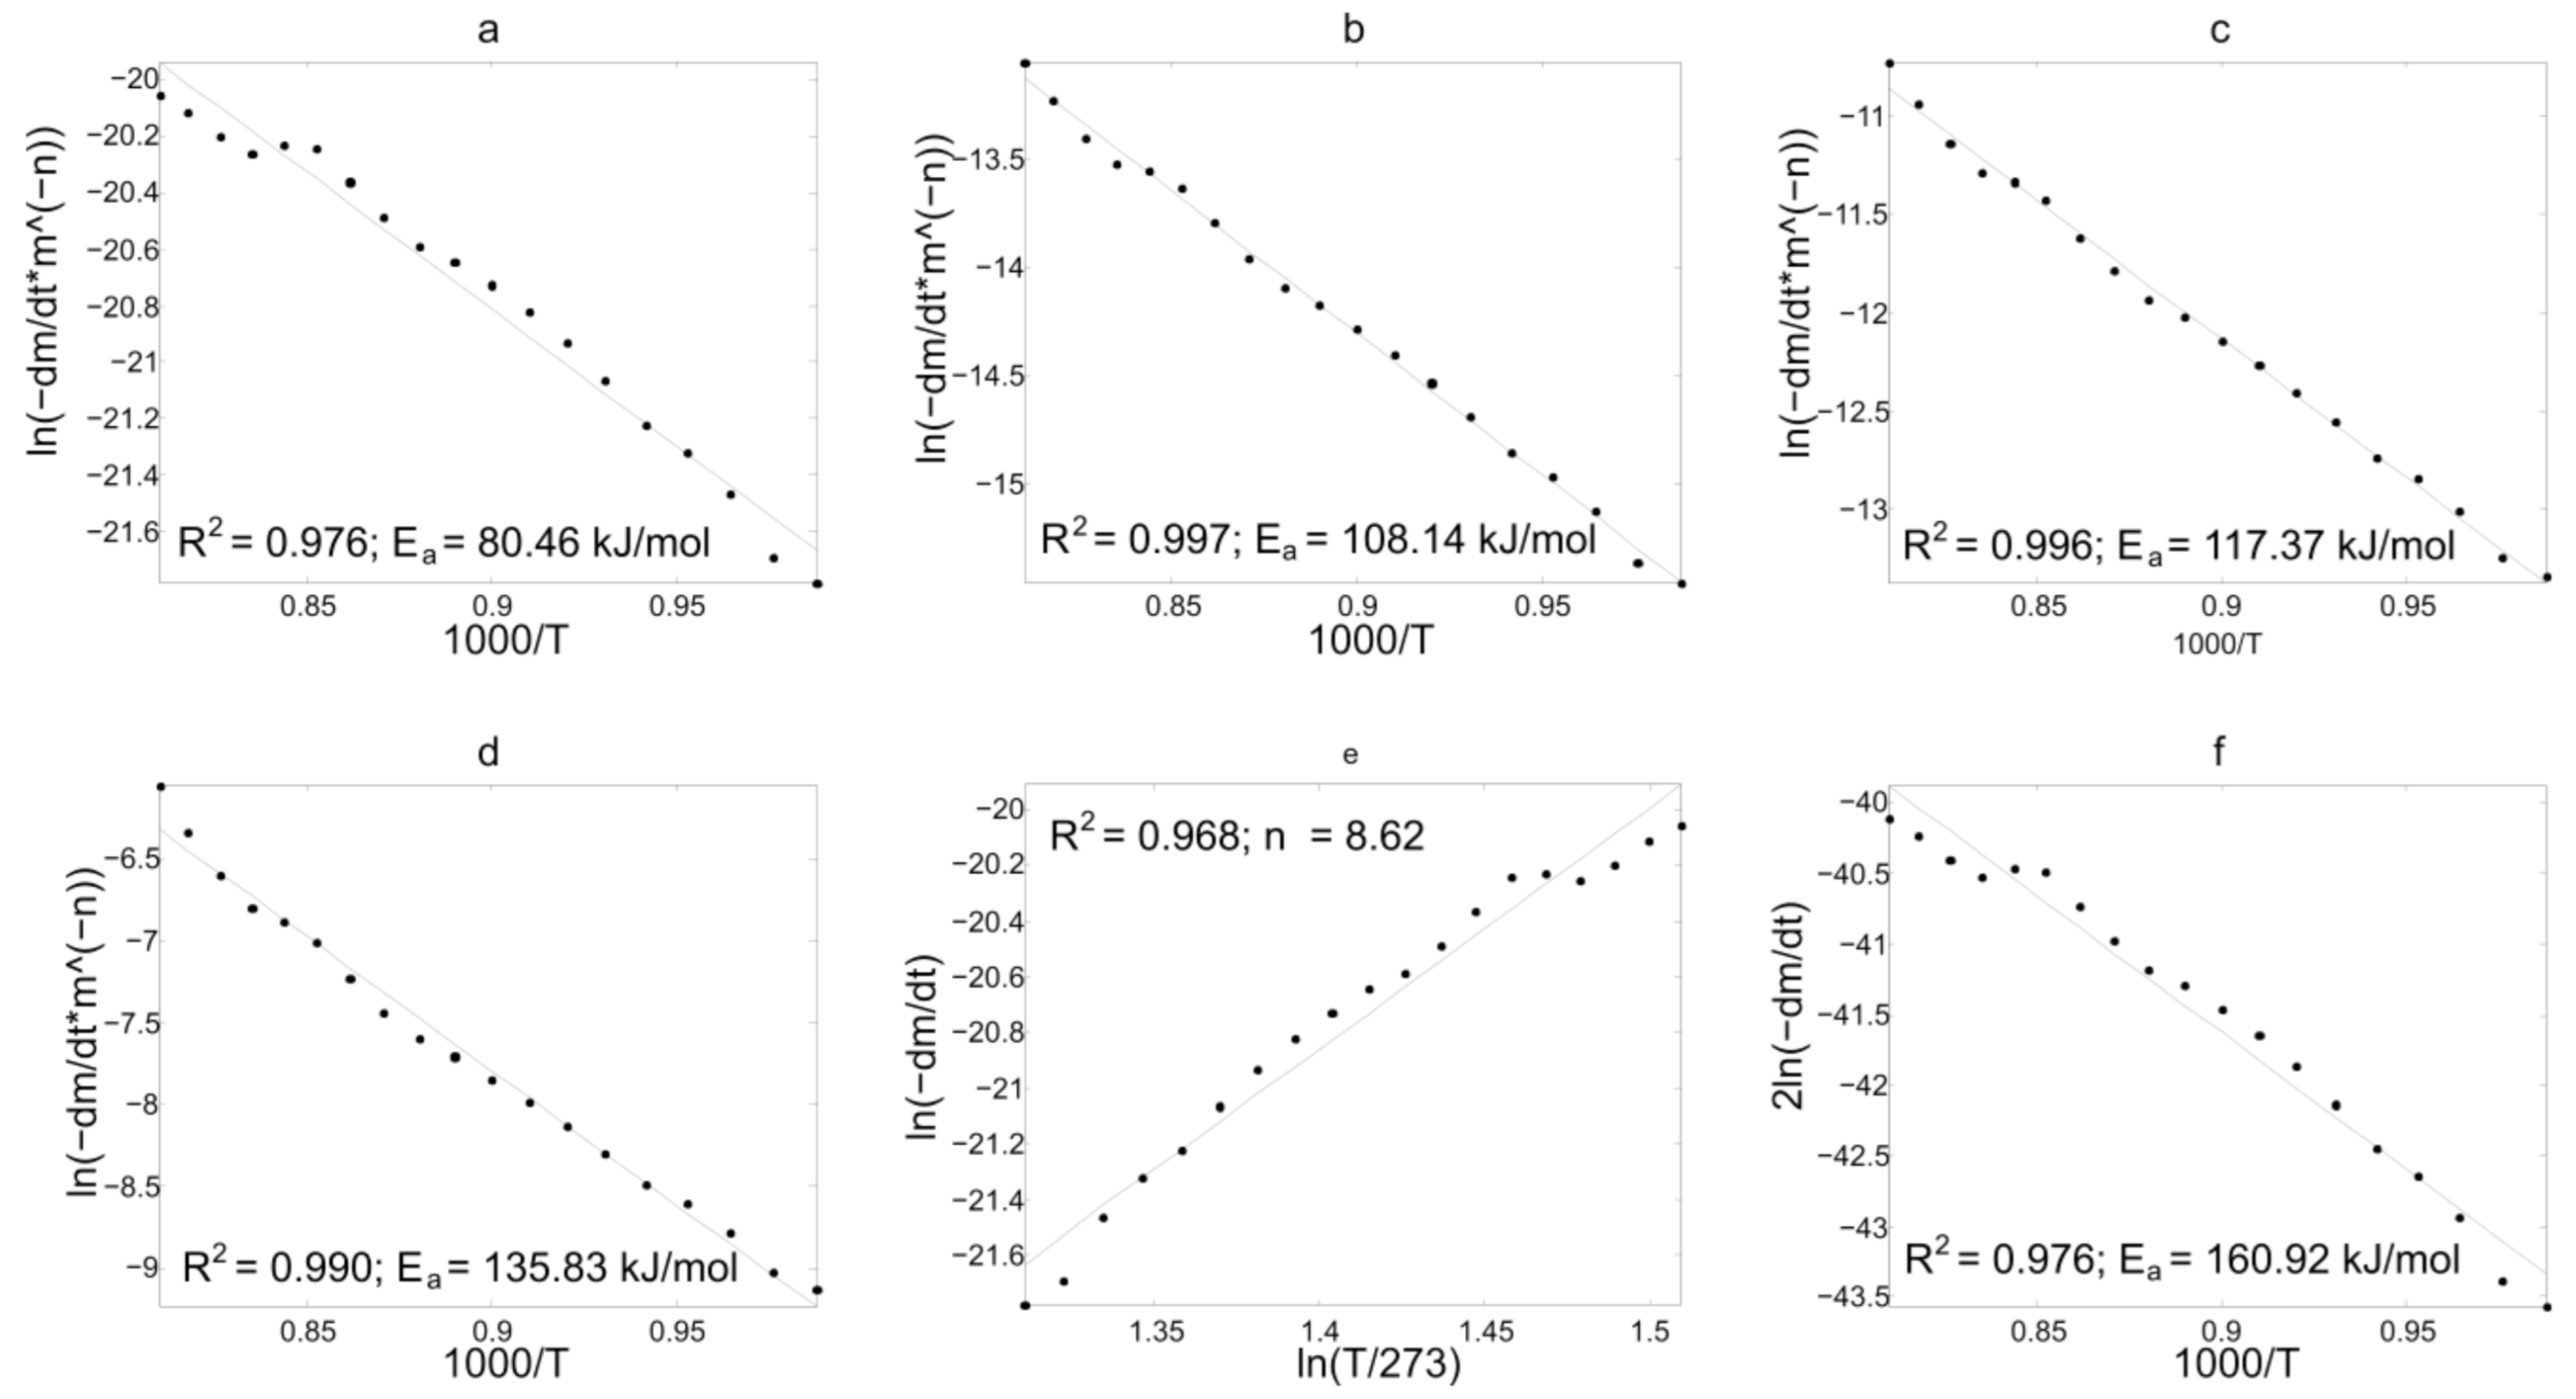
Arrhenius plots constructed for TG curves of charcoal gasification at other heating rates are presented in Figure 6, Figure 7, Figure 8 and Figure 9. At a heating rate of 1 K min−1, the application of kinetic model (2) at n = 1 yields the activation energy value of 197 kJ mol−1 (Figure 6). Most likely, at low heating rates, the kinetic regime is observed. However, already at a heating rate of 5 K min−1, a simple kinetic model (2) yields activation energy values of the order of 100–130 kJ mol−1 (see Figure 7), just like in the above case with a heating rate of 10 K min−1. The application of the pore-diffusion kinetics Equation (6) results in a activation energy value of 209 kJ mol−1. The results of processing of TG curves for a heating rate of 20 K min−1 by Equation (6) yield an activation energy value of 193 kJ mol−1, which is also quite close to the anticipated value (Figure 8).
At a heating rate of 50 K min−1 (Figure 9), there are significant deviations from the anticipated value when using any of the models. Arguably, at high heating rates, the effects of the thermal inertia of the sample may prove significant: Due to intensive endothermic reaction on the surface, temperature irregularities occur, and the use of kinetic methods requires factoring them [29].

3.3.2. Discussion

The results of the processing of TG curves obtained at different heating rates using different kinetic models are given in Table 1. As can be seen, at the minimum heating rate, the kinetic model with the parameter n equal to one yields the most adequate value of the activation energy: At slow heating, the sample conversion is completed by about 1150 K, and the charcoal gasification, in this case, proceeds in the kinetic regime. Such low heating rates, however, are inconvenient in experimental studies as they require more time to perform the experiment. With a heating rate of 5–20 K min−1, the pore-diffusion model (denoted in Table 2 as Z) produces better results. Since the experiment time is 5 and 20 less than at a heating rate of 1 K min−1, the model of pore-diffusion reaction may become a standard model for processing the kinetic curves of carbon gasification in CO2 under these conditions. At a heating rate of 50 K min−1, as mentioned above, there are additional difficulties in interpreting the TG curve: This heating rate is not recommended for studies of such processes. It can be assumed that the applicability of the pore-diffusion model for determining the activation energy (according to our experimental data) is limited by heating rates in the range of 5–20 K min−1.
Thus, our proposed model allows us to explain the sensitivity of the apparent activation energy to heating conditions. Applying the usual kinetic model (n = 1), we obtain a scatter of the activation energy values of 129–197 kJ/mol. Having accepted the hypothesis about the effect of pore diffusion, we obtain the values of 192–212 kJ/mol (i.e., range becomes almost three times smaller). Note that the chemical mechanism of the heterogeneous reaction does not change in this case (at least this change is not considered). Conditions of mass transfer between reacting surface and external gas flow changes only. A rigorous confirmation of this hypothesis requires more detailed measurements (first of all, with varying the characteristic size of the samples) and has not yet been performed.
Isothermal experiments on gasification of charcoals in CO2 atmosphere are presented in the literature, for example, in works [9,45,59,60]. In order to determine the mass transfer regime in these experiments, the apparent activation energy values can be compared. In paper [9], the activation energy of the charcoal gasification reaction at temperatures above 1120 K is equal to 123 kJ/mol. The activation energy is 100–110 kJ/mol in paper [61], and is 130 kJ/mol in paper [45] (for agricultural waste char). It can be assumed that the results obtained in these works also correspond to the proposed diffusion-kinetic model. It should be noted that Equation (5) describes the reaction-diffusion interaction in quasi-stationary approximation, so reaction rate does not depend on conversion degree. Therefore, at the initial stage of conversion, the mass loss rate in isothermal conditions should be approximately constant, which is observed in a number of experimental works (for example, References [9,60]). When the pore diffusion region becomes smaller than the size of the unreacted sample, the gasification rate depends on the parameters of individual particles, and Equation (5) becomes inapplicable. In this case, to estimate the Arrhenius coefficients, expressions are required that include the dependence on the conversion degree. This circumstance can explain the tendency towards an increase in the activation energy at high temperatures in our experiments (see Figure 5 and Figure 7, Figure 8 and Figure 9).
At the end of the section, we are to clarify important details regarding the determination of the kinetic parameters from one kinetic curve. The guidelines [62] state the preferred use of kinetic analysis methods using multiple kinetic curves. Such an analysis is applicable in the case when the apparent activation energy does not depend on the heating rate. If, at different heating rates, the determining stages of the whole process change (in our case, mass transfer and chemical reaction), kinetic analysis using several curves obtained under different conditions will be inappropriate. This work, however, does not assert the erroneousness of recommendations [62], but points to some limitations of their applicability in the case of heterogeneous reactions (on the example of carbon gasification).

4. Conclusions

This paper proposed a method for determining the kinetic coefficients of the heterogeneous reaction (charcoal gasification by carbon dioxide) under pore-diffusion control (the rates of heterogeneous reaction and oxidizer diffusion in the porous space of the sample have the same order of magnitude). For TG-curves processing, a quasi-stationary approximation is used. The pore-diffusion model makes it possible to correct the values of the kinetic parameters, which are obtained using commonly used models (volume reaction, shrinking core). The range of activation energy variation changes from 129–197 kJ/mol to 192–212 kJ/mol, i.e., it becomes almost three times smaller.
At the most commonly used heating rates of 5–20 K min−1, there is fairly good correspondence between the experimental curves and the model of porous-diffusion kinetics. At a heating rate of 1 K min−1, the mass transfer constraints become insignificant, and a simple kinetic model produces satisfactory results. At a heating rate of 50 K min−1 the chemical reaction takes place at higher temperatures, the average gasification rate increases: Apparently, under such conditions, the assumed approximations (quasi-stationarity, temperature uniformity) become inapplicable. The diffusion model is inapplicable in all cases.
The obtained results narrow down the area of parameters to the range that enables conducting kinetic studies under the conditions of thermal analysis and also provide tools for determining the kinetic coefficients of charcoal gasification under the influence of diffusion processes. The conditions for the transition of a heterogeneous reaction in the pore-diffusion control may depend, in addition to the heating rate, on the characteristic size of the sample and the features of gas flow. Therefore, the found conditions may change when using other sample mass, crucible type, or gas composition. A more rigorous determination of these dependencies is the subject of future research.

Author Contributions

Conceptualization, I.D.; methodology, I.D.; samples preparation and experiments, A.K.; writing—original draft preparation, I.D. and A.K. All authors have read and agreed to the published version of the manuscript.

Funding

The research was carried at the MESI SB RAS under the program for basic research of the SB RAS (project ID FWEU-2021-0005, reg. No. AAAA-A21-121012190004-5) using the equipment of the “High-Temperature Circuit” scientific center.

Institutional Review Board Statement

Not applicable.

Informed Consent Statement

Not applicable.

Data Availability Statement

The data used in this study are available by request to the authors.

Conflicts of Interest

The authors declare no conflict of interest.

Notation

mCcarbon mass
ttime
k0pre-exponential factor
Eaactivation energy
Runiversal gas constant
Ttemperature
Ssurface area
Coxidizer concentration
nexponent in the formula for the dependence of reaction surface on sample mass (reaction order with respect to fuel)
NuDmass transfer Nusselt number
Ddiffusion coefficient
Lcharacteristic linear crucible size
pexponent in the formula for the dependence of the diffusion coefficient on temperature

References

  1. World Energy Outlook 2019; International Energy Agency: Paris, France, 2019.
  2. Cormos, A.-M.; Dinca, C.; Cormos, C.-C. Multi-fuel multi-product operation of IGCC power plants with carbon capture and storage (CCS). Appl. Therm. Eng. 2015, 74, 20–27. [Google Scholar] [CrossRef]
  3. Kler, A.M.; Tyurina, E.A.; Mednikov, A.S.; Kler, A.M.; Mednikov, A.S. A plant for methanol and electricity production: Technical-economic analysis. Energy 2018, 165, 890–899. [Google Scholar] [CrossRef]
  4. Hurt, R.H.; Haynes, B.S. On the origin of power-law kinetics in carbon oxidation. Proc. Combust. Inst. 2005, 30, 2161–2168. [Google Scholar] [CrossRef]
  5. Di Blasi, C. Combustion and gasification rates of lignocellulosic chars. Prog. Energy Combust. Sci. 2009, 35, 121–140. [Google Scholar] [CrossRef]
  6. Mianowski, A.; Radko, T.; Siudyga, T. The reactivity of cokes in Boudouard–Bell reactions in the context of an Ergun model. J. Therm. Anal. Calorim. 2015, 122, 1013–1021. [Google Scholar] [CrossRef] [Green Version]
  7. Wang, S.; Wu, L.; Hu, X.; Zhang, L.; O’Donnell, K.M.; Buckley, C.E.; Li, C.-Z. An X-ray photoelectron spectroscopic perspective for the evolution of O-containing structures in char during gasification. Fuel Process. Technol. 2018, 172, 209–215. [Google Scholar] [CrossRef] [Green Version]
  8. Huo, W.; Zhou, Z.; Chen, X.; Dai, Z.; Yu, G. Study on CO2 gasification reactivity and physical characteristics of biomass, petroleum coke and coal chars. Bioresour. Technol. 2014, 159, 143–149. [Google Scholar] [CrossRef] [PubMed]
  9. Zhou, L.; Zhang, G.; Schürz, M.; Steffen, K.; Meyer, B. Kinetic study on CO2 gasification of brown coal and biomass chars: Reaction order. Fuel 2016, 173, 311–319. [Google Scholar] [CrossRef]
  10. Kuznetsov, A.P.; Orenbakh, M.S. Formation and change of coke structure in the process of fossil coal burning. Teploenergetika 1975, 3, 23–27. (In Russian) [Google Scholar]
  11. Jayaraman, K.; Gokalp, I.; Bonifaci, E.; Merlo, N. Kinetics of steam and CO2 gasification of high ash coal–char produced under various heating rates. Fuel 2015, 154, 370–379. [Google Scholar] [CrossRef]
  12. Vorobiev, N.; Geier, M.; Schiemann, M.; Scherer, V. Experimentation for char combustion kinetics measurements: Bias from char preparation. Fuel Process. Technol. 2016, 151, 155–165. [Google Scholar] [CrossRef]
  13. Russell, N.V.; Gibbins, J.R.; Man, C.K.; Williamson, J. Coal char thermal deactivation under pulverized fuel combustion conditions. Energy Fuels 2000, 14, 883–888. [Google Scholar] [CrossRef]
  14. Zolin, A.; Jensen, A.D.; Jensen, P.A.; Dam-Johansen, K. Experimental study of char thermal deactivation. Fuel 2002, 81, 1065–1075. [Google Scholar] [CrossRef]
  15. Karlström, O.; Brink, A.; Hupa, M. Desorption kinetics of CO in char oxidation and gasification in O2, CO2 and H2O. Combust. Flame 2015, 162, 788–796. [Google Scholar] [CrossRef]
  16. Ralnikov, P.A.; Abaimov, N.A.; Ryzhkov, A.F. Investigation of coal entrained-flow gasification in O2-CO2 mixtures for oxy-fuel IGCC. J. Phys. Conf. Ser. 2018, 1128, 012007. [Google Scholar] [CrossRef]
  17. Gonzalez, V.; Rusig, S.; Schurz, M.; Krzack, S.; Kleeberg, J.; Guhl, S.; Meyer, B. Experimental investigations on lignite char gasification kinetics using a pressurized drop tube reactor. Fuel 2018, 224, 348–356. [Google Scholar] [CrossRef]
  18. Rußig, S.; Gonzalez, V.; Schurz, M.; Krzack, S.; Kleeberg, J.; Guhl, S.; Meyer, B. Particle residence time measurement in a pressurized drop-tube reactor with radioactive tracer. Fuel 2019, 252, 37–46. [Google Scholar] [CrossRef]
  19. Ryzhkov, A.F.; Silin, V.E.; Bogatova, T.F.; Nadir, S.M. Ignition and combustion features of biofuels. J. Eng. Phys. Thermophys. 2011, 84, 888–897. [Google Scholar] [CrossRef]
  20. Vershinina, K.Y.; Shlegel, N.; Strizhak, P. Impact of environmentally attractive additives on the ignition delay times of slurry fuels: Experimental study. Fuel 2019, 238, 275–288. [Google Scholar] [CrossRef]
  21. Pielsticker, S.; Gövert, B.; Kreitzberg, T.; Habermehl, M.; Hatzfeld, O.; Kneer, R. Development of a rapidly responding fluidized bed reactor by theoretical and experimental evaluation of combustion reactions. Fuel 2018, 223, 462–469. [Google Scholar] [CrossRef]
  22. Schröder, E. Experiments on the pyrolysis of large beechwood particles in fixed beds. J. Anal. Appl. Pyrolysis 2004, 71, 669–694. [Google Scholar] [CrossRef]
  23. Gerasimov, G.; Khaskhachikh, V.; Potapov, O. Experimental study of kukersite oil shale pyrolysis by solid heat carrier. Fuel Process. Technol. 2017, 158, 123–129. [Google Scholar] [CrossRef]
  24. Boyko, E.A. Complex Thermal Analysis of Solid Organic Fuels; Krasnoyarsk State Technical University: Krasnoyarsk, Russia, 2005. [Google Scholar]
  25. Merzhanov, A.G. On quasi-stationary theory of thermal explosion. Doklady USSR 1961, 40, 637–640. (In Russian) [Google Scholar]
  26. Sánchez-Rodriguez, D.; Farjas, J.; Roura, P. The critical conditions for thermal explosion in a system heated at a constant rate. Combust. Flame 2017, 186, 211–219. [Google Scholar] [CrossRef] [Green Version]
  27. Khudyakova, G.I. Experimental Study of Thermochemical Conversion of Charcoal by Thermogravimetric Analysis. Ph.D. Thesis, Ural Federal University, Yekaterinburg, Russia, 2015. (In Russian). [Google Scholar]
  28. Branca, C.; Di Blasi, C. Self-heating effects in the thermogravimetric analysis of wood char oxidation. Fuel 2020, 276, 118012. [Google Scholar] [CrossRef]
  29. L’vov, B.V. Thermal Decomposition of Solid and Liquid Substances; Polytechnic Univ. Publ.: Saint-Petersburg, Russia, 2006. (In Russian) [Google Scholar]
  30. Meng, X.; De Jong, W.; Badri, F.S.; Benito, P.; Basile, F.; Verkooijen, A.H. Combustion study of partially gasified willow and DDGS chars using TG analysis and COMSOL modeling. Biomass Bioenergy 2012, 39, 356–369. [Google Scholar] [CrossRef]
  31. Schulze, S.; Nikrityuk, P.; Abosteif, Z.; Guhl, S.; Richter, A.; Meyer, B. Heat and mass transfer within thermogravimetric analyser: From simulation to improved estimation of kinetic data for char gasification. Fuel 2017, 187, 338–348. [Google Scholar] [CrossRef]
  32. Kumar, M.; Ghoniem, A.F. Application of a validated gasification model to determine the impact of coal particle grinding size on carbon conversion. Fuel 2013, 108, 565–577. [Google Scholar] [CrossRef]
  33. Chevarin, F.; Azari, K.; Lemieux, L.; Ziegler, D.; Fafard, M.; Alamdari, H. Active pore sizes during the CO2 gasification of carbon anode at 960 °C. Fuel 2016, 178, 93–102. [Google Scholar] [CrossRef]
  34. Hurt, R.H.; Sarofim, A.F.; Longwell, J.P. Gasification-induced densification of carbons: From soot to form coke. Combust. Flame 1993, 95, 430–432. [Google Scholar] [CrossRef]
  35. Mitchell, R.E.; Ma, L.; Kim, B. On the burning behavior of pulverized coal chars. Combust. Flame 2007, 151, 426–436. [Google Scholar] [CrossRef]
  36. Gómez-Barea, A.; Ollero, P.; Arjona, R.; De Castro, P.A.O. Reaction-diffusion model of TGA gasification experiments for estimating diffusional effects. Fuel 2005, 84, 1695–1704. [Google Scholar] [CrossRef]
  37. Nowak, B.; Karlström, O.; Backman, P.; Brink, A.; Zevenhoven, M.; Voglsam, S.; Winter, F.; Hupa, M. Mass transfer limitation in thermogravimetry of biomass gasification. J. Therm. Anal. Calorim. 2013, 111, 183–192. [Google Scholar] [CrossRef]
  38. Jess, A.; Andresen, A.-K. Influence of mass transfer on thermogravimetric analysis of combustion and gasification reactivity of coke. Fuel 2010, 89, 1541–1548. [Google Scholar] [CrossRef]
  39. Mani, T.; Mahinpey, N.; Murugan, P. Reaction kinetics and mass transfer studies of biomass char gasification with CO2. Chem. Eng. Sci. 2011, 66, 36–41. [Google Scholar] [CrossRef]
  40. Gomez, A.; Mahinpey, N. Kinetic study of coal steam and CO2 gasification: A new method to reduce interparticle diffusion. Fuel 2015, 148, 160–167. [Google Scholar] [CrossRef]
  41. Morin, M.; Pécate, S.; Masi, E.; Hémati, M. Kinetic study and modelling of char combustion in TGA in isothermal conditions. Fuel 2017, 203, 522–536. [Google Scholar] [CrossRef] [Green Version]
  42. Shi, L.; Liu, Q.; Guo, X.; He, W.; Liu, Z. Pyrolysis of coal in TGA: Extent of volatile condensation in crucible. Fuel Process. Technol. 2014, 121, 91–95. [Google Scholar] [CrossRef]
  43. Zeldovich, Y.B. Selected Works. Chemical Physics and Hydrodynamics; Princeton Univ. Press: Oxfordshire, UK, 1992; Volume I. [Google Scholar]
  44. Annamalai, K.; Ryan, W. Interactive processes in gasification and combustion—II. Isolated carbon, coal and porous char particles. Prog. Energy Combust. Sci. 1993, 19, 383–446. [Google Scholar] [CrossRef]
  45. Huo, W.; Zhou, Z.; Wang, F.; Wang, Y.; Yu, G. Experimental study of pore diffusion effect on char gasification with CO2 and steam. Fuel 2014, 131, 59–65. [Google Scholar] [CrossRef]
  46. Piddubniak, O.; Ledakowicz, S.; Nowicki, L. New approach to a problem of heat transfer with chemical reaction in a cylinder of finite dimensions. Int. J. Heat Mass Transf. 2011, 54, 338–344. [Google Scholar] [CrossRef]
  47. Buczyński, R.; Czerski, G.; Zubek, K.; Weber, R.; Grzywacz, P. Evaluation of carbon dioxide gasification kinetics on the basis of non-isothermal measurements and CFD modelling of the thermogravimetric analyser. Fuel 2018, 228, 50–61. [Google Scholar] [CrossRef]
  48. Korotkikh, A.G.; Slyusarskiy, K.V.; Ditts, A.A. Kinetics of coal char gasification in a carbon dioxide medium. Russ. J. Phys. Chem. B 2016, 10, 576–581. [Google Scholar] [CrossRef]
  49. Urych, B.; Smoliński, A. Kinetics of sewage sludge pyrolysis and air gasification of its chars. Energy Fuels 2016, 30, 4869–4878. [Google Scholar] [CrossRef]
  50. Slyusarskiy, K.V.; Larionov, K.B.; Osipov, V.I.; Yankovsky, S.A.; Gubin, V.E.; Gromov, A.A. Non-isothermal kinetic study of bituminous coal and lignite conversion in air and in argon/air mixtures. Fuel 2017, 191, 383–392. [Google Scholar] [CrossRef]
  51. Zhao, B.; Xu, X.; Li, H.; Chen, X.; Zeng, F. Kinetics evaluation and thermal decomposition characteristics of co-pyrolysis of municipal sewage sludge and hazelnut shell. Bioresour. Technol. 2018, 247, 21–29. [Google Scholar] [CrossRef]
  52. Levin, A.A.; Kozlov, A.N. Verification of the stage scheme of low-grade solid fuel gasification. J. Phys. Conf. Ser. 2018, 1128, 012071. [Google Scholar] [CrossRef]
  53. Senneca, O.; Ontyd, C.; Cerciello, F.; Schiemann, M.; Scherer, V. Extension of the thermal annealing concepts developed for coal combustion to conversion of lignocellulosic biomass. Energy Fuels 2020, 34, 3661–3670. [Google Scholar] [CrossRef]
  54. Mularski, J.; Pawlak-Kruczek, H.; Modlinski, N. A review of recent studies of the CFD modelling of coal gasification in entrained flow gasifiers, covering devolatilization, gas-phase reactions, surface reactions, models and kinetics. Fuel 2020, 271, 117620. [Google Scholar] [CrossRef]
  55. Hirschfelder, J.; Curtiss, C.; Bird, R. The Molecular Theory of Gases and Liquids; Wiley: New York, NY, USA, 1954. [Google Scholar]
  56. Thiele, E.W. Relation between catalytic activity and size of particle. Ind. Eng. Chem. 1939, 31, 916–920. [Google Scholar] [CrossRef]
  57. Irfan, M.F.; Usman, M.R.; Kusakabe, K. Coal gasification in CO2 atmosphere and its kinetics since 1948: A brief review. Energy 2011, 36, 12–40. [Google Scholar] [CrossRef]
  58. Hecht, E.S.; Shaddix, C.R.; Molina, A.; Haynes, B.S. Effect of CO2 gasification reaction on oxy-combustion of pulverized coal char. Proc. Combust. Inst. 2011, 33, 1699–1706. [Google Scholar] [CrossRef]
  59. Veca, E.; Adrover, A. Isothermal kinetics of char-coal gasification with pure CO2. Fuel 2014, 123, 151–157. [Google Scholar] [CrossRef]
  60. López-González, D.; Fernandez-Lopez, M.; Valverde, J.; Sanchez-Silva, L. Gasification of lignocellulosic biomass char obtained from pyrolysis: Kinetic and evolved gas analyses. Energy 2014, 71, 456–467. [Google Scholar] [CrossRef]
  61. Cortazar, M.; Lopez, G.; Alvarez, J.; Arregi, A.; Amutio, M.; Bilbao, J.; Olazar, M. Experimental study and modeling of biomass char gasification kinetics in a novel thermogravimetric flow reactor. Chem. Eng. J. 2020, 396, 125200. [Google Scholar] [CrossRef]
  62. Vyazovkin, S.; Burnham, A.K.; Favergeon, L.; Koga, N.; Moukhina, E.; Pérez-Maqueda, L.A.; Sbirrazzuoli, N. ICTAC Kinetics Committee recommendations for analysis of multi-step kinetics. Thermochim. Acta 2020, 689, 178597. [Google Scholar] [CrossRef]
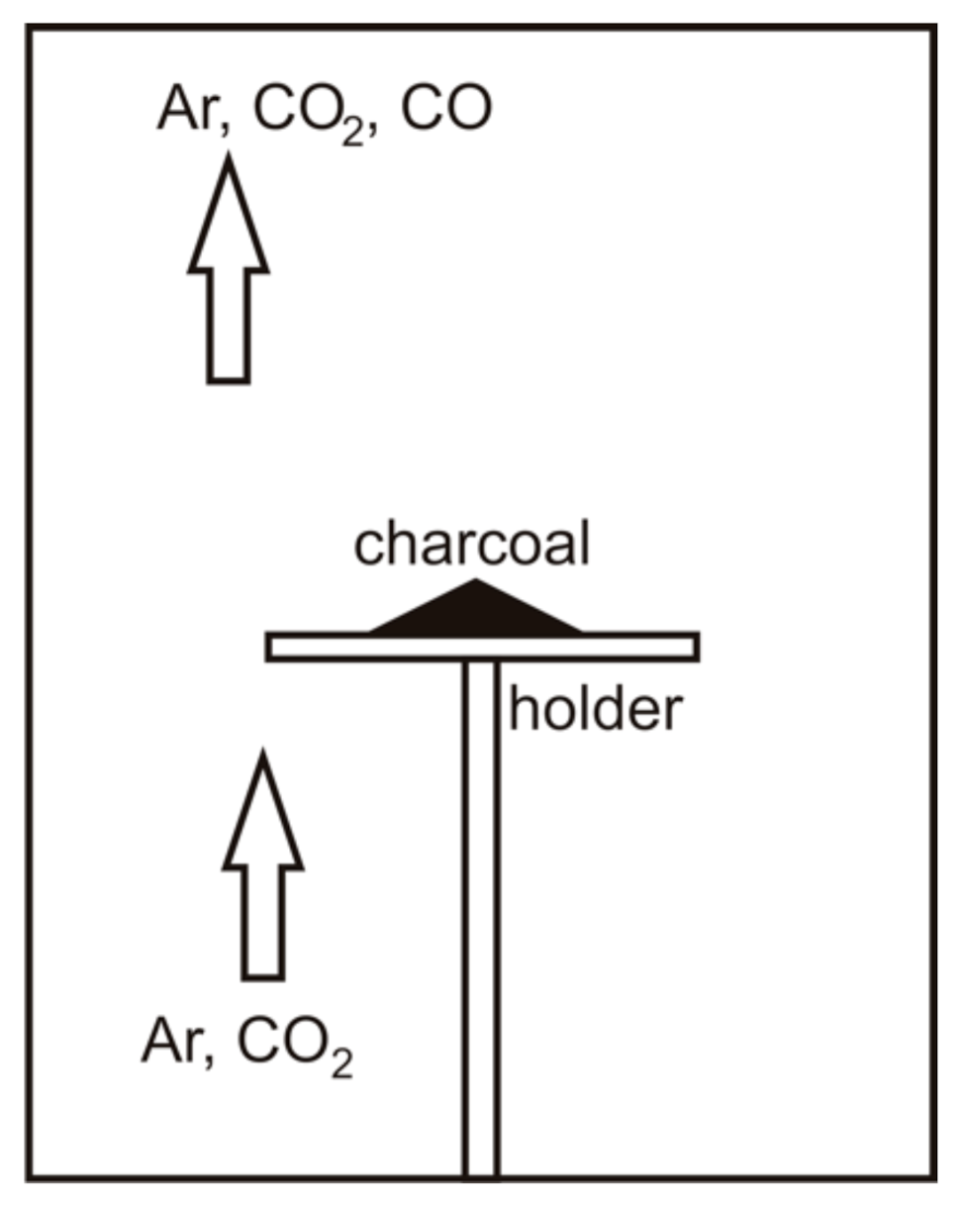
Figure 1. Scheme of thermogravimetric experiment.
Energies 14 01886 g001
Figure 2. Schematic dependence of the behavior of TG-curves on the heating rate.
Energies 14 01886 g002
Figure 3. TG curves for charcoal gasification in the carbon dioxide atmosphere at different heating rates (1, 5, 10, 20, and 50 K min−1).
Energies 14 01886 g003
Figure 4. Results of processing of the TG curve of charcoal gasification at a heating rate of 10 K min−1 using the equation of diffusion (a) and pore-diffusion kinetics (b).
Energies 14 01886 g004
Figure 5. The results of processing of the TG curve of charcoal gasification at a heating rate of 10 K min−1 using Equation (2) with different exponents: (a) n = 0; (b) n = 1; (c) n = 2/3; (d) n = 0.5; (e) n = 2; (f) n = 4.
Energies 14 01886 g005
Figure 6. Results of processing of charcoal gasification TG curve at a heating rate of 1 K min−1 by different models: (a) n = 0; (b) n = 0.5; (c) n = 2/3; (d) n = 1; (e) diffusion model; (f) pore-diffusion model.
Energies 14 01886 g006
Figure 7. Results of processing of the charcoal gasification TG curve at a heating rate of 5 K min−1 by different models: (a) n = 0; (b) n = 0.5; (c) n = 2/3; (d) n = 1; (e) diffusion model; (f) pore-diffusion model.
Energies 14 01886 g007
Figure 8. Results of processing of the charcoal gasification TG curve at a heating rate of 20 K min−1 by different models: (a) n = 0; (b) n = 0.5; (c) n = 2/3; (d) n = 1; (e) diffusion model; (f) pore-diffusion model.
Energies 14 01886 g008
Figure 9. Results of processing of the charcoal gasification TG curve at a heating rate of 50 K min−1 by different models: (a) n = 0; (b) n = 0.5; (c) n = 2/3; (d) n = 1; (e) diffusion model; (f) pore-diffusion model.
Energies 14 01886 g009
Table 1. Technical specifications of raw wood and charcoal.
Technical Characteristics (% wt., Dry Basis)PineCharcoal
Fixed carbon10.2358.72
Ash content0.171.99
Volatile yield89.639.29
Elemental composition (% wt., dry ash-free basis)
C46.6079.84
H6.325.79
O47.0814.37
Brutto-formulaCH1.62O0.76CH0.46O0.14
Table 2. Activation energy values of reaction C + CO2 (kJ mol−1) based on the results of TG curves processing.
Model (Expression)Heating Rate, K min−1
15102050
n = 0 (2)118.46104.64106.3696.4680.46
n = 1/2 (2)157.84116.99118.04118.49108.14
n = 2/3 (2)170.97121.11121.93125.84117.37
n = 1 (2)197.23129.34129.72140.53135.83
n = 2 (2)187.59154.03153.08184.60191.20
Z (6)236.92209.28212.71192.92160.92
Publisher’s Note: MDPI stays neutral with regard to jurisdictional claims in published maps and institutional affiliations.