1. Introduction
By aiming for a significant reduction of greenhouse gas emissions, the signing parties of the Paris Climate Agreement have laid the contractual foundation for decarbonizing our society. Based on the national commitments towards the “well below 2 °C” target, the signing parties formulated measures to reach the envisaged global CO
2 emission reduction and to corroborate the first climate agreement on a fully global scale. Consequently, together with the Clean Energy Package (CEP), the first national energy and climate plans were introduced on a pan-European level. The latter defined for the first time legally binding targets, specifically for 2030 a 40% greenhouse gas emissions reduction relative to 1990, an overall renewable energy share of 32% and an interconnection target for electricity markets of 15% [
1].
In case of the electricity sector, the revised climate goals imply that the already elevated share of generation from renewable energy sources (RES) has to increase further at the expense of a decreasing share of fossil-fueled generation. Due to the inherently unprogrammable nature of most RES, like solar and wind, electricity markets (EM) face an increasing volatility and need for balancing from ancillary service markets (ASM). Until now, ASMs have been dominated by conventional fossil-based generation capacity. Since such emission-intensive generation capacity is being phased out, ASMs are already noting a growing scarcity. In Italy, the reserve capacity margin at peak load decreased from 25 GW in 2012 to 7 GW in 2017 [
2]. In line with the increasing scarcity, the costs for addressing the balancing needs skyrocketed, so that 1.27 billion € had to be spent for congestion management in 2017 at European level in 2017. According to the European Network of Transmission System Operators for Electricity (ENTSO-E), this represents an increase of 25% compared to 2015 [
3].
The combination of a changing generation portfolio, an increasing need for ancillary services (AS) and the scarcity of adequate generation capacity for ASMs call for new flexibility sources to ensure long-term resource adequacy and security supply [
4]. Given that the energy transition is not only characterized by decarbonization and decentralization but also fostered by digitalization, a group of previously untapped resources might be able to provide ancillary services [
5]. Targeting the flexibility of rather small and decentralized resources, the CEP fosters the concept of end-user aggregation. Such aggregation combines multiple small units to one large unit through a so-called virtual power plant [
6]. Through the aggregated dimension, they can potentially participate on EMs and ASMs that each individual unit by itself would not be able to access. This unlocks additional revenue streams for operators of such decentralized energy resources (DERs) and allows grid operators to make use of distributed ASs. Virtual aggregation of DERs might therefore become an essential building block for an effective energy transition and an increasing integration of RES [
7].
The concept of virtual aggregation is progressively introduced at pan-European level and transposed into specific market designs at the individual member state level. The Italian large-scale pilot project UVAM (Unità Virtuali Abilitate Miste, i.e., virtually aggregated mixed units), fully operational since January 2019, is one of the biggest pilots in Europe to serve this purpose. The very heterogeneous pool of new players that enter the market makes the creation of an even playing field for the aggregated units highly complex. Specific details of the market design can have a decisive impact and could lead to either positive and negative market developments [
8]. This paper therefore aims to critically review and map the Italian UVAM project around two years after entering in full operation. We analyze implications of the project’s auction scheme for capacity assignment and subsequent market interactions based on empirical data for both individual units as well as the project as a whole. By identifying weaknesses and strengths of the chosen design elements, this analysis contributed to the understanding of end-user aggregation. To the best of our knowledge, this is the first full-scale analysis for the market integration of 1 GW of distributed flexibility over such an extensive timeframe. The study covers the 18 months period from January 2019 to June 2020, including the first months of the coronavirus disease 2019 (COVID-19) pandemic. These months were characterized by a lower electricity consumption while the feed-in from renewable energies remained constant, thus providing additional insights with regard to high RES share scenarios. The detailed analysis presented in the following can therefore serve as input for future work on electricity market design and electricity market modeling. Our findings can support policy- and decision-makers to evaluate the flexibility potential of distributed resources.
The remainder of the paper is structured as follows:
Section 2 outlines the European regulatory framework for virtual aggregation and flexibility provision from DERs and its role for several pilot projects and selected market reforms. Building upon that,
Section 3 describes the Italian transposition of the European framework in the UVAM pilot project, highlighting specific technical requirements and legislative boundary conditions.
Section 4 describes the collected data and introduces the methodology for the detailed analysis and mapping of the UVAM project.
Section 5 presents the respective results at individual operator and market level.
Section 6 discusses the resulting controversies with respective policy implications. The main findings are summarized in
Section 7.
2. The European Framework
The UVAM project is part of a broader paradigm shift towards distributed resources and their market access at the European level. As the new European energy regulation framework, the CEP was presented by the European Council in 2018 and approved by the European Parliament in early 2019. Out of the eight legislative packages, the Renewable Energy Directive 2018/2001 [
9], the Electricity Regulation 2019/943 [
10], and the Electricity Directive 2019/944 [
11] cover the concept of (end-user) aggregation and flexibility provision from DERs.
The new framework entitles final consumers inter alia to:
act as active consumers (2019/944, Article 15.1) and specifically become renewable self-consumers (2018/2001, Article 21);
to aggregate (2019/944, Article 13);
to sell self-generated electricity and participate in flexibility schemes (2019/944, Article 15.2).
Aggregation is thereby defined as “a function performed by a natural or legal person who combines multiple customer loads or generated electricity for sale, purchase or auction in any electricity market” [
11]. As such, not only aggregated generation but also Demand Response (DR) by final consumers with an estimated potential between 50 to 100 GW in Europe is entitled to participate in all EMs (2019/944, Article 17). Moreover, member states are requested to ensure that both transmission system operators (TSOs) and distribution system operators (DSOs) consider DR through aggregation in a non-discriminative manner when procuring flexibility [
12,
13,
14].
Additionally, it is stated that member states shall provide the necessary regulatory framework and dedicated incentives for the use of flexibility in distribution networks (2019/944, Article 32). This implies the provision of decentralized flexibility services, given that traditional ASs are connected at the central transmission level and, therefore, by definition unable to deliver specific local services at the distribution level. This represents a paradigm shift for DSOs. In contrast to their rather passive role, they will become active system operators. As such, they would have to procure flexibility, either from still to be established local flexibility markets or through the already existing central flexibility markets. In the latter case, the central flexibility markets would have to integrate the decentral flexibility resources by preserving their locational information so that DSOs could still procure specific local ASs [
15]. Different market designs for local flexibility markets are currently piloted in different European member states. Since the UVAM project is part of such new market designs, the following two subsections provide an overview of the main ongoing pilot projects related to decentralized flexibility at the European level and reflect on general policy decisions implemented in major European markets.
2.1. Pilot Projects in the European Context
Several pilot projects have been implemented at distribution and transmission level in different EU member states in order to study end-user aggregation and active participation of DERs in network management as defined by the CEP. The essential characteristics of the main projects at the European level that aim to enable flexibility provision and market integration from distributed resources are briefly discussed and compared in the following. This allows contextualizing framework conditions of the UVAM project.
One of the key differences between the projects is their geographic scope, with projects targeting either national (or even cross-border) level or aiming at a local scale. Among the first type of projects we can find:
EU-SysFlex, a project that aims at creating a common marketplace for all frequency and congestion management products jointly procured by TSO and DSO [
16];
CoordiNet, a project that aims at creating a common TSO-DSO market on a national level [
17,
18];
the Dutch
GOPACS project that enables distributed resources to participate in the national EM [
15];
FutureFlow, a project that aims at investigating a cross-border AS market [
19].
Projects with a more local scope include:
Dominoes that aims at establishing a peer-to-peer (P2P) based local market [
20];
Enera project, a local platform where TSOs can purchase flexibility to avoid wind curtailment [
15];
FEVER project, aiming inter alia on DSO–DSO flexibility trade through local flexibility markets as well as peer-to-peer solutions for flexibility trade amongst local agents [
21];
GoFlex that aims at creating a market platform for the effective use of flexibility at the distribution level [
22];
InterFlex, a DSO focused project to address distribution contingencies [
23,
24];
NODES, a Norwegian project to procure flexibility for the DSO [
15];
Piclo Flex, an independent platform for DSOs to tender specific locational flexibility needs, which can be met by small-scale generators, active consumers and or aggregators [
15].
According to the project’s scope, the AS products provided may range from TSO services such as frequency control, voltage control and congestion management to DSO-related services such as local congestion management, voltage support, increased network hosting capacity and peak shaving. Some of the projects introduce aggregators to the EM. This is done by enquiring standard products similar to intra-day bids for the adjustment of injection/withdrawal programs, in order to actively solve balancing responsible party (BRP) imbalances on an EM market-level instead of passively solving it through subsequent balancing markets (BM) (see [
15]). In other cases, no predetermined standard products for new entrants such as prosumers or aggregators are designed. This means that they can design their own offers based on a range of given parameters. In this way specific and tailored services (e.g., custom time slots, location, generation source) can be offered and eventually valued, such as in the NODES project [
15]. The technical scope is another differentiating factor across all pilot projects. Some of them focus on the physical level, e.g., proposing practical solutions to overcome possible TSO–DSO coordination problems [
16,
19,
24]. Others aim to create an operative trading platform within the market [
15,
20].
Table 1 provides a comparative but non-exhaustive overview of key characteristics of the respective projects. The Italian UVAM project is included in the overview, with detailed project explanation following in
Section 3.
All these projects aim to create a technology-neutral framework, which permits all participants, be they prosumers, aggregators or DERs, to participate and develop their own business case. However, given the complexity arising from a large number of differing actors being involved in this process, namely network operators, market operators, aggregators and research institutions, in most cases pilot projects are implemented in a closed sandbox environment. As such, most of them do not aim for a full integration into national markets. Additional to projects addressing DERs and aggregators’ market integration, several other projects explore technologies that enable distributed flexibility, such as DA/RE, DELTA, and inteGRIDy projects [
37,
38,
39].
2.2. Market Reforms in the European Context
Independent from the implementation of pilot projects, European market designs are evolving in order to allow for the integration of more flexibility and ancillary services from DERs. Above all, markets moved closer to real-time trading with shorter product durations, smaller bid sizes and increasing integration of DR as well as virtually aggregated units. France was among the first to introduce amendments based on the publication of the CEP, moving the procurement of frequency containment reserve (FCR) from a weekly to a daily basis in July 2019. Notable is also the comparably small product resolution for the automatic frequency restoration reserve (aFRR) of only 30 min. The minimum bid size for FCR and aFRR is already at 1 MW, while as of now only the manual frequency restoration reserve (mFRR) remains at 10 MW. Enabling non-symmetrical aFRR and mFRR bids, the French BM allows for effective participation of DR and DERs. Shortcomings remain that DR is practically excluded from aFRR since it is obligatory for large-scale generators and also the min bid size of 10 MW for mFRR represents still a notable obstacle. Virtual aggregation of smaller units to participate in the ASM is allowed, aggregation of demand and generation in the same pool, however, is not allowed [
40,
41].
Similar to France, also Germany reduced timeframes for AS tendering gradually with FCR tendering changing from weekly to daily resolution in July 2019, which was further reduced to four-hour products in July 2020. In line with that, mFRR products are tendered daily with a four-hour resolution, although aFRR remains with 24 h resolution. The minimum bid size is 1 MW for FCR and 5 MW for aFRR and mFRR, but given special conditions, 1 MW can participate in aFRR and mFRR as well [
42]. Only the products category of FCR is symmetrical and virtual aggregation of generation and demand is allowed. Notably, all balancing services are open to all market participants and all technologies, as long as they fulfill the technical requirements [
43]. Battery storage systems are therefore mainly active in FCR and also intermittent RES (e.g., wind turbines) participate in negative mFRR [
40,
44].
Another market with advanced adoption of CEP provisions is Great Britain. Previously criticized for its complex product and market structure, the TSO National Grid started modifying some of its balancing product categories to streamline and standardize the manifold products [
40]. Firm frequency response (as FCR equivalent) is mainly tendered on a monthly basis but started weekly tendering trials in June 2019. The procurement of the product category called “Fast Reserve” (as aFRR equivalent) was suspended in January 2020 as its monthly tendering did not comply with CEP regulations and the National Grid considered the switch to day-ahead procurement as unsuitable [
45]. The procurement of the short-term operating reserve (as equivalent to mFRR), on the contrary, was modified and moved to a shorter timeframe closer to real-time, i.e., on a 24 h basis at day-ahead [
46]. Minimum bid sizes for FCR and mFRR are 1 MW and 3 MW, respectively. Virtual aggregation is allowed for specific product categories such as mFRR [
40,
41].
In Spain, providing FCR services is mandatory for large generation plants and not remunerated. aFRR and mFRR, on the contrary, are contracted through a market approach on a day-ahead basis [
40,
41]. Since 2019 the minimum bid size has been reduced from previously 10 MW to 1 MW. Non-programmable RESs are nowadays eligible to provide aFRR, mFRR and restoration reserve (RR) [
47]. Demand is excepted to become eligible for RR from early 2021. Aggregation of generation is already allowed, however, only for the same technology. Demand-side aggregation is expected to be permitted by early 2021 [
18].
Like Spain, the Italian market used to be a relatively closed market concerning balancing services with a central dispatching approach and a strongly proactive TSO. Still considered to be one of the least opened ASMs in Europe in 2018, by effectively not allowing DER participation with capacities below 10 MW in ASM [
40], significant market design changes have been introduced over the last years. The following section recaps the Italian market transition and the development of a nation-wide framework for the participation of prosumers (and aggregates of such) in the ASM through the UVAM pilot project.
3. The Italian Framework
Despite multiple liberalization reforms and unbundling, the Italian market remains highly regulated and rigid in many regards. The Italian peninsula’s geography, narrow and with orographic obstacles, has been a challenge for the development of the national transmission network, which to this day often faces congestions and security concerns, especially in the southern area. To overcome these issues, the legislator designed an EM tailored to the network’s technical needs, establishing strict rules and opting for an implicit auction framework on the intra-day market. Although postponed multiple times, continuous trading through the European Cross-Border Intraday market initiative (XBID) shall accompany the implicit auctions towards the end of Q1 [
48,
49]. The aforementioned challenges also affect the operation of the ASM, which is exclusively used by the TSO to procure resources and guarantee system stability. For conventional generators market access requirements are among the most rigid in Europe and until recently it was among the most restricted for distributed generation (DG) and DR. Qualified conventional generators are obliged to provide primary, secondary and tertiary reserve (i.e., FCR, aFRR, mFRR and RR in ENTSO-E terminology), while the fundamental requirement to participate in the current ASM is the qualification as a relevant production unit. Such units must be bigger than 10 MVA and not being powered by intermittent renewable sources. This excludes both DG and DR of all those small and medium-sized prosumers that are fundamental in the energy transition.
Consequently, a decisive redesign is needed to meet the requirements set by the CEP. This motivated the Italian regulator ARERA (Autorità di Regolazione per Energia Reti e Ambiente) to publish a resolution in 2017 which asks the TSO Terna to design innovative pilot projects [
50]. The main objective of these projects is to gather insights about useful elements and experience, which could serve as the basis for comprehensive market reforms. These reforms aim to involve DG and DR in the ASM and to achieve greater integration of RESs into the network without compromising the principle of technological neutrality. Having said this, the findings of the large-scale Italian pilot projects do not only provide insights for the upcoming Italian market reforms, but at the same time can serve as points of reference for policy-makers around the world.
The first UVA project (Unità Virtuale Abilitata, i.e., enabled virtual unit) to be implemented was the UVAC project (Unità Virtuali Abilitate di Consumo, i.e., enabled virtual consumption units) in June 2017 [
51]. Through the project, consumption units could aggregate into clusters. For this project, the virtual unit’s minimum size was reduced from 10 MW to 1 MW, allowing small-sized operators’ participation. Contracted services were the so-called tertiary reserve (mFRR and RR in ENTSO-E terminology) as well as balancing service.
The second project, launched in November 2017, was the UVAP (Unità Virtuali Abilitate di Produzione, i.e., enabled virtual production units) project [
52]. This project aimed at clustering production sites to provide the same services such as UVACs plus congestion management service.
In November 2018, the UVAC and UVAP projects finally converged in the UVAM (Unità Virtuali Abilitate Miste, i.e., mixed enabled virtual units) project [
53]. This third and final project aims to enable the ASM participation as virtual aggregates of consumption and distributed generation units as well as storage systems. For the sake of simplicity, such virtually aggregated units are always called “UVAMs” from now on. “UVAM project” is used instead to refer to the project as a whole.
The perimeter of individual UVAMs was initially defined by the TSO on a provincial or regional basis, without considering the electricity grid’s physical characteristics. Moreover, the UVAM is operated by a BSP (balancing service provider), which participates with the virtual unit in the ASM. For the participation in the EMs such as day-ahead and intraday market, however, individual consumption or production units within the virtual aggregate continue to belong to BRPs. Within this framework, and in line with respective European regulation, BRP and BSP therefore may or may not coincide for a virtually aggregated unit [
54]. While only one BSP will operate each such virtual unit on the ASM, potentially multiple BRPs might manage the EM operation of individual load or generation units belonging to the aggregate. This leads to a number of difficulties regarding their management and remuneration, as criticized by operators [
55]. Initially BSPs needed the permission of every BRP for individual units joining the virtual aggregate. However, this has been overturned by the regulator to BSPs now simply notifying BRPs about individual units’ participation [
56]. UVAMs must have at least 1 MW of scalable capacity (both upward and or downward) providing the same services as UVAPs: mFRR, RR, balancing services and services for congestion management. The aggregates’ minimum size is the result of a reform process that aims at enabling the participation of smaller-sized operators. Decided by the Italian authority, it started from 10 MW in 2017 and reached 1 MW as of today. For the future, there is a proposal to further reduce the minimum capacity to 0.2 MW [
57]. For the sake of simplicity and since all four products are traded as one single product on the Italian ASM, we refer to the sum of these products as balancing services (BS) in the following. Units are generally distinguished as contracted and non-contracted UVAMs. The distinction is based on the two potential remuneration mechanisms:
a pay as bid mechanism for activation, i.e., the standard remuneration derived from ASM;
an additional (temporary) tender mechanism.
Non-contracted UVAMs are eligible only for the first remuneration mechanism and operators are free to place as many or few offers as they like on the ASM. Contracted UVAMs, on the other hand, are eligible for both remuneration mechanisms, but they have more stringent constraints regarding offer commitments. In this case, bids for upward balancing are mandatory with the UVAMs full capacity for at least 2 or 4 consecutive hours in the range between 14.00 and 20.00 every day from Monday to Friday. In general, activation needs to occur within 15 min and is monitored in intervals of 60 or 4 s depending on the units’ size. Additionally, to be eligible as a contracted UVAM, each virtual unit needs to consist of at least 50% of programmable capacity, be it on the generation or consumption side. The actual composition of each virtual unit is up to the aggregator (i.e., BSP), who is at the same time also responsible for guaranteeing the units’ availability for the obligatory bids. The resulting payments for operators are then defined as:
a variable activation payment equal to the price offered by the operator of the UVAM in the ASM (with a price cap of 400 €/MWh), recognized only in the event of acceptance of the bid on the ASM and limited to the quantities awarded;
a fixed availability payment set in a pay-as-bid downward auction with a price cap placed at either 15,000 €/MW/year or 30,000 €/MW/year in case units qualify as contracted UVAMs.
The implemented auction scheme consists of one auction per year with annual duration products, three interim auctions with “multi-month” products and finally 12 monthly auctions. The total amount of capacity to be procured and integrated by the TSO shall amount to 1000 MW, making it one of the most ambitious projects of BS provision from DER in Europe.
4. Materials and Methods
In order to evaluate the outcomes of the ongoing UVAM project and analyze its effectiveness in terms of improving the integration of virtual aggregated units and aggregators in general in the ASM, a methodology for the analysis of public data is described in the following. Two different data sources have been selected, namely the results of the auction for capacity allocation and the outcomes of the Italian ASM clearing.
Concerning the capacity auction, the quantities (expressed in MW) assigned to each operator and the weighted average price awarded through the pay-as-bid auction are published by the TSO Terna on its website [
36]. By using this data, it is possible to monitor the amount of capacity allocated to aggregators in the different contracted periods and study their response to the incentive scheme. The Italian market operator GME (Gestore dei Mercati Energetici) publishes the outcomes of ASM clearing for each day (i.e., 24 hourly periods) the complete set of energy bids submitted (both accepted and rejected) by operators in the Italian ASM along with respective data from the EM [
58].
Unlike capacity data, UVAM energy bids are not immediately accessible but require extensive data manipulation. First, published market data is subdivided into EM results, MSD ex-ante results (Mercato dei Servizi di Dispacciamento ex-ante, i.e., the Italian day-ahead ASM, for scheduling purposes) and MB results (Mercato del Bilanciamento, i.e., the Italian near-real-time ASM, for balancing purposes). Since UVAMs can participate in both ASMs, the amount of offered/accepted quantity is computed as the sum of the two individual results for each hour. Moreover, since the raw dataset also contains “revoked” offers withdrawn by the operators, such offers need to be removed. The market results are published in daily datasets, each consisting of 24 hourly intervals, including different offered products such as: aFRR, start-up, and the product named “other services” that includes RR, congestion management and balancing services. This last product is further characterized by five different steps of offer (called “AS”, “GR1”, “GR2”, “GR3”, “GR4”), in ascending offered price order. For this study, the daily datasets under investigation, from 1 November 2018 to 30 June 2020, are aggregated in a single database containing all relevant days. At the same time, the analysis focuses exclusively on the product “other services”, as this is the only product aggregators can offer with UVAM units. The five offering steps within the same product category are kept separate since the ASM is operated under the pay-as-bid principle. Yet, the resulting dataset does not explicitly indicate the offers submitted by UVAM units compared to other operators’ offers. In the data preparation process, these offers are obtained by comparing market data from periods prior to the start of the pilot project (new units appeared in the daily datasets after 1 November 2018 when UVAM units were allowed in the market) and by analyzing the offer patterns of these agents (UVAMs tend to follow a peculiar and defined pattern, as discussed in
Section 5.3). By filtering market data in this way, a recurring labeling is recognizable at most of the remaining offers, which helps to understand the market operator’s categorization to list UVAM offers. This finding is supported by the fair correspondence of the resulting ASM quantities with those assigned through capacity auction, as well as by the fact that the identified units almost never bid higher than the price cap of 400 €/MWh during the obligatory hours as required by one of the criteria for the incentive recognition.
Once the complete dataset is obtained, it is possible to analyze individual UVAM performances with respect to the total market offers
t. Four parameters characterize each offer: the Italian market zone that the unit belongs to
z = {
north,
cnorth,
csouth,
south,
sicily,
sardinia}, the balancing direction (upward or downward) of the offer
u = {
up,
down}, the price step
g = {
AS,
GR1,
GR2,
GR3,
GR4}, the time interval (hour) in which the offer was submitted
h = {1, 2, 3, …,
H} (where
H represents the total number of intervals in the considered period). At this stage, the different products traded by each UVAM, characterized by quantity
and price
, are computed to obtain both, the overall quantity offered in each hour:
and the weighted average price (with respect to the previously mentioned five offer steps
g):
Along with the analysis of individual UVAM behavior, a global analysis of market results concerning the aggregators is possible by computing the global offered quantity and weighted average price, in each hour and for each balancing direction:
In
Figure 1, the workflow described in this section is depicted starting from raw market data to the individual and global analysis of UVAM performances. In the following section, the data preparation methodology outcomes are used to perform an in-depth investigation of aggregators’ behavior.
5. Results
To elaborate the UVAM project’s evolution with a holistic approach, the study is systematically divided into four quadrants as highlighted in
Figure 2. As a first focus of analysis, the auction results for contracted UVAMs are compiled. They are therefore evaluated both on a global project level as well as on an individual operator level, constituting the capacity level of the pilot project and therewith the first two parts of the analysis. Subsequently, the actual ASM participation of individual UVAM units as well as by the overall project as a whole is studied. Thereby the energy level of the pilot is depicted in the third and fourth part of the analysis.
5.1. Analysis Part 1: Project’s Auction Development
Since the beginning of the UVAM auctions in January 2019, the participating capacity grew steadily. Out of the 1000 MW put out for tender, approximately 350 MW were contracted immediately through the initial annual auction (blue-toned bars in
Figure 3). The first multi-month auction contracted around 165 MW for the period from April to December (green-toned bars), the second multi-months auction another 285 MW for the period from July to December (yellow-toned bars) and the third multi-months auction another 145 MW for the period from October to December (grey-toned bars). On top of these relatively long-term auctions, the monthly auctions additionally provided between 45 and 185 MW (red-toned bars). The assigned capacities are differentiated based on their geographic distribution, being in the north (so-called zone A) or the south of Italy (so-called zone B). The overall capacity was, thereby, split into 800 MW for the North and 200 MW for the South. Starting from May, some contracts for assigned capacities from auctions have been revoked without further specification, summing up to 78 MW in December (bars with dashed black line). As mentioned previously, besides these contracted UVAMs also the non-contracted UVAMs exist, whose overall capacity varied during the first six months of 2019 with decreasing tendency between 200 and 150 MW.
While the total capacity is continuously rising, the initial target of 1000 MW of contracted capacity has been missed narrowly due to revoked quantities in 2019. With the end of December 2019, all auctions’ contract duration expired and the entire capacity was put out again as new tenders for 2020. Thanks to additional units being qualified in the meantime, the auctions completely filled up for the first time in Zone A. Also in Zone B 191.4 MW out of the 200 MW were assigned immediately through the new annual auctions. The remaining 8.6 MW were then first assigned to monthly auctions and then eventually assigned through the first round of multi-months auctions from April to December 2020.
Given that in 2019 individual auction volumes were never fully utilized, the resulting auctions’ clearing price initially remained relatively close to the price cap of 30,000 €/MW/year.
Figure 4 shows the allocated capacity versus the assigned capacity in the monthly auctions of 2019 for Zone A (left chart) and B (right chart), respectively, as well as the corresponding average clearing price. The auction volume made available by the TSO for the monthly auctions decreases every time a new multi-month auction assigns additional capacity until the end of the year. With the envisaged overall target of 1000 MW, the difference between the allocated and assigned capacity of the monthly auctions can be interpreted as the missing capacity to reach the target. Revoked contracts are visible especially from August onwards as additional capacity made available through monthly auctions to refill the gap in overall quantity. First, modest signs of perceived competition can be noted from July, with the weighted average clearing price no longer being 30,000 €/MW and starting to decrease. In December 2019 it reached 29,007 €/MW/for Zone A and 29,469 €/MW/year for Zone B, before dropping more significantly to 26,122 €/MW and 28,745 €/MW for the new annual auctions in January 2020. The last 8.6 MW being contracted in April for Zone B reached a clearing price as low as 18,841 €/MW. Overall spending on capacity assignments for UVAMs amounted to approximately 21.6 million € in 2019 and 26 million € in 2020.
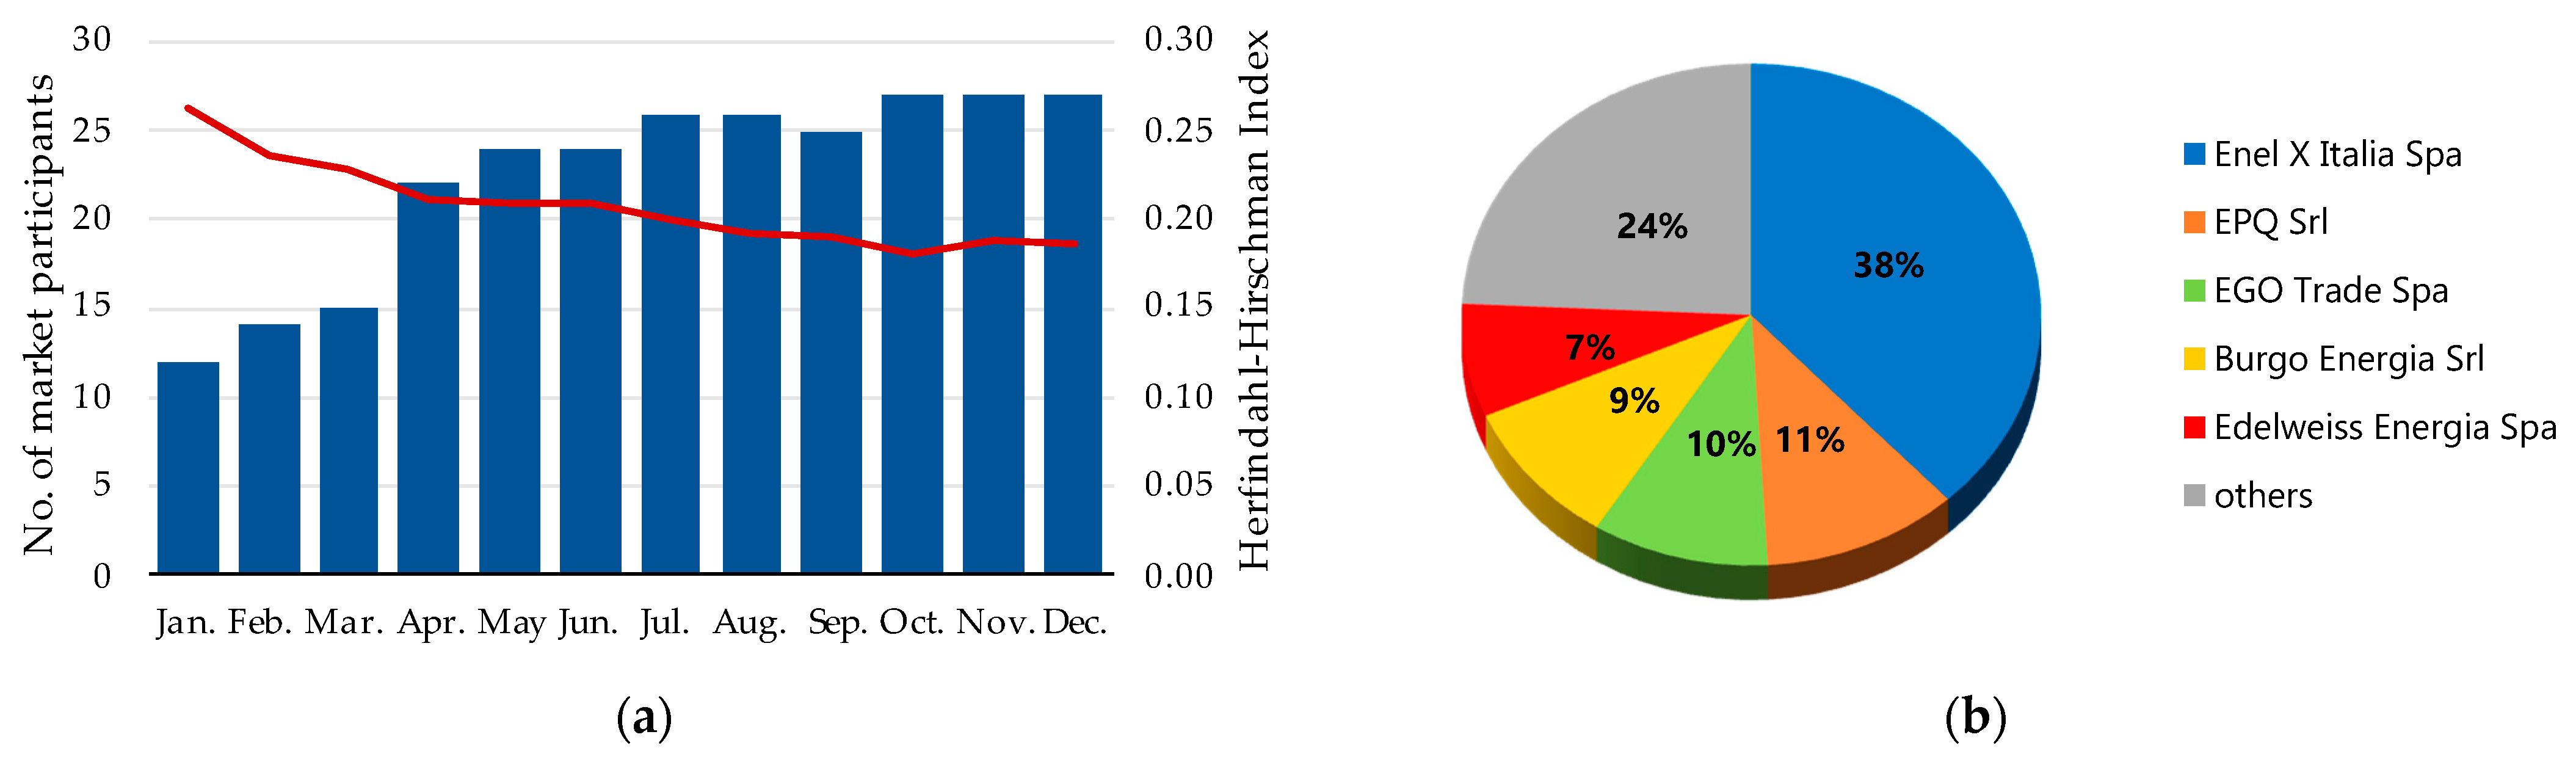
Besides the increase in capacity under the auction scheme, also the number of participating companies in the pilot project rose from an initial 12 in January 2019 to 27 in December 2019, as reported in
Figure 5a. To quantify the auction scheme’s market concentration, the commonly used the Herfindahl–Hirschman index (HHI) as the sum of squared market shares per firm is calculated. Empirical literature usually follows primary definition through the Horizontal Mergers Guidelines by the US Department of Justice as well as the Federal Energy Regulatory Commission, according to which values below 0.1 indicate unconcentrated markets, whereas values below 0.1 and 0.18 indicate moderately concentrated markets and values above 0.18 highly concentrated markets [
59,
60,
61,
62]. Slightly deferring from this definition, the European Commission sets the lower level for high concentration to 0.2 [
63]. Over the course of the first year of implementation, the market concentration in the UVAM project eventually decreased from a highly concentrated market with an HHI value of 0.26 towards a moderately concentrated market with an HHI value of 0.19. Compared to that, the HHI of gross electricity generation in Italy equaled 0.05 in 2019 [
64].
Another measure to analyze market power is the concentration ratio (CR) as the n largest actors’ market share [
60]. For EU practices, a CR
3 value (representing the concentration ratio for the three largest operators) between 40% and 70% indicates a medium concentrated market, whereas any higher value indicates a strongly concentrated market [
62]. Taking the UVAM project shares from December 2019, the calculated concentration ratio of CR
3 = 0.59, similar to the HHI value, indicates an evident market concentration in the UVAM project, compared to a CR
3 value of 0.33 for net electricity generation in Italy in 2019 [
64]. Most of the UVAM operators participate with a comparably small capacity (16 out of 27 with 10 MW or less overall) and similar to the Italian electricity market in terms of net generation, the UVAM project is dominated by five operators with more than 5% of market share as of December 2019. The ranking is headed by Enel X, a subsidiary of the former Italian incumbent Enel. Respective market shares in the contracted UVAM auctions are reported in
Figure 5b.
5.2. Analysis Part 2: Individual Operator’s Auction Behavior
Besides the overall auction development, single companies’ evolution has been elaborated to highlight individual business strategies and developments.
Figure 6 illustrates the exemplary participation in different auction types for the three companies Edelweiss Spa, EGO Trade Spa and Enel X Italia Spa. First of all, it can be seen how the overall offered and assigned capacity per company grows step by step. Considering that auction volumes never were filled utilized, all eligible offers were accepted by default and the assigned capacity equals the offered capacity by each company. The stepwise increase in capacity therefore can be seen as a measure of how the companies obtain more and more capacity ready to be admitted to the UVAM project.
Second, although the dimension of assigned capacities varies up to an order of magnitude between the companies, one significant behavioral pattern can be noted across all three companies. They all exploit the multi-month auctions as much as possible, while using the single monthly auctions as a buffer until the next multi-month auction starts. This is specifically visible for Edelweiss Energia Spa at the transition from March to April, swapping the entire former monthly capacity (red bars in
Figure 6) into the multi-month capacity from April to December (green bars). The other two operators act similarly at the beginning of the new multi-month auction from July to December (yellow bars). This happens presumably against the background that market participants are aware that the TSO’s capacity target has been almost reached and that in such a case, auctions would no longer be accepted by default. Such behavior can, therefore, be interpreted as a hedging strategy towards expected competition and decreasing prices.
5.3. Analysis Part 3: Individual UVAM Unit’s Ancillary Service Markets (ASM) Participation
As described in
Section 3, the fixed availability payment allocated through the previously described auctions is only one part of the potential double remuneration mechanism for each UVAM. The second is the variable activation payment which can be obtained through successful participation in the ASM. Only with an offer being more competitive than others on the market, be it by price or locational advantage, is the UVAM asked to provide flexibility and subsequently receives the corresponding payment.
Figure 7 illustrates the ASM participation of four aggregated units with offered upward services (chart above) and offered downward services (chart below) during one representative week of June 2019, starting from Sunday 9 June 2019 to Saturday 16 June 2019. The characteristic differences in offering strategies of the respective UVAMs are clearly recognizable, differing by hour and weekday. The patterns are shown exemplarily for the four units but are found in a majority of UVAM units as shown later.
While some units like UVAM 1 (green colored in figure) and UVAM 2 (yellow-colored in figure) offer a constant quantity of upward services, other UVAMs such as UVAMs 3 and 4 (blue and red-colored respectively in figure) offer their nominative quantity only during obligatory hours and an insignificant quantity during other hours. Additionally, while all UVAMs offer the compulsory upward services, just a few UVAMs, such as UVAM 3, offer the optional downward services (usually then during the non-obligatory hours for upward offers).
Also concerning the offered price, different strategies are noticeable. While UVAMs 2 and 3 offer their upward services at somewhat competitive prices close to the weighted average market price, the other two offer far beyond that. UVAM 1 offers even at the general market price cap of 3000 €/MWh (i.e., the Italian value of lost load, VOLL) and only during the obligatory hours at the respective UVAM price cap of 400 €/MWh. Based on what has been observed for the exemplary UVAMs in
Figure 7, it is possible to define a set of representative strategies that allows to categorize UVAMs according to their individual behavior. Moreover, this analysis highlights the evolution of the market agents’ behavior over the project duration, representing a fundamental basis for a future simulation model. The four identified representative strategies are:
Strategy I: UVAM bids significant quantity only during obligatory hours (from 2 pm to 8 pm) and insignificant quantities otherwise (see UVAM 3 & 4);
Strategy II: UVAM bids (when bidding) a constant quantity of upward services throughout the year (see UVAM 1 & 2)
Strategy III: UVAM bids (when bidding) their service at constant price throughout the year (see UVAM 2, 3 & 4)
Strategy IV: during some time interval, UVAMs offer their service at VOLL price (see UVAM 1)
In this analysis, we cover only upward services since downward offers represent only a fraction of the overall offered quantity. Specifically, only 16 out of 208 UVAMs offered both upward and downward services in 2020 and no UVAM at all offered exclusively downward services. Moreover, the UVAM incentive scheme does not include any obligations concerning downward services and, in fact, no clear strategies are detectable in our data set. The results of the upward service analysis show multiple combinations of the aforementioned strategies, as can be seen below in
Table 2.
The upper left side of the table shows all the possible strategy combinations made by UVAMs over the course of the 18 months in the period from November 2018 to June 2020. The bottom left side shows the relative share of UVAMs that (non-exclusively) perform every single strategy during the respective years. The right side shows the relative percentage of UVAMs with the associated absolute capacity that follow (exclusively) a specific combination of strategies. At the bottom of the right side, the total maximum capacity offered by UVAMs for each year is shown, i.e., 101.72 MW in 2018, 1039.99 MW in 2019 and 1071.77 MW in 2020. Looking at the right side, it can be noted that no strategy patterns were yet pronounced in 2018 and 58.8% of UVAMs did not follow a specific combination of strategies. Among others, this was probably due to the fact that no incentive scheme with any obligations was in force, yet.
In 2019, UVAMs started adapting to the newly launched incentive scheme and built up contracted capacity throughout the year. Along with this, UVAMs tended to adopt different combinations of strategy. Most prominent are the two combinations of offering only during obligatory hours with constant price and quantity (24.8%) as well as the strategy of offering only during obligatory hours with varying quantity and price (23.9%). Overall, 70.9% of all UVAMs’ bidding strategies contain the identified strategy element I to virtually offer exclusively during the obligatory timeframe of max four hours. Out of the remaining 39.1% of UVAMs, around 3.6%, or 37 MW in absolute numbers, did offer more significant shares of their quantity also outside of the obligatory hours, but at prices close to the Italian VOLL, i.e., 3000 €/MWh. While no UVAMs offered constant quantity alone (sole strategy II) and with only 0.2%, nearly no UVAM offered constant quantity at constant prices (the combination of strategies II and III), 2.7% of UVAMs offered at constant prices (different from VOLL) with varying quantity (sole strategy III). Together with the 22.7% of UVAMs that did not follow any of the identified strategies in 2019, only around 25.6% of UVAMs participated in the ASM with a genuine bidding behavior that can be described as unaffected from the incentive scheme.
In 2020, UVAM operators were even more used to the incentive scheme and the first annual auction depleted almost all the available capacity (see
Section 5.1). Because of this, the contracted capacity of UVAMs was nearly constant throughout the six months of investigation and resulting strategy patterns were more exact. In fact, the percentage of UVAMs that did not follow a predetermined strategy as identified by this study fell to 7.6% and a majority of offers were only placed during the obligatory hours with constant price and quantity (63.2%). The share of UVAMs that only offered during the obligatory hours, independent of the then offered price or quantity, totals 88.3%. In contrast, the sum of UVAMs with a bidding behavior potentially unaffected by the incentive schemes decreased even more in 2020 and sums to only 11.0%.
5.4. Analysis Part 4: UVAM Project’s ASM Participation
Based on the individual analysis of market behavior of UVAMs, a global analysis of the performance of the entire project is feasible. Referring to the UVAM offerings on a system perspective, the two heatmaps of
Figure 8 report the overall quantity and the weighted average price of upward bids (so-called sell offers) from all UVAM units together over the course from November 2018 to June 2020, calculated from raw market data through Equations (3) and (4). As in the previous section, the analysis focuses mainly on upward offers. This particular kind of product is central to the pilot project’s design and by far the dominant service offering from UVAMs. Nonetheless, for the sake of completeness, results for the downward bids are reported in
Appendix A. To benchmark prices and quantities with accepted offers of other (non-UVAM) operators, comparable heatmaps for the overall Italian ASM are elaborated in
Appendix C.
The first and probably most striking observation is the jump in both quantity and price of upward offers starting from January 2019. Offered quantities in 2018 were negligible compared to those starting from January 2019. In particular, a distinct pattern in the new entrants’ quantity and price in the ASM can be recognized by referring to the incentive scheme. Clearly visible is how offered quantity is concentrated during the mandatory period (situated around black dashed line in the figure, for four consecutive hours in the period 2–8 pm) and kept growing since January 2019, perfectly reflecting the increasing contracted capacity discussed in
Section 5.1. The average offered price, on the other hand, is significantly higher outside the mandatory period with peaks above 1000 €/MWh, while during the compulsory period it tends to reflect the price cap imposed by the incentive scheme. The overall weighted average price of UVAM offers on a weekday varies, for example, from 570 €/MWh at 4 am to 361 €/MWh at 4 pm (i.e., during the obligatory period) in 2019. The drop of the average offered price is clearly visible from 2019 to 2020, mainly driven by the reduction of extremely high biddings close to the VOLL (see strategy IV from
Section 5.3). Another, more short-term but reoccurring drop in price can be observed during weekends for the usually obligatory set of four hours, which, however, are only regulated for working days. On weekends the price tends to be significantly more competitive, i.e., with a weighted average price of 214 €/MWh for offerings at 4 pm, whereas the effective quantity offered is substantially lower than during working days. This is due to the fact that those UVAMs who offer only during the obligatory hours, but then at a constant price (see strategies I and II from
Section 5.3), are not present here. In general, despite the overall increase of participating capacity over time, the offered capacity outside the obligatory hours increases only subtly.
To benchmark the competitiveness of UVAM offers against other ASM offers,
Figure 9 illustrates the price distribution of upward and downward offers by UVAMs (first diagram), of respectively accepted offers by UVAMs (second diagram) as well as of overall accepted upward and downward quantity within the ASM (third diagram) from 2018 to 2019 (from lighter to darker tones in the three diagrams). Offers are grouped in price intervals of 10 €/MWh and, as previously, only those balancing products are considered that UVAMs are eligible for. For the sake of simplicity, diagrams illustrate results up to the interval containing offers of 400 €/MWh. Although there are few offers with prices above this threshold (placed outside the for UVAMs obligatory timeframe), the chosen range contains 96% of all presented UVAM offers and 100% of all accepted UVAM offers.
As indicated by the blue-toned bars in
Figure 9a, upward bids of UVAM offers are not evenly spread above all price ranges but highly concentrated among few clusters. The vast majority falls in the interval of 390–400 €/MWh, with a second although much smaller cluster around 140–150 €/MWh. A third smaller accumulation of offers is identified around the broader price range of 70–100 €/MWh. A shift of clusters during the three different years in which the UVAM project is analyzed can also be identified. While for 2018 the lowest cluster was the most dominant, for 2019 and especially 2020 the offer preference shifted towards the two higher clusters. More detailed statistics on UVAM bids, in order to potentially rebuild their bidding behavior in combination with the previously identified bidding strategies, can be found in
Table A1 in the
Appendix B. Comparing offered with actually accepted UVAM quantities (
Figure 9b), it is apparent that the vast majority of accepted upward bids falls instead in the range of the third (low) price cluster from 60–90 €/MWh and only minimal quantities have been accepted outside of that. This is in line with the distribution of overall accepted offers on the Italian ASM (
Figure 9c), showing a distribution centered around 70–80 €/MWh for upward bids, slightly skewing towards higher prices. For the sake of completeness, it should also be noted that the period of major UVAM offerings coincides neither with the period of the highest amount of accepted upward services nor with the period in which offers are on average accepted at the highest prices on the ASM. While the bulk of UVAM offers falls in the obligatory period from 2 p.m. to 8 p.m. as shown before, the highest amount of accepted ASM offers is usually in the early morning or evening hours. The highest prices are recorded during night hours. More detailed numerical characteristics of accepted offers on the Italian ASM, also for a potential rebuild and modeling of market interaction, can be found in
Appendix C and
Table A2 specifically. Taking together all UVAM upward bids, only around 0.05% of offered quantity has been accepted by the TSO. This adds up to 985 MWh of upward services from UVAMs during the first 18 months since their introduction and, solely considering those products that UVAMs are eligible to deliver, their market share on the ASM in terms of accepted quantity aggregates to 0.003%.
Downward bids of UVAMs, as represented by the yellow-toned bars, are much less frequent, show a smaller price spread, and are present only in the low-price ranges with a peak at 20–30 €/MWh. The latter is the case for both offered and accepted UVAM bids with no significant shift over the projects’ time. Moreover, this price cluster is very well in line with the overall accepted offers on the ASM and can, therefore, be considered comparably competitive. More numeric details on average downward offers from UVAMs as well as average accepted offers on the Italian ASM can be found in the appendix in
Table A1 and
Table A2, respectively. Combining all UVAM downward bids, around 0.3% of offered quantity has been accepted by the TSO. This adds up to 530 MWh of downward services from UVAMs during the first 18 months since the project start and, considering only products they are eligible to deliver, the ASM share in terms of accepted quantity aggregates to 0.002%.
5.5. Special Focus: Coronavirus Disease 2019 (COVID-19) Impact
An exceptional 2020 also left its mark on the Italian energy mix with an outstanding relative share of renewable resources that challenged the Italian network. This is related to the COVID-19 crisis in 2020, resulting in less demand but constant RES contribution, eventually driving an increased amount of thermal plants out of the market. Starting with the first nationwide lockdown in mid-March, especially the month of April noted a measurable impact. While electricity demand went down by −17.2% compared to April 2019, the generation from renewable energy resources went up by +7.5% compared to April 2019, covering now 47.2% of the overall electricity demand. In detail, this RES share split into 17.0% hydro, 14.0% photovoltaic (PV), 7.4% biomass, 6.3% wind and 2.4% geothermal. Thermoelectric generation dropped at the same time by 21.4% and foreign exchange even by −67.8% [
65].
With higher RES share, the system’s volatility increased and led to an increased need of BMs, driving the accepted upward quantity on the Italian ASM up by 56% in April 2020 compared to April 2019 as well as the downward quantity up by 29% compared to April 2019. The average prices reflected the higher competition of the remaining thermal plants to remain online and went down to a weighted average of 158 €/MWh (−14% compared to April 2019) for upward services and down to 6 €/MWh (−80% compared to April 2019) for downward services. Another remarkable observation is the flattening of the price level over the course of the day, expressed by a strongly decreased spread between on-peak and off-peak prices. While in April 2019 the price difference between accepted offers at 4 am and 4 pm was 108 €/MWh on average, the same spread reduced to 23 €/MWh on average in April 2020. This reduction of the spread is not only reflected in the convergence of the weighted average price but also in a significant decrease of the variance of individual accepted offers. For more details, please see
Table A2 in the
Appendix C.
The reduced presence of traditional balancing resources in combination with an increase of balancing need led to a market shift, whereas UVAM units did not only increase their offered quantity along with the contracted capacity but also maintained their offer constant or even slightly improved outside the obligatory timeframe. As visible in
Figure 8, the offered upward quantity by UVAMs increased from April 2019 to April 2020 by 59% and even from January 2020 (the last completely unaffected month pre-COVID) to April 2020 slightly by 5%, although basically no new capacity had been contracted in the meantime. Whereas prices during the obligatory period remained comparably constant at a high level between 350–370 €/MWh, the respective price outside of that dropped from an average of 541 €/MWh in April 2019 to 387 €/MWh in April 2020. Nonetheless, this proved still to be too high compared to other market participants and resulted in no accepted upward offers for UVAMs.
For downward services, the picture is somewhat different. Although UVAM operators maintained a relatively constant quantity of offers (albeit at a low level), they had been already competitive before in terms of prices for these services and hence could benefit from the increased demand. In fact, 85% of all accepted downward offers from UVAMs are situated within the five months from February to June 2020. Further details on average UVAM offers as well as the overall market performance for the observed period are again reported in
Appendix B and
Appendix C, respectively.
All in all, considering the distribution over time, no significant uptake in quantity of accepted upward balancing services from UVAMs can be observed, but the named surge of accepted downward balancing services starting from February 2020 are as depicted in
Figure 10. Overall, 985 MWh of accepted upward bids are joined by 530 MWh of accepted downward bids. This is especially noteworthy against the background of the significant increase in contracted quantity over time, which has been specifically procured to deliver upward services.
In terms of operator shares from accepted offers, it should also be noted that one operator, being a subsidiary of the old Italian incumbent, accounts for 85% of the accepted upward quantity and 100% of downward quantity delivered by UVAMs. Furthermore, the fact that only 11 out of the 27 UVAM operators placed at least one or more successful bids underscores how ambivalent different operators’ participation is.
6. Discussion
While the UVAM project just completed its second full year of operation, this paper aims at presenting an analysis methodology for the capacity auctioning and market performances of the aggregators in the Italian ASM. Through the proposed methodology, which only relies on publicly available raw market data, it is possible to obtain some essential insights into the actual operation of aggregators on the ASM, fulfilling the double objective of surveying overall market outcomes concerning UVAM offers and, most notably, monitoring their individual performance in the market. Although detailed characterization of the UVAM bidding strategies would require information about the actual composition of the resources associated to each UVAM (e.g., source types, technical constraints, load composition and its requirements), the methodology presented in this paper allows the UVAM operation to be assessed on a statistical basis. The outcomes could represent a fundamental building block for a generalized aggregator model, supporting future market analysis from both the operator’s and aggregator’s point of view.
Regarding the global analysis of the project, results can be used to support the discussion of the current policy design and its revision. First of all, the project was able to integrate around 1 GW of new capacity from DERs in the ASM. This entire capacity was previously not entitled to participate in balancing mechanisms, hence not contributing to any BSs and being only active on EMs. It appears that the fixed payment from the auctions was able to fulfill its purpose and cover potential investment costs for a sufficiently large number of operators. Along with that, it can be evaluated positively that prices within the auction scheme started to decrease slightly in the last months of 2019 and then notably with the beginning of 2020.
Another positive finding is the continued availability of these new balancing resources during periods when the regular balancing providers were less present. During the months of the highest COVID-19 impact, a reduced overall load and high presence of RES drove multiple conventional generators out of the market, whereas the new aggregates of DERs continued their offerings unaffectedly. For reasons further discussed below, this led admittedly to at least no increase in accepted upward services.
Beyond the positive aspects that the pilot project produced, we can conclude that the incentive scheme (consisting of the capacity auction with associated obligations) has strongly biased individual UVAM performance in the ASM. The price cap of 400 €/MWh turns out to be interpreted rather as a strike price than an actual cap, motivating a significant share of upward offers to this price. Similar to that, the obligatory hours for upward offers turn out to be interpreted from a notable share of the operators not as the minimum possible period but rather as the exclusive period for bidding. This is unfavorable since the resulting major offering hours of the aggregated units do not match major BS demand hours.
Taking into account that most of the participating capacity offers only upward capacity, only on five days of the week, only during the minimum required hours, and nearly always far above market price or strikingly frequent even at the price cap, there is a suspicion as to whether the majority of UVAM operators eventually really aim to actively participate in the ASM, or only to cash in on the availability of payments from the auction. Comparing the accepted UVAM quantity of November and December in 2018 (where only non-contracted UVAMs operated) with the same two months in 2019 (where almost exclusively contracted UVAMs operated) substantiates the hypothesis that UVAMs actually performed better without the fixed payment from the auction scheme. In that sense, one could argue that the scheme is actually only looking good on paper in terms of contracted quantity but not delivering its actual purpose of piloting BSs provision from decentralized resources.
While the price cap seems too high to guide aggregators towards a competitive interaction with the market, the system analysis has shown not only how the bid quantities are increasing but also that prices are (yet slowly) converging towards market prices. Furthermore, we found that a minor number of UVAMs offer in price clusters close to the market price of around 150 €/MWh. This might be interpreted as a first sign for picking up competition among UVAM participants on the one hand and among UVAM offers with other ASM participants on the other hand.
This is also supported by an additional finding from the individual units’ analysis around the turn of the year 2019–2020. With the saturation of tendered capacity, UVAMs behavior crystallizes and two bidding strategy trends emerge: on the one hand, the number of participants that solely operate during the obligatory hours increases significantly (see strategy I in
Table 2, respectively). On the other hand, the weighted average price of those offers that are made outside of the obligatory hours decreases considerably (see
Figure 8). This might highlight once more the potentially misleading effect of the incentive scheme with its daily period of obliged bidding, whereas on the other hand a comparably small but growing number of UVAMs that operate in a competitive manner also outside the incentive framework become more visible.
While the pilot project’s incentive scheme strongly fostering the provision of upward services, a reasonably unexpected finding of this analysis is the visible presence of downward services. Even though the project’s framework does not specifically incentivize their presence, and with less than 8% relatively few units offer these services, about one-third of all accepted UVAM offers are downward services. This development was driven on the one hand by the generally much more competitive offerings from aggregators for these services compared to their average upward offers. On the other hand, market conditions, especially during the COVID pandemic, favored this unexpected success, with conventional units unwilling to further reduce their output and decrease downward balancing market prices. In doing so, aggregated DER units thereby demonstrated their added value also particularly for this service, an open contradiction to the pilot project’s design with its obligation to offer specifically upward services. Against the backdrop in particular of the latest market dynamics with high RES shares, a revised project conception with a more pronounced focus on downward balancing services might, therefore, be worth considering.
7. Conclusions
This paper presents a detailed analysis of the Italian pilot project UVAM, which is one of the biggest in terms of integrated distributed flexibility from new market entrants. After introducing the evolution of ancillary services markets in Europe, both in terms of directives and the implementation of recent pilot projects, obtained findings are reflected onto the Italian case. A methodology is first outlined and then applied for the project’s analysis and its critical review based on the projects’ capacity auction results and market performances from raw public data.
Reflecting on the unique characteristics of the project implementation, their impact on individual aggregator behavior is discussed. The most essential outcomes concern the positive effect on the involvement of decentralized flexibility, particularly in terms of overall contracted capacity (around 1 GW), as well as the rather disputable market participation, mostly driven by specific incentive scheme rules. Four major conclusions can be drawn:
An impressive potential of new flexibility resources is activated by allowing smaller bid sizes and the virtual aggregation of diverse generation and or consumption units of even smaller sizes.
It proves beneficial to allow separate submissions of bids for upward and downward services. This is because most participants in this project chose to provide either one or the other, thus ensuring a high degree of flexibility.
Capacity auction incentives in combination with offer obligations and high price caps seem to be misleading and not sufficiently triggering active market participation.
During challenging periods for the electricity system with high RES shares, such as those triggered by the COVID-19 crisis, downward balancing offers from distributed energy resources proved especially valuable.
Additionally, to the review of the UVAM project results, one of the main contributions of this paper is the classification of aggregator behaviors in several categories, characterized by specific features. Findings could be a fundamental building block for modeling aggregator offerings based on statistical data. As such, results are highly relevant for future research on the design of ancillary service markets, both from the perspective of policy-makers and the individual aggregators. The analysis focusing on the first months of the COVID-19 crisis, in particular, provides valuable insights about modeling ancillary service markets with a high penetration by renewable energy sources for future energy systems.
Author Contributions
Conceptualization, J.M.S. and A.L.; methodology, software, formal analysis and investigation J.M.S., M.A. and M.C.; validation, F.B., P.G. and A.L.; data curation, J.M.S. and M.A.; writing—original draft preparation and visualization, J.M.S., M.A. and M.C.; writing—review and editing, F.B., P.G. and A.L.; supervision and project administration, A.L. and P.G. All authors have read and agreed to the published version of the manuscript.
Funding
This research received no external funding.
Institutional Review Board Statement
Not applicable.
Informed Consent Statement
Not applicable.
Data Availability Statement
Acknowledgments
The authors would like to thank the participants of the second edition of the Energy Innovation Bootcamp held at the Florence School of Regulation (FSR), Robert Schuman Centre for Advanced Studies, European University Institute in 2019. Your feedback, thoughts and constructive criticisms of the oral presentation of a preliminary version of the work provided valuable input to eventually design the study as profound and comprehensive as now presented. Furthermore, the authors would like to thank the Interdepartmental Centre for Energy Economics and Technology “Giorgio Levi Cases”, Padova, Italy, for its support under the interdisciplinary project NEBULE as well as the Veneto Region European Social Fund project. Last but not least, the authors would like to thank Julian Mayhew and Timo Gerres for their proofreading of the English language.
Conflicts of Interest
The authors declare no conflict of interest.
Abbreviations
| aFRR | automatic Frequency Restoration Reserve |
| ARERA | Autorità di Regolazione per Energia Reti e Ambiente, i.e., the Italian regulatory authority |
| AS | Ancillary Service |
| ASM | Ancillary Service Market |
| BM | Balancing Market |
| BRP | Balancing Responsible Party |
| BS | Balancing Service |
| BSP | Balancing Service Provider |
| CEP | Clean Energy Package |
| CR | Concentration Ratio |
| DER | Distributed Energy Resource |
| DG | Distributed Generation |
| DR | Demand Response |
| DSO | Distribution System Operator |
| ENTSO-E | European Network of Transmission System Operators for Electricity |
| EM | Electricity Market |
| FCR | Frequency Containment Reserve |
| GME | Gestore dei Mercati Energetici, i.e., the Italian energy market operator |
| HHI | Herfindahl-Hirschman Index |
| MB | Mercato del Bilanciamento, i.e., submarket of Italian ASM for near-real-time balancing |
| mFRR | manual Frequency Restoration Reserve |
| MSD | Mercato dei Servizi di Dispacciamento, i.e., the Italian ASM |
| MSD ex-ante | submarket of Italian ASM for programming purpose |
| RES | Renewable Energy Source |
| RR | Replacement Reserve |
| Terna | the Italian TSO |
| TSO | Transmission System Operator |
| UVAC | Unità Virtuali Abilitate di Consumo, i.e., Virtually Aggregated Consumption Unit |
| UVAM | Unità Virtuali Abilitate Miste, i.e., Virtually Aggregated Mixed Unit |
| UVAP | Unità Virtuali Abilitate di Produzione, i.e., Virtually Aggregated Production Unit |
| VOLL | Value Of Lost Load |
Appendix A. UVAM Downward Bids
Downward bids from UVAM units are not a focus point of the pilot projects design and, therefore, also not treated in the central part of our analysis; however, they turn out to be the most competitive product offered by these aggregated units and prove eventually especially valuable during the specific period of the COVID-19 impact (see
Section 5.5).
Figure A1 outlines therefore, through respective heatmaps, the development of the facultative downward offers from UVAMs in terms of offered price (upper chart) and offered quantity (lower chart) during the course of the pilot project.
Figure A1.
Heatmap of downward bids by UVAMs in terms of weighted average offered price (chart above) and summed offered quantity (chart below) with hourly resolution in the timeframe November 2018 to February 2020.
Figure A1.
Heatmap of downward bids by UVAMs in terms of weighted average offered price (chart above) and summed offered quantity (chart below) with hourly resolution in the timeframe November 2018 to February 2020.
Appendix B. Additional Statistics on UVAM Bids
To complete the set of necessary elements for the future modeling of aggregated units as analyzed in this empirical study of the Italian pilot project,
Table A1 provides additional statistics on average hourly bids of aggregated UVAM units. For selected months, offered average quantities per hour (
) from all units with the associated weighted average prices (
) and the respective variance of the prices (
) are provided for both upward and downward balancing services. To reflect the substantial differences resulting from the project’s incentive scheme, different values are provided always for a typical hour outside and inside the obligatory timeframe (04:00 am and 04:00 pm) as well as the full 24-h timeframe for both weekdays and holidays.
Table A1.
Additional statistics on hourly upward and downward bids of aggregated units for selected months.
Table A1.
Additional statistics on hourly upward and downward bids of aggregated units for selected months.
| | | | | | Dec-18 | Jan-19 | Apr-19 | Aug-19 | Dec-19 | Jan-20 | Apr-20 |
|---|
| UVAM upward offers | 4:00 AM | | | weekday | 76.17 | 153.29 | 541.15 | 523.93 | 788.28 | 421.04 | 386.86 |
| holiday | 77.11 | 221.19 | 492.60 | 506.71 | 746.16 | 382.73 | 381.39 |
| | weekday | 23 | 453,467 | 1,333,541 | 1,313,533 | 1,650,353 | 452,858 | 431,431 |
| holiday | 23 | 643,140 | 1,233,600 | 1,303,557 | 1,626,556 | 410,613 | 436,492 |
| | weekday | 23 | 38 | 54 | 71 | 49 | 63 | 75 |
| holiday | 24 | 40 | 63 | 74 | 52 | 66 | 77 |
| 4:00 PM | | | weekday | 113.16 | 361.47 | 354.08 | 341.80 | 369.33 | 371.26 | 369.54 |
| holiday | 109.93 | 218.29 | 192.62 | 202.07 | 312.10 | 344.53 | 332.52 |
| | weekday | 7164 | 25,881 | 12,241 | 11,436 | 52,254 | 82,971 | 48,544 |
| holiday | 9663 | 21,529 | 11,179 | 13,261 | 244,531 | 169,202 | 168,855 |
| | weekday | 19 | 359 | 577 | 729 | 847 | 968 | 956 |
| holiday | 26 | 83 | 91 | 100 | 76 | 260 | 207 |
| Avg. day | | | weekday | 85.36 | 303.56 | 417.87 | 405.65 | 462.21 | 392.10 | 379.63 |
| holiday | 86.63 | 219.67 | 422.31 | 433.76 | 663.50 | 381.65 | 372.09 |
| | weekday | 1794 | 218,718 | 554,378 | 605,244 | 719,350 | 238,420 | 191,447 |
| holiday | 2298 | 432,560 | 887,763 | 1,006,607 | 1,325,483 | 361,467 | 366,926 |
| | weekday | 18 | 88 | 138 | 186 | 182 | 210 | 218 |
| holiday | 22 | 47 | 66 | 77 | 53 | 97 | 96 |
| UVAM downward offers | 4:00 AM | | | weekday | 15.00 | 13.52 | 7.13 | 13.80 | 11.58 | 9.95 | 11.10 |
| holiday | 15.00 | 13.46 | 8.99 | 13.52 | 11.33 | 9.30 | 10.19 |
| | weekday | 0 | 23 | 39 | 32 | 54 | 55 | 49 |
| holiday | 0 | 31 | 33 | 36 | 54 | 54 | 52 |
| | weekday | 14 | 4 | 10 | 4 | 18 | 11 | 8 |
| holiday | 20 | 3 | 12 | 3 | 15 | 10 | 7 |
| 4:00 PM | | | weekday | 30.00 | 18.27 | 26.06 | 25.70 | 17.16 | 8.73 | 16.53 |
| holiday | 30.00 | 23.65 | 23.49 | 28.01 | 23.36 | 17.44 | 22.83 |
| | weekday | 0 | 217 | 66 | 149 | 218 | 222 | 210 |
| holiday | 0 | 207 | 78 | 96 | 210 | 215 | 190 |
| | weekday | 13 | 5 | 6 | 3 | 16 | 8 | 9 |
| holiday | 13 | 3 | 14 | 3 | 17 | 9 | 11 |
| Avg. day | | | weekday | 25.84 | 26.00 | 19.81 | 25.43 | 19.18 | 18.81 | 22.31 |
| holiday | 25.54 | 25.10 | 18.32 | 24.24 | 20.59 | 17.19 | 20.39 |
| | weekday | 40 | 107 | 130 | 133 | 187 | 188 | 170 |
| holiday | 43 | 125 | 125 | 124 | 183 | 184 | 174 |
| | weekday | 12 | 9 | 14 | 6 | 20 | 14 | 14 |
| holiday | 14 | 4 | 15 | 3 | 17 | 11 | 10 |
Appendix C. Accepted Upward and Downward Bids on the Italian ASM
Finally, to set the analysis of upward and downward bids of UVAMs in the right context, this section outlines the structure of average accepted bids on the Italian ASM (MSD ex-ante + MB).
Table A2 provides, therefore, the necessary statistics with regard to those products of the market that UVAM units are eligible for (i.e., Italian balancing products AS, GR1, GR2, GR3 and GR4, see
Section 3) at the same timely granularity as in the previous section on UVAM bids.
Table A2.
Additional statistics on accepted hourly upward and downward bids on the Italian ASM for selected months.
Table A2.
Additional statistics on accepted hourly upward and downward bids on the Italian ASM for selected months.
| | | | | | Dec-18 | Jan-19 | Apr-19 | Aug-19 | Dec-19 | Jan-20 | Apr-20 |
|---|
| accepted upward offers on Italian ASM | 4:00 AM | | | weekday | 199.50 | 166.67 | 237.98 | 129.17 | 186.80 | 172.74 | 170.74 |
| holiday | 207.75 | 181.32 | 229.41 | 130.90 | 177.80 | 174.96 | 166.92 |
| | weekday | 6769 | 3694 | 13,698 | 3125 | 14,588 | 11,318 | 7084 |
| holiday | 7460 | 12,311 | 67,993 | 6935 | 11,428 | 8682 | 7254 |
| | weekday | 1302 | 1837 | 1714 | 1521 | 2127 | 1903 | 2928 |
| holiday | 1110 | 2319 | 2064 | 1703 | 2391 | 2515 | 3708 |
| 4:00 PM | | | weekday | 126.08 | 102.97 | 129.89 | 94.72 | 131.60 | 97.55 | 148.08 |
| holiday | 170.40 | 138.96 | 199.25 | 121.61 | 182.54 | 167.73 | 136.07 |
| | weekday | 6782 | 4835 | 7046 | 2392 | 17,755 | 21,670 | 13,326 |
| holiday | 15,115 | 8076 | 18,037 | 5738 | 21,963 | 16,988 | 4081 |
| | weekday | 1480 | 2238 | 1590 | 1718 | 1763 | 1692 | 2261 |
| holiday | 1204 | 2080 | 1889 | 1648 | 1920 | 1466 | 3277 |
| Avg. day | | | weekday | 146.34 | 124.29 | 165.09 | 110.34 | 154.77 | 124.10 | 158.90 |
| holiday | 181.61 | 165.43 | 215.32 | 119.33 | 185.78 | 171.30 | 157.15 |
| | weekday | 8431 | 5593 | 19,102 | 5342 | 15,842 | 16,974 | 12,815 |
| holiday | 13,560 | 14,643 | 21,180 | 5630 | 27,031 | 16,937 | 9274 |
| | weekday | 1443 | 2093 | 1646 | 1803 | 2064 | 1813 | 2439 |
| holiday | 1264 | 2185 | 1983 | 1788 | 2292 | 1968 | 3488 |
| accepted downward offers on Italian ASM | 4:00 AM | | | weekday | 23.44 | 27.40 | 26.29 | 25.44 | 12.25 | 20.19 | 4.72 |
| holiday | 19.66 | 21.34 | 27.15 | 25.63 | 12.39 | 16.59 | 3.00 |
| | weekday | 298 | 339 | 166 | 63 | 196 | 81 | 113 |
| holiday | 331 | 371 | 120 | 100 | 323 | 80 | 45 |
| | weekday | 1609 | 1336 | 1886 | 1455 | 1897 | 1647 | 2412 |
| holiday | 1770 | 1668 | 2305 | 1587 | 1770 | 2137 | 2550 |
| 4:00 PM | | | weekday | 41.55 | 48.14 | 27.76 | 28.88 | 25.06 | 30.71 | 6.65 |
| holiday | 33.53 | 35.31 | 25.28 | 23.02 | 22.13 | 22.63 | 3.12 |
| | weekday | 284 | 222 | 238 | 94 | 138 | 121 | 72 |
| holiday | 392 | 326 | 221 | 58 | 178 | 117 | 222 |
| | weekday | 1455 | 1315 | 1983 | 2286 | 2404 | 2021 | 2416 |
| holiday | 1219 | 1282 | 2071 | 1615 | 2478 | 2101 | 2896 |
| Avg. day | | | weekday | 35.76 | 41.06 | 31.28 | 27.99 | 20.64 | 26.91 | 7.06 |
| holiday | 31.53 | 31.16 | 27.74 | 24.69 | 19.22 | 20.48 | 4.01 |
| | weekday | 277 | 263 | 194 | 85 | 192 | 95 | 95 |
| holiday | 302 | 360 | 219 | 94 | 198 | 126 | 132 |
| | weekday | 1631 | 1485 | 1732 | 1917 | 2261 | 1986 | 2282 |
| holiday | 1534 | 1433 | 2138 | 1603 | 2204 | 2193 | 2707 |
To visualize the selected numeric market results and to complete the comparison with UVAM offers over the entire period of observation from November 2018 to June 2020,
Figure A2 reports heatmaps that outline the development of the weighted average price (upper chart) and the overall quantity (lower chart) of accepted upward bids on the Italian ASM. Similar to that,
Figure A3 reports heatmaps that outline the development of the weighted average price (upper chart) and the overall quantity (lower chart) of accepted downward bids on the Italian ASM. Please note that the payment direction is inverse for downward services, i.e., from operators to the TSO, hence higher prices are here more competitive than lower ones.
Figure A2.
Heatmap of awarded upward bids on the Italian ASM (MSD (Mercato dei Servizi di Dispacciamento) ex-ante + MB (Mercato del Bilanciamento)) in terms of weighted average price (chart above) and summed quantity (chart below) with hourly resolution in the timeframe November 2018 to June 2020.
Figure A2.
Heatmap of awarded upward bids on the Italian ASM (MSD (Mercato dei Servizi di Dispacciamento) ex-ante + MB (Mercato del Bilanciamento)) in terms of weighted average price (chart above) and summed quantity (chart below) with hourly resolution in the timeframe November 2018 to June 2020.
Figure A3.
Heatmap of awarded downward bids on the Italian ASM (MSD ex-ante + MB) in terms of weighted average price (chart above) and summed quantity (chart below) with hourly resolution in the timeframe November 2018 to June 2020.
Figure A3.
Heatmap of awarded downward bids on the Italian ASM (MSD ex-ante + MB) in terms of weighted average price (chart above) and summed quantity (chart below) with hourly resolution in the timeframe November 2018 to June 2020.
References
- European Commission. Clean Energy for All Europeans. Available online: https://ec.europa.eu/energy/topics/energy-strategy/clean-energy-all-europeans_en (accessed on 15 November 2019).
- Impact Assessment Office Green Energy. Il Sostegno alle Attività Produttive Mediante Generazione, Accumulo e Autoconsumo di Energia Elettrica; X Comm. Senat: Rome, Italy, 2019. [Google Scholar]
- ENTSO-E. Powerfacts Europe 2019; ENTSO-E: Brussels, Belgium, 2019. [Google Scholar]
- Grave, K.; Paulus, M.; Lindenberger, D. A method for estimating security of electricity supply from intermittent sources: Scenarios for Germany until 2030. Energy Policy 2012, 46, 193–202. [Google Scholar] [CrossRef]
- Di Silvestre, M.L.; Favuzza, S.; Riva Sanseverino, E.; Zizzo, G. How Decarbonization, digitalization and decentralization are changing key power infrastructures. Renew. Sustain. Energy Rev. 2018, 93, 483–498. [Google Scholar] [CrossRef]
- Bignucolo, F.; Caldon, R.; Prandoni, V.; Spelta, S.; Vezzola, M. The Voltage Control on MV Distribution Networks with Aggregated DG Units (VPP). In Proceedings of the 41st International Universities Power Engineering Conference, Newcastle upon Tyne, UK, 6–8 September 2006; Volume 1, pp. 187–192. [Google Scholar] [CrossRef]
- Bignucolo, F.; Lorenzoni, A.; Schwidtal, J.M. End-Users Aggregation: A Review of Key Elements for Future Applications. In Proceedings of the 16th International Conference European Energy Market (EEM), Ljubljana, Slovenia, 18–20 September 2019. [Google Scholar] [CrossRef]
- Koliou, E.; Eid, C.; Chaves-Ávila, J.P.; Hakvoort, R.A. Demand response in liberalized electricity markets: Analysis of aggregated load participation in the German balancing mechanism. Energy 2014, 71, 245–254. [Google Scholar] [CrossRef]
- European Parliament and the Council of the European Union. Directive (EU) 2018/2011 of the European Parliament and of the Council of 11 December 2018 on the Promotion of the Use of Energy from Renewable Sources; European Commission: Brussels, Belgium, 2018; pp. 82–209. [Google Scholar]
- European Parliament and the Council of the European Union. Regulation (EU) 2019/943 of the European Parliament and of the Council of 5 June 2019 on the Internal Market for Electricity; European Commission: Brussels, Belgium, 2019; pp. 54–124. [Google Scholar]
- European Parliament and the Council of the European Union. Directive (EU) 2019/944 of the European Parliament and of the Council of 5 June 2019 on Common Rules for the Internal Market for Electricity and Amending Directive 2012/27/EU; European Commission: Brussels, Belgium, 2019; pp. 125–199. [Google Scholar]
- Gils, H.C. Assessment of the theoretical demand response potential in Europe. Energy 2014, 67, 1–18. [Google Scholar] [CrossRef]
- Baker, P. Resource Adequacy, Regionalisation, and Demand Response; RAP: Brussels, Belgium, 2015. [Google Scholar]
- Dranka, G.G.; Ferreira, P. Review and assessment of the different categories of demand response potentials. Energy 2019, 179, 280–294. [Google Scholar] [CrossRef]
- Schittekatte, T.; Meeus, L. Flexibility markets: Q&A with project pioneers. Util. Policy 2020, 63, 101017. [Google Scholar] [CrossRef] [Green Version]
- Urresti-Padrón, E.; Jakubek, M.; Jaworski, W.; Kłos, M. Pre-selection of the optimal sitting of phase-shifting transformers based on an optimization problem solved within a coordinated cross-border congestion management process. Energies 2020, 13, 3748. [Google Scholar] [CrossRef]
- Backe, J.; Ruwaida, Y.; Bjarup, D. Change and Change Management-Unlocking Power Flexibility Meeting Sweden’s Capacity Challenge. In Proceedings of the 25th International Conference on Electricity Distribution (CIRED2019), Madrid, Spain, 3–6 June 2019. [Google Scholar]
- CoordiNet Project. Deliverable D3.1: Report of Functionalities and Services of the Spanish Demo; European Commission: Brussels, Belgium, 2020. [Google Scholar]
- Vlaisavljevic, D.; Vlaisavljevic, I.M.; Vukasovic, M.; Vujasinovic, Z. Power Flow Colouring: A Novel Power Flow Tracing Methodology Tailored for the European Zonal Electricity Market Design. In Proceedings of the 2019 IEEE PES Innovative Smart Grid Technologies Europe (ISGT-Europe), Bucharest, Romania, 29 September–2 October 2019; pp. 1–5. [Google Scholar]
- Mendes, G.; Ferreira, J.R.; Albuquerque, S.; Trocato, C.; Kilkki, O.; Repo, S. Pushing the transition towards transactive grids through local energy markets. In Proceedings of the 25th International Conference on Electricity Distribution (CIRED 2019), Madrid, Spain, 3–6 June 2019. [Google Scholar]
- FEVER Project. Deliverable D1.1: Flexibility at the Distribution Grid: Reference Usage Scenarios for Market and System Operation Services; European Commission: Brussels, Belgium, 2020. [Google Scholar]
- Pedersen, T.B.; Siksnys, L.; Neupane, B. Modeling and Managing Energy Flexibility Using FlexOffers. In Proceedings of the 2018 IEEE International Conference on Communications, Control, and Computing Technologies for Smart Grids (SmartGridComm), Aalborg, Denmark, 29–31 October 2018; pp. 1–7. [Google Scholar]
- Dumbs, C.; Jarry, G.; Willems, M.; Gross, T.; Larsen, A.; Wagner, T. Market models for local flexibility procurement: InterFlex’ experience and main challenges. In Proceedings of the 25th International Conference on Electricity Distribution (CIRED 2019), Madrid, Spain, 3–6 June 2019; pp. 1–5. [Google Scholar]
- Tamadon, N.; Shayesteh, E.; Cupelli, M.; Monti, A. Local Balancing of Low-Voltage Networks by Utilizing Distributed Flexibilities as Part of the InterFlex Field Trial. In Proceedings of the IECON 2018—44th Annual Conference of the IEEE Industrial Electronics Society, Washington, DC, USA, 21–23 October 2018; pp. 3568–3575. [Google Scholar]
- CoordiNet Project Website. Available online: https://coordinet-project.eu/ (accessed on 10 February 2021).
- Dominoes Project Website. Available online: http://dominoesproject.eu/ (accessed on 10 February 2021).
- Enera Project Website. Available online: https://projekt-enera.de/ (accessed on 10 February 2021).
- EU-SysFlex Project Website. Available online: https://eu-sysflex.com/ (accessed on 10 February 2021).
- FEVER Project Website. Available online: https://fever-h2020.eu/ (accessed on 10 February 2021).
- FutureFlow Project Website. Available online: https://www.futureflow.eu/ (accessed on 10 February 2021).
- GOFLEX Project Website. Available online: https://goflex-project.eu/ (accessed on 10 February 2021).
- GOPACS Project Website. Available online: https://en.gopacs.eu/ (accessed on 10 February 2021).
- InterFlex Project Website. Available online: https://interflex-h2020.com/ (accessed on 10 February 2021).
- NODES Project Website. Available online: https://nodesmarket.com/ (accessed on 10 February 2021).
- Pico Flex Project Website. Available online: https://picloflex.com/ (accessed on 10 February 2021).
- TERNA UVAM Project Website. Available online: https://www.terna.it/it/sistema-elettrico/progetti-pilota-delibera-arera-300-2017-reel/progetto-pilota-uvam (accessed on 28 December 2019).
- DA/RE Project Website. Available online: https://www.dare-plattform.de/ (accessed on 10 February 2021).
- DELTA Project Website. Available online: https://www.delta-h2020.eu/ (accessed on 10 February 2021).
- inteGRIDy Project Website. Available online: http://www.integridy.eu/ (accessed on 10 February 2021).
- Pinto-Bello, A. The smartEn Map-European Balancing Markets Edition; smartEn: Brussels, Belgium, 2018. [Google Scholar]
- ENTSO-E Survey on Ancillary Services Procurement, Balancing Market Design. 2019. Available online: https://eepublicdownloads.azureedge.net/clean-documents/mc-documents/200505_WG_AS_survey_ancillary_services_2019.pdf (accessed on 5 May 2020).
- 50Hertz Transmission GmbH. Amprion GmbH; TenneT TSO GmbH; TransnetBW GmbH Präqualifikationsverfahren für Regelreserveanbieter(FCR, aFRR, mFRR); 50Hertz Transmission GmbH: Berlin, Germany, 2020. [Google Scholar]
- Dallinger, B.; Auer, H.; Lettner, G. Impact of harmonised common balancing capacity procurement in selected Central European electricity balancing markets. Appl. Energy 2018, 222, 351–368. [Google Scholar] [CrossRef]
- 50Hertz Transmission GmbH; Amprion GmbH; TenneT TSO GmbH; TransnetBW GmbH. Leitfaden zur Präqualifikation von Windenergieanlagenzur Erbringung vonMinutenreserveleistungim Rahmen einer Pilotphase; 50Hertz Transmission GmbH: Berlin, Germany, 2018. [Google Scholar]
- National Grid Electricity System. Update on STOR and Fast Reserve Tenders; National Grid: London, UK, 2020. [Google Scholar]
- National Grid Electricity System. Short-Term Operating Reserve (STOR)-Requirements for Compliance with Aspects of the Clean Energy Package; National Grid: London, UK, 2020. [Google Scholar]
- Red Eléctrica de Espana. Resolución de 17-12-2019, BOE 30/12/19; Red Eléctrica de Espana: Madrid, Spain, 2019. [Google Scholar]
- European Commission. Italian Implementation Plan Market Reform. Available online: https://ec.europa.eu/energy/sites/ener/files/italy_market_reform_plan.pdf (accessed on 4 March 2021).
- All NEMO. Committee All NEMO Committee Webpage-SIDC. Available online: http://www.nemo-committee.eu/sidc (accessed on 4 March 2021).
- ARERA. Deliberazione 5 Maggio 2017 300/2017/R/eel: Prima Apertura del Mercato per il Servizio di Dispacciamento (MSD) alla Domanda Elettrica ed alle Unità di Produzione anche da Fonti Rinnovabili non già Abilitate nonché ai Sistemi di Accumulo; ARERA: Rome, Italy, 2017. [Google Scholar]
- ARERA. Deliberazione 25 maggio 2017 372/2017/R/eel: Approvazione del Regolamento, Predisposto da TERNA ai Sensi della Deliberazione 300/2017/R/eel, Relativo al Progetto Pilota per la Partecipazione della Domanda al Mercato per il Servizio di Dispacciamento; ARERA: Rome, Italy, 2017. [Google Scholar]
- ARERA. Deliberazione 3 Agosto 2017 583/2017/R/eel: Approvazione del Regolamento, Predisposto da TERNA S.p.a. ai sensi della Deliberazione dell’Autorità 300/2017/R/eel, Relativo al Progetto Pilota per la Partecipazione della Generazione Distribuita; ARERA: Rome, Italy, 2017. [Google Scholar]
- ARERA. Deliberazione 2 agosto 2018 422/2018/R/eel: Approvazione del Regolamento, Predisposto da TERNA ai sensi della Deliberazione dell’Autorità 300/2017/R/eel, Relativo al Progetto Pilota per la Partecipazione di Unità Virtuali miste al Mercato MSD; ARERA: Rome, Italy, 2018. [Google Scholar]
- European Commission. Commission Regulation (EU) 2017/2195: Establishing a Guideline on Electricity Balancing (EB GL); European Commission: Brussels, Belgium, 2017; Volume 2017, pp. 6–53. [Google Scholar]
- Confindustria Confindustria-Position Paper on UVAM. Tavolo di Lav. UVAM Press. X Comm. Ind. del Senat. 2019, p. 4. Available online: https://www.confindustria.it/wcm/connect/a367c57c-1041-49bd-8ced-0db853bc0544/Tavolo+UVAM+Commissione+Senato.pdf?MOD=AJPERES&CONVERT_TO=url&CACHEID=ROOTWORKSPACE-a367c57c-1041-49bd-8ced-0db853bc0544-mC1Vg5o (accessed on 6 November 2020).
- ARERA. Documento per la Consultazione 322/2019/R/EEL: Testo Integrato del Dispacciamento Elettrico (TIDE); ARERA: Rome, Italy, 2019. [Google Scholar]
- ARERA. Documento per la Consultazione 201/2020/R/EEL: “Orientamenti Relativi alla Partecipazione dei Veicoli Elettrici al Mercato per il Servizio di Dispacciamento, per il Tramite delle Infrastrutture di Ricarica Totate di Tecnologia VEHICLE TO GRID; ARERA: Rome, Italy, 2020. [Google Scholar]
- Gestore Mercato Elettrico (GME). Public Domain-Bids/Offers. Available online: https://www.mercatoelettrico.org/En/download/DownloadDati.aspx?val=OfferteFree_Pubbliche (accessed on 6 November 2020).
- U.S. Departament of Justice and the Federal Trade Commission. Horizontal Merger Guidelines; U.S. Departament of Justice and the Federal Trade Commission: Washington, DC, USA, 1997.
- Twomey, P.; Green, R.; Neuhoff, K.; Newbery, D. A Review of the monitoring of market power: The possible roles of transmission system operators in monitoring for market power issues in congested transmission systems. J. Econ. Lit. 2005, 11, 3–54. [Google Scholar] [CrossRef]
- McAdam, P.; Petroulakis, F.; Vansteenkiste, I.; Cavalleri, M.; Eliet, A.; Soares, A. Concentration, Market Power and Dynamism in the Euro Area; European Central Bank: Frankfurt, Germany, 2019. [Google Scholar]
- Ciarreta, A.; Nasirov, S.; Silva, C. The development of market power in the Spanish power generation sector: Perspectives after market liberalization. Energy Policy 2016, 96, 700–710. [Google Scholar] [CrossRef]
- European Commission. Guidelines on the Assessment of Horizontal Mergers under the Council Regulation on the Control of Concentrations between Undertakings; European Commission: Brussels, Belgium, 2004; pp. 5–18. [Google Scholar]
- ARERA. Report 306/2020/I: Annual Report to ACER and the European Commission on the Regulatory Activities and the Fulfilment of Duties of the Italian Regulatory Authority for Energy, Networks and Environment; ARERA: Rome, Italy, 2020; pp. 1–181. [Google Scholar]
- Terna. Monthly Report on the Electricity System-April 2020; Terna: Rome, Italy, 2020. [Google Scholar]
| Publisher’s Note: MDPI stays neutral with regard to jurisdictional claims in published maps and institutional affiliations. |
© 2021 by the authors. Licensee MDPI, Basel, Switzerland. This article is an open access article distributed under the terms and conditions of the Creative Commons Attribution (CC BY) license (https://creativecommons.org/licenses/by/4.0/).


 ,
, 


