Abstract
To achieve a successful integration of fluctuating renewable power generation, the power-to-heat (P2H) conversion is seen as an efficient solution that remedies the issue of curtailments as well as reduces carbon emissions prevailing in the district heating (DH) sector. Concurrently, the need for storage is also increasing to maintain a continuous power supply. Hence, this paper presents a MILP-based model to optimize the size of thermal storage required to satisfy the annual DH demand of a community solely by P2H conversion employing renewable energy. The DH is supplied by the optimal operation of a novel 2-km deep well heat pump system (DWHP) equipped with thermal storage. To avoid computational intractability, representative time steps with varying time duration are chosen by employing hierarchical agglomerative clustering that aggregates adjacent hours chronologically. The value of demand response and the effect of interannual weather variability are also analyzed. Numerical results from a Finnish case study show that P2H conversion utilizing small thermal storage in tandem with the DWHP is able to cover the annual DH demand, thus leading to a carbon-neutral DH system and, at the same time, mitigating the curtailment of excessive wind generation. Compared with the annual DH demand, an average thermal storage size of 29.17 MWh (2.58%) and 13.99 MWh (1.24%) are required in the business-as-usual and the demand response cases, respectively.
1. Introduction
The current energy policies of the European Union (EU) and the Intergovernmental Panel on Climate Change (IPCC) of the United Nations (UN) urge combating global warming. As a result, the share of renewable energy generation capacity is substantially increasing in energy systems. A key strategy is to replace centralized fossil fuel-based energy generation with widely distributed clean renewable sources. This points to a massive energy transition ahead, including long-term planning of generation expansion and storage capacity. This clean energy transition not only includes the electrical power sector but also necessitates more actions in the district heating (DH) sector, as most of the end-use energy in Europe is in the form of heating [1]. For instance, heating and domestic hot water, together, constitute over 80% of the households’ end-use energy in Finland [2]. Moreover, DH is mostly based on fossil fuels in Northern Europe such that it stands for 51% of all emissions in Helsinki, the capital of Finland [3].
While renewable energy sources (RES), such as wind and solar power, play an important role in the deep decarbonization of energy systems, they come with inherent variable and intermittent power generation levels that render them un-dispatchable. Thus, in order to achieve a successful integration of such RES technologies, smart grid solutions become apparent. In this field, sector coupling of electricity and heat utilizing excess renewable power generation to perform power-to-heat (P2H) conversion is an extensively proposed solution and has received increasing interest [4]. It implies that the excess renewable generation, which would otherwise be curtailed, can be used to produce DH. The benefit of this idea is twofold: first, it reduces the generation curtailments, and second, it reduces the carbon emissions in the DH sector. In simple words, the DH system has a great tendency to act as a sink for fluctuating RES generation.
Growing efforts have been dedicated to analyzing the flexibility and economic value associated with P2H coupling. For example, it was concluded in [5] that P2H conversion utilizing renewable generation was the most cost-efficient approach for minimizing carbon emissions for the case of the Nordic–Baltic region. The results also highlighted the need for thermal energy storage in conjunction with P2H application. Likewise, the authors in [6] demonstrated that utilizing only heat pumps would significantly reduce the emissions of DH in Helsinki under high wind power penetration. The work in [7] considered a 50% share of wind generation for Helsinki and established that the P2H option complemented with thermal storage would eliminate all the wind power curtailments. In [8], by considering national and local cases in Finland, it was argued that electrification of the heating sector could prove to be effective in mitigating CO2 but with a warning that wind generation would not easily replace the electricity cogeneration in DH systems, due to adequacy issues in peak hours. The foregoing discussed studies particularly focused on the Nordic countries, as the DH load is quite significant due to the extreme and long winter season in this region. Moreover, thermal storage was emphasized as an implicit component in P2H application to eradicate generation curtailments.
While there is a consensus on the benefits of P2H coupling in mitigating curtailments, demand response (DR) is also characterized as a cost-effective tool to address RES integration. DR aims to provide upward or downward regulating power to balance the intermittent power levels of RES. Among DR loads, thermostatically controlled loads (TCLs), such as heating, ventilation and air-conditioning and domestic hot water usage, etc., occupy a leading slot. In the case of TCLs, the user-comfort is a function of temperature dead band only, while a smart thermostat is a fundamental requirement to control the thermal comfort level. The promising benefits offered by TCLs in the context of network management, investment planning and balance reserves have gained much attention. For instance, the system-wide potential of space heating loads for capacity planning of hydrogen energy storage in a highly renewable energy case of the Finnish power system was considered in [9]. In [10], the flexibility potential of space heating together with domestic hot water loads was analyzed, aiming at mitigating renewable generation curtailments for a residential microgrid. Similarly, the on-site utilization of solar energy generation was optimized by the support of TCLs in [11]. The above-discussed studies centered on space heating loads also considered building thermal dynamics for efficient DR coordination.
In our previous work [12], the P2H option was considered, along with the DR of space heating in a short-term operation-planning model enabling aggregator and households to communicate with each other to achieve mutual benefits. However, in order to account for events concerning high wind days or even very low wind days in P2H application for DH demand, thermal storage is certainly required, as endorsed in the literature. Therefore, our current work aims at optimal capacity planning of thermal storage in a DH system relying entirely on P2H conversion to achieve a zero-emission system.
Indeed, the capacity planning of energy systems is a long-term planning problem spanning several years, and it needs to consider short-term operating conditions, as well [13]. It implies using hourly or sub-hourly time representation of the planning horizon, which renders the model computationally intractable [14]. To deal with such issues, temporal complexity reduction techniques, also known as time period clustering, are often applied to power system planning studies. The goal of such time period clustering techniques is to enhance computational efficiency, while preserving as much information as possible. Consequently, a smaller number of representative periods is chosen to represent the whole horizon. One of the broadly accepted approaches requires representing the time-dependent parameters using system states. For instance, demand is first represented using duration curves. The duration curves are segregated into blocks, which are approximated with a finite number of segments [15]. Although this representation makes the model computationally efficient, a major drawback is that it totally neglects the chronology and, therefore, does not enable the inclusion of time-linking constraints, such as storage state of charge dynamics, tracking indoor thermal comfort of end-users and generation ramping constraints in the capacity planning model.
A more widely accepted time period clustering routine involves choosing representative days or weeks from a planning horizon to represent the annual variability of input data [16,17]. Contrary to the duration curves, this clustering approach is capable of maintaining some chronology, at least within each representative day or week, which also allows consideration of intraday time-linking constraints. In the context of storage investment, the authors in [18] proposed a representative time period model with a transition matrix to introduce some continuity between representative periods. The model was shown to outperform both system state and conventional representative time period clustering. However, such methodology fails to accurately consider interday storage dynamics in a medium- or long-term planning horizon [14,19], which is crucial, particularly in highly renewable generation power systems. Moreover, electricity demand has a diurnal pattern that can be easily captured by representative periods. On the contrary, wind power generation is highly volatile. Such fast dynamics cannot be captured by representative days, and hence, these clustering approaches undermine the short-term operating conditions in long-term planning problems.
In this paper, we utilize the hierarchical agglomerative clustering procedure for retaining the chronological information of the planning horizon in order to accurately capture the interday storage dynamics and track end-user thermal comfort levels concerning space heating loads. This technique hierarchically clusters just adjacent hours chronologically, according to Euclidean norm. There exist only a few studies applying chronological time period clustering in power system expansion studies involving storage [20,21]. The authors in [20] carried out a comprehensive comparison among four planning models, namely the full hourly model (benchmark), a model based on 28 representative days, one based on four representative weeks, and one based on chronological clustering using 672 timeslots for storage expansion studies involving renewable generation. It was proved that the chronological clustering-based model outperforms the remaining two time period representations in terms of error of the objective value. More recently, in a similar context, the authors in [21] demonstrated a comparison between chronological clustering and coupling clustering for days. The chronological clustering was proved to work more efficiently in approximating the abrupt variations associated with wind. Thus, aggregating the consecutive hours chronologically, denoted here as chronological clustering, overcomes the drawbacks of classical clustering approaches and brings economic value in combining renewable generation with storage devices.
The contributions of this paper are summarized as follows:
- A thermal storage planning model is proposed to cover the annual DH demand of a community solely by P2H conversion using wind power, thus leading to a fully carbon-free DH system.
- Chronological clustering is applied to accurately capture the midterm dynamics of wind power and track the energy level of storage and thermal comfort level of each end-user, while keeping the proposed planning model computationally tractable.
- The P2H conversion is performed using a novel 2-km deep well heat pump (DWHP) system. The thermal analysis of DWHP is conducted separately in Finnish conditions over a 25-year study period. Moreover, the DWHP is used for both heat extraction and heat injection.
- Space heating load, thermal comfort and the associated DR are modeled using a two-capacity building thermal model.
- The effect of interannual weather variability on storage size is studied by simulating the optimization model with different weather inputs.
The paper is structured as follows: In Section 2, a brief description of system models, including the hierarchical agglomerative clustering, is presented. Section 3 presents the optimization formulation for the thermal energy storage planning in DH systems employing P2H conversion through wind power. Section 4 discusses the simulation results for a Finnish case based on the EU visions for the years 2030 and 2050 [22]. Finally, Section 5 concludes the paper.
2. System Description
2.1. Two-Capacity Building Model
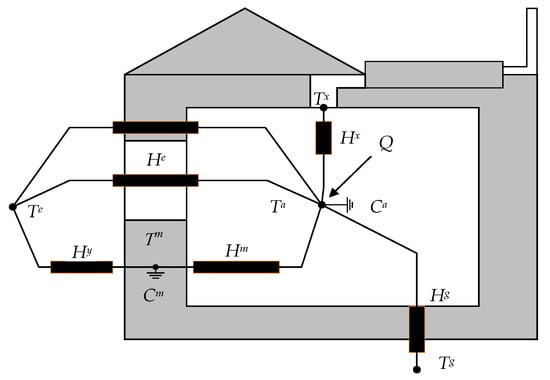
The two-capacity building model is accurate enough to estimate the space heating load of a detached house or an apartment building [10,12,23]. The model evaluates the heating demand by capturing the indoor air dynamics relative to the outdoor air temperature variation. As the name asserts, it makes use of two thermal capacitances. One capacitance represents the building structure, Cm, while the other is designated to the indoor air, Ca. There are two unknown temperatures, the indoor temperature Ta and the building fabric temperature Tm, evaluating the demand for heating or cooling. In addition, other temperature parameters of the model comprise ventilation supply temperature Tx, outdoor temperature Te and ground temperature Tg. The temperature nodes are related to each other through heat conductance or heat capacity flow in case there is an airflow between nodes. It is assumed that there is no warming of the infiltrating air in the building structure Cm and the infiltrating air temperature is the same as that of the external air. The windows are assumed to have a negligible thermal mass, compared to the building envelope. The heating or cooling power of the air-handling unit is convective in nature, and it is set to operate at a fixed temperature, Tx. Cm is dominant relative to Ca, but Ca has a vital role in analyzing indoor air dynamics. The model is portrayed in Figure 1.
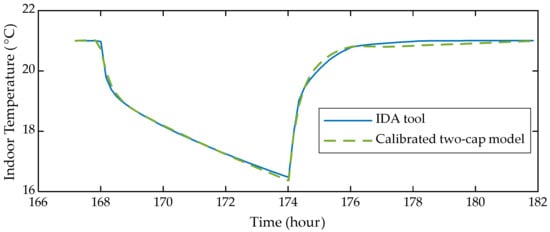
The unknown parameters of the model are fine-tuned using the dynamic building energy simulation tool IDA–ICE, which is used to study the indoor climate and energy consumption of buildings. The test house is a single-family, two-floor house, with a total built floor area of 180 m2. The structure of the house is medium-weight passive, according to the Finnish guidelines. More details of the prototype house, including the floor plan, are given in [24]. During calibration, the indoor temperature set-point is 21 °C [25]. The heating power is cut off for six hours that results in an exponential drop in the indoor temperature. The parameters are determined by minimizing the variance between the response attained from the IDA–ICE model and the derived two-capacity model. The calibration procedure is performed at three different outdoor temperatures, i.e., −10 °C, 0 °C and 10 °C, as illustrated in Figure 2.
2.2. Deep Well (Borehole) Heat Pump System
The P2H conversion employing clean renewable energy can provide aid for the evolution of the DH sector, as well as offer new options for balancing the large-scale intermittent electricity generation. The P2H conversion is usually performed using community-scale electric boilers and small-scale heat pumps. Concurrently, cutting emissions also requires exploiting new types of heat sources and storages to match the scale of the DH consumption. Employing large-scale heat pumps utilizing geothermal energy can be a promising solution in the future. The geothermal energy extracted 100–300 m below the ground with stable temperatures between 5–7 °C is classified as primary geothermal energy, whereas the thermal energy extracted from the upper layers of the soil (a few meters deep), heated by solar radiation and ambient temperature, is the secondary geothermal energy. Here, the temperature varies from freezing conditions to 10–15 °C. In either case, a heat pump is necessary to increase the temperature of the heat source to the desired level, i.e., suitable for a DH system.
In most heat pump applications, geothermal energy utilization has been limited to primary geothermal energy. In Northern Europe and Finland, the geological conditions involve old and stable bedrock, where the upper ground layers have cooled down, and the thermal gradient in the rock is approximately 10–20 °C per km [26]. Hence, harnessing the geothermal energy for DH applications in Nordic conditions requires 1–3 km deep boreholes coupled with the heat pump. Such deep heat boreholes (or deep heat wells) have a temperature ranging between 20–40 °C. In Finland, most of the ground-coupled heat pumps exploit geothermal reserves less than 300 m deep, whereas deeper heat resources have not been exploited. There is one deep heat well, 7 km deep, under the piloting phase at the st1-Fortum site in Espoo, Finland, but the technology has not progressed for commercial use yet. Further, due to a difference in climate, geography and building code, the results obtained from deep heat wells installed elsewhere cannot be applied locally.
To date, there exist only a few studies addressing the thermal behavior of deep well heat exchangers. In this area, the authors in [27] carried out a field test of three 2-km deep heat wells situated in Xi’an, China. The results of the investigation were later matched with the results obtained by simulating the numerical model. Similarly, [28] developed a numerical model to study the thermal performance of a coaxial-shaped deep borehole heat exchanger and replicated the measurements obtained from distributed thermal response test from an installation in Norway. The simulation was done for boreholes in the depth range of 200–1000 m. Recently, a detailed simulation study on the thermal behavior of a 2-km deep heat well in Finnish conditions was accomplished in [29]. The deep heat well performance was analyzed for a period of 25 years, and it was shown to produce about 110 kW heat in a steady state. Moreover, the simulation model developed in [29] was validated using the results presented in [28].
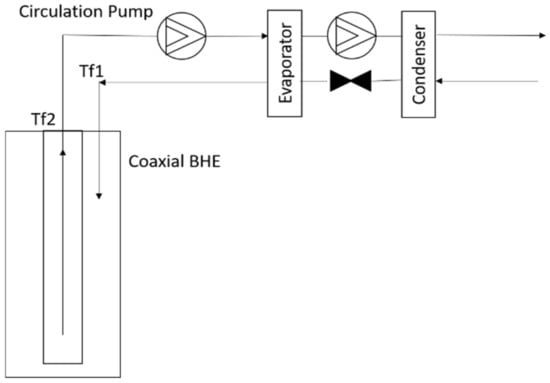
In this work, we utilize the simulation results of the 2-km deep heat well analyzed in the Finnish geological conditions [29]. The reason for using the deep heat well is that its annual heat output is about 30 times more than the conventional 300 m deep well [29]. The deep well heat pump system (DWHP) is simply a combination of a deep heat well and a heat pump. The deep heat well consists of a coaxial tube having an outer and inner pipe incorporating opposite flows, as illustrated in Figure 3. The two pipes are insulated to avoid thermal short-circuiting, which contributes to thermal losses. The DWHP can be used for heat extraction and/or heat injection (thermal storage). In heat extraction mode, a fluid at low temperature enters the well along the outer pipe and exits through the inner pipe. During this flow, the fluid temperature increases, and this heat energy is transferred to the coupled heat pump, which further raises the temperature to the desired level. Contrarily, in heat injection mode, hot fluid enters the well through the middle pipe, transfers energy to the surrounding bedrock and flows back upwards as a cooled fluid through the outer pipe. Hence, the bedrock can be regenerated or charged, and the deep well operates as thermal storage. In both cases, pumping power for fluid flow and compression power for raising the fluid temperature are required, which can be utilized from wind power generation or any other renewable energy.
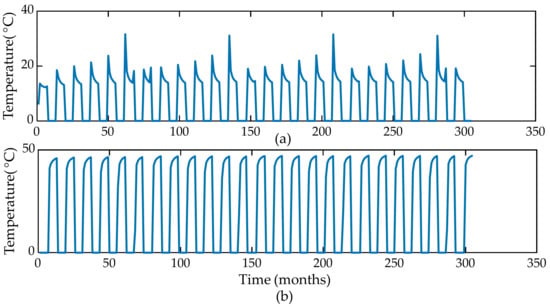
The numerical model of the DWHP was developed in COMSOL Multiphysics (software version 5.4), and the thermal performance in Finnish geological conditions was simulated for a 25-year period with a time resolution of 7.5 h. A detailed description of the model, the physical parameters of the deep heat borehole and the COMSOL modules used can be found in [29,30]. In this work, the operation sequence of the DWHP is six months of heat generation, followed by six months of heat injection. This operation sequence is simulated for flow rates ranging from 0.5 kg/s to 15 kg/s to approximate the relationship between electrical power input and heat power output of the DWHP for both operation modes. Figure 4 illustrates the fluid temperature dynamics in borehole pipes for both cycles at a flow rate of 6 kg/s. Figure 4a portrays the heat extraction cycle where the fluid enters the outer pipe at 6 °C and leaves the borehole through the central pipe at a higher temperature, on average about 14 °C at the end of each extraction cycle. Contrarily, in Figure 4b, during the heat injection phase, hot fluid is injected at 70 °C through the central pipe, and the fluid returns through the outer pipe in the temperature range of 41–46 °C. Such a decline in temperature signifies that the surrounding bedrock absorbs heat. It can also be seen for both phases in Figure 4 that the thermal dynamics of the borehole are faster at the beginning, with a declining trend over the six months cycle. This saturation aspect is explained by the finite thermal conductivity of the bed rock. The temperature variation, depicted in Figure 4, can be converted into corresponding thermal powers.
Figure 4.
Thermal dynamics of deep well heat pump system (DWHP). (a) Fluid temperature in the central pipe during heat extraction. (b) Fluid temperature in the outer pipe during heat injection [12].
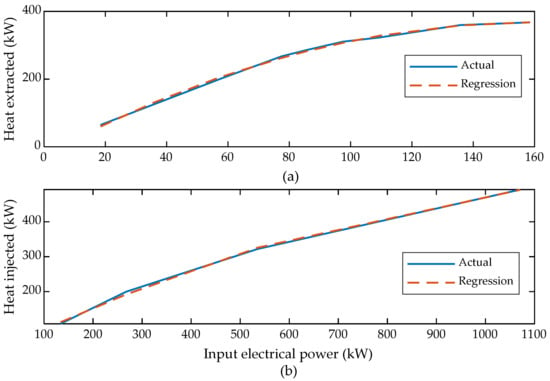
The performance features of the DWHP for heat extraction and injection cases are portrayed in Figure 5. Each characteristic curve is well-approximated using a quadratic regression curve. Note that the minimum input power refers to a fluid flow rate of 0.5 kg/s. The output heat power against each input in Figure 5 corresponds to the steady-state simulated value obtained in the last six-month cycle of the 25-year study period. Figure 5a shows that the extracted heat increases linearly until an input power of 77 kW. Increasing input beyond 77 kW reduces the system coefficient of performance (CoP) in the heat extraction mode. This is explained by the increased pressure drop when the flow rate is increased above 6 kg/s, resulting in larger hydraulic losses, as the losses are proportional to the square of the fluid velocity. In the heat injection phase, the heat absorption capacity of the borehole limits the injection power so that the amount of absorbed heat is always less than the available electricity input, as depicted in Figure 5b. The main limiting factor for the heat injection rate is the heat transfer from the fluid to the surrounding rock. The heat transfer inside the rock is dominated by the low heat conductivity, i.e., increasing the flow rate, and, thus, the convective heat transfer at the fluid–rock interface would not substantially improve the overall heat transfer rate.
2.3. Time Series Aggregation
In the context of power system planning, time period clustering or aggregation is broadly used to shrink the planning horizon by choosing a reduced number of representative time periods (hours, days, weeks, etc.). Hierarchical clustering is used in the current subject matter, as the resultant representative time series is independent of the initialization of the clustering algorithm. In other words, the clusters are reproducible. Further, it allows the inclusion of additional principles regarding how individual clusters are iteratively merged to form new clusters. Additionally, it aggregates only consecutive hours chronologically. Unlike classical clustering approaches, hierarchical clustering uses a dissimilarity measure between each successive pair of clusters to determine which clusters are merged in hierarchical agglomerative clustering. The hierarchical agglomerative clustering used here is centered on Ward’s linkage criterion. Ward’s method involves recursively merging consecutive pairs of clusters that minimally increase within cluster variance [31]. The clustering procedure used in this work is explained below.
At first, the time-dependent parameters are normalized, so that the clustering would be unaffected by the different orders of magnitude of parameters. Then, the time series of all parameters are concatenated in a single time series {Xk}k=1,…,8760. For example, in our case, there are two time-dependent parameters, namely outdoor temperature driving the space heating load and wind speed , to determine the wind power generation, Xk = (). Let R and R’ be the initial and the desired number of time steps (clusters) of the normalized time series Xk, respectively. The steps to arrive from R to R’ clusters are listed below:
- The algorithm initializes as every single entry of the time series as its own cluster. Fix the initial number of clusters r to the total number of time steps, i.e., 8760, in our case.
- Compute the centroid of each cluster K according to Equation (1)
- Evaluate the dissimilarity index between each pair of contiguous clusters K and L according to Ward’s criterion, as in Equation (2). denotes the number of hours in cluster K.
- Based on the dissimilarity matrix, combine the two closest adjacent clusters to form a new cluster (K’, L’); (K’, L’)Є argmin D(K, L), where L belongs to the set of clusters adjacent to the cluster K.
- Update r with r − 1.
- If r = R’, proceed to step VII; otherwise go to step II.
- Replace the clusters formed in Xk with their cluster centroids. The duration of each time step (cluster) in the representative time series is equal to the number of hours forming that cluster.
- The times series is rescaled to obtain the absolute values.
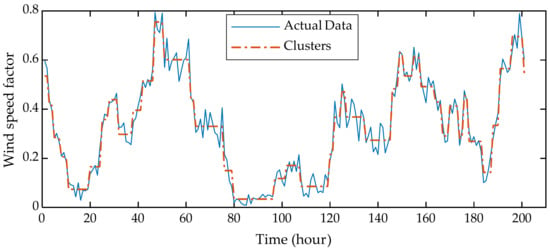
Note that the chronological clustering reduces the number of time-dependent parameters, variables and equations from R, i.e., 8760, to R’. For visualization, Figure 6 illustrates the aggregation of wind speed (p.u.) time series performed using chronological clustering. For a clear depiction, 200 consecutive hours are chosen out of the 8760 h clustered using only 1752 time-steps, i.e., one-fifth of the actual time series. Each candidate cluster is represented by its centroid. It can be seen in Figure 6 that time steps have a variable time duration and the methodology well-approximates the highly fluctuating wind speed profile. Such time series cannot be accurately aggregated using the methodology employing representative weeks, days or hours. In the case of multiple time-dependent parameters, hierarchical clustering is applied to all parameters simultaneously in blocks. In this work, the weather parameters, namely wind speed and outdoor temperature, are clustered using the method described above.
3. Optimization Model
This section presents the mathematical model for optimal sizing of the thermal storage required to satisfy the DH demand of a community by P2H schemes. The storage sizing model is formulated as a mixed-integer linear programming (MILP) model. To keep the model simple, it is formulated as a deterministic optimization problem and planned for a single year. However, the model was tested with different input time series to study the interannual weather variability. The model is presented below.
In the above problem, the objective function (Equation (3)) is the minimization of thermal storage capacity. The electrical power balance and the DH power balance are managed in Equations (4) and (5), respectively. Note that all the DH loads must be satisfied using wind power in order to ensure zero emissions in the DH sector. The thermal storage charging and discharging dynamics are captured in Equation (6). The thermal storage is charged using electricity from wind power generation, where it is stored as heat energy. Due to the nonideal behavior of the storage, some stored heat energy would be lost. Such losses are modeled as a linear function of stored energy weighted with a loss coefficient in Equation (7). The thermal storage charging and discharging powers are capped in Equations (8) and (9), respectively. Constraint (10) states that the stored thermal energy can hover within specified limits only, while Equation (11) guarantees that the final energy level of the thermal storage is greater than or equal to the initial level. Constraint (12) maintains the energy balance of the deep borehole by ensuring that the total heat energy extracted from the borehole is equal to the heat energy injected over a yearly operating cycle. Although the borehole reaches a steady-state operation in 10–15 years of continuous operation, maintaining such energy balance is quite necessary for long-term operation. Constraint (13), using the regression curve depicted in Figure 5, relates the heat output with the electricity input of the DWHP system, i.e., the borehole coupled with heat pump, whereas Equation (14) relates the DWHP input with the extracted heat of the deep borehole, alone. The input limits of the DWHP during heat extraction are defined in Equation (15). The binary variable in Equations (13)–(15) ensures that the DWHP operates according to specified limits, as depicted in Figure 5.
In order to linearize the quadratic term in Equations (13) and (14), special ordered sets of type 2 (SOS2) variables are employed in Equations (16) and (17). SOS2 is a set of variables in which at most two variables take nonzero values, and these variables are adjacent to each other [12,32]. The base of the quadratic term, i.e., a continuous variable, is first represented as a sum of a finite number of breakpoints weighted with SOS2 variables, as in Equation (16). The square of the continuous variables is then evaluated using Equation (17). Another necessary condition is that the sum of SOS2 variables must be equal to unity, which is implemented in Equation (18). The Constraints (19) and (20) describe the operation of DWHP in heat injection mode following the same linearization procedure as in Equations (21)–(23). To ensure that both heat extraction and heat injection do not occur simultaneously, Equation (24) is applied.
Constraints (25) and (26) represent the discrete version of the two-capacity building model that is used to calculate the space heating demand and capture the indoor ambient temperature variation in a detached house. When DR is enabled, the indoor temperature can mutate between a predefined dead band, as modeled in Equation (27). A binary variable is used to relax the upper comfort limit of the indoor temperature if the day gets warm and heating is not needed [33]. It is further supported by Constraint (28), establishing that heating is either zero or turned on to keep the indoor temperature within the thermal comfort band. According to Equation (29), the net flexibility of space heating load for each household is set to zero over the horizon, so that the annual demand remains the same with or without activating DR. Finally, the allowed wind curtailment level can be tuned using Equation (30) to ensure that the thermal storage operation coordinates with the available wind generation.
4. Case Study
4.1. Simulation Parameters
We consider the weather profile of Helsinki, Finland. The wind speed time series at the height of 50 m above sea level was prepared using the framework in [34]. A statistical approach was employed by [34] without any site-specific measured data to simulate 100 yearly wind speed profiles at varying heights for different locations in Finland. The hourly outdoor temperature profile was obtained from the Finnish Meteorological Institute [35]. Having known the wind speed, the corresponding wind power generation could be computed using cut-in speed and rated speed of wind turbine, which can be obtained from the wind turbine datasheet. We considered a wind farm with a rated output power of 700 kW, which was increased in steps. For the DWHP operation, SOS2 variables with three breakpoints were used in both the heat extraction and the injection case.
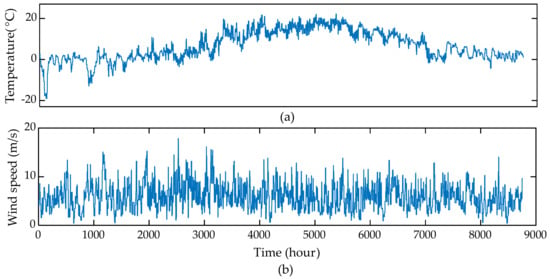
The time-dependent weather parameters spanning 8760 h were clustered using the methodology explained in Section 2.3. Figure 7 illustrates the wind speed and the outdoor temperature profiles using 1252 representative time steps obtained by chronologically clustering the 8760 h. Although, in Figure 7, the time resolution is not hourly, based on the duration of each time step, abrupt variations and the seasonal trend in the input profiles are still appropriately captured by chronological clustering. The reason to cluster such driving factors directly instead of corresponding power levels is that the parameter, such as outdoor temperature, significantly affects the space heating decision variable, thus enables to utilize the clustered data in the DR mechanism separately.
Figure 7.
Input data time series using 1252 representative time steps clustered chronologically. (a) Outdoor temperature. (b) Wind speed at 50 m height.
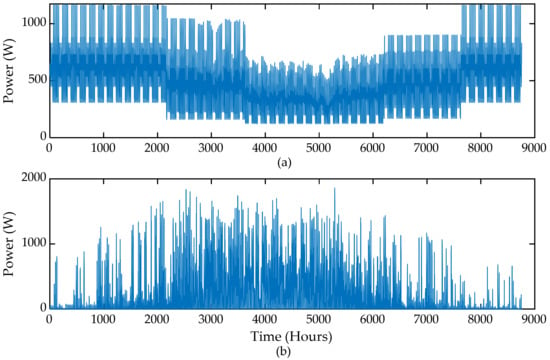
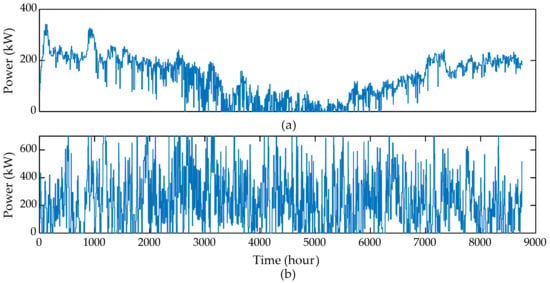
A small-scale community comprising 100 single-family two-floor detached houses, each equipped with the DH facility, was considered. It was assumed that there was an aggregator that owned a wind farm and controlled the operation of the DWHP system and a separate thermal storage in tandem. Moreover, a smart environment was assumed, in which the aggregator was authorized to schedule the DH load of each house and knew the individual load parameters, including thermal comfort levels, by communicating with the home energy management system (HEMS) installed with each end-user. The aggregator operated the resources optimally to minimize the thermal storage size, while covering the DH demand through P2H conversion, only. The calibrated two-capacity model parameters of the prototype house are listed in Table 1 [11,12]. The rated power of the heating unit for each house was distributed around a mean value of 7 kW, while the mean house area was 180 m2. The indoor heating set-point temperature of each household was 21 °C, which could deviate within ±0.5 °C when the DR was activated [25]. To reduce the computational burden further, a set of fewer representative houses with the DH load comprising only space heating load was considered in this study. The domestic hot water consumption was ignored, as well as that the associated DH network losses were negligible. It was assumed that houses were continuously occupied over the study horizon so that there was always a heating demand, and thermal comfort had to be maintained in each time step of the horizon. The heat gains from lighting, equipment, occupants and solar irradiation in a detached house were simulated using the IDA–ICE tool. Such heat gains for a typical house have been depicted in Figure 8. Based on these assumptions, Figure 9 illustrates the corresponding space heating demand and wind power generated using the clustered data shown in Figure 7. The annual DH demand and the wind power production corresponding to the given weather profiles total 1.13 GWh and 2.05 GWh, respectively.
Figure 8.
Heat gains in a detached house. (a) Internal heat gains from lighting, equipment and occupants. (b) Solar heat gains.
Figure 9.
Input data time series using 1252 representative time steps. (a) Total district heat demand. (b) Wind power.
The simulation horizon was one year, i.e., from 1 January to 31 December. The input data included outdoor temperature, wind speed, two-capacity building parameters, households’ thermal comfort preferences and their load parameters. The decision variables comprised thermal storage size, its charging and discharging power, capacity variation, curtailed wind power, the DWHP operation and the DR. The chronological clustering was performed in Matlab prior to simulating the MILP problem (Equations (3)–(30)) in Matlab–GAMS platform. The CPLEX solver was used to solve the proposed model on a Windows desktop computer with a 3.4 GHz Intel Xeon processor and 48 GB RAM. The simulation time related to clustering, for reducing 8760 h to 1252 representative time steps, was about 55 min, whereas the simulation time of the MILP problem (Equations (3)–(30)) employing 1252 representative time steps was about 7 min.
4.2. Simulation Results
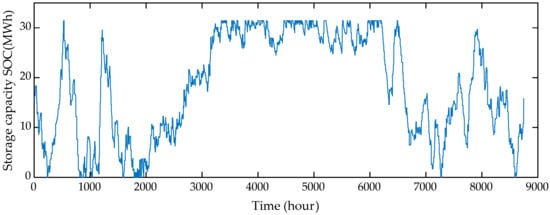
We simulated two cases. The first was the business-as-usual (BAU) case, in which the indoor temperature of each household was strictly fixed to the set-point temperature of 21 °C during the heating period. It was accomplished by setting the thermal comfort band to zero in Equation (27). In the second case, DR was activated, and the indoor temperature could vary within ±0.5 °C from the set-point. For either case, wind curtailment level was set to 10% at the most, and the thermal storage parameters were set as , initial SoC was 50% and loss coefficient μ = 0.2% per hour.
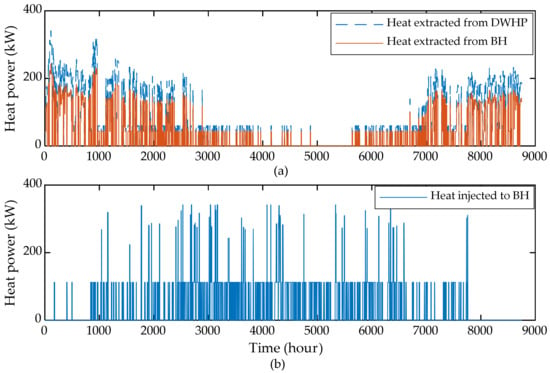
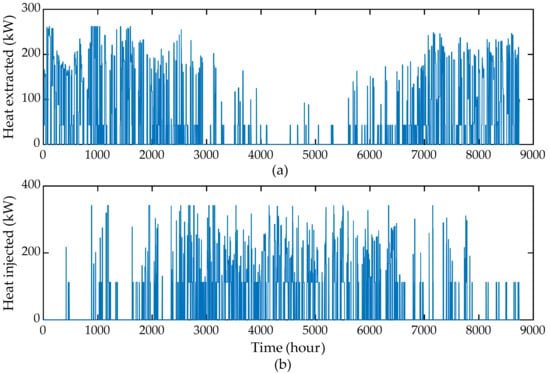
Figure 10 demonstrates the thermal storage evolution for the BAU case. The SoC dynamics of the thermal storage show that its operation was more demanding in the winter season, when the DH demand was also high. On the contrary, storage was occasionally charged or discharged during the summer season, since the heating was turned on and off, depending on the outdoor temperature, as depicted in Figure 9a. The optimal storage size was simulated as 31.44 MWh, which just forms 2.78% of the annual DH demand. Such an outcome is significantly supported by coordinating the DWHP operation with the thermal storage. The heat extracted and injected from the deep heat borehole is depicted in Figure 11. For a comparison, heat extracted from the DWHP is also portrayed alongside. In Figure 11, the difference between the heat extracted from the borehole, alone, and that from the DWHP system represents the heat pump compression power required to further raise the temperature of the heat source. Moreover, heat injection mostly functions during low-demand periods, when thermal storage is also oscillating around its maximum capacity. Simulation results show that a total of 337.3 MWh of heat energy was extracted from or injected into the borehole, alone.
Figure 11.
The DWHP and bore hole operation in the BAU case. (a) Heat extraction. (b) Heat injection.
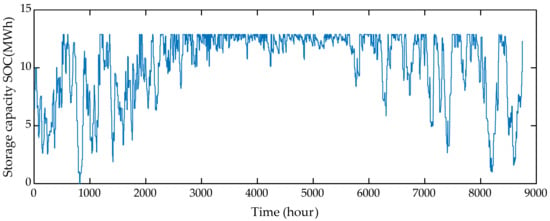
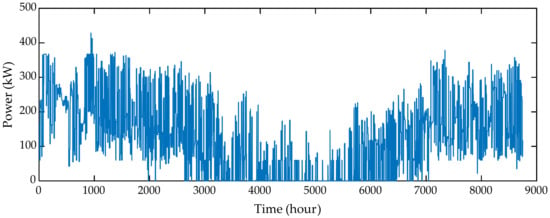
The simulation results show significant improvement when the DR of the heating load was unleashed. The required thermal storage capacity reduced to 12.87 MWh, which is 2.5 times smaller, as compared to that in the BAU case. Moreover, this storage size merely constitutes 1.14% of the annual DH demand. The storage capacity variation over the horizon is illustrated in Figure 12. The DR case results in more heat energy extracted or injected into the bore hole, as depicted in Figure 13, and this energy aggregates to 482.45 MWh per annum. The reason behind this outcome is that the maximum allowed wind power curtailment level was maintained via Equation (30). The BAU case had more opportunities to utilize wind power, due to a higher thermal storage capacity and storage losses, which required more charging energy during the horizon. Contrarily, the thermal storage in the DR case resulted in a relatively smaller capacity and, hence, led to lower storage losses and the charging energy. To maintain the desired curtailment level, more wind power was utilized to operate the DWHP system, instead.
Figure 13.
The deep heat bore hole operation in the DR case. (a) Heat extraction from borehole. (b) Heat injected to borehole.
Figure 14 shows the DH demand during DR, which is quite different from that in the BAU case, as depicted in Figure 9a. In Figure 14, the DH demand has a fluctuating nature, as the heating units are frequently operated to utilize the extreme limits of the predefined thermal comfort band to effectively balance the wind generation level. Nonetheless, the annual aggregated demand remained the same, i.e., 1.13 GWh. Note that, according to the simulation results, even in the absence of a heating period, the indoor ambient temperature remained between 21 °C and 22 °C for both cases.
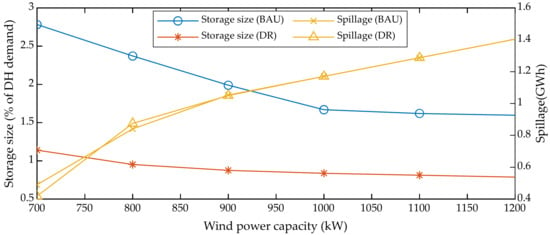
Figure 15 demonstrates the variation in thermal storage size and the wind power spillage with respect to the increasing wind power penetrations. Please note that higher wind power penetrations require higher wind power curtailment limits if the DH demand is the same. For this reason, the wind curtailment limit was increased to 40% to carry out this sensitivity analysis. As can be seen in Figure 15, the required storage capacity remarkably decreases from 2.78% of the aggregated DH demand to 1.7% when the wind generation is oversized to about 140% of the initial capacity in the BAU case. Contrarily, in the DR case, the storage size did not show any significant improvement with the increasing wind power penetrations and rather showed a saturating trend. Figure 15 also proves that the DR of the DH demand is more effective in reducing the storage size when compared with increasing wind power investments, which also results in more wind power spillage.
Figure 15.
Effect of increasing wind power penetration on storage size and wind generation curtailments (Maximum wind curtailment = 40%).
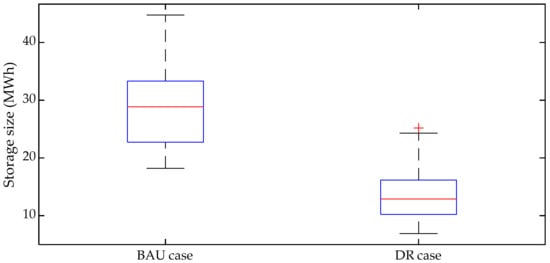
The simulation results presented above were based on a single run of wind speed time series. To account for the variability and uncertain nature associated with the weather parameters, it was important to solve the optimization model for different input data and determine relevant statistics of the results. For this purpose, the model (Equations (3)–(30)) was solved for 19 distinct weather input time series obtained from [34]. Each weather time series data was first clustered chronologically into 1252 representative time-steps, and the model was simulated for both the BAU and the DR case. The mean, standard deviation and confidence bounds were determined, which are summarized in Table 2. The spread, including the interquartile range of the obtained results, are also demonstrated using a box-plot in Figure 16. The higher standard deviation relative to the mean value for the DR case, as listed in Table 2, is explained by the higher extreme values and the outlier, as can be seen in Figure 16. However, the mean value falls within the interquartile range, implying that considering a greater number of inputs would certainly reduce the standard deviation and shorten the interquartile range, as well.
Lastly, the impact of increasing the representative periods on the energy storage size was investigated. Table 3 lists the outcome when the model (Equations (3)–(30)) was simulated with a higher number of representative time periods. The effect on the storage size was negligible when representative periods were increased from 1252 to 2920, but the simulation time increased rapidly. The simulation time nearly doubled at each stage, when more details of the time series were added, as is visible in Table 3. The model became intractable before the number of representative periods reached one-half of the number of hours in the actual time series.
5. Conclusions
Renewable energy sources can play a decisive role in reducing carbon emissions that are proliferating in the district heating sector. However, the inherent intermittency of such energy sources offers a significant integration challenge to the current power system. This work was aimed at mitigating curtailments from the perspective of power systems and simultaneously concluded a zero-emission district heating system by utilizing direct P2H conversion from wind generation. The task utilizes a 2-km-DWHP system and thermal storage coupled with the existing DH system. Accordingly, a framework was proposed to minimize the size of the community-scale thermal storage. The second contribution involved employing chronological time period clustering to accurately solve the optimization problem for a period of one year. The model was applied to a case study in Finland. The main findings are summarized as follows:
- The simulation results proved that considering a small thermal storage in tandem with the DWHP prototype can cover the DH demand of a community. On average, the required optimal size of the thermal storage in the BAU case is just 29.172 MWh, i.e., 2.58% of the DH demand.
- DR can play a complementary role to economically satisfy the DH demand without oversizing the wind generation, which would otherwise result in an increased power spillage. Activating DR reduces the storage size, on average, to 13.99 MWh, i.e., 1.24% of the DH demand.
- The precision of the results was evaluated by increasing the number of representative time periods. The storage size increased slightly when the time series representation increased from 1252 clusters to 2920 clusters. However, the simulation time rose rapidly.
The study was mainly focused on a community-scale district heating demand. In the future, the study shall be extended to the municipality-level district heating demand with more deep heat boreholes, while considering the electrical and the DH network. The heat and power losses in the network would somehow affect the benefits obtained from the proposed model.
Author Contributions
Conceptualization, A.A.B. and M.L.; methodology, A.A.B.; software, A.A.B., M.P.-K. and A.L.; validation, A.A.B.; formal analysis, A.A.B., M.P.-K. and M.L.; investigation, A.A.B.; writing—original draft preparation, A.A.B.; writing—review and editing, A.L., M.P.-K. and M.L.; supervision, M.L.; project administration, M.L.; funding acquisition, M.L. All authors have read and agreed to the published version of the manuscript.
Funding
This research received no external funding.
Conflicts of Interest
The authors declare no conflict of interest.
Nomenclature
| Sets | |
| t, T | index and set of time steps |
| n, N | index and set of households |
| i, I | index and set of breakpoints for SOS2 variables during heat injection |
| j, J | index and set of breakpoints for SOS2 variables during heat extraction |
| Parameters | |
| A1, A2, A3 | Regression coefficients for heat extracted by the DWHP |
| B1, B2, B3 | Regression coefficients for the heat extracted by the deep bore hole alone |
| C1, C2, C3 | Regression coefficients for the heat injected into the deep bore hole alone |
| Thermal capacitance of indoor air (Wh/°C/m2) | |
| Thermal capacitance of building fabric (Wh/°C/m2) | |
| Di, Ej | Breakpoints for SOS2 variables |
| Heat conductance between indoor air and building fabric (W/°C/m2) | |
| Heat conductance between external air and indoor air (W/°C/m2) | |
| Heat conductance between external air and building fabric (W/°C/m2) | |
| Heat conductance between heating air and indoor air (W/°C/m2) | |
| Heat conductance between indoor air and ground (W/°C/m2) | |
| M | a big number |
| Wind power generation in time step t (W) | |
| Maximum charging power of the thermal storage (W) | |
| Minimum and maximum input power of the DWHP during heat extraction, respectively (W) | |
| Minimum and maximum input power of the DWHP during heat injection, respectively (W) | |
| Rated power of the heating unit of house n (W) | |
| Maximum discharging heat power of the thermal storage (W) | |
| Minimum allowed state of charge of the thermal storage (Wh) | |
| Tg | Ground node temperature (°C) |
| Tx | Temperature of heating air (°C) |
| Indoor set-point temperature of household n (°C) | |
| Wind curtailment level | |
| Δ | Width of the temperature dead band (°C) |
| Annual space heating demand of household n (Wh) | |
| Duration of time step t (hours) | |
| Charging and discharging efficiency of the thermal storage | |
| Thermal storage loss coefficient | |
| Solar and internal heat gains in house n in time step t, respectively (W) | |
| Variables | |
| Charging power of the thermal storage (W) | |
| Input power of the DWHP during heat extraction in time step t (W) | |
| Input power of the DWHP during heat injection in time step t (W) | |
| Wind power curtailed in time step t (W) | |
| Discharging power of the thermal storage (W) | |
| Heating power required in house n in time step t (W) | |
| Heat extracted by the DWHP in time step t (W) | |
| Heat extracted and injected to the deep bore hole in time step t, respectively (W) | |
| Maximum capacity and instantaneous capacity of the thermal storage in time t, respectively (Wh) | |
| Indoor ambient temperature of house n in time step t (°C) | |
| Building mass temperature of house n in time step t (°C) | |
| Binary variables for the heat extraction and heat injection, respectively | |
| Binary variable for the heating power of household n in time step t | |
| SOS2 variables for calculating the square of continuous variables | |
| Storage losses of the thermal storage in time step t (Wh) | |
References
- Arabzadeh, V.; Pilpola, S.; Lund, P.D. Coupling Variable Renewable Electricity Production to the Heating Sector through Curtailment and Power-to-heat Strategies for Accelerated Emission Reduction. Future Cities Environ. 2019, 5. [Google Scholar] [CrossRef]
- Statistics Finland. 2019. Available online: https://www.stat.fi/til/asen/2019/asen_2019_2020-11-19_tie_001_en.html (accessed on 12 January 2021).
- Arabzadeh, V.; Mikkola, J.; Jasiūnas, J.; Lund, P.D. Deep decarbonization of urban energy systems through renewable energy and sector-coupling flexibility strategies. J. Environ. Manag. 2020, 260, 110090. [Google Scholar] [CrossRef] [PubMed]
- Helin, K.; Syri, S.; Zakeri, B. Improving district heat sustainability and competitiveness with heat pumps in the future Nordic energy system. Energy Procedia 2018, 149, 455–464. [Google Scholar] [CrossRef]
- Lund, P.D.; Skytte, K.; Bolwig, S.; Bolkesjö, T.F.; Bergaentzlé, C.; Gunkel, P.A.; Kirkerud, J.G.; Klitkou, A.; Koduvere, H.; Gravelsins, A.; et al. Pathway Analysis of a Zero-Emission Transition in the Nordic-Baltic Region. Energies 2019, 12, 3337. [Google Scholar] [CrossRef]
- Mikkola, J.; Lund, P.D. Modeling flexibility and optimal use of existing power plants with large-scale variable renewable power schemes. Energy 2016, 112, 364–375. [Google Scholar] [CrossRef]
- Salpakari, J.; Mikkola, J.; Lund, P.D. Improved flexibility with large-scale variable renewable power in cities through optimal demand side management and power-to-heat conversion. Energy Convers. Manag. 2016, 126, 649–661. [Google Scholar] [CrossRef]
- Pilpola, S.; Arabzadeh, V.; Mikkola, J.; Lund, P. Analyzing National and Local Pathways to Carbon-Neutrality from Technology, Emissions, and Resilience Perspectives—Case of Finland. Energies 2019, 12, 949. [Google Scholar] [CrossRef]
- Ali, M.; Ekström, J.; Lehtonen, M. Sizing Hydrogen Energy Storage in Consideration of Demand Response in Highly Renewable Generation Power Systems. Energies 2018, 11, 1113. [Google Scholar] [CrossRef]
- Bashir, A.A.; Pourakbari-Kasmaei, M.; Contreras, J.; Lehtonen, M. A novel energy scheduling framework for reliable and economic operation of islanded and grid-connected microgrids. Electr. Power Syst. Res. 2019, 171, 85–96. [Google Scholar] [CrossRef]
- Bashir, A.; Pourakbari Kasmaei, M.; Safdarian, A.; Lehtonen, M. Matching of Local Load with On-Site PV Production in a Grid-Connected Residential Building. Energies 2018, 11, 2409. [Google Scholar] [CrossRef]
- Bashir, A.A.; Lund, A.; Pourakbari-Kasmaei, M.; Lehtonen, M. Minimizing Wind Power Curtailment and Carbon Emissions by Power to Heat Sector Coupling—A Stackelberg Game Approach. IEEE Access 2020, 8, 211892–211911. [Google Scholar] [CrossRef]
- Helistö, N.; Kiviluoma, J.; Holttinen, H.; Lara, J.D.; Hodge, B.-M. Including operational aspects in the planning of power systems with large amounts of variable generation: A review of modeling approaches. Wiley Interdiscip. Rev. Energy Environ. 2019, 8, e341. [Google Scholar] [CrossRef]
- Frew, B.A.; Jacobson, M.Z. Temporal and spatial tradeoffs in power system modeling with assumptions about storage: An application of the POWER model. Energy 2016, 117, 198–213. [Google Scholar] [CrossRef]
- Asensio, M.; Meneses de Quevedo, P.; Munoz-Delgado, G.; Contreras, J. Joint Distribution Network and Renewable Energy Expansion Planning Considering Demand Response and Energy Storage—Part I: Stochastic Programming Model. IEEE Trans. Smart Grid 2018, 9, 655–666. [Google Scholar] [CrossRef]
- Dvorkin, Y.; Fernandez-Blanco, R.; Kirschen, D.S.; Pandzic, H.; Watson, J.-P.; Silva-Monroy, C.A. Ensuring Profitability of Energy Storage. IEEE Trans. Power Syst. 2017, 32, 611–623. [Google Scholar] [CrossRef]
- De Sisternes, F.J.; Jenkins, J.D.; Botterud, A. The value of energy storage in decarbonizing the electricity sector. Appl. Energy 2016, 175, 368–379. [Google Scholar] [CrossRef]
- Tejada-Arango, D.A.; Domeshek, M.; Wogrin, S.; Centeno, E. Enhanced Representative Days and System States Modeling for Energy Storage Investment Analysis. IEEE Trans. Power Syst. 2018, 33, 6534–6544. [Google Scholar] [CrossRef]
- Brijs, T.; van Stiphout, A.; Siddiqui, S.; Belmans, R. Evaluating the role of electricity storage by considering short-term operation in long-term planning. Sustain. Energy Grids Netw. 2017, 10, 104–117. [Google Scholar] [CrossRef]
- Pineda, S.; Morales, J.M. Chronological Time-Period Clustering for Optimal Capacity Expansion Planning With Storage. IEEE Trans. Power Syst. 2018, 33, 7162–7170. [Google Scholar] [CrossRef]
- Raventós, O.; Bartels, J. Evaluation of Temporal Complexity Reduction Techniques Applied to Storage Expansion Planning in Power System Models. Energies 2020, 13, 988. [Google Scholar] [CrossRef]
- European Commission: Climate and Energy Framework. Available online: https://ec.europa.eu/clima/policies/strategies/2030_en (accessed on 1 December 2020).
- Bashir, A.A.; Lehtonen, M. Day-Ahead Rolling Window Optimization of Islanded Microgrid with Uncertainty. In Proceedings of the 2018 IEEE PES Innovative Smart Grid Technologies Conference Europe (ISGT-Europe), Sarajevo, Bosnia and Herzegovina, 21–25 October 2018; pp. 1–6. [Google Scholar]
- Alimohammadisagvand, B.; Alam, S.; Ali, M.; Degefa, M.; Jokisalo, J.; Sirén, K. Influence of energy demand response actions on thermal comfort and energy cost in electrically heated residential houses. Indoor Built Environ. 2017, 26, 298–316. [Google Scholar] [CrossRef]
- Decree (1009/2017) of the Ministry of the Environment on Indoor Climate and Ventilation in the New Building, 2017; Ministry of Housing, Energy and the Environment: Helsinki, Finland, 2017.
- Helsingin Geoenergiapotentiaali; Kaupunkiympäristön julkaisuja 2019:25. Helsinki, 2019. Available online: https://www.hel.fi/static/liitteet/kaupunkiymparisto/julkaisut/julkaisut/julkaisu-25-19.pdf (accessed on 10 October 2020).
- Wang, Z.; Wang, F.; Liu, J.; Ma, Z.; Han, E.; Song, M. Field test and numerical investigation on the heat transfer characteristics and optimal design of the heat exchangers of a deep borehole ground source heat pump system. Energy Convers. Manag. 2017, 153, 603–615. [Google Scholar] [CrossRef]
- Holmberg, H.; Acuña, J.; Næss, E.; Sønju, O.K. Thermal evaluation of coaxial deep borehole heat exchangers. Renew. Energy 2016, 97, 65–76. [Google Scholar] [CrossRef]
- Lund, A.; Karvinen, T.; Lehtonen, M. Analysis of deep-heat energy wells for heat pump systems. In Proceedings of the 2020 IEEE PES Innovative Smart Grid Technologies Europe (ISGT-Europe), Hague, The Netherlands, 26–28 October 2020; pp. 574–578. [Google Scholar]
- Lund, A. Analysis of Deep-Heat Energy Wells for Heat Pump Systems; Aalto University: Espoo, Finland, 2019. [Google Scholar]
- Ward, J.H. Hierarchical Grouping to Optimize an Objective Function. J. Am. Stat. Assoc. 1963, 58, 236–244. [Google Scholar] [CrossRef]
- Pourakbari Kasmaei, M.; Asensio, M.; Lehtonen, M.; Contreras, J. Trilateral Planning Model for Integrated Community Energy Systems and PV-based Prosumers-A Bilevel Stochastic Programming Approach. IEEE Trans. Power Syst. 2019, 35, 346–361. [Google Scholar] [CrossRef]
- Alahäivälä, A.; Corbishley, J.; Ekström, J.; Jokisalo, J.; Lehtonen, M. A control framework for the utilization of heating load flexibility in a day-ahead market. Electr. Power Syst. Res. 2017, 145, 44–54. [Google Scholar] [CrossRef]
- Ekström, J.; Koivisto, M.; Mellin, I.; Millar, J.; Saarijärvi, E.; Haarla, L. Assessment of large scale wind power generation with new generation locations without measurement data. Renew. Energy 2015, 83, 362–374. [Google Scholar] [CrossRef]
- Finnish Meteorological Institute, Finland. Available online: http://en.ilmatieteenlaitos.fi/ (accessed on 10 October 2020).
Publisher’s Note: MDPI stays neutral with regard to jurisdictional claims in published maps and institutional affiliations. |
© 2021 by the authors. Licensee MDPI, Basel, Switzerland. This article is an open access article distributed under the terms and conditions of the Creative Commons Attribution (CC BY) license (https://creativecommons.org/licenses/by/4.0/).
