Article

Optimization of Silver Nanoparticle Separation Method from Drilling Waste Matrices

Oil and Gas Institute–National Research Institute, ul. Lubicz 25a, 31-503 Kraków, Poland
*
Author to whom correspondence should be addressed.
Energies 2021, 14(7), 1950; https://doi.org/10.3390/en14071950
Submission received: 12 February 2021 / Revised: 24 March 2021 / Accepted: 29 March 2021 / Published: 1 April 2021
(This article belongs to the Special Issue Integrated Waste Management)

Abstract

:
Significant amounts of produced water, spent drilling fluid, and drill cuttings, which differ in composition and characteristics in each drilling operation, are generated in the oil and gas industry. Moreover, the oil and gas industry faces many technological development challenges to guarantee a safe and clean environment and to meet strict environmental standards in the field of processing and disposal of drilling waste. Due to increasing application of nanomaterials in the oil and gas industry, drilling wastes may also contain nanometer-scale materials. It is therefore necessary to characterize drilling waste in terms of nanomaterial content and to optimize effective methods for their determination, including a key separation step. The purpose of this study is to select the appropriate method of separation and pre-concentration of silver nanoparticles (AgNPs) from drilling wastewater samples and to determine their size distribution along with the state of aggregation using single-particle inductively coupled plasma mass spectrometry (spICP-MS). Two AgNP separation methods were compared: centrifugation and cloud point extraction. The first known use of spICP-MS for drilling waste matrices following mentioned separation methods is presented.

1. Introduction

The special properties of nanoparticles result from their small size and larger surface per unit volume. This increases their reactivity with other molecules. If a given material has nanoparticles in its structure, it is called a nanomaterial. The presence of nanoparticles in the structure contributes to the improvement in the material properties, as it causes most of the properties of nanoparticles to be inherited by these materials. This allows scientists to take advantage of these unique properties in a wide variety of applications [1].
Various nanomaterials and nanoparticle-based devices and tools have revolutionized almost all stages of oil and gas exploration and exploitation. Nanoparticles have been successfully used, for example, in drilling muds, cementing, well stimulation, and enhanced oil recovery (EOR). The viscosity of drilling fluids can be increased by the addition of nanoparticles (NPs). This is particularly important during hydraulic fracturing, as the rock-breaking capacity of the fluid is improved by increasing the viscosity. NPs have been used with success for rheological property improvement and reduction of fluid loss, which is a major concern in drilling operations. Estimation of residual oil saturation can be performed with magnetic nanoparticles such as ferromagnetic nanofluids. Various types of nanoparticles are added to drilling fluids to improve their properties. NPs can enhance fluid thermal stability and increase lubricity, well-bore stability and hole cleaning. The formation of hydrates in the fluid circulation system is also diminished by the presence of NPs. Nanoparticles used as drilling fluid additives are, e.g., TiO2, SiO2, or nanoclay [2,3].
Nanotechnology has attracted attention in improving oil recovery due to its environmentally friendly manner and lower costs. Oil recovery is enhanced as magnetic nanoparticles are introduced into the oil and subjected to an electromagnetic field, which reduces the oil’s viscosity. Nanotechnology-based stabilized foams and emulsions can be employed as EOR conformance control agents. Nanoparticles have also shown promising scale inhibition performance in oil recovery and hydrate recovery facilities [4,5].
Nanotechnology is also used in well cementing processes. Various cement additives are used to upgrade its parameters, including viscosity, setting time, density, and filtration. The addition of nanosilicon and nanoaluminum oxide affects the properties of cement slurries. These components significantly improve the parameters of the hardened cement slurries. The values of the compressive strength of the cement stones, which were formed from slurries containing nanoparticles, were higher, which resulted from the placement of extremely small nanoparticles in the porous spaces. Moreover, nanostructured materials can be used to transport compressed natural gas. In refining, nanomembranes and nanocoatings are used to remove impurities, to separate gas streams, and to suspend oil droplets [6,7,8,9].
Nanoparticles are also commonly used for environmental remediation. They showed great potential in degrading major environmental pollutants due to their excellent catalytic properties. Nanotechnology is also used as a method of remediating heavy metal and hydrocarbon pollution. It is effective, and its application reduces the costs and time needed for large-scale cleaning of contaminated areas and reduces the concentration of pollutants in situ [10].
Metal and metal oxide nanoparticles are broadly applied in the oil and gas industry. They are used at almost every stage of hydrocarbon exploration and exploitation, as additives in drilling mud to trap and control the mobility of fine particles, as a wetting agent during EOR and imaging tank, and as a catalyst [6]. Silver nanoparticles (AgNPs) are one such metal nanoparticle used in the oil and gas industry. An example of the use of AgNPs can be the research conducted by Li et al. [11]. Self-assembling AgNPs with an average diameter of 5 nm were developed during that research. They were then incorporated into kerosene-based fluids. Thermal conductivity measurements were also carried out at three different temperatures: 25, 40, and 50 °C. It turned out that the thermal conductivity of the liquid with the addition of silver nanoparticles was higher than that of the liquid used as the matrix. The reason for this was the improvement in the heat transfer rate due to the increase in Brownian motion of the particles, which was caused by rising temperatures. Silver nanoparticles are also used as coating systems applied to increase the biodeterioration resistance of concrete. Furthermore, the effectiveness of the filtration tests and the rheological properties of the water-based drilling mud increased significantly after adding silver nanoparticles to it [12,13,14,15].
However, such extensive use of nanoparticles in the industry and in various areas of everyday life may result in their appearance in waste. NPs can be released into the environment at every stage of the product life cycle, from production, use, and disposal to recycling processes. Moreover, it is worrying that, once nanomaterials are released into the environment, their properties can change and become harmful or toxic [16,17].
For this reason, the presence of nanowaste raises concerns for human health and the environment from possible release from incineration, from leakage of landfills, or during recycling processing and may lead to an increased concentration of nanomaterials in the environment [7]. Assessing the potential risks of nanowaste requires information on the hazardousness of nanomaterials that can be emitted from waste, data on possible exposure levels, and their environmental fate. Managing nanowaste is a new challenge attracting the attention of many researchers. Currently, many institutions are developing regulations and guidelines for the proper management of nanowaste. These include the Environmental Protection Agency (EPA), the American Society for Testing and Materials (ASTM), and the International Standardization Organization (ISO) [18,19,20,21,22,23,24,25,26,27].
Due to the wide variety of nanomaterials available, one general procedure of disposal will not be sufficient. In addition, the disposal of nanomaterials should be carried out very carefully to minimize the risk to human health and the environment from their release. Recycling and disposal of nanowaste are very important issues that, if left unattended, may become problematic in the future. Before developing appropriate disposal practices, it is very important to know the properties of each nanowaste and to quantify its volume. Determining the exact amount of nanowaste is very difficult because of the very diverse uses of nanotechnology and varied geographic locations of its use. There is some work available on nanowaste treatment methods, but the main challenge is in increasing their low efficiency. In some cases, the effectiveness of nanowaste removal is 0–40%, which is very low [28].
Moreover, nanomaterials can interact with waste components or pollutants more quickly due to their specific properties such as large surface area, biological reactivity, shape, and size. The problem with nanomaterials is more serious than with bulk materials because the classification of nanowaste is challenging. In the case of nanowaste, we are dealing with both organic and inorganic, and natural and synthetic materials, as well as materials of very different shapes (spheres, wires, clusters, etc.). Quantification of nanoparticles is very difficult due to the many types of nanomaterials used, their different origins, and the low content of nanoparticles that are present in environmental matrices of often unknown and complex composition [29].
Risk assessment for nanowaste is still poorly understood. The assessment of environmental risks caused by NPs requires usage of effective quantitative analytical methods [7,8]. The following problems may arise during the characterization of nanoparticles in waste samples [30]:
(a)
Losses may arise in the solid waste sample preparation stage. Sample homogenization and fragmentation, e.g., during grinding, may change the matrix structure of the starting material.
(b)
Due to the organic–inorganic nature of nanomaterials, their characterization requires the use of various analytical methods.
(c)
A broader characterization of nanoparticles requires the use of several types of methods. For example, a Scanning Electron Microscope (SEM) can provide structure information but cannot quantify NPs
(d)
The concentrations of the analyzed nanoparticles are often very low, close to or below the detection limit of the instruments used.
(e)
The complex and unknown matrix of the samples analyzed can make it very difficult to correctly analyze NPs.
One of the key steps in the nanoparticle determination procedure is the separation of nanoparticles from the matrix. Techniques for separating nanoparticles should take into account, inter alia, selectivity for the type of nanoparticles and the influence of matrix interferents.
For the separation of nanoparticles, among others, ultrafiltration, cloud point extraction (CPE) centrifugation, solid phase extraction (SPE), and flow fractionation in an asymmetric force field (AF4) are used [31].
Cloud point extraction is one of the most commonly used sample preparation procedures for the determination of NPs from environmental samples. CPE has many advantages (e.g., high extraction efficiency and pre-concentration factor, easy handling, low cost, and nontoxicity), making it ideal for extracting contaminants from a variety of environmental samples. High extraction efficiency can be obtained by optimizing the CPE parameters, and the presence of humic acid and silver ions did not affect the extraction procedure. Cloud point extraction is a method using non-ionic surfactants. These compounds, when introduced into the aqueous solution containing the substance to be extracted, have the ability to precipitate in the form of a separate, analyte-rich phase at a certain (relatively high) temperature. Precipitation of the extract is observed as a characteristic turbidity of the solution. [32]. CPE has been shown to separate nanoparticles efficiently [33,34,35]. Torrent et al. [33] used this technique for AgNP separation from soil leachates. CPE was used to separate AgNPs from samples containing large amounts of Ag(I) after 3 weeks of contact with silver nanoparticles. Majedi et al. [35] applied this technique for environmental waters. They managed to achieve recoveries in the range of 60–108% for CuONP separation by cloud point extraction. Despite the use of CPE for many types of environmental samples, it has not been used for drilling waste, which is complex, heterogeneous, multi-component mixtures of chemicals, both inorganic and organic. They may contain heavy metals such as nickel, cadmium, arsenic, barium, chromium, mercury, iron, vanadium, etc. Drilling waste often contains high contents of soluble salts, petroleum hydrocarbons, and lubricants, which may cause great concern to the environment [36].
Centrifugation is another method of separating nanoparticles from environmental matrices. It is a common approach in separating or pre-concentrating nanoparticles in water samples. Particles that are denser or larger settle more quickly and thus are separated from particles of lower size and density and of smaller sizes. The separation efficiency of this technique depends on the shape, size, density, and viscosity of the matrix [37].
Two NP separation methods, such as CPE and centrifugation, are tested in this study. Centrifugation was selected because it is a cheap, quick, easy-to-implement method. In addition, it has been used in previous studies to separate NPs from environmental samples, e.g., wastewater or sewage sludge, which, like waste, also has a complicated and often unknown matrix composition [33,34,35]. The second separation method, CPE, was chosen because it is easy to use, nontoxic, and resistant to silver ions in the matrix. This technique has been successfully used by other researchers to separate NPs from environmental samples (e.g., wastewater, surface water, or sewage sludge) [31].
The main aim of this study was to select the optimal method of separation and pre-concentration of silver nanoparticles (AgNPs) from drilling wastewater samples and to determine their size distribution along with the state of aggregation using single-particle inductively coupled plasma mass spectrometry (spICP-MS). The issue of the separation of nanoparticles from drilling waste samples is novel. According to the authors’ knowledge, this topic has not been discussed in the literature before. The research carried out so far concerned other environmental matrices.

2. Materials and Methods

2.1. Chemicals

Silver nanoparticles from Alfa Aesar, stabilized with 2 mM sodium citrate, were used for the tests. During the research, the following nanoparticles were used: AgNPs with a diameter of 100 nm ± 3 nm and a concentration of 0.02 mg/mL (1), silver nanoparticles with a nominal diameter of 20 nm and a concentration of 0.02 mg/mL (2), AgNPs with a nominal diameter of 40 nm ± 3 nm and a concentration of 0.02 mg/mL (3), and silver nanoparticles with a size of 60 nm ± 3 nm and with a concentration of 0.02 mg/mL (4) were diluted in demineralized water to 100 ng/L. The nebulization efficiency was determined with the use of (4). The solutions were not stored or preserved and were made on the day of analysis. All solutions and samples were diluted to 10–100 ng/L in deionized water prior to testing. To ensure homogeneity (before dilution and prior to analysis), the solutions and samples were placed in an ultrasonic bath for 10 min with the addition of cooling cartridges. Silver standard solution at a concentration of 0.991 ± 0.003 mg/L was purchased from Merck (Darmstadt, Germany) and diluted to 1 µg/L. TritonX-114 and sodium thiosulfate Na2S2O3 were purchased from Sigma Aldrich (St. Louis, MI, USA). Ultrapure nitric acid HNO3 was obtained from ROMIL Ltd. (Cambridge, MA, USA).

2.2. Instrument

The Agilent 7900 mass spectrometer with MassHunter Workstation software and the Single Particle Application module was used for our research. The samples were introduced into the apparatus using a peristaltic pump and a tube with 1.02 mm internal diameter. The sample flow rate was set at 0.346 mL/min. A MicroMist nebulizer, a quartz burner of 1.0 mm, and nickel cones were used for AgNP determination.
The sample introduction system was rinsed with 1% HNO3 solution before and after nanoparticle analysis. The internal standard was not used. The ICP-MS spectrometer calibration was performed daily with an Agilent tuning solution (with a concentration of 1 µg/L; containing Li, Co, Y, Tl, Ce, and Ba in a 2% HNO3 solution).
The instrument settings used during the AgNP analysis are shown in Table 1.

2.3. Drilling Waste Samples Preparation

In this publication, testing was based on the samples of drilling wastes, a brief description of which is presented in Table 2. The drilling waste samples come from the 2019–2020 exploration and production of hydrocarbon fields in Poland.
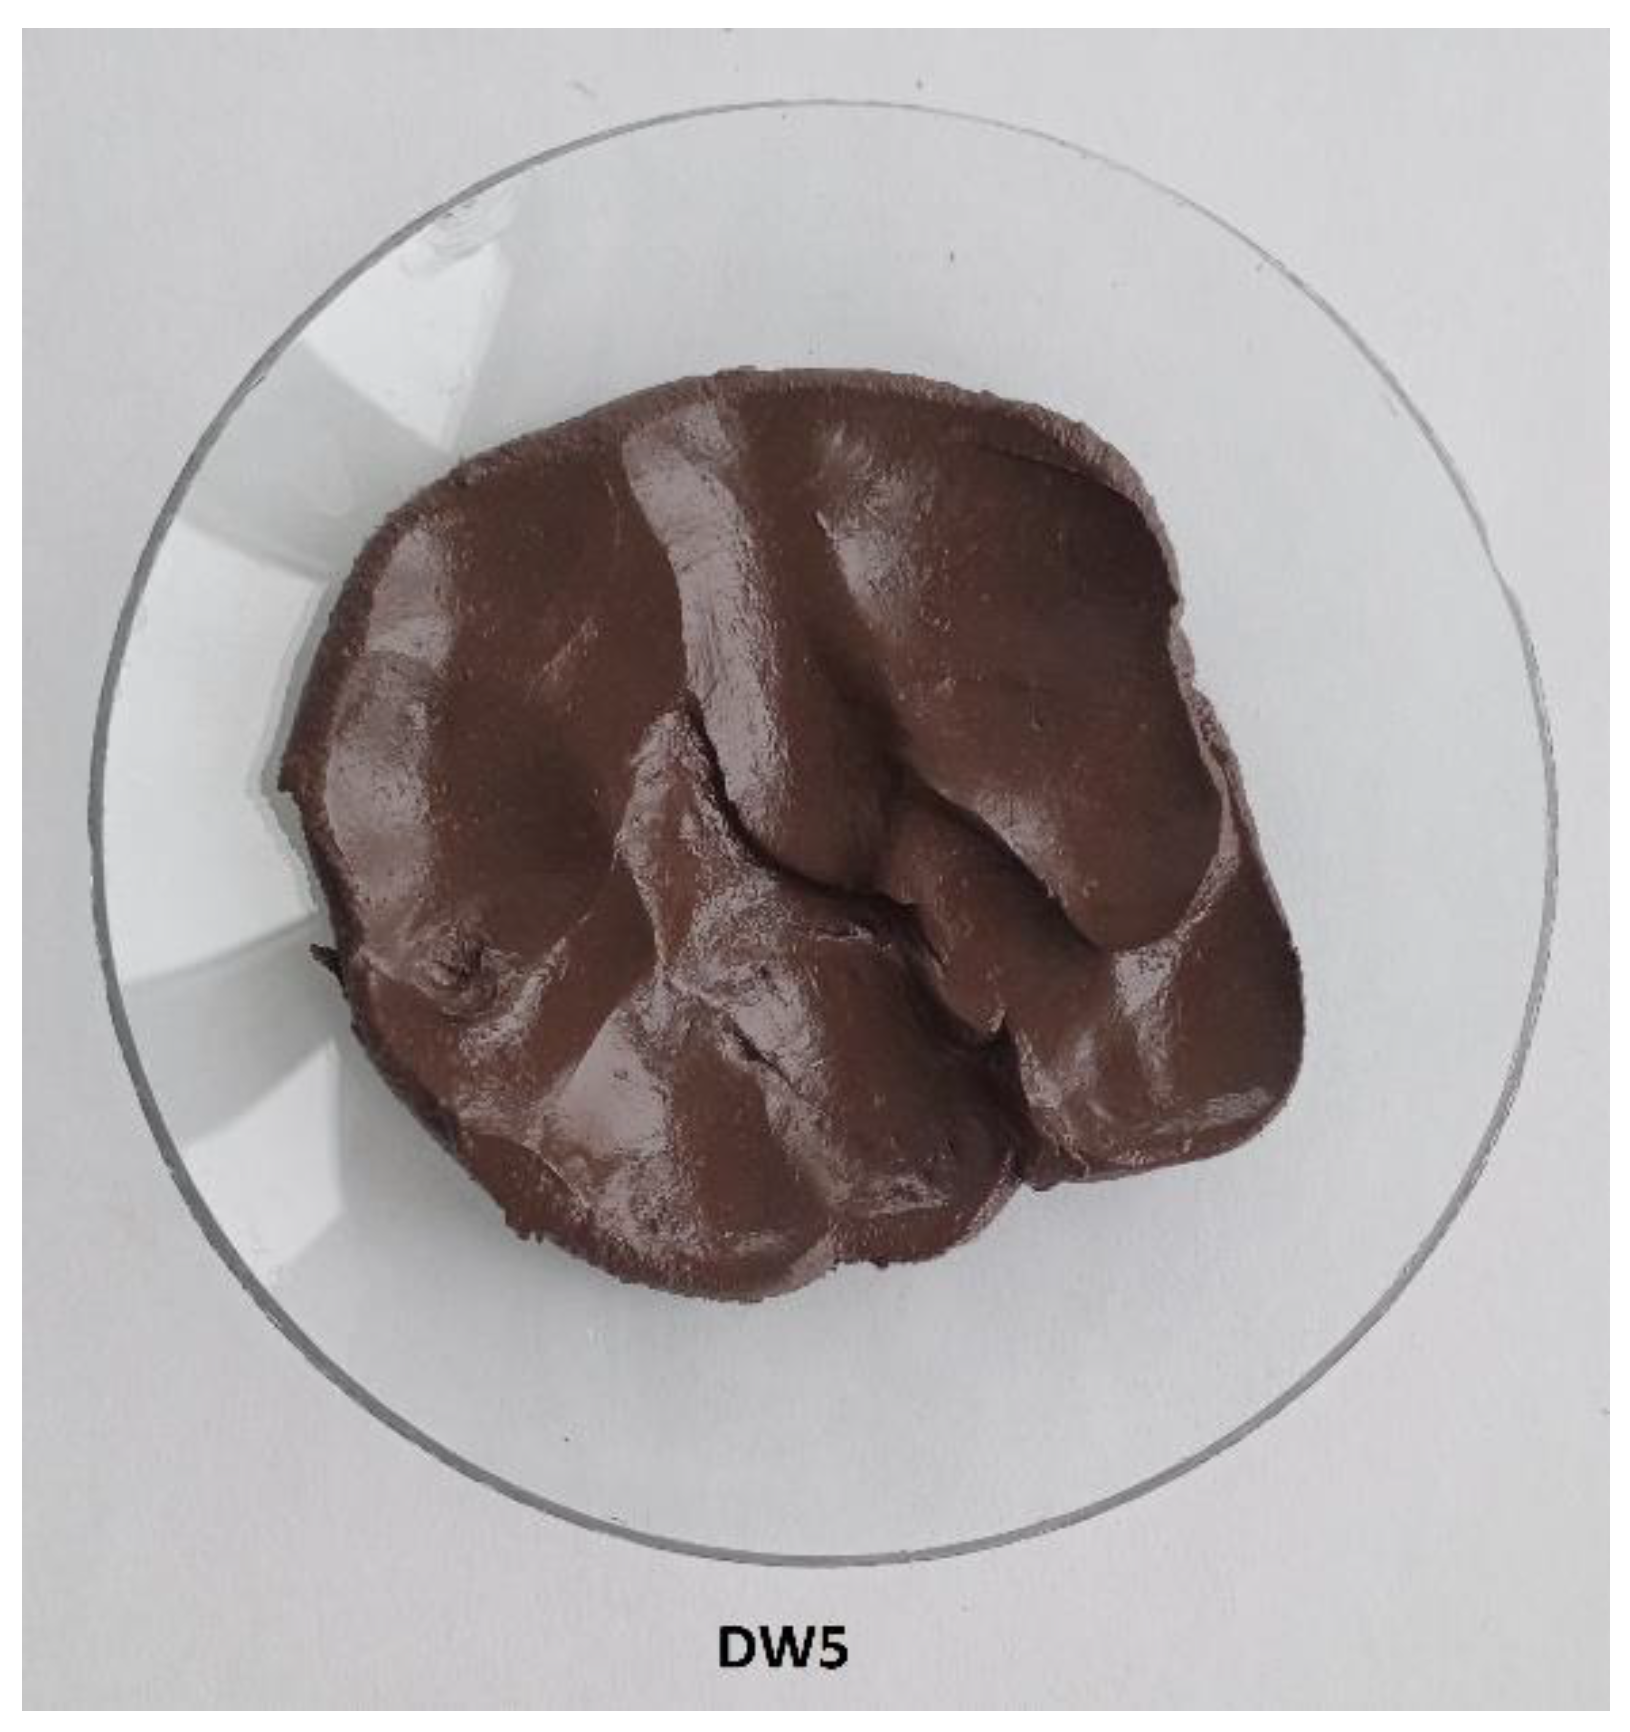
The drilling waste used was produced in a technological process where three types of drilling fluids, synthetic, potassium-polymer, and barite, were used. The tested waste was characterized by different compositions, consistencies, and colors and came from different stages of the drilling process. The abovementioned drilling wastes and their water extracts were used as a matrix material for tests allowing us to optimize the process of separating silver nanoparticles from the drilling wastes matrix. Figure 1, Figure 2 and Figure 3 present 3 photographs of the DW1–DW5 drilling waste used in this study.
The studied drilling wastes were assigned the appropriate waste codes from Table 1. The catalog of wastes by group, subgroup, and type, with indication of hazardous wastes, is defined in the Regulation of the Minister of Climate of 2 January 2020 on the catalog of wastes (Journal of Laws 2020 item 10) [38]. According to the annex to this regulation, wastes resulting from exploration, extraction, and chemical and physical processing of ores and other minerals are included in the group code 01, which comprises five subgroups. Wastes generated in exploration and exploitation of hydrocarbon deposits are usually classified as follows:
  • 01 01 02 (wastes from the extraction of minerals other than metal ores),
  • 01 04 12 (this group includes wastes from washing and cleaning of minerals other than those mentioned in 01 04 07 and 01 04 11),
  • 01 05 05* (petroleum-containing drilling fluids and wastes),
  • 01 05 06* (waste and drilling fluids that contain dangerous substances),
  • 01 05 07 (barite-containing drilling fluids and wastes other than those mentioned in 01 05 05 and 01 05 06),
  • 01 05 08 (chloride-containing drilling fluids and wastes other than those mentioned in 01 05 05 and 01 05 06), and
  • 01 05 99 (other wastes not listed).
As shown in Figure 4, in order to optimize the method of separating silver nanoparticles from a matrix of various types of drilling waste, tests of two methods of nanoparticle separation (centrifugation and CPE) were planned. These two methods were used to separate silver nanoparticles from four types of drilling waste. To enable evaluation of the efficiency of the extraction of nanoparticles present in the waste, known amounts of AgNPs were added to the matrix (such as drilling waste or water extracts of drilling waste) and, then, the efficiency of a given extraction type was tested by changing the extraction parameters (centrifugation time and speed). The exact method of preparing the samples for testing and the extraction itself is presented below.
Drilling waste samples with codes 01 05 05*, 01 05 06*, 01 05 07, and 01 05 08 were subjected to analysis in this study. Waste samples DW1–DW4 were used as matrix materials to produce samples enriched with silver nanoparticles of different sizes. To prepare the silver nanoparticle-enriched samples, 0.5 g of each waste sample (DW1–DW4) was weighed twice into the tube used for centrifugation. Then, 20 mL of the AgNP solution with a concentration of 1 mg/L and a particle size of 60, 80, or 100 nm was added to each tube. The whole mixture was stirred by rotary motion (35 rpm) at room temperature (22 ± 2 °C) for 2 h. The samples were then centrifuged for 8 min at 3500 rpm, and after pipetting off the filtrate, they were dried overnight in a dryer at 65–70 °C. The samples were stored in a refrigerator for 3 weeks. Next, desorption of silver nanoparticles from the previously prepared samples was carried out. For this purpose, 15 mL of water was added to the waste sample and stirred in a rotary motion for 24 h (at 22 °C), wrapped in aluminum foil, and then centrifuged at 2800 rpm (12 min). The extract was pipetted off, and one of the prepared samples was subjected to CPE and the other was subjected to centrifugation (2800, 12 min). The prepared waste extracts enriched with AgNPs were then analyzed on spICP-MS. The samples obtained in this way were designated as “DW(1–4)-E” in further tests.
For CPE extraction, 9.5 mL of the filtrate was measured into a centrifuge tube. The pH of the sample was brought to 3.5 (using 0.05 M HNO3), and then, 100 µL of 0.05 M sodium thiosulfate (Na2S2O3) was added along with 200 µL of 5% Triton X-114. The tube was shaken vigorously for 1 min and then placed for 30 min in a water bath at 40 °C. The samples were centrifuged (5 min, 2000 rpm) and analyzed for spICP-MS.
Water extracts of the DW1–DW5 wastes were also tested for silver content and particle size distribution. Water extracts of DW1–DW5 wastes from oil and gas industry operations were prepared in accordance with PN-EN 12457-2:2006 [39] and PN-EN 12457-4:2006 [40] and were stored in the absence of light at 2–5 °C. The samples obtained in this way were designated as “DW(1–5)-W” in further tests.

3. Results

The results obtained when selecting the optimal Ag nanoparticle separation parameters from samples of drilling waste extracts enriched with AgNPs (obtained after the desorption of nanoparticles from drilling waste) and water extracts of drilling waste (without AgNPs and with the addition of 60 nm AgNPs) are presented below. The studies conducted for the samples of drilling waste extracts enriched with AgNPs verified the separation of AgNPs from the matrix by CPE and centrifugation (2800 rpm, 12 min). On the other hand, for samples of water extracts of wastes enriched with AgNPs, optimal separation parameters were selected by centrifugation (time and speed).

3.1. Water Extracts of Drilling Waste—Centrifugation, DW(1–5)-W

As a first step, particle size distribution was measured in samples of waste water extracts constituting the matrix for the study (without AgNPs added), to which AgNPs were added in a further step of the study. The particle size distribution for the prepared water extracts was measured using spICP-MS.
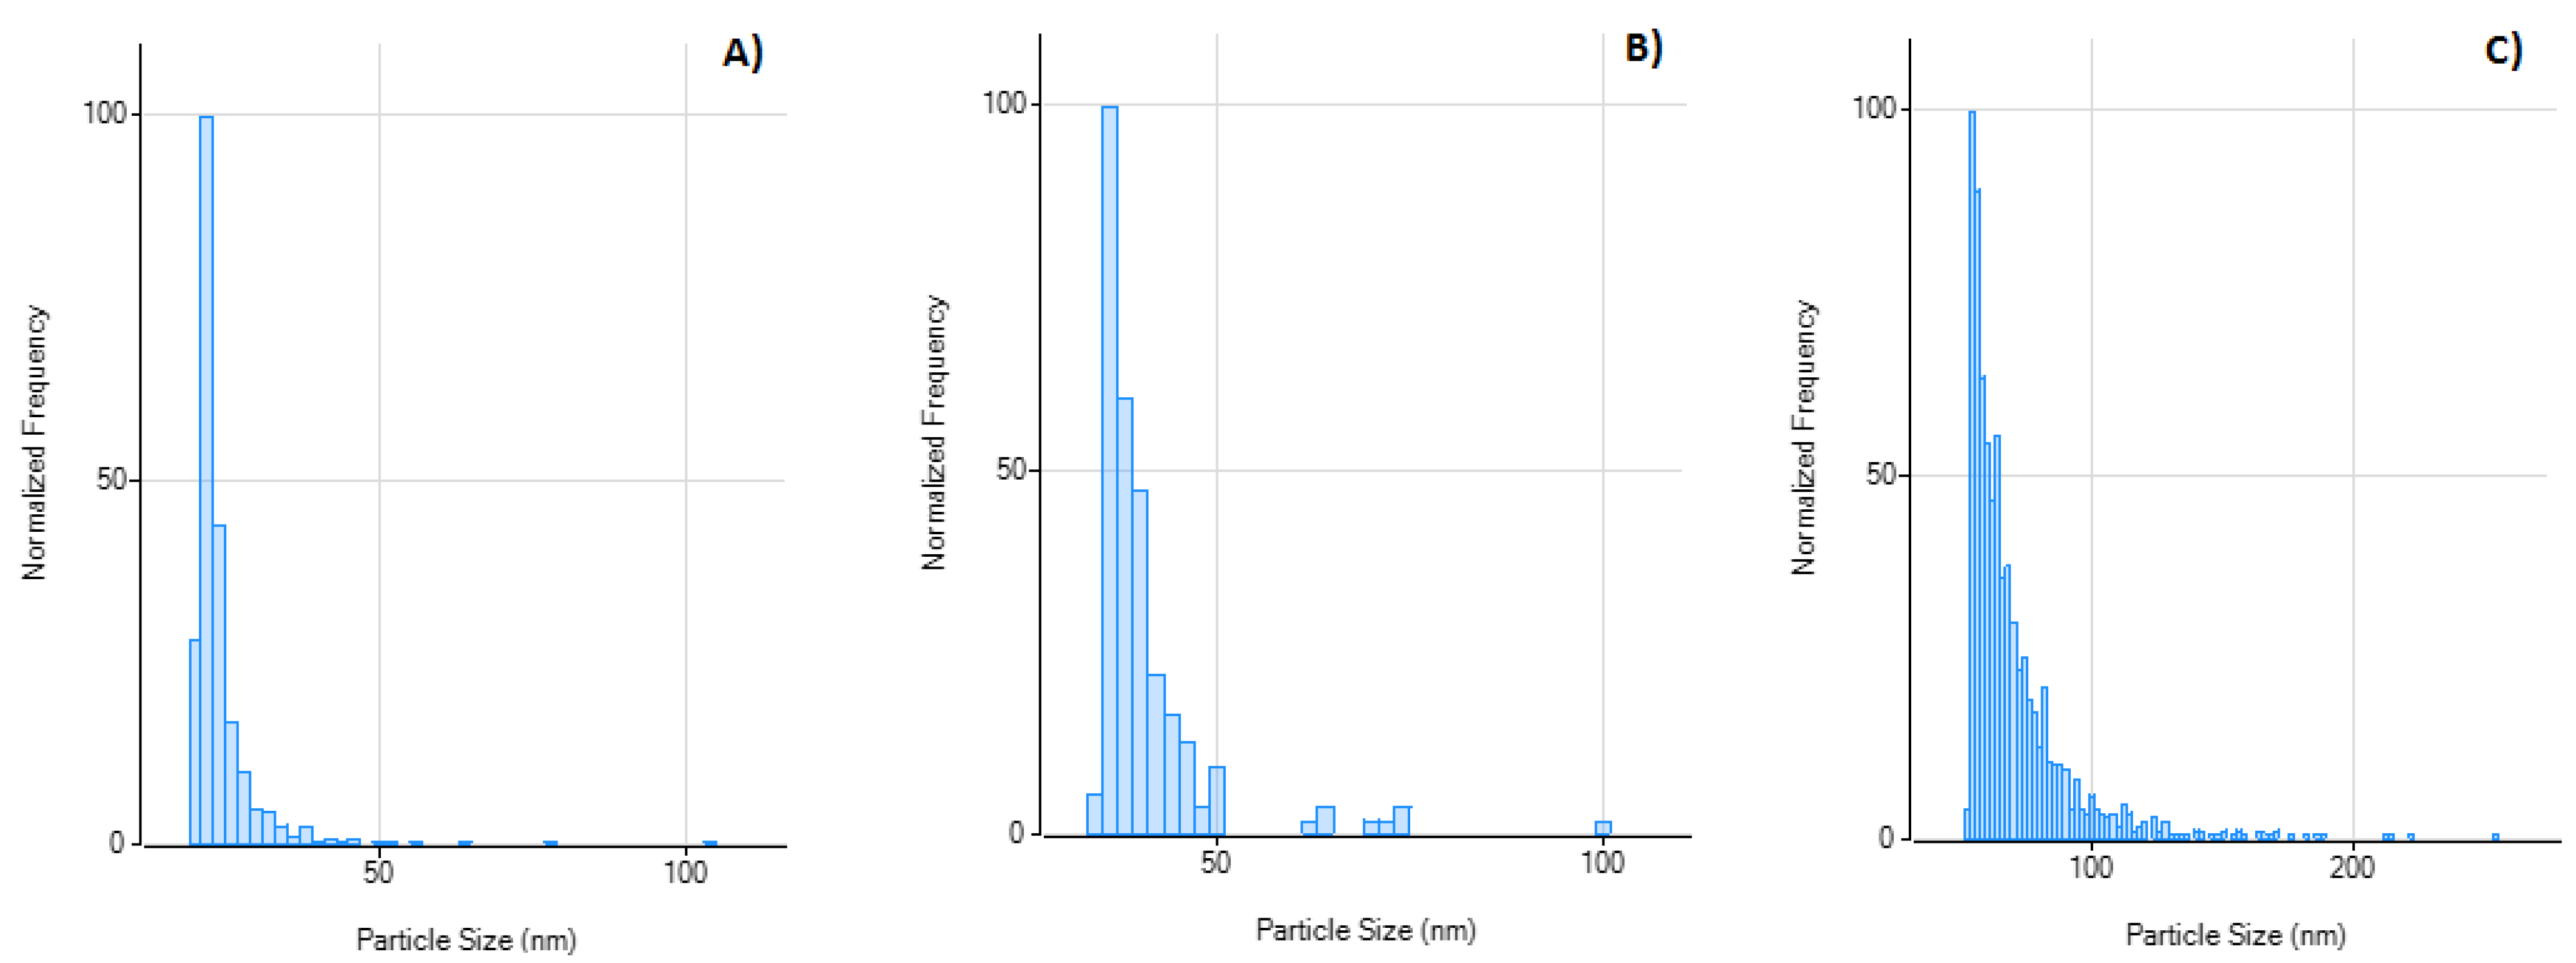
The nano-range silver particle size distribution in drilling waste is very wide. Particles smaller than 50 nm dominate in the analyzed DW1-W, DW2-W, and DW3-W drilling waste extracts. The most diverse waste extract in terms of particle size in the nanometric range is DW3-W (Table 3, Figure 5).
The next stage of the study was adding silver nanoparticles (60 nm) to the previously tested matrices of water extracts of drilling waste and then separating them from the matrix by means of centrifugation, optimization of the separation process by selecting the appropriate time and velocity of centrifugation, and their characterization by means of spICP-MS.
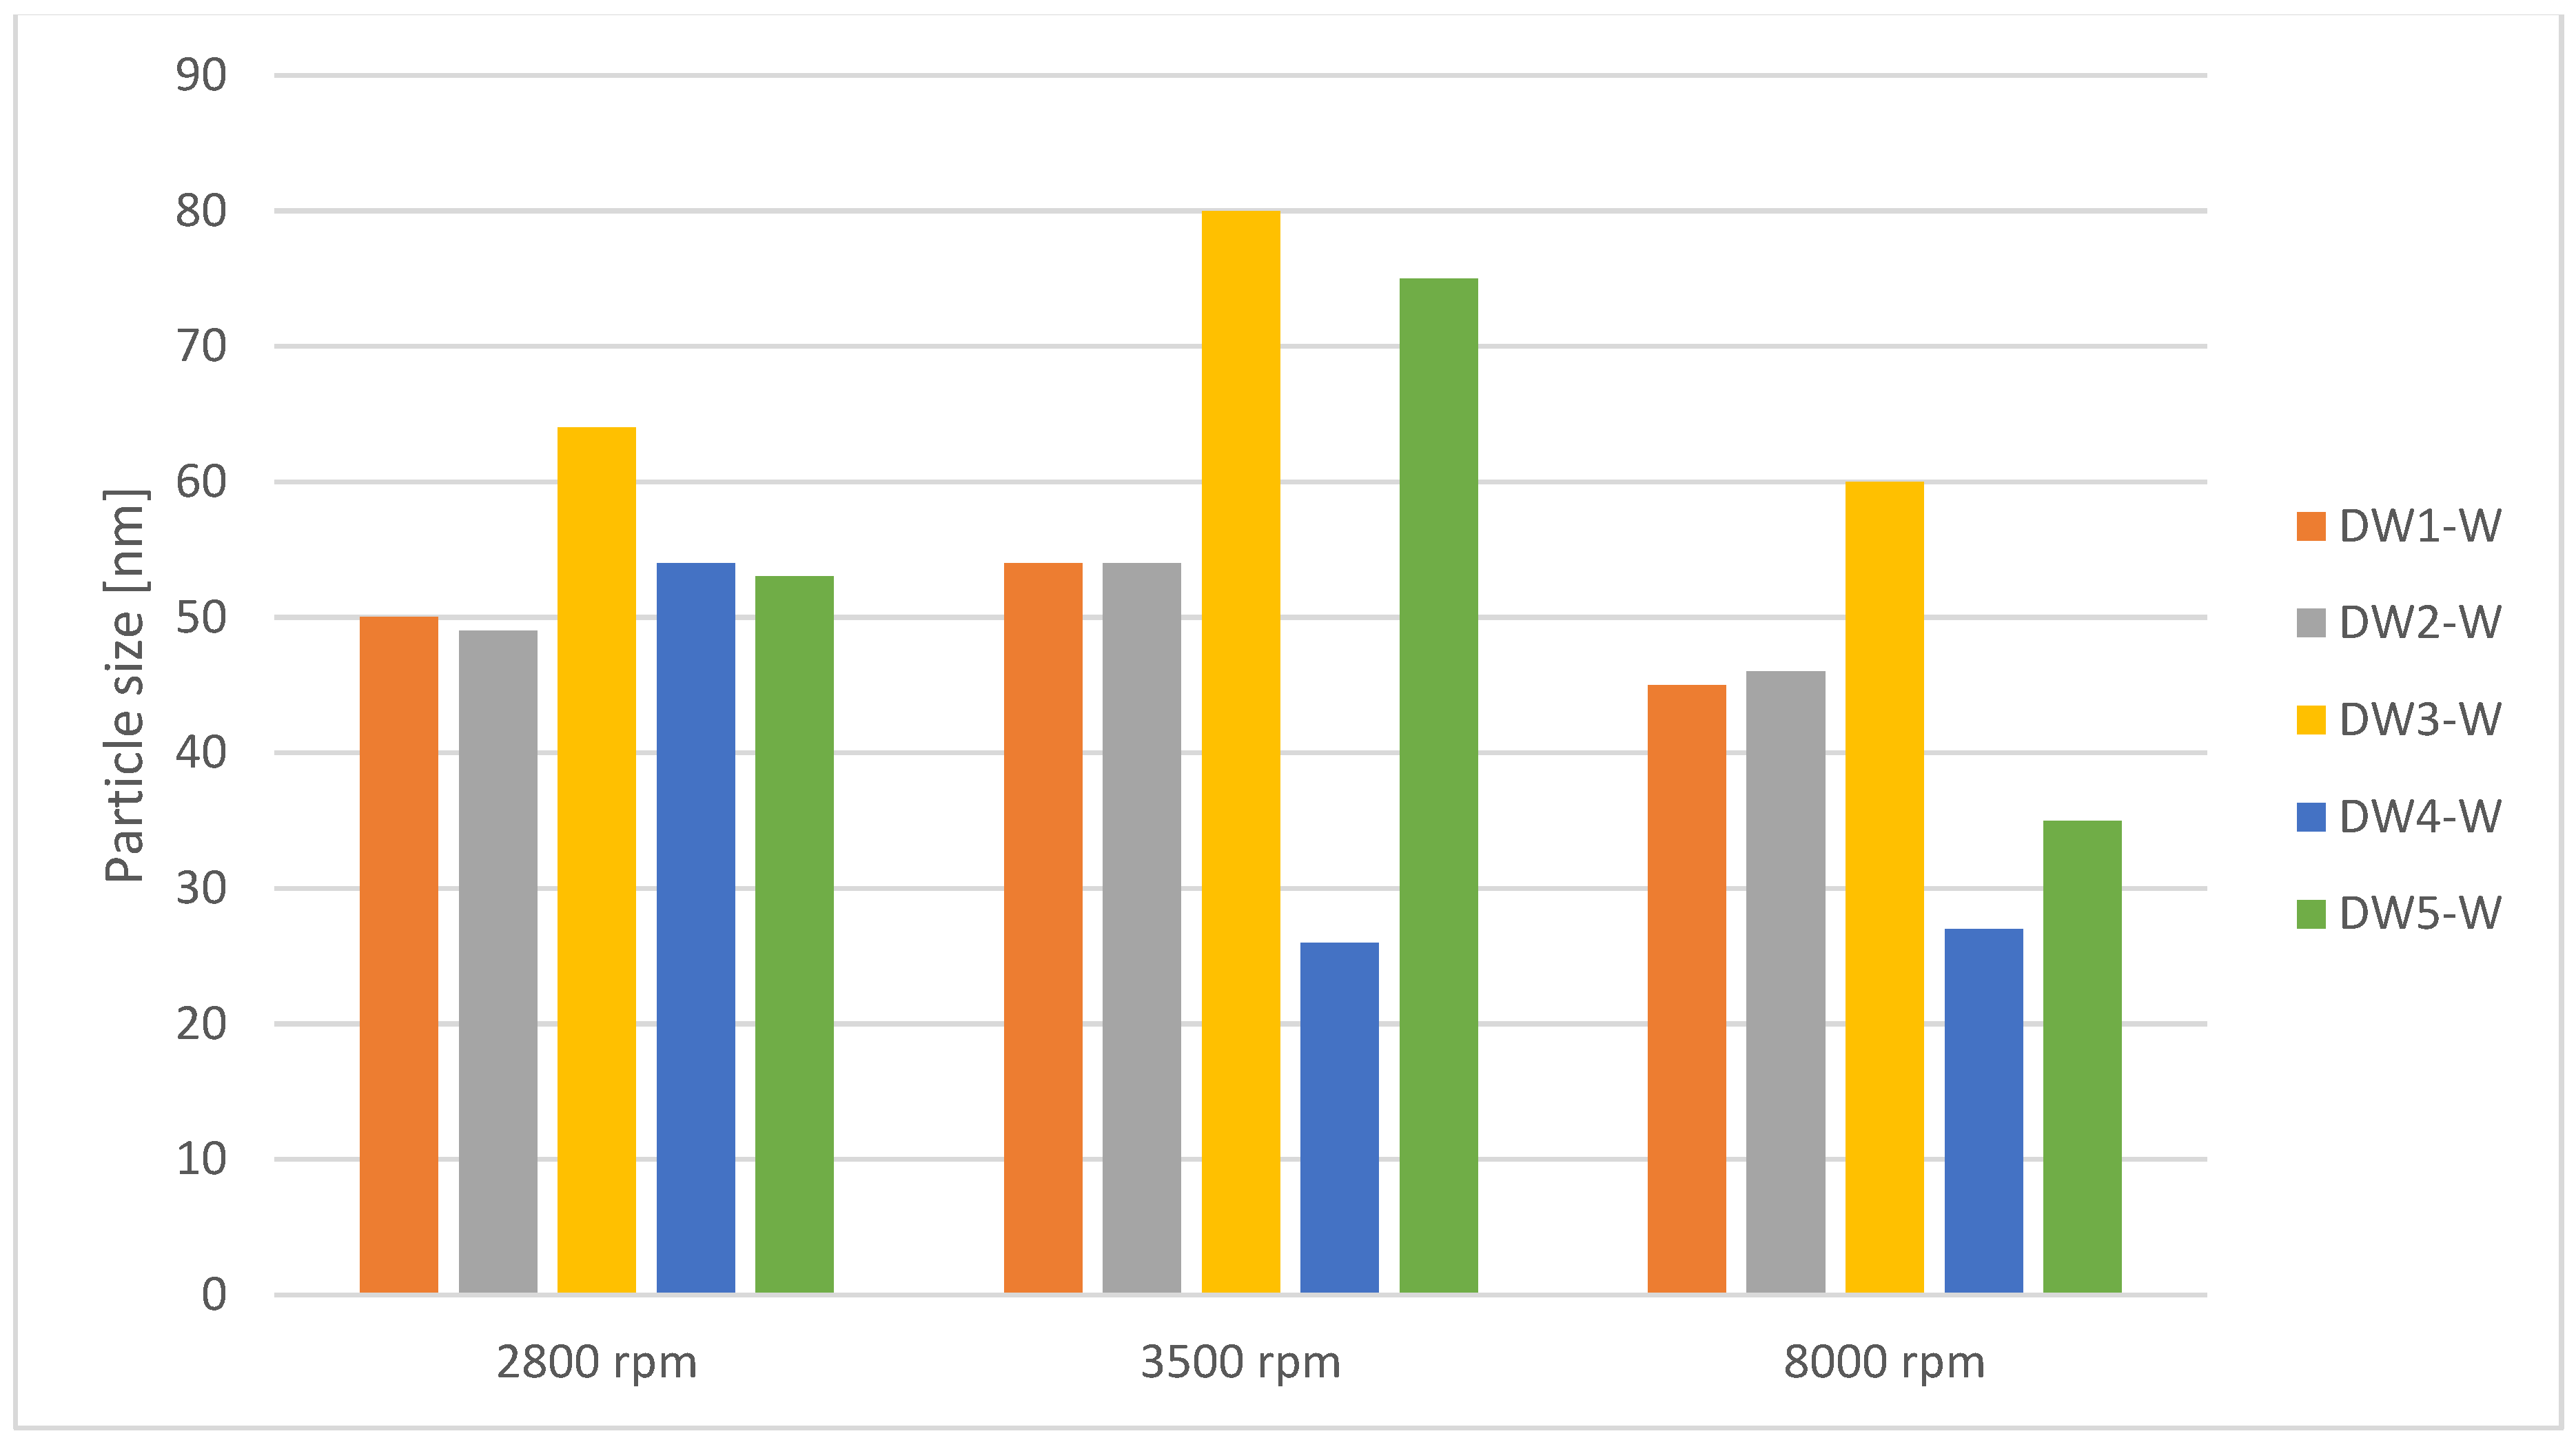
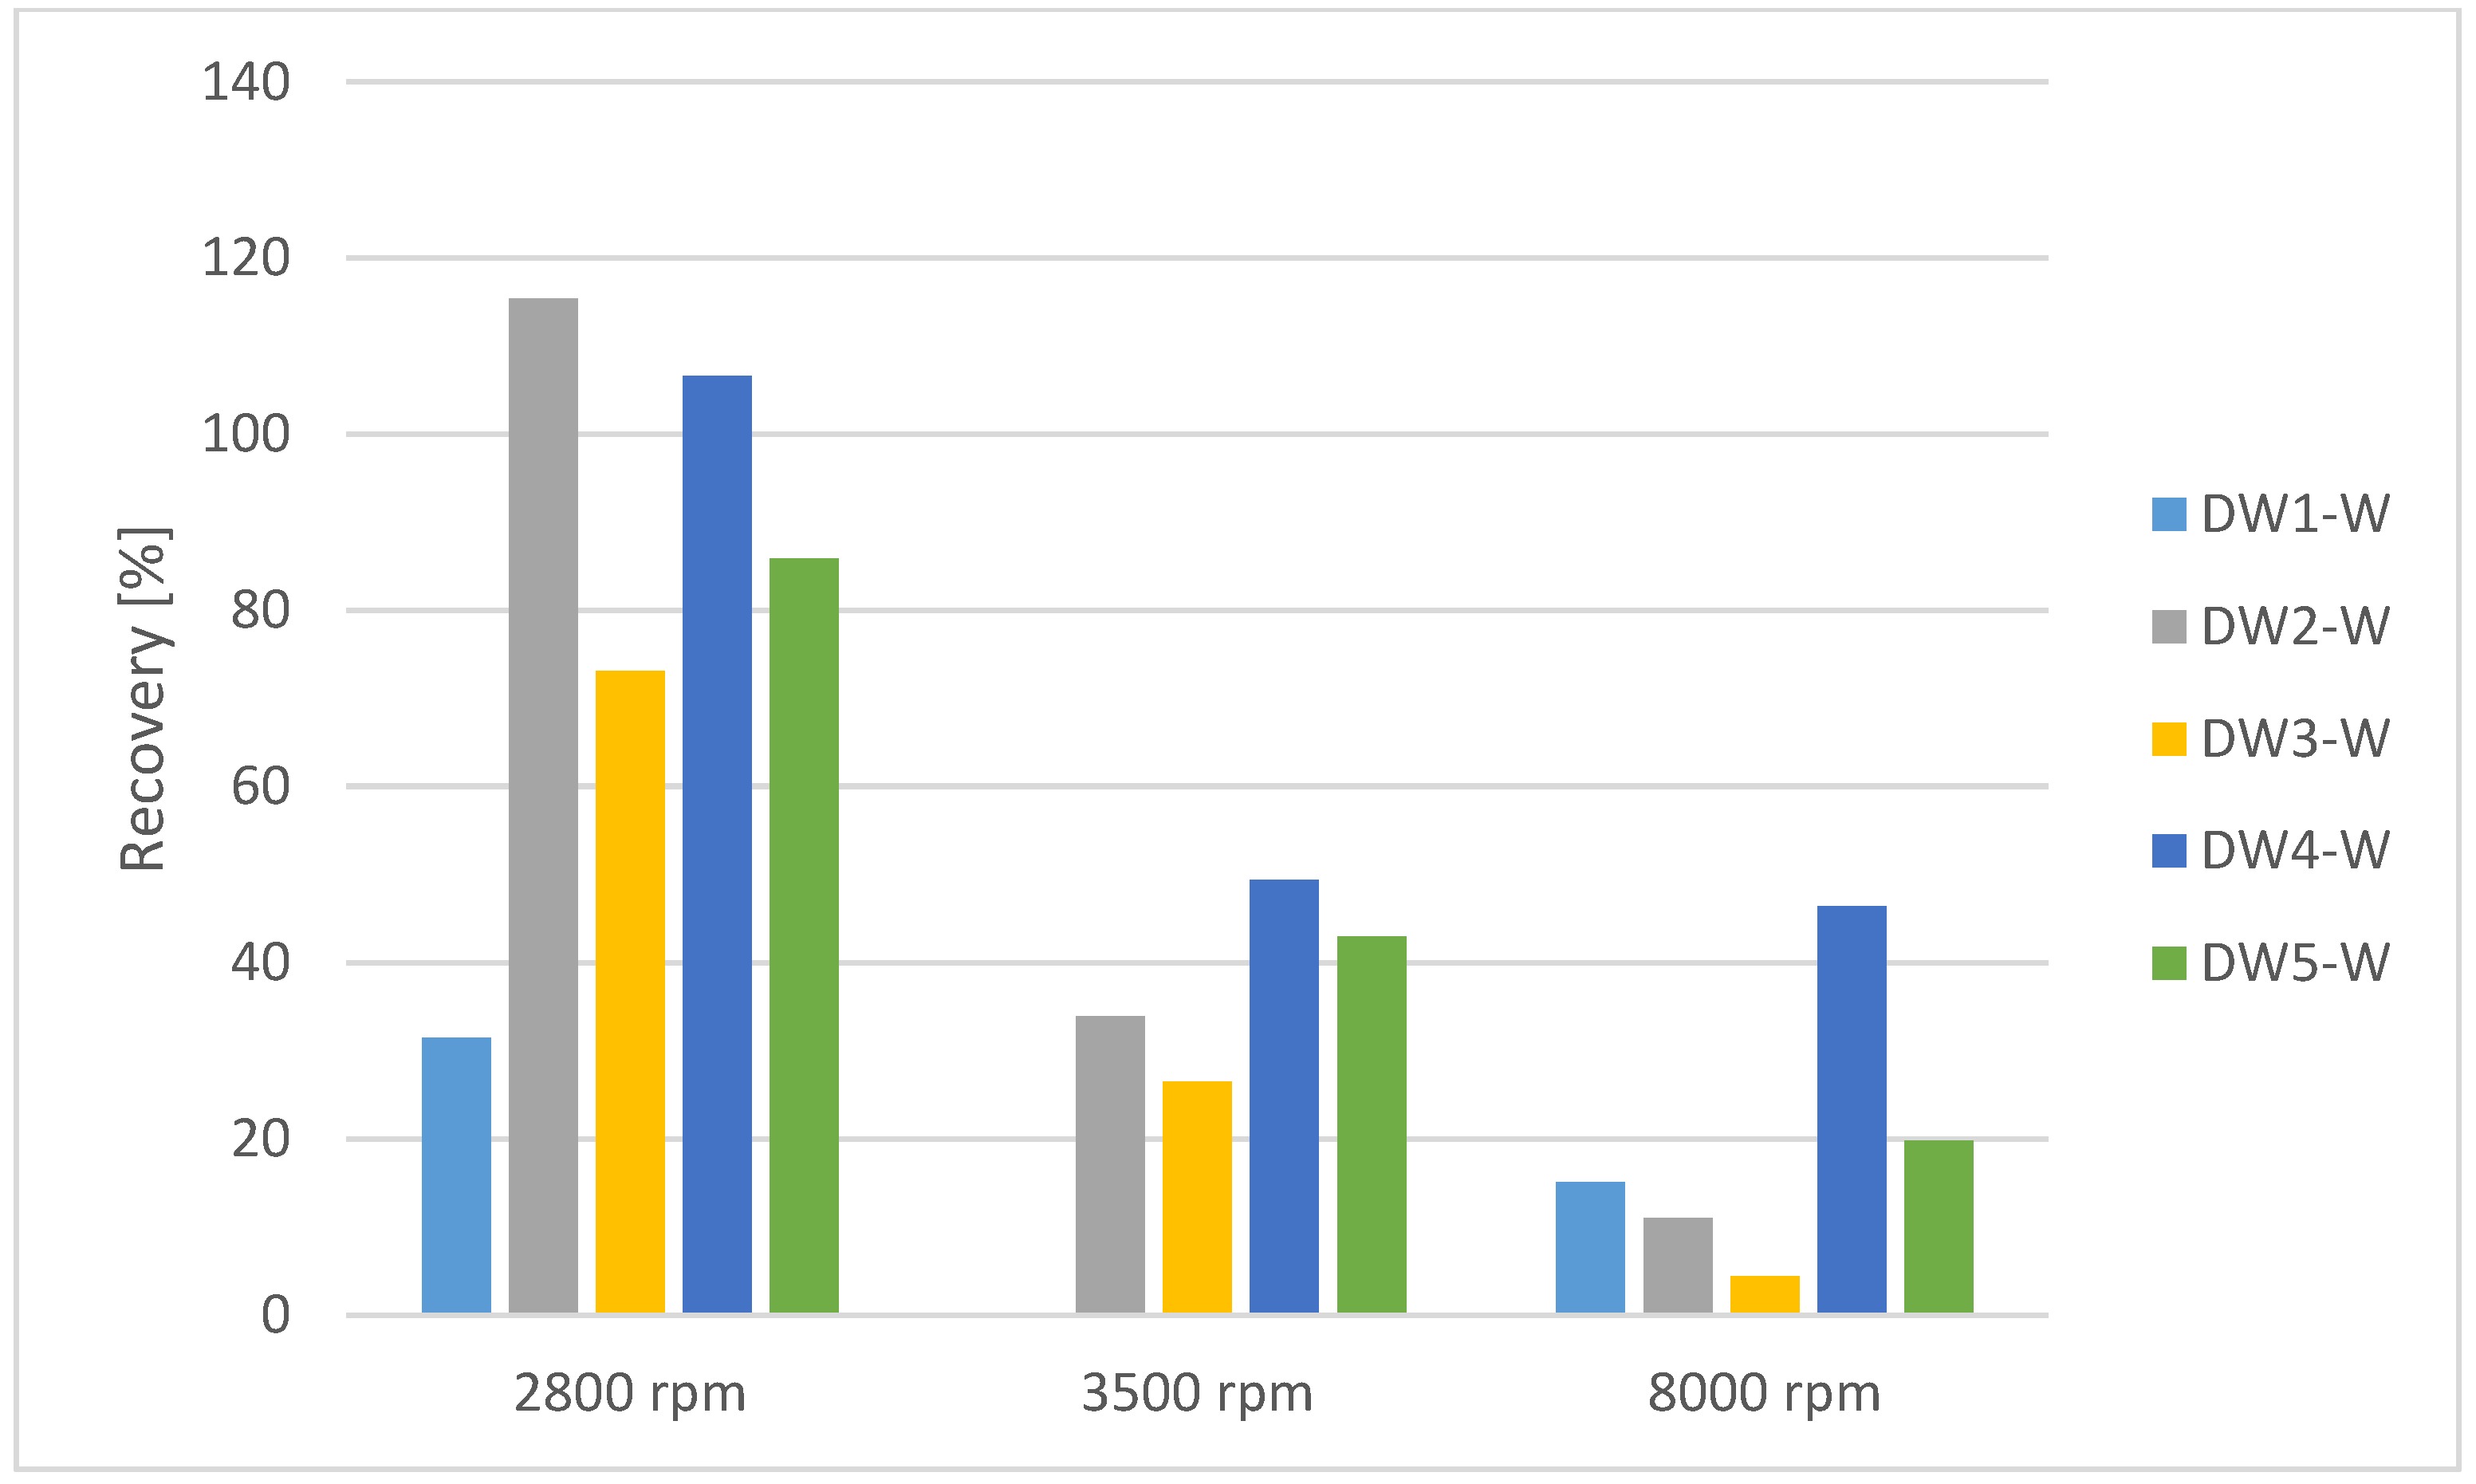
In order to check the effect of centrifugation velocity and time on the separation efficiency of Ag nanoparticles, samples of the tested extracts of water drilling waste with AgNPs (60 nm) were centrifuged at speeds of 2800, 3500, or 8000 rpm for 5, 15, or 30 min. The obtained results are presented in Table 4. Figure 6 summarizes the particle size (median) results obtained for individual samples of AgNP-enriched water extracts at the tested sample centrifugation speeds (2800, 3500, and 8000 rpm). On the other hand, Figure 7 shows the recoveries calculated on the basis of mass concentration for the samples of NP-enriched water extracts for the tested centrifugation speeds.
In the next optimization step, how centrifugation time affects the separation of silver nanoparticles was examined. For this purpose, separation was carried out for 5 and 30 min at the speed (2800 rpm) selected in an earlier stage of the study. The results of the study are summarized in Table 5. The table contains values obtained for the mean particle diameter, particle diameter median, and most common particle size.
Figure 8 shows the particle size results (median) obtained for the individual water extract samples DW(1–5)-W at the sample centrifugation times verified. The recoveries calculated on the basis of mass concentration for wastewater extract samples without and with AgNPs after centrifugation at 2800 rpm for 5, 15, or 30 min are presented on Figure 9.

3.2. Drilling Waste—Cloud Point Extraction (CPE), Centrifugation, and DW(1–4)-E

The next step of the study was the addition of AgNPs to the drilling waste samples (DW1–DW4), desorption of silver nanoparticles, separation of AgNPs by CPE or centrifugation, and characterization of the obtained AgNPs-enriched drilling waste extracts DW(1–4)-E by spICP-MS. The CPE parameters similar to those used in Reference [33] on soil leachates were selected. The only difference was the centrifugation speed of the samples during AgNP desorption, which was reduced from 3500 rpm to 2800 rpm. This value was taken from a previously conducted research on the centrifugation speed of Ag nanoparticles for drilling waste (Figure 6 and Figure 7), which showed that 2800 rpm is optimal for this purpose.
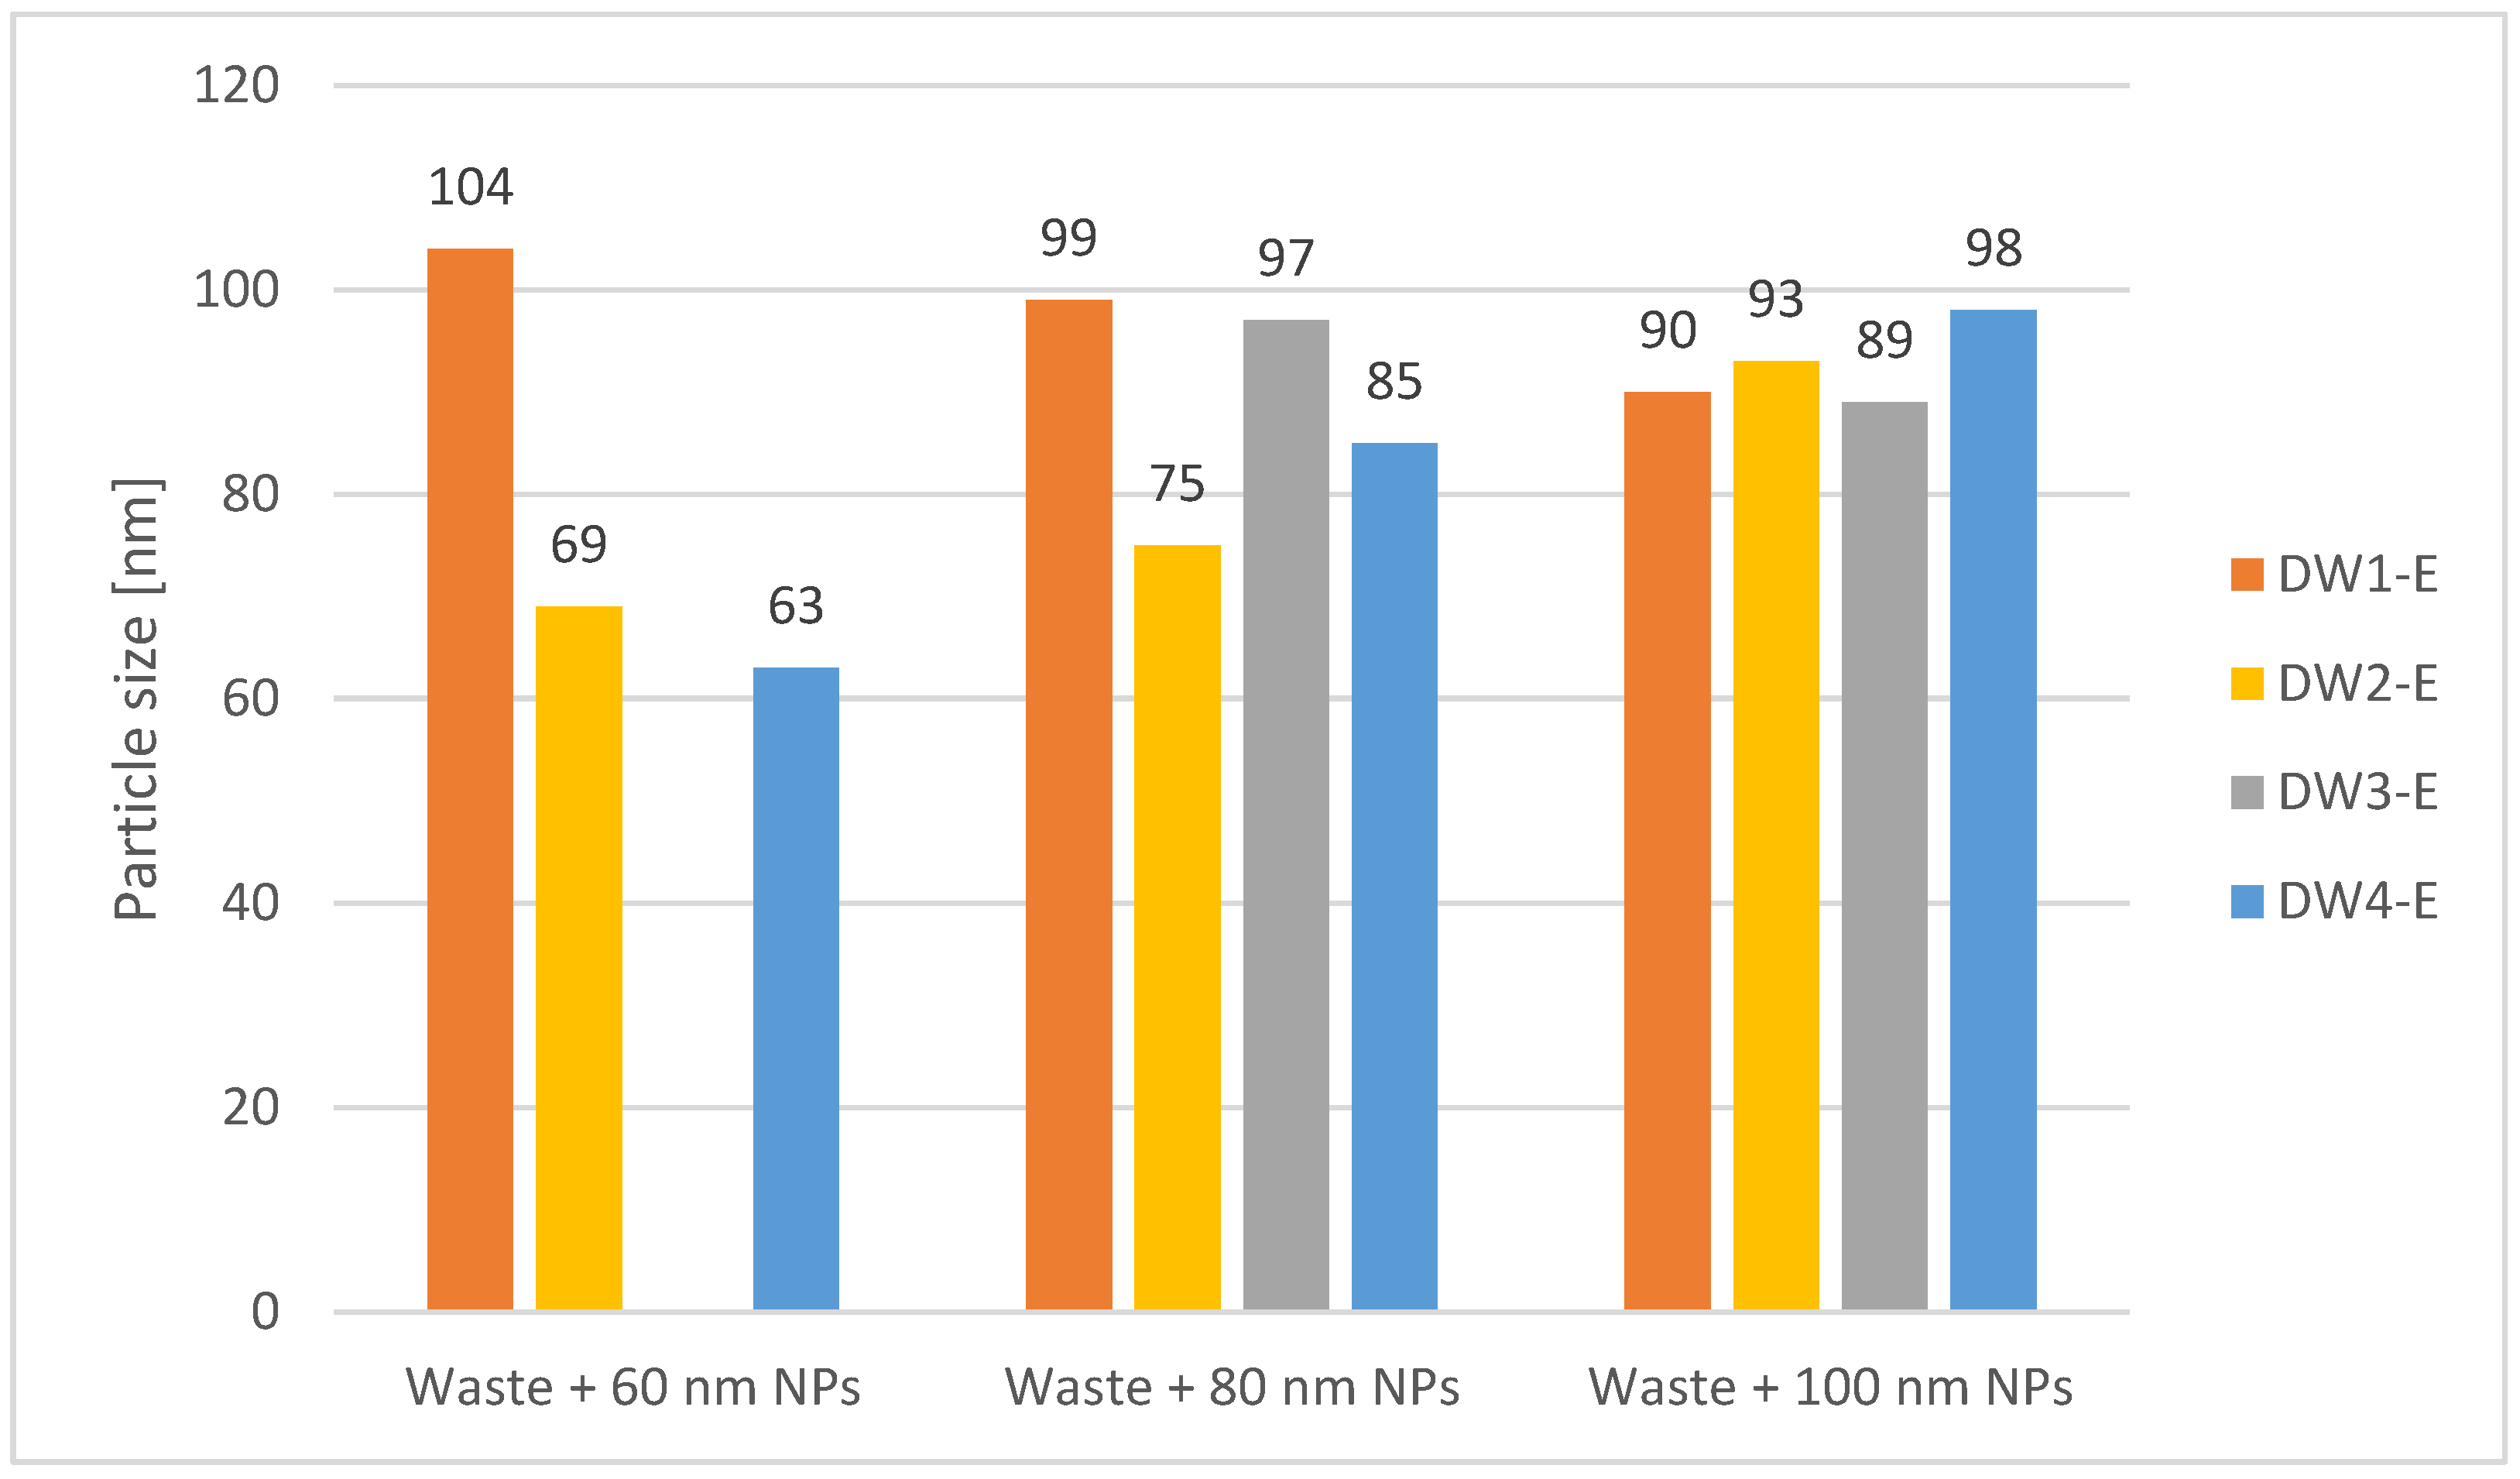
The results after CPE obtained for AgNP-enriched drilling waste extract samples DW(1–4)-E are summarized in Table 6 and presented in a diagram (Figure 10), while the results for AgNP-enriched centrifuged (2800, 12 min) drilling waste extract samples DW(1–4)-E are presented in Table 7. The table contains values obtained for the mean particle diameter, particle diameter median, and most common particle size as well as used NP size and separation method.
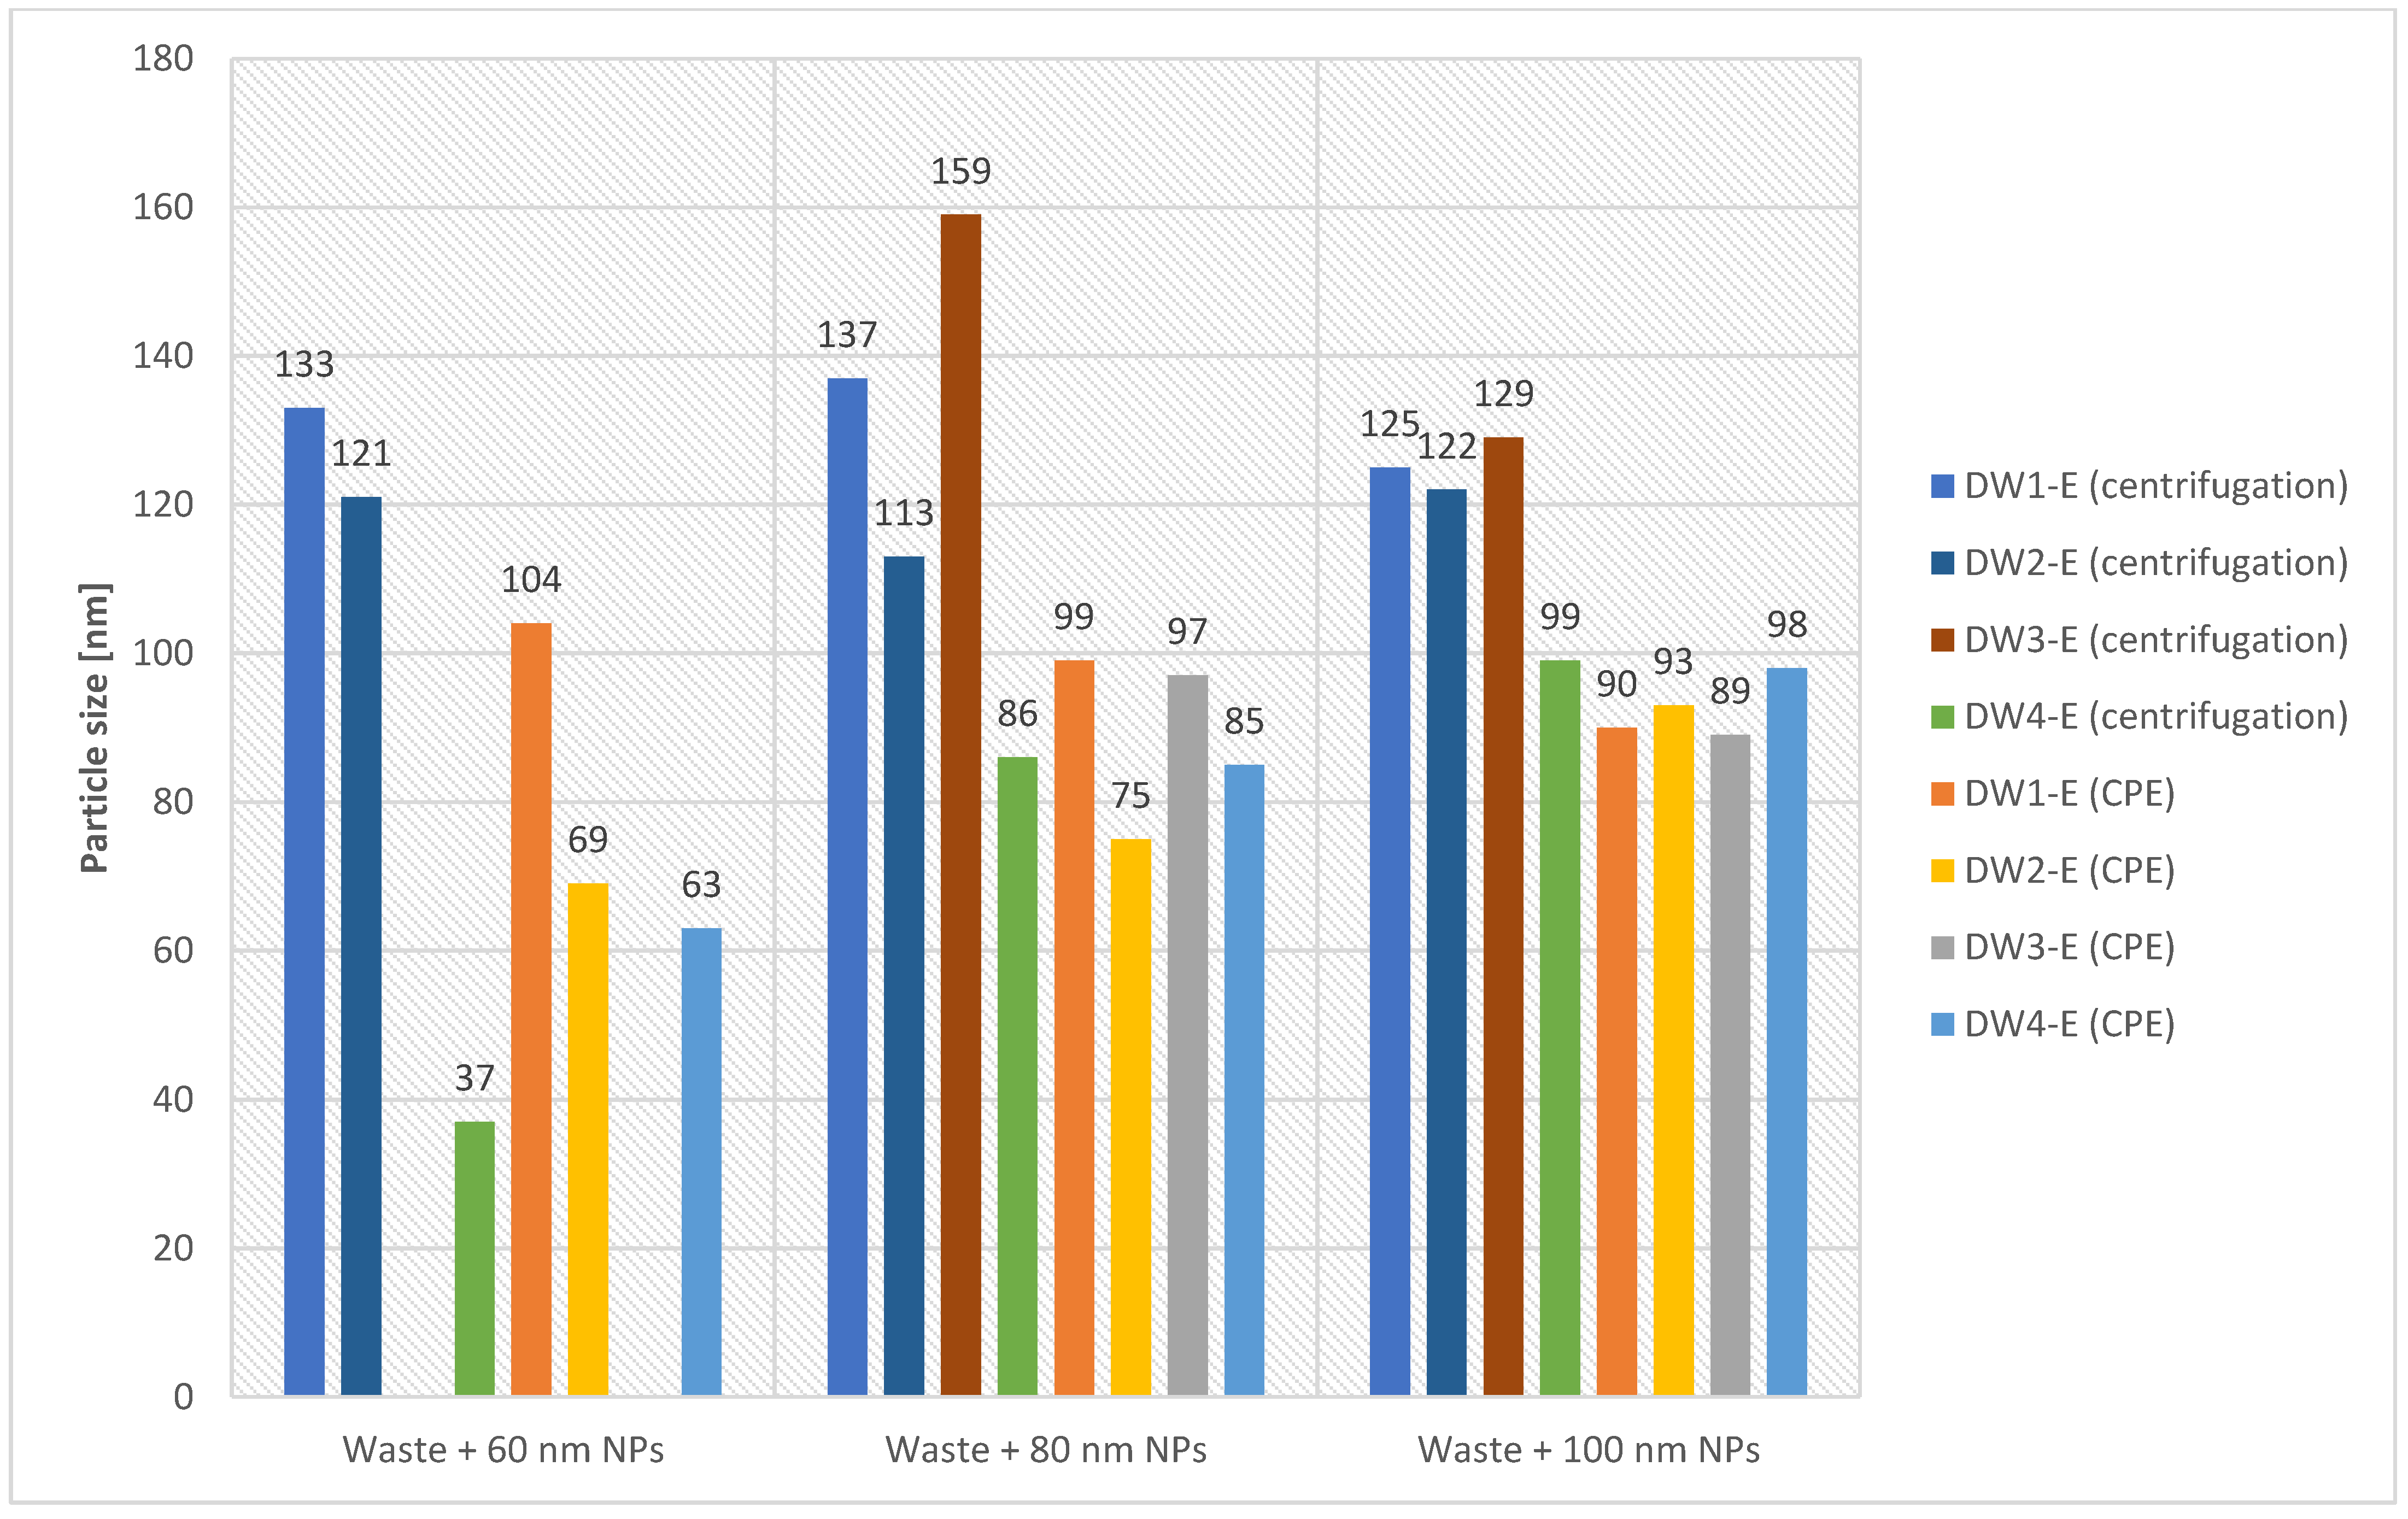
The following diagram (Figure 11) shows a comparison of median particle size in samples of DW(1–4)-E drilling waste extracts with AgNPs (60, 80, or 100 nm) after centrifugation or CPE.

4. Discussion

4.1. Water Extracts of Drilling Waste

The ionic concentration of silver in the water extracts of waste without NPs was in the range of 0.023–1.47 µg/L (Table 3). It should be noted that the total content of silver ions in the water extracts of the tested wastes varies and ranges from 0.023 to 0.034 µg/L for the water extracts of wastes generated by the application of synthetic fluid (waste codes DW1, DW4, and DW5) and amounts to 0.33 µg/L and 1.47 µg/L for the water extracts of wastes generated by the application of polymeric or barite fluids (waste codes DW2 and DW3), respectively.
The results presented in Table 3 show that the particle size dominating the different wastes varies and ranges from 19 to 69 nm (particle diameter). It should be noted that, for the water extracts of wastes generated using the process with synthetic fluid (wastes with codes DW1, DW4, and DW5), silver nanoparticles of 18–22 nm are dominant. On the other hand, the water extracts of wastes generated from the process using polymeric or barite fluids (waste codes DW2 and DW3) are dominated by particles of 36–54 nm. This dependence may result from the sorption properties of the materials used.
The average AgNP size is influenced by the preparation technique employed. Based on the study (Figure 6 and Figure 7), it was found that the most effective centrifugation speed of the waste water extracts for most samples was 2800 rpm, for which the most similar sizes of AgNPs to those introduced into the matrix (60 nm) were obtained along with recoveries with values closest to 100% for mass concentration in most of the aqueous extract samples. The recoveries were calculated from the results obtained for the water extracts without added AgNPs and the results for the water extract samples enriched with AgNPs. For samples DW1-W (waste code 01 05 06*) and DW3-W (waste code 01 05 07), the recoveries were much lower than for the other samples (mostly less than 40%). These samples also contained the highest content of ionic silver among all those tested. Low recoveries may be due to the matrix of the samples in question. The effectiveness of methods for the separation of silver nanoparticles from drilling waste matrices depends on the composition of the matrix and may be influenced by the content of silver ions.
The tests performed confirmed that 15 min was the optimal centrifugation time for most of the AgNP-enriched waste water extract samples (Figure 8 and Figure 9). With a shorter centrifugation time (5 min), AgNP sizes more similar to those introduced into the matrix were obtained but the recoveries were lower. As shown in the study, increasing the centrifugation time to 30 min is not necessary.

4.2. Drilling Waste

The test results obtained after CPE for the samples of extracts of drilling waste with the addition of AgNPs, which are presented in Table 6, indicate that extraction is an effective method of AgNP separation but not for all tested matrices. For the DW1-E sample, an increase in size was observed for the smaller sizes of AgNPs added to the matrix after CPE, which may be due to particle aggregation (Figure 10). The results obtained for the remaining samples of drilling waste extracts (DW(2–4)-E) are mostly satisfactory. The parameters for the separation of AgNPs might be improved as part of further optimization of this separation method.
The results (presented in Table 7 and Figure 11) indicate that centrifugation causes aggregation of silver particles in the AgNP-enriched drilling waste extract samples designated DW(1–3)-E. In the case of the DW4-E sample, the dimensions measured (for AgNPs 80 and 100 nm) are close to those that were introduced into the waste matrix. Drilling waste DW4 was pre-cleaned by decantation centrifuges before sampling so the DW4 matrix composition may absorb silver differently than other wastes. The chemical composition of the drilling fluid used in the process that produced the DW4 waste could also be different.
The average AgNP size is influenced by the preparation technique. As can be seen from the comparison of separation methods in Figure 11, extraction at the cloud point is a more effective method of separating nanoparticles from drilling waste matrices than centrifugation. This may be due to, inter alia, the resistance of the cloud point extraction method to the presence of ionic silver in the sample matrix. Moreover, CPE was the more efficient AgNP separation method for all three sizes of NPs introduced into the drilling waste matrix. The sizes of nanoparticles obtained after centrifugation were larger than those introduced into the matrix, which may be due to the aggregation of AgNPs.

5. Conclusions

The aim of this study was to select the optimal method of separation and pre-concentration of silver nanoparticles (AgNPs) from drilling wastewater samples and to determine their size distribution along with the state of aggregation using single particle inductively coupled plasma mass spectrometry.
The conducted research showed that the application of the nanoparticle separation method is effective but that its effectiveness depends on the separation time and rotation speed. The conducted tests showed that the most effective centrifugation speed of wastewater extracts (DW-W samples) for most samples was 2800 rpm, for which the AgNP values were the closest to those introduced into the matrix (60 nm) with recoveries with values close to 100% for the mass concentration in most of the aqueous extract samples. The optimal centrifugation time for most of the AgNP-enriched waste water extract samples was 15 min. With a shorter centrifugation time (5 min), AgNP sizes more similar to those introduced into the matrix were obtained but the recoveries were lower. In turn, increasing the centrifugation time to 30 min is not necessary because it did not improve the separation efficiency. As for the drilling waste samples (DW-E samples), the extraction at the cloud point is a more effective method of separating nanoparticles from drilling waste matrices than centrifugation. Moreover, the CPE method was effective for the separation of AgNPs of various sizes 60, 80, and 100 nm.
The results of the studies indicated clearly that there is no one-size-fits-all method for separating silver nanoparticles from drilling waste samples and drilling waste water extracts. Optimization of the silver nanoparticle separation method from drilling waste matrices is very difficult because the analyzed matrices are very diverse. The separation of nanoparticles from drilling waste samples may be influenced by the composition of the matrix of the tested waste (e.g., silver ion content) and the properties of the drilled rock, type of mud, type of drilling equipment, drilling technology, and processing method (e.g., dewatering). Due to the complexity and variety of tested matrices, it seems advisable to extend the research to other parameters that may affect the separation of nanoparticles. The density gradient centrifugation method may also be checked for this type of sample. Furthermore, the waste matrices should be characterized more broadly, e.g., by heavy metal content (usually Cr, Cu, Pb, and Zn) and salt content of some alkaline elements in the form of chlorides (usually K and Na), sulphates, or bicarbonates, which are usually found in excessive amounts in drilling wastes and may affect the separation process. Research related to optimization of the AgNP separation method from drilling waste matrices should also be extended to include other parameters. The separation efficiency by centrifugation can be checked for higher speeds. In the case of the CPE method, it would be necessary to check and select the optimal pH, surfactant, metal ion complexing masking agent (e.g., ethylenediaminetetraacetic acid - EDTA for Zn (II)), incubation temperature and time, and centrifugation time to collect the NP-containing surfactant phase. Further optimization of separation parameters should increase the efficiency of AgNP separation from the tested matrices.

Author Contributions

Conceptualization, M.G., E.K.-Z. and A.K.; methodology, M.G.; formal analysis, M.G.; investigation, M.G.; writing—original draft preparation, M.G., E.K.-Z. and A.K.; writing—review and editing, E.K.-Z., A.K. and M.G.; visualization, A.K.; supervision, E.K.-Z. and M.G. All authors have read and agreed to the published version of the manuscript.

Funding

The research received funding as a part of the statutory work commissioned by the Ministry of Science and Higher Education, order no. 0086/GE/20, archival number DK-4100-0074/20.

Institutional Review Board Statement

Not applicable.

Informed Consent Statement

Not applicable.

Data Availability Statement

Not applicable.

Conflicts of Interest

The authors declare no conflict of interest.

References

  1. Fakoya, M.F.; Shah, S.N. Emergence of nanotechnology in the oil and gas industry: Emphasis on the application of silica nanoparticles. Petroleum 2017, 3, 391–405. [Google Scholar] [CrossRef]
  2. Cheraghian, G. Application of Nano-Particles of Clay to Improve Drilling Fluid. IJNN 2017, 13, 177–186. [Google Scholar]
  3. Cheraghian, G.; Hemmati, M.; Bazgir, S. Application of TiO2 and fumed silica nanoparticles and improve the performance of drilling fluids. AIP Conf. Proc. 2014, 1590, 266. [Google Scholar] [CrossRef]
  4. Munawar, K.; Jan, B.M.; Tong, C.W.; Berawi, M.A. Advanced nanomaterials in oil and gas industry: Design, application and challenges. Appl. Energy 2017, 191, 287–310. [Google Scholar] [CrossRef]
  5. Wilk, K.; Kasza, P.; Czupski, M. Zastosowanie Nanocieczy jako Dodatków Wspomagających Proces Wypierania ropy Naftowej. Nafta-Gaz 2014, 1, 14–20. Available online: http://www.archiwum.inig.pl/INST/nafta-gaz/nafta-gaz/Nafta-Gaz-2014-01-03.pdf (accessed on 8 February 2021).
  6. Zhe, Z.; Yuxiu, A. Nanotechnology for the Oil and Gas Industry—An Overview of Recent progress. Nanotechnol. Rev. 2018, 7, 341–353. Available online: https://www.degruyter.com/document/doi/10.1515/ntrev-2018-0061/html (accessed on 8 February 2021). [CrossRef]
  7. Krasodomski, M.; Krasodomski, W.; Ziemiański, L. Nanotechnologia a przemysł naftowy. Nafta-Gaz 2009, 65, 83–92. [Google Scholar]
  8. Zima, G. Analiza wpływu nanomateriałów na właściwości osadu filtracyjnego. Nafta-Gaz 2017, 73, 312–320. Available online: http://archiwum.inig.pl/INST/nafta-gaz/nafta-gaz/Nafta-Gaz-2017-05-03.pdf (accessed on 8 February 2021). [CrossRef]
  9. Krasodomski, W.; Rembiesa-Śmiszek, A.; Skibińska, A. Nanocząstki w środkach smarowych. Nafta-Gaz 2013, 69, 220–225. Available online: http://www.archiwum.inig.pl/INST/nafta-gaz/nafta-gaz/Nafta-Gaz-2013-03-02.pdf (accessed on 8 February 2021).
  10. Das, A.; Kamle, M.; Bharti, A.; Kumar, P. Nanotechnology and it’s applications in environmental remediation: An overview. Vegetos 2019, 32, 227–237. [Google Scholar] [CrossRef]
  11. Li, D.; Hong, B.; Fang, W.; Guo, Y.; Lin, R. Preparation of well-dispersed silver nanoparticles for oil-based nanofluids. Ind. Eng. Chem. Res. 2010, 49, 1697–1702. [Google Scholar] [CrossRef]
  12. Noeiaghaei, T.; Mukherjee, A.; Dhami, N.; Chae, S.-R. Biogenic deterioration of concrete and its mitigation technologies. Constr. Build. Mater. 2017, 149, 575–586. [Google Scholar] [CrossRef]
  13. Husin, H.; Ahmad, N.; Jamil, N.; Chyuan, O.H.; Roslan, A. Evaluation on the Presence of Nano Silver Particle in Improving a Conventional Water-based Drilling Fluid, IOP Conference Series: Materials Science and Engineering, 358. In Proceedings of the 3rd International Conference on Global Sustainability and Chemical Engineering (ICGSCE), Putrajaya, Malaysia, 15–16 February 2017. [Google Scholar]
  14. Husin, H.; Elraies, K.A.; Choi, H.J.; Aman, Z. Influence of Graphene Nanoplatelet and Silver Nanoparticle on the Rheological Properties of Water-Based Mud. Appl. Sci. 2018, 8, 1386. [Google Scholar] [CrossRef] [Green Version]
  15. Bundschuh, M.; Filser, J.; Lüderwald, S.; Mckee, M.S.; Metreveli, G.; Schaumann, G.E.; Schulz, R.; Wagner, S. Nanoparticles in the environment: Where do we come from, where do we go to? Environ. Sci. Eur. 2018, 30, 6. Available online: https://enveurope.springeropen.com/articles/10.1186/s12302-018-0132-6 (accessed on 8 February 2021). [CrossRef] [Green Version]
  16. Alsaba, M.T.; Al Dushaishi, M.F.; Abbas, A.K. A comprehensive review of nanoparticles applications in the oil and gas industry. J. Petrol. Explor. Prod. Technol. 2020, 10, 1389–1399. [Google Scholar] [CrossRef] [Green Version]
  17. Resnik, D.B. How should engineered nanomaterials be regulated for public and environmental health? AMA J. Ethics 2019, 21, E363–E369. [Google Scholar] [CrossRef] [PubMed] [Green Version]
  18. ASTM E2909-13 American Standard. Standard Guide for Investigation/Study/Assay Tab-Delimited Format for Nanotechnologies (ISA-TAB-nano): Standard File Format for the Submission and Exchange of Data on Nanomaterials and Characterizations; ASTM International: West Conshohocken, PA, USA, 2018. [Google Scholar]
  19. ISO/TS 80004-1:2015 European Standard. Nanotechnologies—Vocabulary—Part 1: Core terms ASTM E249009 Standard Guide for Measurement of Particle Size Distribution of Nanomaterials in Suspension by Photon Correlation Spectroscopy (PCS); European Committee for Standardization: Brussels, Belgium, 2015. [Google Scholar]
  20. ISO/TR 13014:2012 European Standard. Nanotechnologies—Guidance on Physicochemical Characterization of Engineered Nanoscale Materials for Toxicological Assessment; European Committee for Standardization: Brussels, Belgium, 2012. [Google Scholar]
  21. ISO 10808:2010 European Standard. Nanotechnologies—Characterization of Nanoparticles in Inhalation Exposure Chambers for Inhalation Toxicity Testing; European Committee for Standardization: Brussels, Belgium, 2010. [Google Scholar]
  22. ASTM E2524-08:2013 American Standard. Standard Test Method for Analysis of Hemolytic Properties of Nanoparticles; ASTM International: West Conshohocken, PA, USA, 2013. [Google Scholar]
  23. ISO/TS 12901-1:2012 European Standard. Nanotechnologies—Occupational Risk Management Applied to Engineered Nanomaterials—Part 1: Principles and Approaches; European Committee for Standardization: Brussels, Belgium, 2012. [Google Scholar]
  24. ASTM E2996-15 American Standard. Standard Guide for Workforce Education in Nanotechnology Health and Safety; ASTM International: West Conshohocken, PA, USA, 2018. [Google Scholar]
  25. ISO/TR 12885:2018 European Standard. Nanotechnologies—Health and Safety Practices in Occupational Settings; European Committee for Standardization: Brussels, Belgium, 2018. [Google Scholar]
  26. ISO/TS 11308:2020 European Standard. Nanotechnologies—Characterization of Carbon Nanotube Samples Using Thermogravimetric Analysis; European Committee for Standardization: Brussels, Belgium, 2020. [Google Scholar]
  27. ISO/TR 13121:2011 European Standard. Nanotechnologies—Nanomaterial Risk Evaluation; European Committee for Standardization: Brussels, Belgium, 2011. [Google Scholar]
  28. Campos, A.; López, I. Current Status and Perspectives in Nanowaste Management. In Handbook of Environmental Materials Management; Hussain, C., Ed.; Springer: Cham, Switzerland, 2019. [Google Scholar] [CrossRef]
  29. Part, F.; Zecha, G.; Causon, T.; Sinner, E.-K.; Huber-Humer, M. Current Limitations and Challenges In Nanowaste Detection, Characterisation And Monitoring. Waste Manag. 2015, 43, 407–420. [Google Scholar] [CrossRef] [PubMed]
  30. Younis, S.A.; El-Fawal, E.M.; Serp, P. Nano-wastes and the Environment: Potential Challenges and Opportunities of Nano-waste Management Paradigm for Greener Nanotechnologies. In Handbook of Environmental Materials Management; Hussain, C.M., Ed.; Springer International Publishing AG: Cham, Switzerland, 2018. [Google Scholar] [CrossRef]
  31. Gajec, M.; Kukulska-Zając, E.; Król, A. Determination of silver nanoparticles in liquid environmental samples. Appl. Ecol. Environ. Res. 2020, 18, 5775–5788. [Google Scholar] [CrossRef]
  32. Liu, J.F.; Yu, S.J.; Yin, Y.G.; Chao, J.B. Methods for separation, identification, characterization and quantification of silver nanoparticles. TrAC Trends Anal. Chem. 2012, 33, 95–106. [Google Scholar] [CrossRef]
  33. Torrent, L.; Laborda, F.; Marguí, E.; Hidalgo, M.; Iglesias, M. Combination of cloud point extraction with single particle inductively coupled plasma mass spectrometry to characterize silver nanoparticles in soil leachates. Anal. Bioanal. Chem. 2019, 411, 5317–5329. Available online: https://link.springer.com/article/10.1007%2Fs00216-019-01914-y (accessed on 8 February 2021). [CrossRef]
  34. El Hadri, H.; Hackley, V.A. Investigation of cloud point extraction for the analysis of metallic nanoparticles in a soil matrix. Environ. Sci. Nano 2017, 4, 105–116. Available online: https://www.ncbi.nlm.nih.gov/pmc/articles/PMC5427641/ (accessed on 8 February 2021). [CrossRef] [Green Version]
  35. Majedi, S.M.; Kelly, B. Evaluation of a cloud point extraction approach for the preconcentration and quantification of trace CuO nanoparticles in environmental waters. Anal. Chim. Acta 2014, 814, 39–48. [Google Scholar] [CrossRef] [PubMed]
  36. Hedayatipour, M.; Jaafarzadeh, N.; Ahmadmoazzam, M. Removal optimization of heavy metals from effluent of sludge dewatering process in oil and gas well drilling by nanofiltration. J. Environ. Manag. 2017, 203, 151–156. [Google Scholar] [CrossRef] [PubMed]
  37. Wagner, S.; Navratilova, J.; Gondikas, A. Sample Preparation for the Analysis of Nanomaterials in Water. Fundam. Water Chem. Part. Ecol. Nanomater. Colloids 2019. [Google Scholar] [CrossRef] [Green Version]
  38. Regulation of the Minister of Climate of 2 January 2020 on the Catalogue of Wastes (Dz.U. 2020 poz. 10). Available online: https://isap.sejm.gov.pl/isap.nsf/DocDetails.xsp?id=WDU20200000010 (accessed on 8 February 2021).
  39. PN-EN 12457-2:2006 Polish Standard. Charakteryzowanie Odpadów—Wymywanie—Badanie Zgodności w Odniesieniu do Wymywania Ziarnistych Materiałów Odpadowych i Osadów—Część 2: Jednostopniowe Badanie Porcjowe Przy Stosunku cieczy do fazy stałej 10 l/kg w Przypadku Materiałów o Wielkości Cząstek Poniżej 4 mm (bez redukcji lub z redukcją wielkości); Polski Komitet Normalizacji: Warsaw, Poland, 2006. [Google Scholar]
  40. PN-EN 12457-4:2006 Polish Standard. Charakteryzowanie Odpadów—Wymywanie—Badanie Zgodności w Odniesieniu do Wymywania Ziarnistych Materiałów Odpadowych i Osadów—Część 3: Dwustopniowe Badanie Porcjowe Przy Stosunku cieczy do Fazy stałej 2 l/kg i 8 l/kg dla Materiałów o Wysokiej Zawartości fazy stałej i Wielkości Cząstek Poniżej 4 mm (bez redukcji lub z redukcją wielkości); Polski Komitet Normalizacji: Warsaw, Poland, 2006. [Google Scholar]
Figure 1. Photographs presenting drilling waste DW1 (code 01 05 06*) and DW2 (code 01 05 08) (photo: M. Gajec).
Energies 14 01950 g001
Figure 2. Photographs presenting drilling waste DW3 (code 01 05 07) and DW4 (code 01 05 05*) (photo: M. Gajec).
Energies 14 01950 g002
Figure 3. Photograph presenting drilling waste DW5 (code 01 05 05*) (photo: M. Gajec).
Energies 14 01950 g003
Figure 4. Diagram showing the preparation of test samples of drilling waste enriched with AgNPs (samples DW(1–4)-E) and water extracts of drilling waste (samples DW(1–5)-W). Methods and detailed parameters of AgNP separation used during the studies are also presented. Two research procedures were used with waste samples. The first involved enrichment of drilling waste with silver nanoparticles and desorption of nanoparticles (NPs) into an aqueous solution. At this stage, waste extracts enriched with AgNPs were obtained, and samples after this stage were labeled as DW(1-4)-E. The second stage of the research was to obtain water extracts of drilling waste, which were then enriched or not with AgNPs and subjected to further tests. Samples after this stage of research were labeled as DW(1–4)-W.
Energies 14 01950 g004
Figure 5. Silver particle size distribution recorded by the spICP-MS technique for a sample of water extract of drilling waste without added AgNPs designated as DW1-W (A), DW2-W (B), and DW3-W (C).
Energies 14 01950 g005
Figure 6. Results of particle size measurements in DW(1–5)-W drilling waste water extract samples with the addition of AgNPs (60 nm) for three different centrifugation speeds (2800 rpm, 3500 rpm, and 8000 rpm).
Energies 14 01950 g006
Figure 7. Recovery calculated from mass concentration for three centrifugation speeds (2800 rpm, 3500 rpm, and 8000 rpm) for DW(1–5)-W water extract samples of drilling waste with AgNPs (60 nm).
Energies 14 01950 g007
Figure 8. Results of particle size measurements in DW(1-5)-W drilling waste water extract samples with AgNPs (60 nm). Results for three different centrifugation times such as 5, 15, and 30 min are shown.
Energies 14 01950 g008
Figure 9. Recovery calculated from Ag concentration for three different centrifugation times (5 min, 15 min, and 30 min) in DW(1-5)-W drilling waste water extract samples with AgNPs (60 nm).
Energies 14 01950 g009
Figure 10. Results of AgNP separation by CPE from AgNP-enriched drilling waste filtrate samples DW(1–4)-E. Silver nanoparticles of three sizes, 60, 80, or 100 nm, were added to the samples. The graph shows the recovery results obtained after separation with CPE.
Energies 14 01950 g010
Figure 11. Particle size comparison of drilling waste samples enriched with AgNPs DW(1-4)-E of different sizes. Silver nanoparticles of three sizes, 60, 80, or 100 nm, were added to the samples. The graph shows the results obtained for particle size obtained after separation by CPE or centrifugation.
Energies 14 01950 g011
Table 1. Analysis parameters and instruments settings used during the silver nanoparticle (AgNP) characterization.
Instrument SettingValueUnit
uRF power1550W
Mist chamber temperature2.0°C
Nebulizer pump velocity0.1rpm
Sampling depth8.0mm
Integration time0.1ms
Data collection time60s
Density of particles10.5g/mL
Carrier gas flow velocity1.05L/min
Data collection modeTRA-
Monitored weight107Ag-
Mass fraction of Ag1-
Table 2. Drilling waste sample identification with assigned codes and description of the tested drilling wastes including color, smell, consistency, and a brief description of the drilling method.
Sample IdentificationSample DescriptionWaste Code
DW1Drilling waste after application of synthetic fluid; solid (powder) and brown in color and has a characteristic organic odor.01 05 06*
DW2Drilling waste (borings) after using a polymer-potassium fluid; semi-solid sample (brownish-gray mass containing fine borings), with a characteristic cement tang.01 05 08
DW3Drilling waste (borings) after the use of barite fluid; waste after initial cleaning on vibrating screens; a sample of a semi-solid, greasy consistency (gray-brown mass containing fine borings), with a characteristic tang.01 05 07
DW4Drilling waste (borings) after application of synthetic fluid (third interval from a depth of about 3000 m BGL); waste after cleaning by decantation centrifuges; sample of semi-solid, homogeneous consistency, dark brown color, and characteristic organic odor.01 05 05*
DW5Drilling waste (borings) after application of synthetic fluid (fourth interval from a depth of about 3500 m BGL); waste after cleaning by decantation centrifuges; sample of semi-solid, greasy, homogeneous consistency, dark brown color, and characteristic organic odor.01 05 05*
Table 3. Silver particle size measurement results obtained for water extracts of drilling waste described as DW(1-5)-W without AgNP addition. The table contains values obtained for the mean particle diameter, particle diameter median, ionic concentration of silver, and most common particle size.
Matrix, Sample Preparation MethodMean Particle Diameter (nm)Particle Diameter Median (nm)Most Common Particle Size (nm)Ionic Concentration of Ag (µg/L)
Water extract of waste having the code 01 05 06*
(DW1-W)
2322220.034
Water extract of waste having the code 01 05 08
(DW2-W)
4037360.332
Water extract of waste having the code 01 05 07
(DW3-W)
6963541.47
Water extract of waste having the code 01 05 05*
(DW4-W)
1918180.023
Water extract of waste having the code 01 05 0*
(DW5-W)
2522220.030
Table 4. Verification of the effect of centrifugation velocity for a centrifugation time of 15 min on nanoparticle separation efficiency for water extract samples DW(1–5)-W of drilling waste enriched with AgNPs (60 nm).
MatrixSize of AgNPs Introduced into the Matrix (nm)Separation MethodMean Particle Diameter (nm)Particle Diameter Median (nm)Most Common Particle Size (nm)
Water extract DW1-W60centrifugation: 2800 rpm, 15 min525044
Water extract DW2-W60centrifugation: 2800 rpm, 15 min534942
Water extract DW3-W60centrifugation: 2800 rpm, 15 min676456
Water extract DW4-W60centrifugation: 2800 rpm, 15 min575444
Water extract DW5-W60centrifugation: 2800 rpm, 15 min555350
Water extract DW1-W60centrifugation: 3500 rpm, 15 min575440
Water extract DW2-W60centrifugation: 3500 rpm, 15 min575448
Water extract DW3-W60centrifugation: 3500 rpm, 15 min848070
Water extract DW4-W60centrifugation: 3500 rpm, 15 min292624
Water extract DW5-W60centrifugation: 3500 rpm, 15 min767538
Water extract DW1-W60centrifugation: 8000 rpm, 15 min494538
Water extract DW2-W60centrifugation: 8000 rpm, 15 min494644
Water extract DW3-W60centrifugation: 8000 rpm, 15 min706056
Water extract DW4-W60centrifugation: 8000 rpm, 15 min282724
Water extract DW5-W60centrifugation: 8000 rpm, 15 min433534
Table 5. Verification of the effect of centrifugation time at 2800 rpm on the separation efficiency of silver nanoparticles for DW(1-5)-W drilling waste water extract samples with AgNPs (60 nm). The table contains values obtained for the mean particle diameter, particle diameter median, and most common particle size.
MatrixSize of AgNPs Introduced into the Matrix (nm)Separation MethodMean Particle Diameter (nm)Particle Diameter Median (nm)Most Common Particle Size (nm)
Water extract DW1-W 60centrifugation: 2800 rpm, 5 min666252
Water extract DW2-W 60centrifugation: 2800 rpm, 5 min676352
Water extract DW3-W 60centrifugation: 2800 rpm, 5 min888172
Water extract DW4-W 60centrifugation: 2800 rpm, 5 min504828
Water extract DW5-W 60centrifugation: 2800 rpm, 5 min575438
Water extract DW1-W 60centrifugation: 2800 rpm, 30 min595846
Water extract DW2-W 60centrifugation: 2800 rpm, 30 min595552
Water extract DW3-W 60centrifugation: 2800 rpm, 30 min676562
Water extract DW4-W 60centrifugation: 2800 rpm, 30 min282726
Water extract DW5-W 60centrifugation: 2800 rpm, 30 min413434
Table 6. Results of AgNP separation after extraction in the cloud point obtained for drilling waste extract samples DW(1–4)-E with AgNP addition of different sizes (60 nm, 80 nm, and 100 nm). The table contains values obtained for the mean particle diameter, particle diameter median, and most common particle size.
MatrixSize of AgNPs Introduced into the Matrix (nm)Separation MethodMean Particle Diameter (nm)Particle Diameter Median (nm)Most Common Particle Size (nm)
DW1-E60CPE11010496
DW1-E80CPE1059990
DW1-E100CPE949082
DW2-E60CPE736964
DW2-E80CPE787570
DW2-E100CPE979386
DW3-E80CPE1009786
DW3-E100CPE948982
DW4-E60CPE686358
DW4-E80CPE968570
DW4-E100CPE10198106
Table 7. AgNP separation results for drilling waste extract samples DW(1–4)-E enriched with AgNPs after centrifugation at 2800 rpm for 12 min. Three different sizes of AgNPs were introduced into the drilling waste matrix, 60, 80, and 100 nm. The table shows mean particle diameter, particle diameter median, and most common particle size.
MatrixSize of AgNPs Introduced into the Matrix (nm)Separation MethodMean Particle Diameter (nm)Particle Diameter Median (nm)Most Common Particle Size (nm)
DW1-E 60centrifugation 2800 rpm, 12 min137133124
DW1-E 80centrifugation 2800 rpm, 12 min143137118
DW1-E 100centrifugation 2800 rpm, 12 min130125108
DW2-E 60centrifugation 2800 rpm, 12 min127121108
DW2-E 80centrifugation 2800 rpm, 12 min12011398
DW2-E 100centrifugation 2800 rpm, 12 min132122104
DW3-E 80centrifugation 2800 rpm, 12 min178159128
DW3-E 100centrifugation 2800 rpm, 12 min137129110
DW4-E 60centrifugation 2800 rpm, 12 min443736
DW4-E 80centrifugation 2800 rpm, 12 min898642
DW4-E 100centrifugation 2800 rpm, 12 min999944
Publisher’s Note: MDPI stays neutral with regard to jurisdictional claims in published maps and institutional affiliations.