Article

Quantifying the Low Salinity Waterflooding Effect

Department of Petroleum Engineering, Khalifa University of Science and Technology, Abu Dhabi 127788, United Arab Emirates
*
Author to whom correspondence should be addressed.
Energies 2021, 14(7), 1979; https://doi.org/10.3390/en14071979
Submission received: 6 March 2021 / Revised: 26 March 2021 / Accepted: 31 March 2021 / Published: 2 April 2021
(This article belongs to the Special Issue Modeling Multiphase Flow and Reactive Transport in Porous Media)

Abstract

:
Low salinity waterflooding (LSW) has shown promising results in terms of increasing oil recovery at laboratory scale. In this work, we study the LSW effect, at laboratory scale, and provide a basis for quantifying the effect at field scale by extracting reliable relative permeability curves. These were achieved by experimental and numerical interpretation of laboratory core studies. Carbonate rock samples were used to conduct secondary and tertiary unsteady-state coreflooding experiments at reservoir conditions. A mathematical model was developed as a research tool to interpret and further validate the physical plausibility of the coreflooding experiments. At core scale and a typical field rate of ~1 ft/day, low salinity water (LS) resulted in not only ~20% higher oil recovery compared to formation water (FW) but also recovered oil sooner. LS water also showed capability of reducing the residual oil saturation when flooded in tertiary mode. The greater oil recovery caused by LSW can be attributed to altering the wettability of the rock to less oil-wet as confirmed by the numerically extracted relative permeability curves.

1. Introduction

In the last couple of decades, researchers started considering the chemistry of injected water as an important factor in improving oil recovery. This led to an emerging enhanced oil recovery (EOR) technique named low salinity waterflooding (LSW). This technique gained popularity due to its potential in increasing oil recovery with the advantage of having relatively low costs compared to other EOR/IOR techniques.
According to one of the earliest works on LSW [1], synthetic cores containing clay produced more oil when flooded with fresh water compared to connate brine. Moreover, an incremental oil recovery by LSW in Berea sandstone was reported by the authors in [2]. Since then, multiple experimental studies have shown that, for sandstones, oil recovery can be improved by manipulating the ionic composition or lowering the total salinity of the injected water. There are plenty of LSW studies on sandstones and discussing them in detail is beyond the scope of this study. A number of reviews [3,4] and the references therein cover those studies very well. Furthermore, the same concepts were tested for carbonates and numerous experimental studies were conducted. LSW effects were investigated at laboratory scale using both spontaneous imbibition [5,6,7,8,9] and coreflooding experiments [10,11,12,13,14,15,16,17,18]. LSW effects, on carbonates, were also investigated at a larger scale by the authors of [19], as they report the results of two single well chemical tracer (SWCT) tests.
LSW is loosely used to refer to either low salinity brines or brines that were tuned by changing the concentration of active divalent ions such as Ca2+, Mg2+, and SO42− (also known as potential determining ions—PDIs). Several studies reported that enhancements in oil recovery is not necessarily associated with brines of low salinity [6,7,14,20]. In another study [21], the authors went further to test combinations of the PDIs and they concluded that it is possible to achieve an optimum combination that would result in the highest oil recovery. On the other hand, other studies showed that lowering the ionic strength alone could also enhance oil production, e.g. [9].
It is widely accepted that the improved oil recovery in carbonate rocks is attributed to alteration of rock wettability from oil-wet to a water-wet state [4]. However, there is still some uncertainty as to which geochemical mechanism is causing the wettability alteration. So far, the widely proposed mechanisms are: rock dissolution, surface ion exchange, or a combination of both [4]. Having used a chemical model of the interactions between a bulk aqueous and surface chemistry, the authors of [22] concluded that rock dissolution is the main reason behind incremental oil recovery. The authors reported a chemical mechanism for wettability alteration that mainly focused on the Ca2+ interactions with the calcite rock surface. According to their mechanism, calcium dissolution contributes to releasing some of the oil, imbibed on the rock surface, and thus converts the system to a more water-wet system. Intensive coreflooding experiments were conducted by Yousef et al. [12] to test the impact of salinity and ion composition on carbonate reservoir cores. Their results revealed that incremental recovery can be achieved by altering the salinity and ionic composition of the injected water. Furthermore, they reported that rock dissolution is the main contributor to incremental oil recovery.
The effect of potential determining ions: Ca2+, Mg2+, and SO42−, on wettability alteration was tested by Zhang et al. [7] as they performed spontaneous imbibition experiments on chalk cores. Tests with different concentrations of the PDIs were conducted at different temperatures. The results showed promising effects when SO42− was present with either Ca2+ or Mg2+. Furthermore, the authors proposed a mechanism that explains the impact of the three determining ions on changing the surface charge and ultimately altering the wettability. It is also possible that a combination of both rock dissolution and surface charge might take place in LSW. A study by Zaretskiy [23] modeled published coreflooding experiments, taking into account the rock-fluid geochemical interactions and the author concluded that both mechanisms were contributing to wettability alteration. However, the authors of [24] questioned the significance of the calcite dissolution mechanism when it comes to field scale as it could be irrelevant due to brine equilibration.
Numerous LSW unsteady-state (USS) coreflooding experiments, where only water is flooded instead of both water and oil, were conducted on carbonates. The objective of the experiment plays a major role in designing LSW coreflooding experiments. Insights into the proper experimental procedures required for quantifying the LSW effect were provided by Masalmeh et al. [25]. The study also highlighted that coreflooding experiments performed with low flow rates only can be misleading since they are usually dominated by capillary end effects. Furthermore, Nasralla et al. [17] suggested that tertiary coreflooding experiments should not be used to extract low salinity relative permeability curves because the saturation range, for low salinity, is too narrow to provide representative relative permeability curves. In another study [24], the authors showed the potential of LSW by performing what was referred to as qualitative corefloods. The authors further highlighted that such an approach can only show the LSW effect qualitatively and cannot be used to quantify the LSW effect. Furthermore, Nasralla et al. [17] emphasized the importance of performing dedicated secondary high salinity and low salinity corefloods to allow for extracting reliable relative permeability curves. These experiments were referred to as quantitative coreflooding experiments.
In the work of Masalmeh et al. [25], quantitative coreflooding experiments were conducted on sandstone samples and high salinity and low salinity relative permeability curves were numerically extracted. Moreover, quantitative coreflooding experiments were conducted on carbonate reservoir rocks by the authors of [17]. Tests were performed at reservoir temperature (100 °C) using synthetic brines and decalin, instead of crude oil, for improved displacement. The authors reported positive LSW effects in a pair of samples and almost no effect in another pair. Additionally, the relative permeability curves were numerically extracted and further used in a Buckley Leveret analytical model to quantify the LSW effect. In a recent study, Feldmann et al. [18] performed quantitative LSW corefloods on Indiana limestone outcrop samples at a temperature of 70 °C using synthetic brines and dead crude oil. Relative permeability curves were also numerically extracted to confirm whether LSW altered the wettability of the samples.
This study presents a simple, yet reliable experimental protocol for evaluating the effects of LSW at laboratory scale. Moreover, not many studies are concerned with the mathematical models or the simulators used to extract the relative permeability curves for LSW. Herein, we develop a simple mathematical model that is tailored to mimic the USS coreflooding experiments while honoring the crucial physical characteristics of the experiments. Specifically, we include capillary effects as opposed to analytical interpretation methods that assume zero capillary pressure. We also thoroughly discuss the capillary end effects and include it in the mathematical model. According to a recent study [26], capturing the capillary end effect and the multi-rate nature of the experiment is crucial for constraining the inverse modeling process.

2. Experimental Materials and Methods

2.1. Crude Oil

Dead crude oil sample, obtained from a field in Abu Dhabi, was used for this study. The crude oil was filtered with 0.45 µm filter paper to remove any contaminants or undesired solid particles that might lead to the blocking of pores. The crude oil was used to drain the core samples to achieve the desired initial water saturation. At 3000 psi and 120 °C, the dead crude oil is characterized by a viscosity of 0.97 cP and a density of 0.775 g/cm3.

2.2. Brines

Two synthetic brines were prepared for injection throughout the waterflood tests. Formation water (FW) was used to saturate and prepare the core samples. Fifty times diluted seawater (SW/50), which was screened in an in-house series of experiments, was tested in the coreflood experiments to compare its performance to formation water. Both brines were prepared by mixing deionized water with predetermined amounts of salts to match the composition of a formation water sample retrieved from a field in Abu Dhabi, and the composition of the desired diluted seawater. Ionic compositions, viscosity, and density of the brines are given in Table 1.

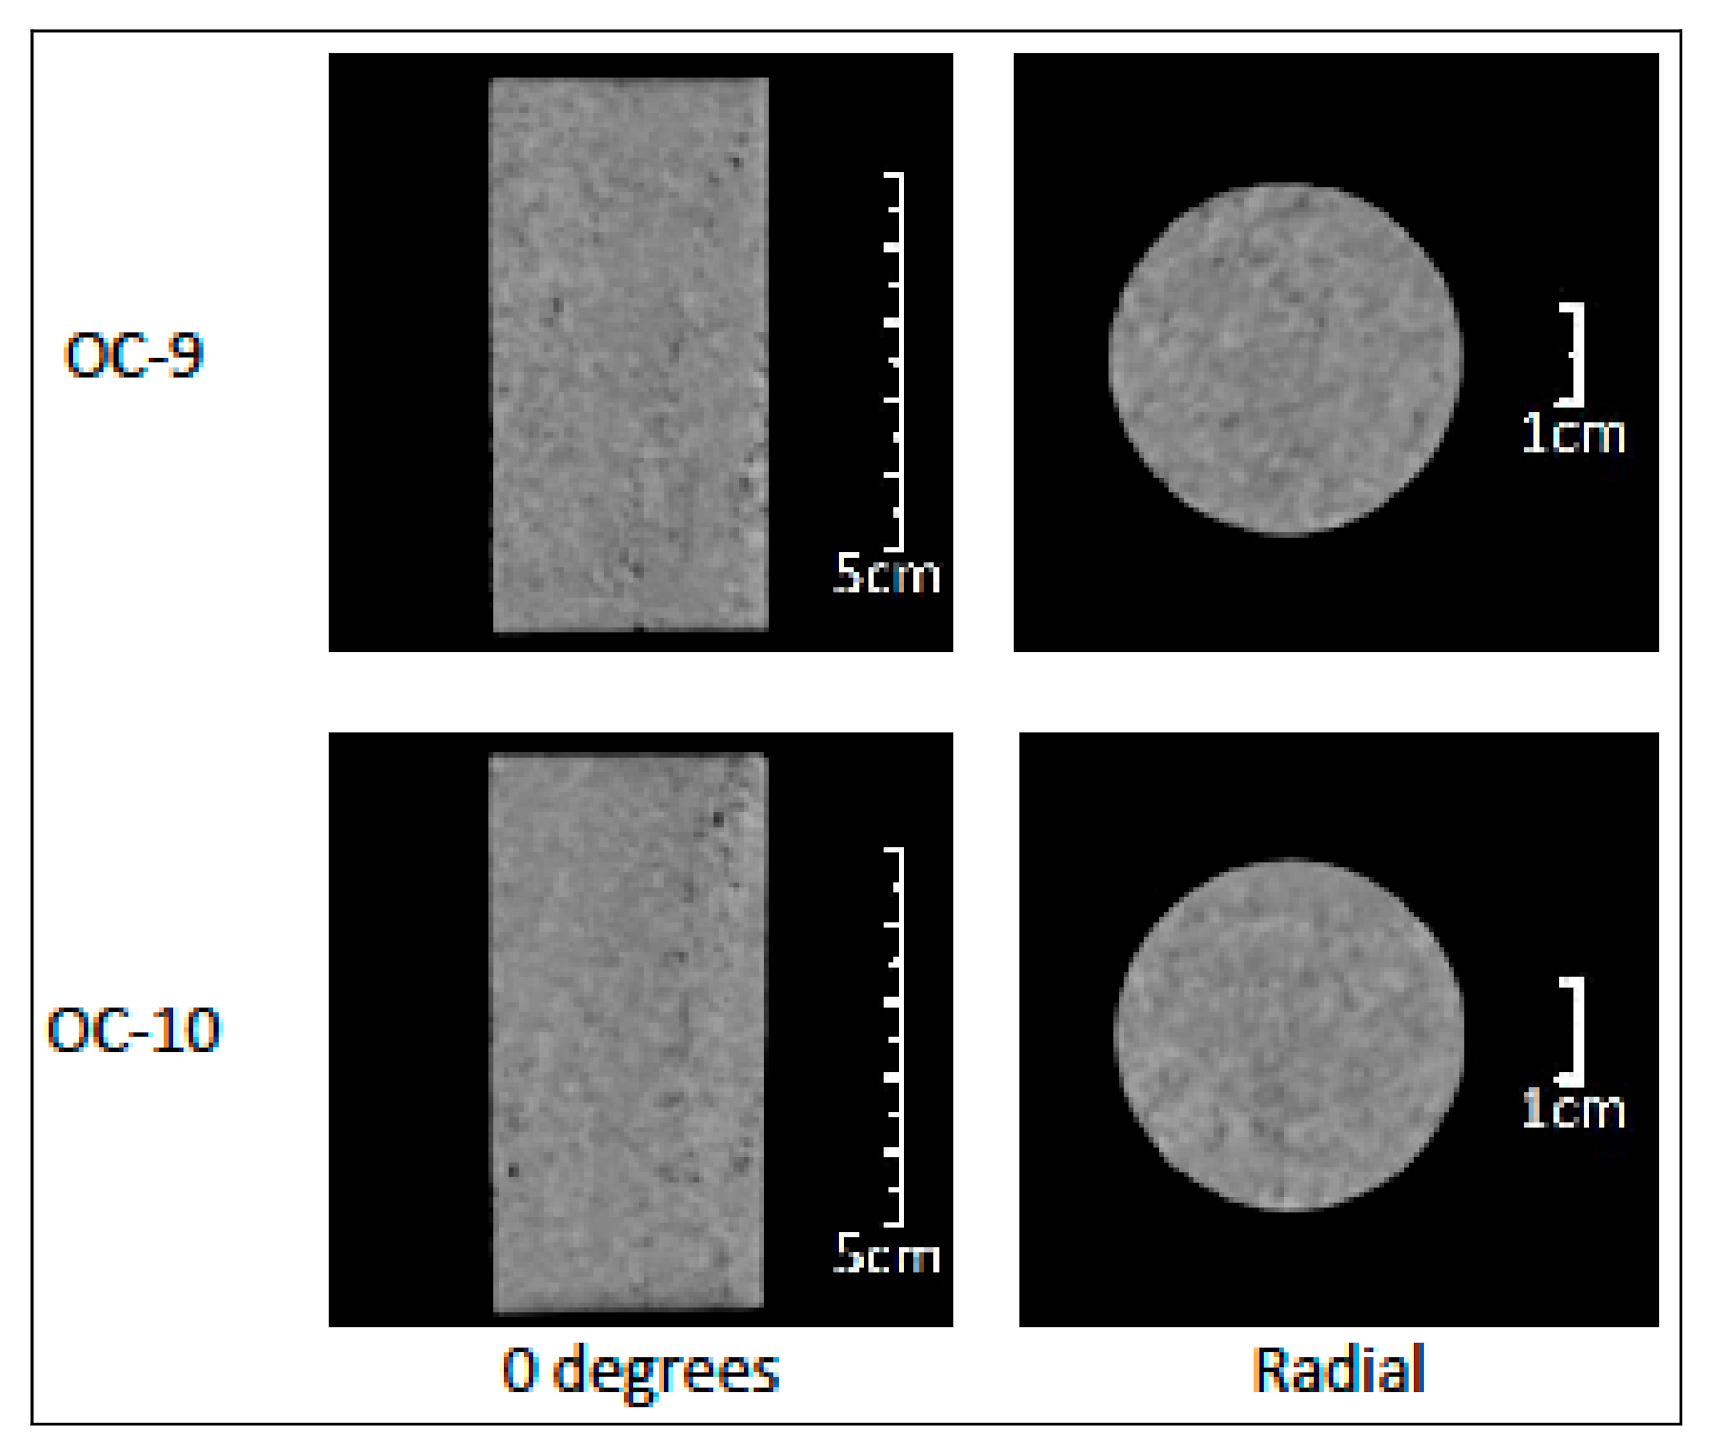
2.3. Rock Sample Preparation Procedure

Experiments were conducted using Indiana limestone outcrop samples. All core samples were prepared for coreflood tests in a consistent manner. Table 2 shows the basic properties of the core samples used in this study. Initially, core samples were cut and trimmed to form 1.5-inch-thick and 3-inch-long cylinders before getting CT scanned. Figure 1 depicts the CT scan images of the core samples. The samples were Soxhlet cleaned using methanol, and then dried in a vacuum oven at 90 °C until constant weight was achieved. Subsequently, samples were fully saturated with formation brine to mimic reservoir conditions. This was done using a high-pressure vacuum saturator operating at 2000 psi for 48 h. At this point, porosity was measured based on the weight difference between fully saturated and dried stage. Saturated core samples were flooded with formation water, at 1500 psi confining pressure, 500 psi back pressure, and 20 °C to measure absolute brine permeability.
Nuclear magnetic resonance (NMR) tests were conducted on the fully saturated core samples. The micro to macro pores percentages were obtained by applying the suggested T2 cut off of 98 ms [27] and integrating the area under the T2-relaxation time. Furthermore, duplicate samples were chosen, to allow the comparison of oil recovery and pressure drop results from both coreflooding experiments.
Core samples were desaturated using the porous plate method. Samples were processed in individual coreholders with confining pressure. Water-wet porous plates with a mean pore diameter of 50 nm were used. Mineral oil was used to displace the formation water. When no more water was displaced, samples were removed and flooded with filtered crude oil to displace the mineral oil. Furthermore, samples were aged for 14 days at 90 °C. Finally, just before conducting the coreflood tests, samples were flooded with crude oil, at reservoir conditions of pressure and temperature, to determine the effective oil permeability.

2.4. Coreflood Setup and Experimental Conditions

During the coreflood test a core sample was placed inside a coreholder, which contains a pressurized sleeve that forces injected fluids to go through the sample. A back pressure regulator, connected to the outlet end of the core, was used to apply the desired pore pressure. To mimic reservoir conditions, all experiments were conducted at 120 °C, confining pressure of 5800 psi, and a back pressure of 3000 psi. The orientation of the coreflood tests was horizontal. The produced effluents were manually collected in small graded tubes in the early stages of the experiment, which allowed for readings of as low as 0.02 cm3. At later stages, larger tubes were used to allow for the oil to accumulate in measureable quantities. The dead volume from the outlet end of the core to the collecting tubes was measured and considered when data analysis was performed.

2.5. Quantitative Unsteady-State Coreflood Tests

Coreflood tests were designed to meet the following objectives. First, examine if LSW would result in higher oil production in secondary mode due to wettability alteration or reducing the residual oil saturation (Sor). Second, test if LSW in tertiary mode would reduce the Sor. Third, extract relative permeability curves of formation water and low salinity brine (SW/50) by history matching, i.e., numerically reproducing both experiments. Finally, provide a way of quantifying the LSW effect, if applicable, by analyzing the extracted relative permeability curves of formation water and SW/50 (see Section 4.2.2).
Two quantitative unsteady-state (USS) coreflooding tests were conducted to examine the effect of LSW on carbonates under reservoir conditions of an Abu Dhabi field. The chosen core samples were selected as a pair because of the similar properties. This is necessary to increase the validity of oil recovery comparisons between FW and the low salinity (LS) brine, SW/50. The tests entailed injecting FW in one sample and LS brine (SW/50) in the other; both core samples were at Swi (secondary mode). Additionally, SW/50 was injected in tertiary mode to test if it can reduce the residual oil saturation. In an attempt to mimic real reservoir conditions, brines were injected at a flow rate of 0.05 cm3/min, which is equivalent to approximately 1 ft/day. However, bumped up flow rates were applied to minimize the capillary end effect, which can hugely render the capturing of any potential low salinity effects [28]. To increase the reliability of the comparisons, flow rates and number of pore volumes injected, in secondary mode, were the same for both experiments.

3. Numerical Methods

3.1. Mathematical Model

To perform numerical modeling of fluid flow in porous media, a mathematical model of the system has to be developed. A mathematical model should be representative of the system of interest and should capture the important physical aspects of the problem. Development of such a model is illustrated in this section.
Flow in porous media usually includes more than one fluid, so is the case in this study where we have two flowing phases; water and oil. Applying the material balance equation and Darcy’s law to each phase, water and oil flow Equations read as follows:
. k λ w p w γ w D + q ^ w = ϕ s w t   + ϕ s w c w + c ϕ p w t   ,
. k λ o p o γ o D + q ^ o = ϕ s o t + ϕ s o c o + c ϕ p o t   ,
where k is the absolute permeability of the rock, λ α =   k r α / μ α is the phase mobility ( α = w , o ) , k r α and μ α are the relative permeability and phase viscosity, respectively. Moreover, p α is the phase pressure, γ α is the specific weight of the phase, D is the depth measured from a datum, q ^ α is the phase source or sink flow rate per unit rock volume, ϕ is the porosity of the rock, and s α is the phase saturation. The compressibility of the water, oil, and rock are denoted by   c w ,   c o , and c ϕ , respectively. At this point, there are four unknowns: two phase pressures and two fluid saturations. However, we only have two equations: the two flow equations. To form a complete model, two closure relations are required; one is provided by assuming that the fluids completely fill the pore space, i.e., s w + s o = 1 , and the other is the water–oil capillary pressure relation p c o w = p o p w .
The flow equations were solved using the implicit pressure-explicit saturation (IMPES) method. This method was first used in the works of Sheldon and Cardwell [29]. The idea is to come up with a single pressure equation by combining both flow equations and a single saturation equation. The basic assumption of the IMPES method is that the capillary pressure is constant over a time step [30]. With the use of the closure relations and the basic IMPES assumption p c w o / t 0 , Equation (1) can be rewritten in terms of oil phase pressure ( p o ):
. k λ w p o γ w D p c w o + q ^ w = ϕ s w t + ϕ s w c w + c ϕ p o t   .
Equation (3) constitutes the saturation equation. Adding Equations (2) and (3) gives the total pressure equation, where the oil phase pressure is the only unknown:
. k p o λ t D λ o γ o + λ w γ w p c w o λ w + q ^ t = ϕ c t p o t   ,
where
q ^ t = q ^ o + q ^ w   , λ t = λ o + λ w   ,   a n d c t = s o c o + s w c w + c ϕ   .
To complete the mathematical model, initial and boundary conditions must be specified. Herein, the focus was to model USS coreflooding experiments and thus a Neumann boundary condition of a certain influx at the inlet of the model (x = 0) was specified. A Dirchlet boundary condition was used to set a fixed back pressure at the outlet (x = core length). An additional grid cell was added at the inlet and another was added at the outlet to mimic the flanges in the laboratory coreflooding setting. This step, along with setting the capillary pressure to zero in the additional grid cells, was crucial for capturing the capillary end effects as will be discussed in the following section. The initial pressure was set equal to the back pressure and the initial fluid distribution was determined by the experimental Swi.
A finite difference scheme was used to discretize the mathematical model. Specifically, the two-point flux approximation (TPFA) method was used. This scheme is robust, relatively easy to implement, and is the current industry standard in reservoir simulation [31]. Fluxes are measured at the edges shared by neighboring cells. Therefore, properties such as permeability and mobility had to be well defined at the edges. Harmonic averaging was used to map permeabilities from cells to edges. First order upstream weighing was used to determine the associated mobility. Furthermore, Euler backward difference was used to solve for the time derivative. The discretized equations were implemented in MATLAB® development environment. The linear system of equations of order   n , where n is the number of grid blocks, was solved by employing MATLAB’s backslash solver to obtain the grid block pressures. Once pressures were updated, saturations were solved explicitly using the discretized saturation equation.
The CFL condition, named after Courant, Friedrichs, and Lewy, places a more severe constraint on the explicit treatment of the flow equations which is the case with the IMPES method. The CFL in simple words states that for the finite difference to be stable and converge, information has to get the chance to propagate at the correct physical speeds [32]. That was accomplished by using a time step of 0.00001 day which allowed for a maximum saturation variation of 0.006 over one-time step.

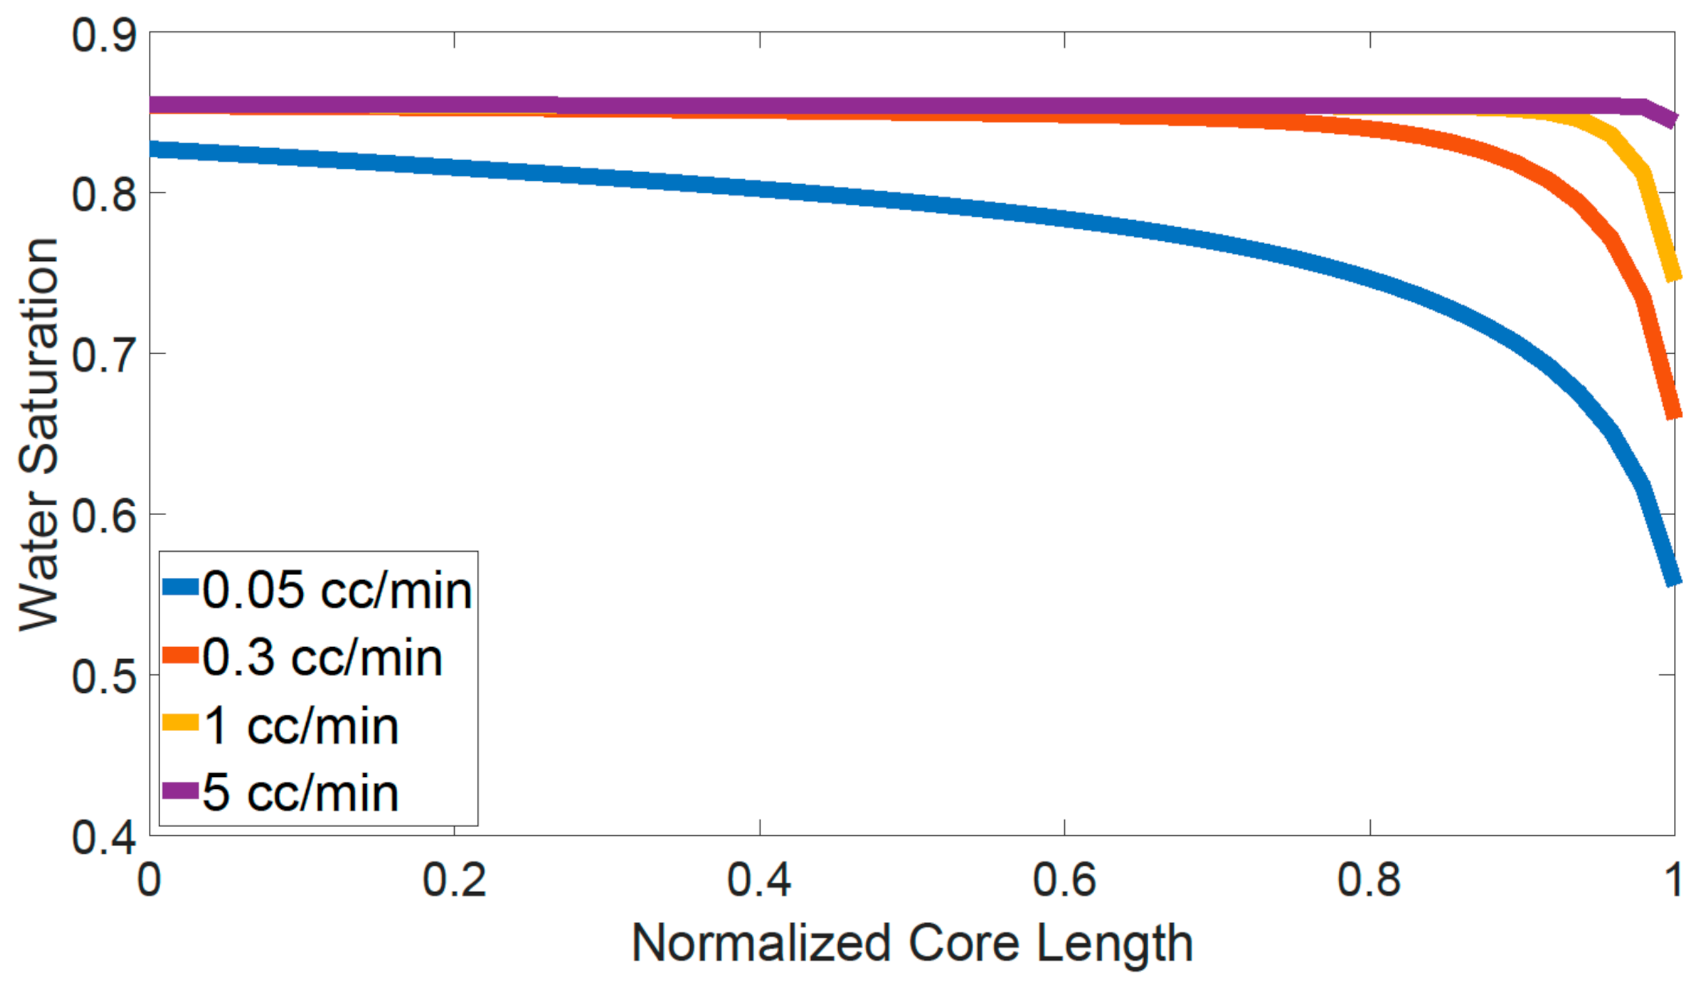
3.2. Capturing the Capillary End Effect

Theoretically, injecting at a specified rate for a long enough period of time should lead to the final remaining oil saturation. However, that was not the case in the conducted experiments where the remaining oil saturation decreased by increasing the brine injection rate, as will be shown in the results section. This could be due to exceeding the critical capillary number or overcoming the capillary end effect. Because the experiment was carefully designed not to exceed the critical capillary number, it is likely that the decrease in the remaining oil saturation is due to overcoming the capillary end effect. This coincides with the findings in [28] which states that for laboratory experiments conducted on strongly water-wet/oil-wet systems, the remaining oil saturation is strongly impacted by the capillary end effects. Capillary end effects occur when there is a discontinuity in the capillary pressure curve, which is the case at the inlet and outlet sides of the core in a core holder during a coreflooding experiment. At this region, fluids are flowing from a non-porous medium to a porous medium and vice versa, thus introducing a discontinuity. In such a case, capillary forces are important and cannot be neglected.
Without modifying the boundary conditions, it will not be possible to mimic the experimental results since the first flow rate will achieve the final remaining oil saturation. To have a representative model of the experimental work, the capillary end effect had to be captured. To model capillary end effects, capillary forces were taken into account along with including an additional grid cell at the inlet and another at the outlet with a specified capillary pressure equal to zero in the added grid cells [33].

4. Results and Discussion

4.1. Experimental Results

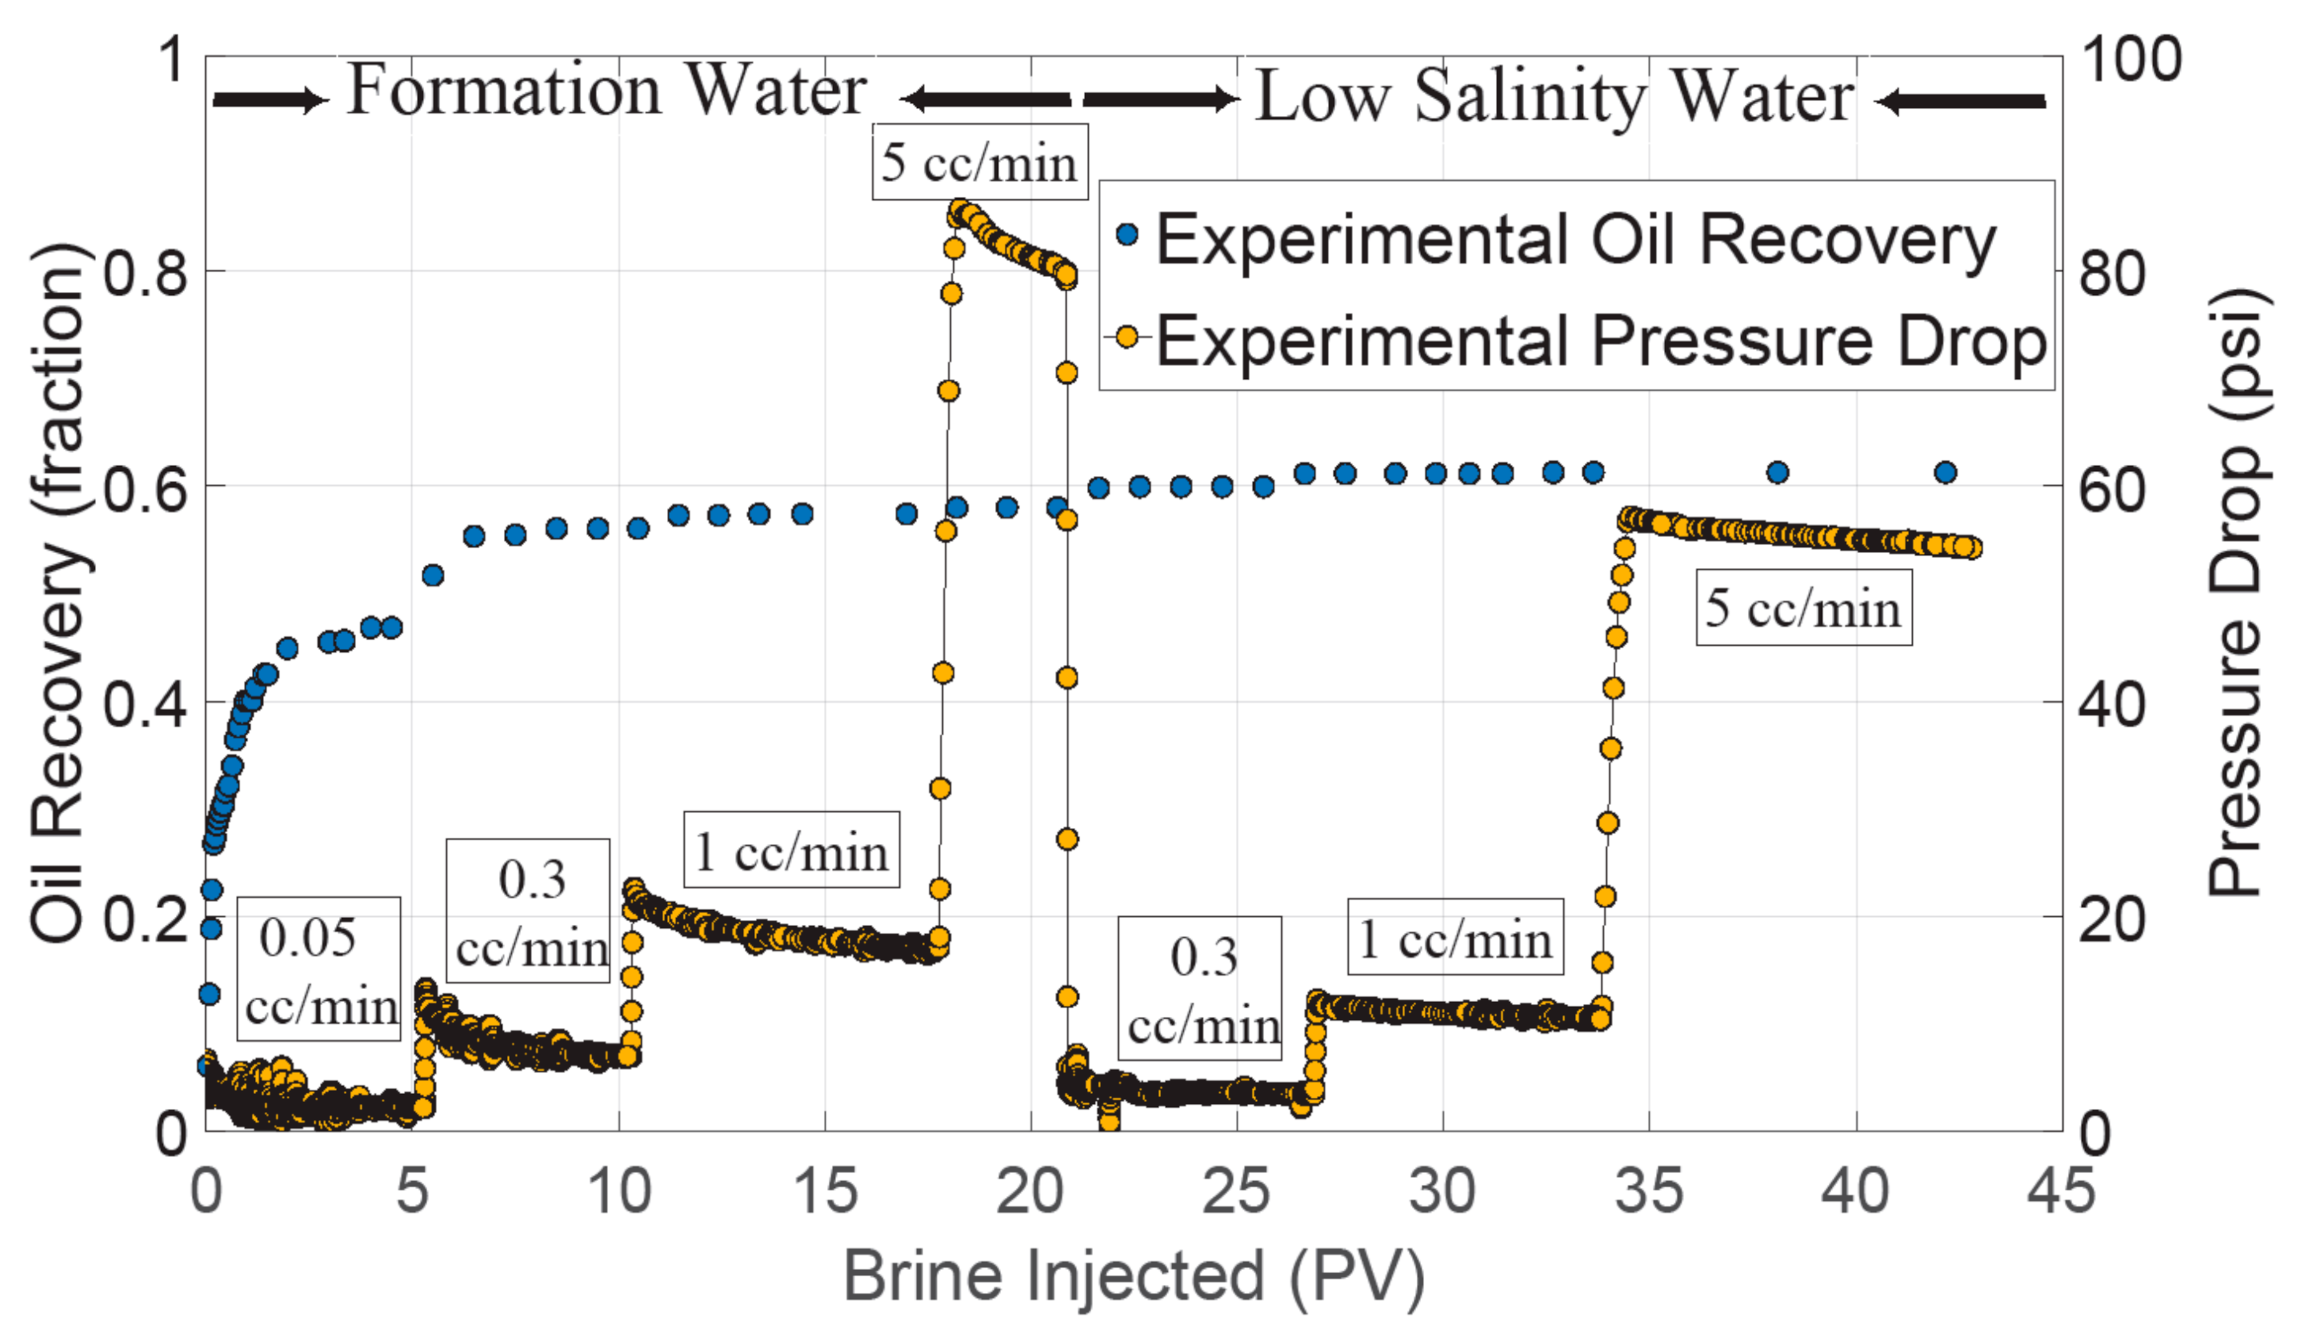
4.1.1. First Coreflooding Experiment (USS-1)

The first coreflooding experiment was performed on sample OC-10 and was considered a tertiary mode test as FW was injected initially, followed by SW/50. The test was designed to examine if the LS brine can decrease the remaining oil saturation and to establish a baseline for comparisons, as one of the goals was to compare the results of this test with the results of USS-2. Towards this end, FW was first injected at 0.05 cm3/min, followed by flow rate bump ups to overcome capillary forces and to get as close as possible to the Sor before switching to the LS brine. In tertiary mode, LS brine was injected with similar flow rates to the ones in secondary mode to allow for comparing the pressure drop profile. Figure 2 shows the oil recovery and pressure drop for USS-1.
The production profile confirmed that the sample is non water-wet as more oil was produced at bump up rates, indicating high negative capillary pressure curves. In secondary mode, a total of around 22 pore volumes of FW were injected with varying flow rates. Starting with 0.05 cm3/min, a total of 47% of oil originally in place (OOIP) was recovered. Another 9% of OOIP was recovered when the flow rate was increased to 0.3 cm3/min, indicating the existence of capillary end effects. Further increase in the flow rate to 1 cm3/min and 5 cm3/min resulted in additional 2% oil recovery. Furthermore, the flow rate was dropped to 0.3 cm3/min again before switching to SW/50. During this drop a small amount of oil was recovered, however it might be due to experimental artifacts because at a flow rate of 5 cm3/min, for around 3 pore volumes, no quantifiable oil was produced. Therefore, the additional oil was not attributed to the 5 cm3/min FW injection nor to LS brine injection.
When no more production was observed with FW, the injection brine was changed to SW/50. The pressure drop by the LS brine is clearly lower than that caused by FW, which is predictable since the LS brine has lower viscosity compared to FW. An incremental oil recovery of ~1% was achieved after the switch to LS brine. However, the incremental oil was only recovered after bumping up the flow rate from 0.3 cm3/min to 1 cm3/min. This implies that LSW successfully mobilized some of the trapped oil. However, the pressure drop by LSW was not high enough to overcome the modified capillary pressure and only after inducing higher pressure drops, by virtue of increasing the flow rate, the oil was recovered. Furthermore, the pressure drop across the test seemed to be stable, indicating no formation damage.

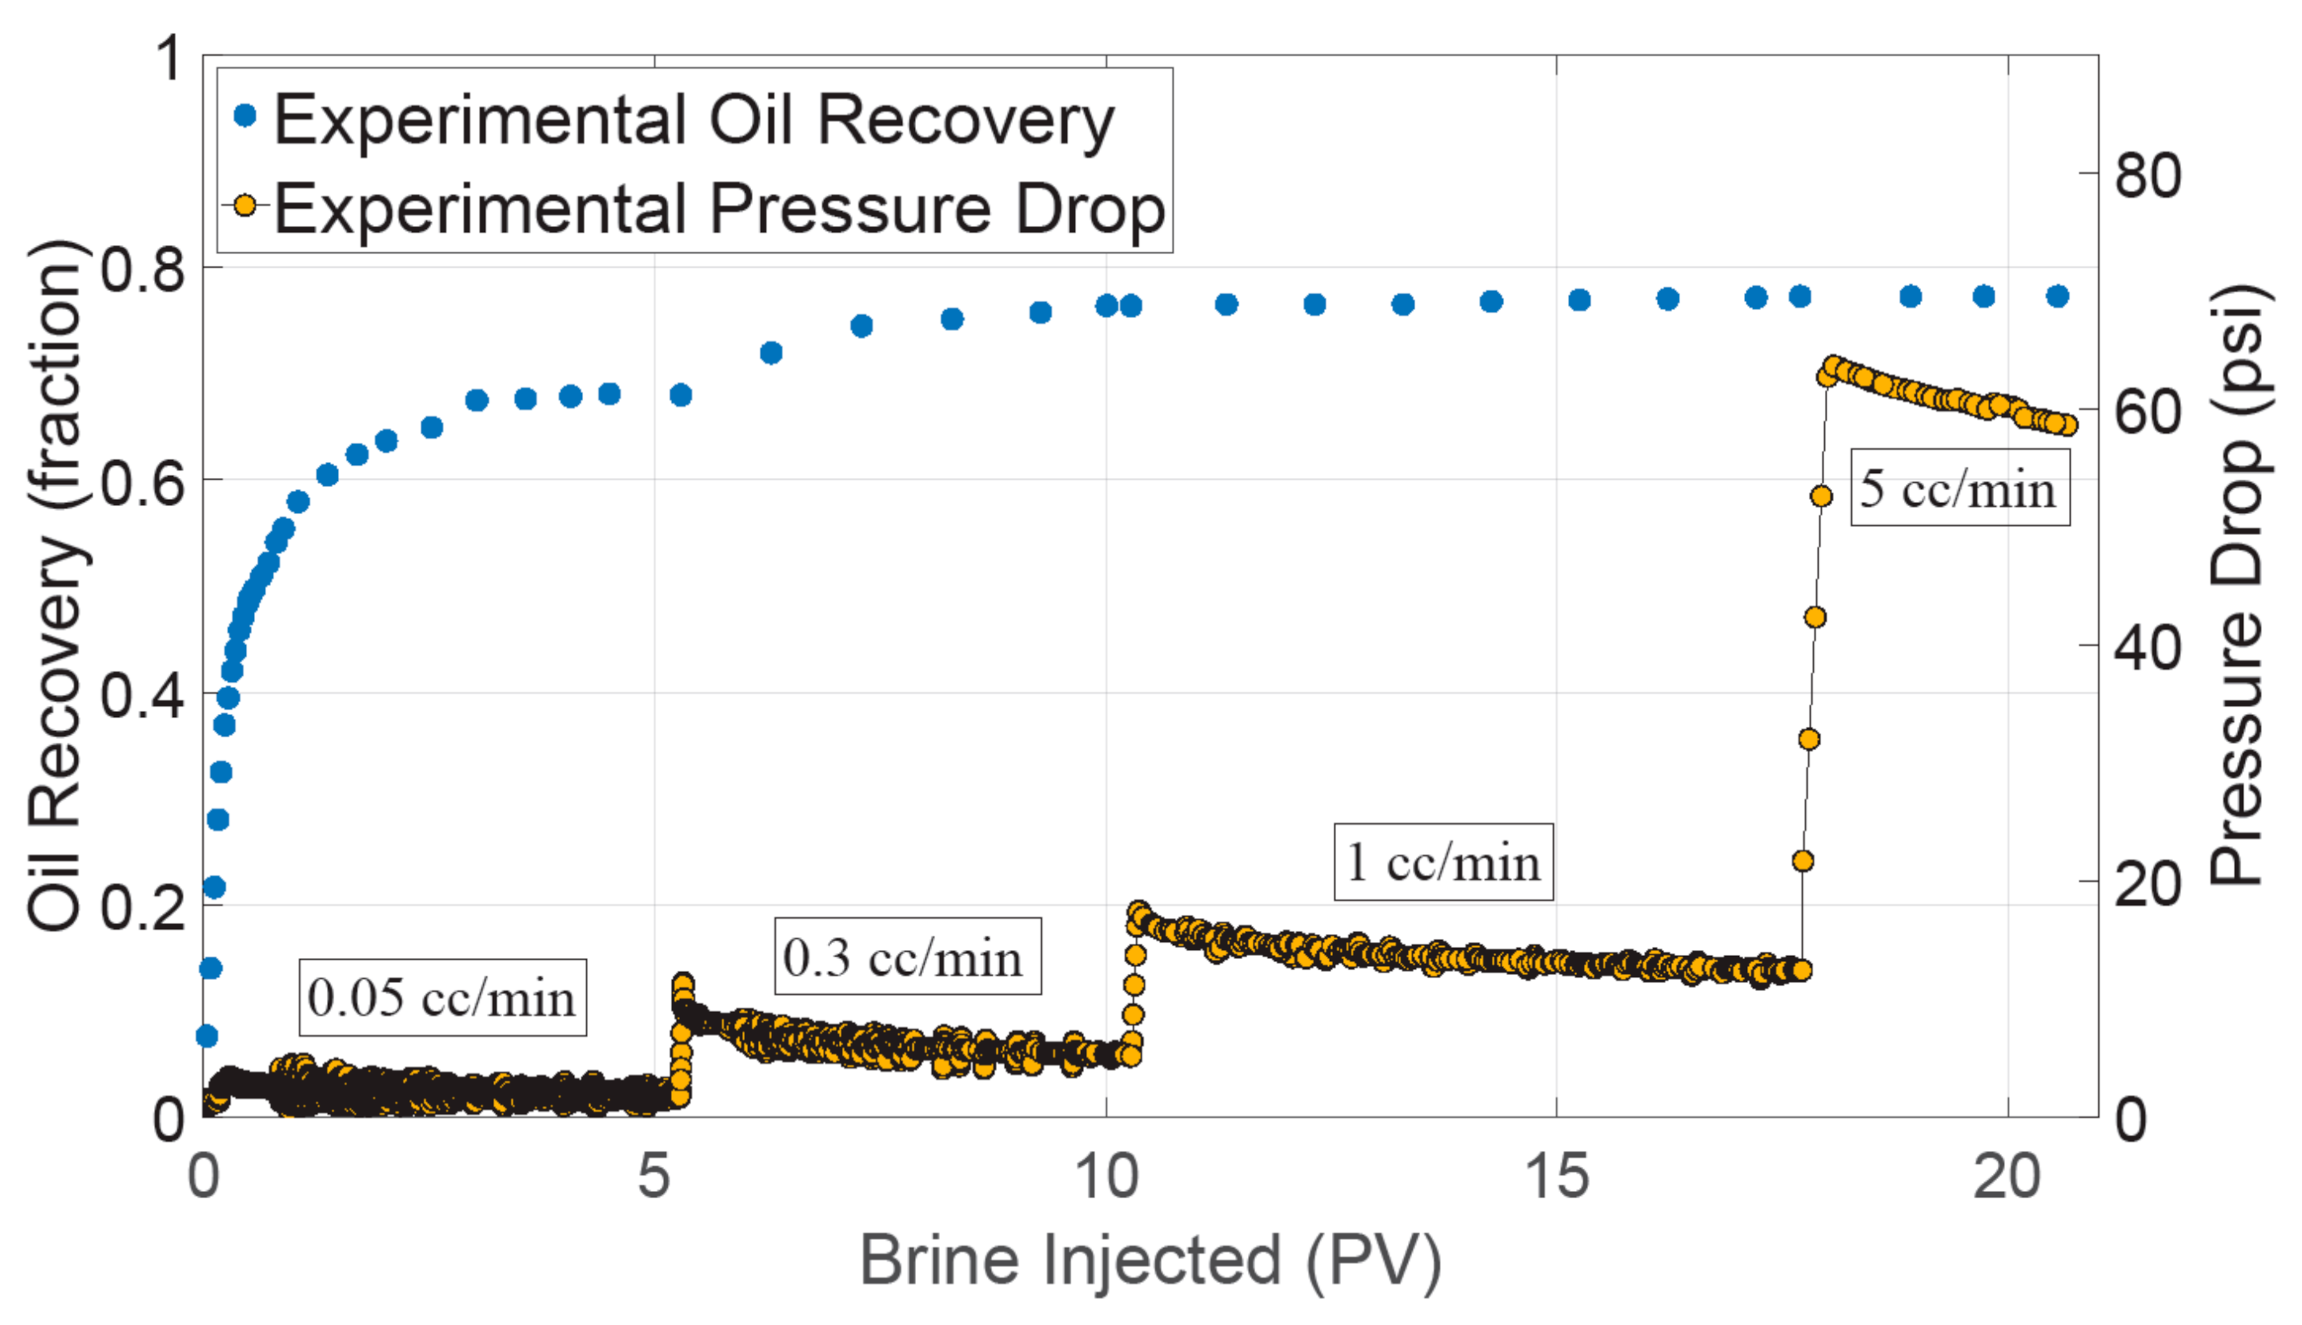
4.1.2. Second Coreflooding Experiment (USS-2)

This coreflood was a secondary coreflood and it was performed on sample OC-9. The LS brine was injected in secondary mode at Swi. The objective of this experiment was to examine if there is any LSW effect in secondary mode, compared to the base case of USS-1, caused by wettability alteration or reduction in Sor. Another goal was to provide the data to allow extracting the relative permeability and capillary pressure curves by history matching. To allow for comparisons, flow rates and number of injected pore volumes were similar to those used in USS-1. Figure 3 shows the oil recovery and pressure drop for USS-2.
For USS-2 it can be seen that more production was obtained when higher flow rates were applied, thus implying that the sample is non-water-wet. A total of around 22 pore volumes were injected starting with 0.05 cm3/min, followed by 0.3 cm3/min, 1 cm3/min, and finally 5 cm3/min. During the first flow rate, 68% of OOIP was recovered. Increasing the flow rate to 0.3 cm3/min resulted in an additional 7% oil recovery, again confirming the presence of the capillary end effects. A further increase in the flow rate resulted in 2% incremental oil recovery. Thus, LSW resulted in a total recovery of 77%. The pressure drop throughout the test seemed to be stable, indicating no formation damage.

4.1.3. Comparison between USS-1 and USS-2

Both coreflooding tests were designed to allow for a comparative analysis and to examine the effects of LSW in secondary mode. Figure 4 depicts the oil recovery and pressure drop data, in secondary mode, for both experiments. As mentioned earlier, both samples showed non water-wet characteristics. In terms of total oil recovery, LSW resulted in a total of 77% oil recovery whereas FW resulted in a total recovery of 61%. Results show the potential of secondary LSW in increasing the oil recovery by wettability alteration or reducing the remaining oil saturation. At a typical field rate of ~1 ft/day, LSW resulted in not only ~20% higher oil recovery compared to FW but also recovered oil sooner. However, it is impractical to directly translate such results to field scale. Considering the fact that oil production in non water-wet short samples is dependent on the pressure drop, and the fact that LSW, as expected, showed lower pressure drops, suggests that the capillary pressure curves for LSW are less negative compared to FW. This consequently suggests that LSW altered the wettability to more water-wet. This can be confirmed by extracting the relative permeability curves for both FW and LS brine, and this is provided in the numerical results section that follows.

4.2. Numerical Results

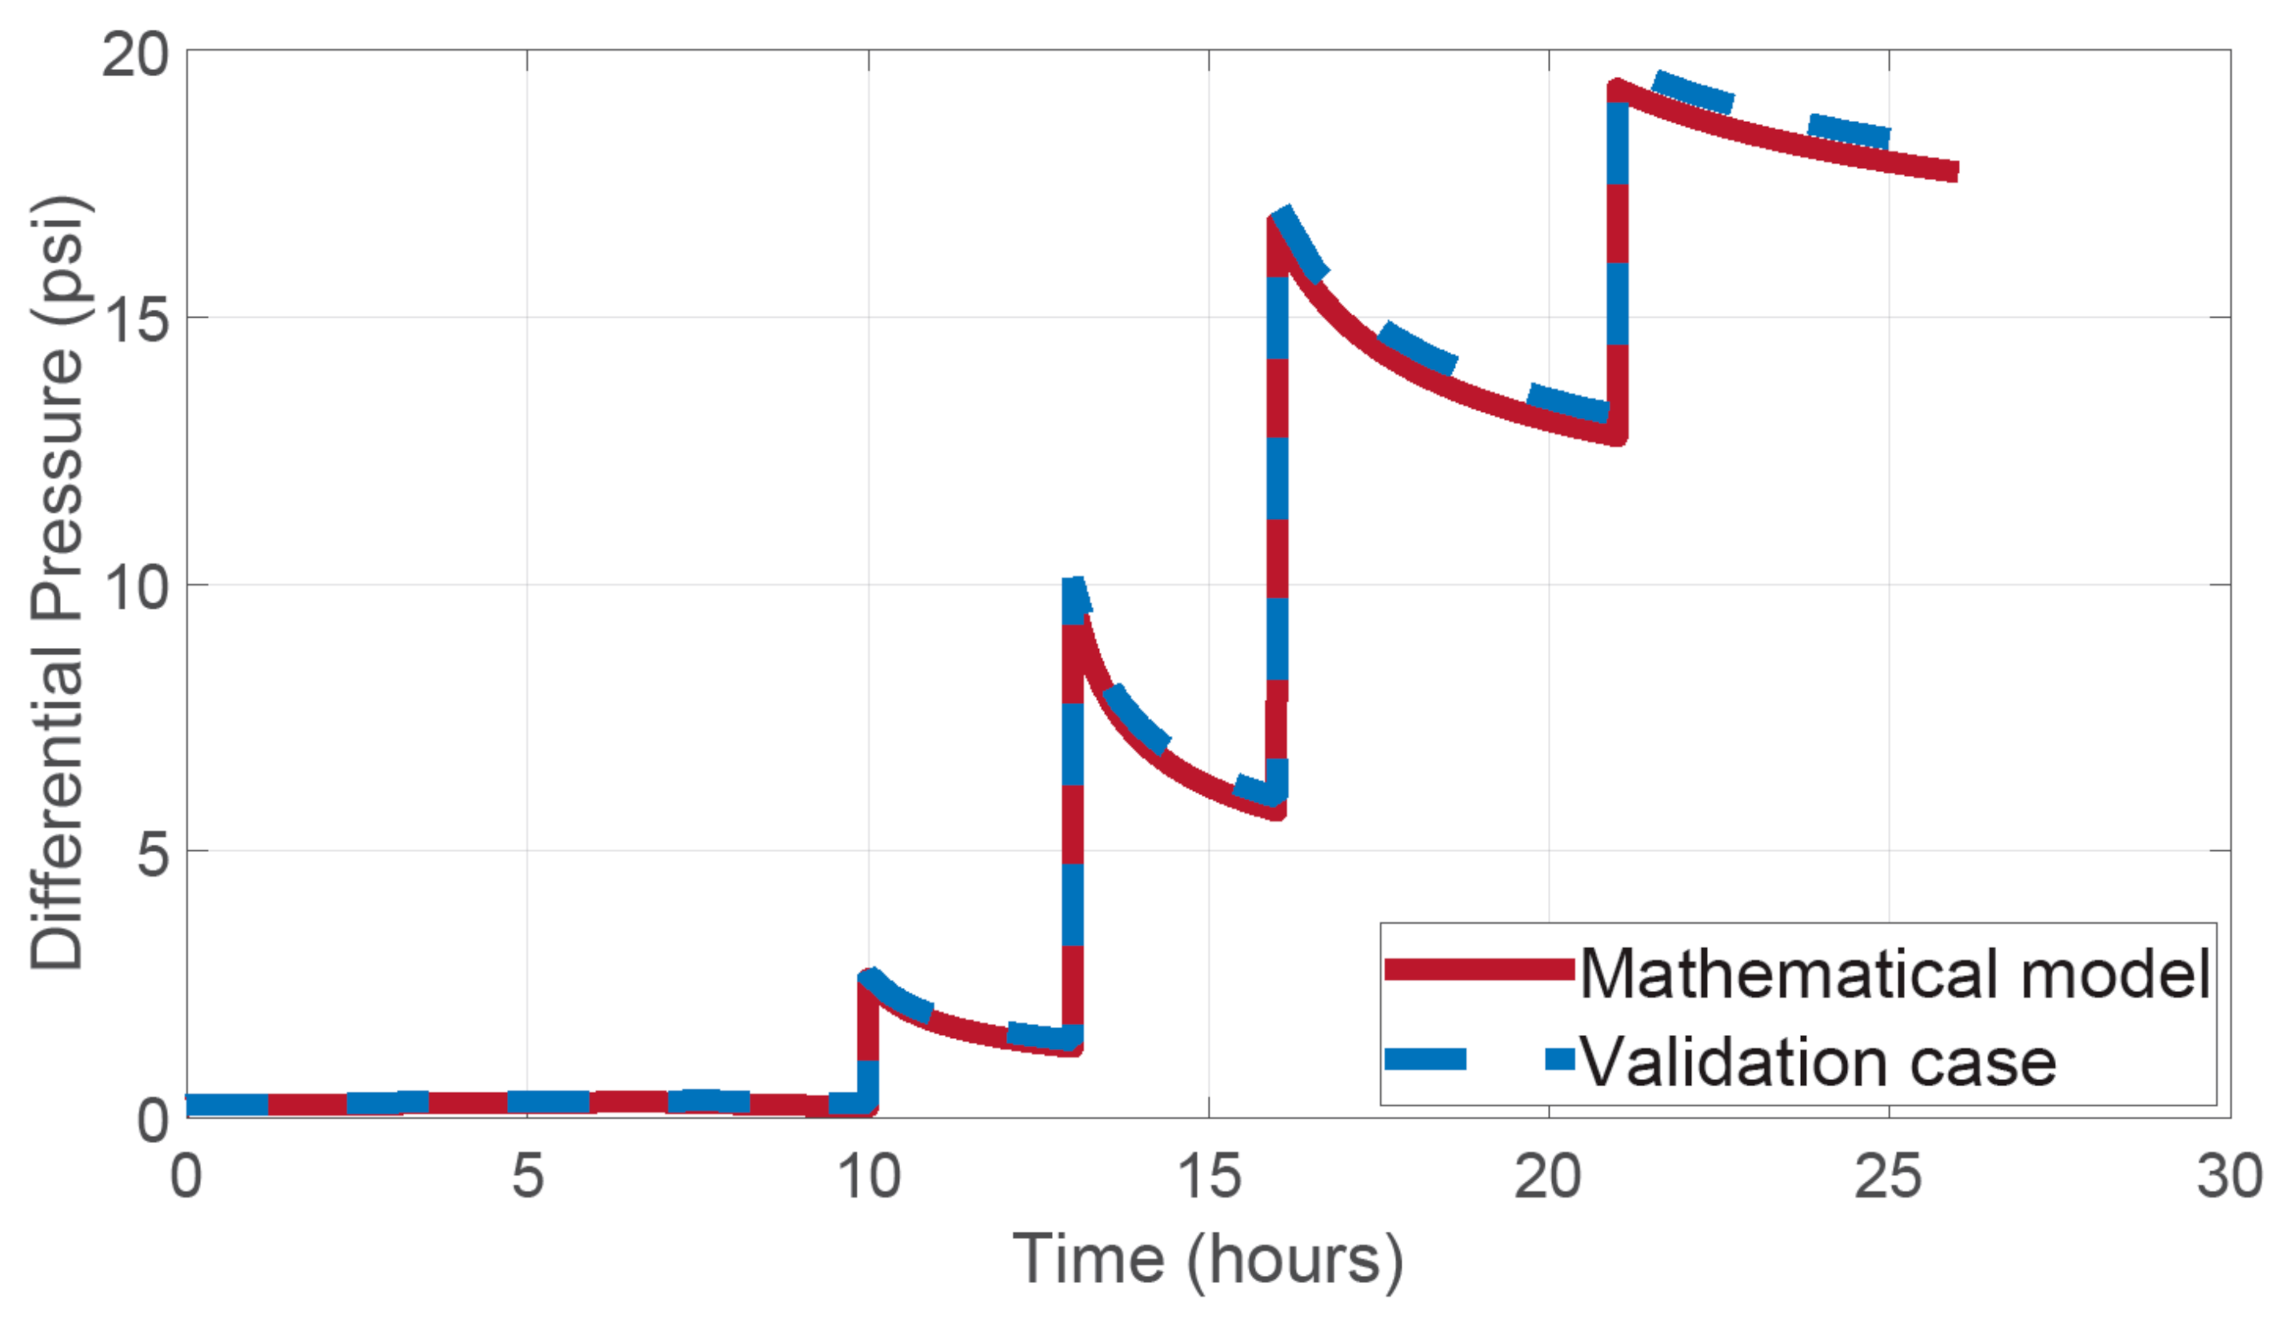
4.2.1. Verification of the Mathematical Model

A study conducted by Lenormand et al. [33] compared four SCAL simulators by running five simulation cases and comparing pressures and average water saturation profiles. A simplistic direct simulation case (no history matching) of unsteady-state imbibition with smooth capillary pressure curve was chosen to verify the mathematical model. The chosen case is identical to Case 3 in [33]. Table 3 shows the input fluid and core sample properties. Table 4 gives the simulation time and the corresponding flow rates. Figure 5 shows the relative permeability and capillary pressure curves used in the verification case.
To verify our mathematical model, the verification case was run and the average water saturation and differential pressure across the core sample were plotted against the results of case 3 reported in [33]. Figure 6 shows the average water saturation comparison results. Moreover, differential pressure results are depicted in Figure 7. Results show a good agreement between our mathematical model and the SCAL simulators used in [33].

4.2.2. Numerical Interpretation of the Experiments

The developed mathematical model was used to confirm the physical plausibility of the experimental coreflooding tests, and to extract relative permeability and capillary pressure curves. A two dimensional 50 × 1 × 2 Cartesian grid was used to match the experimental data. Input data included sample basic properties such as dimensions, porosity, absolute permeability, and initial water saturation. Additionally, densities and viscosities at experimental conditions of pressure and temperature were fed to the simulator. Relative permeability curves were generated using Brooks and Corey model [34]. The Brooks and Corey relative permeability function model is given by:
k r w S w = k r w * S w     S w r 1 S w S o r w n w ,
k r o S w = k r o * 1 S w     S o r 1 S w r S o r w n o ,
where S w   is the current water saturation, S w r   is irreducible water saturation, S o r w is the residual oil saturation, n o is Corey’s exponent for oil, n w is Corey’s exponent for water, k r o * is Corey’s endpoint relative permeability for oil, and k r w * is Corey’s endpoint relative permeability for water. To constrain the history matching,   S w r ,   S o r w ,   k r o * , and k r w * were determined from the experimental data, whereas oil and water Corey exponents were manually tuned to achieve a match with the experimental data. Tabular capillary pressure data were read into the simulator and tuned to history match the experiment.
It can be noticed from the coreflooding results that higher oil production was achieved whenever a higher flow rate was used. Taking into account that the experiment was carefully designed not to exceed the critical capillary number, this implies that capillary end effects were present. Initially at a low flow rate, oil is recovered until the specified water saturation functions prevented additional oil recovery. As the flow rate is increased, the increased viscous forces overcome the capillary end effects and mobilizes more oil. Figure 8 and Figure 9 show the numerically simulated water saturation profile for coreflooding experiments USS-1 and USS-2, respectively. It can be clearly seen that a significant amount of oil is being trapped near the outlet by the capillary end effect, particularly for low flow rates.
The history match of oil recovery and pressure drop of USS-1 and USS-2 are shown in Figure 10 and Figure 11, respectively.
Additionally, Figure 12 and Figure 13 show a comparison between the extracted relative permeability and capillary pressure curves for USS-1 and USS-2.
From Figure 12, we can clearly see a shift in residual oil saturation by LSW. Moreover, LSW resulted in a clear shift on the relative permeability curves as it increased the oil relative permeability and decreased the water relative permeability compared to FW, which lead to the higher oil recovery. Consistent with the shift in relative permeability, LSW resulted in lower negative capillary pressure values compared to FW.
It is important to emphasize that no matter how close reservoir conditions are imitated in laboratory corefloods, results cannot be simply extrapolated to field scale on a one to one basis because corefloods have a nearly perfect volumetric sweep efficiency. Moreover, various flowrates and pore volumes injected are usually used in corefloods to overcome capillary end effects which is not the case for field scale. Several studies quantified the LSW effect by using the analytical Buckley Leveret model which assumes 1-D and volumetric sweep efficiency of unity [17,35]. However, at field scale, volumetric sweep efficiency is definitely not equal to one and should be included in the estimation of the recovery factor.
Extracting reliable relative permeability curves is the first step in quantifying the LSW effect at field scale. Extracting relative permeability curves from multiple core samples from a real field is required, in addition to using full field models that incorporate field and geology specific properties.

5. Summary and Conclusions

This paper reports a systematic investigation with the aim of quantifying the effects of LSW. The objectives were to experimentally evaluate LSW effects at laboratory scale, numerically validate and interpret the coreflooding experiments, and provide a basis to quantifying the LSW effect at field scale. The experimental and numerical results confirm the potential of LSW for carbonate samples and the following conclusions can be drawn:
  • In the quantitative USS-1 test, the injection of LSW in tertiary mode resulted in an incremental oil recovery of 1%. However, the incremental oil was only recovered after bumping up the flow rate from 0.3 cm3/min to 1 cm3/min. This implies that LSW successfully mobilized some of the trapped oil. However, the pressure drop by LSW was not high enough to overcome the modified capillary pressure and only after inducing higher pressure drop, by virtue of increasing the flow rate, was the oil recovered.
  • Comparing the secondary mode of both USS-1 and USS-2, the results show the potential of LSW in increasing the oil recovery by wettability alteration or reducing the remaining oil saturation. At a typical field rate of ~1 ft/day, LSW resulted in not only ~20% higher oil recovery compared to FW but also recovered oil sooner.
  • The development of a verified mathematical model with the appropriate assumptions and boundary conditions confirmed the physical plausibility of the USS coreflooding experiments and provided a better understanding of the history matching process.
  • The numerically extracted relative permeability curves confirmed the potential of LSW in enhancing oil recovery by altering the wettability of the rock towards less oil-wet. It also lays the foundation to quantifying the LSW effect at full field scale.

Author Contributions

Conceptualization, O.C., M.A.K. and M.H.; methodology, O.C.; formal analysis, O.C. and M.H.; investigation, O.C.; writing—original draft preparation, O.C.; writing—review and editing, O.C., M.H. and M.A.K.; supervision, M.H. and M.A.K. All authors have read and agreed to the published version of the manuscript.

Funding

This research received no external funding.

Conflicts of Interest

The authors declare no conflict of interest.

References

  1. Bernard, G. Effect of floodwater salinity on recovery of oil from cores containing clays. In Proceedings of the SPE California Regional Meeting, Los Angeles, CA, USA, 26 October 1967. [Google Scholar] [CrossRef]
  2. Tang, G.; Morrow, N. Salinity, temperature, oil composition, and oil recovery by waterflooding. SPE Res. Eng. 1997, 12, 269–276. [Google Scholar] [CrossRef]
  3. Morrow, N.; Buckley, J. Improved oil recovery by low-salinity waterflooding. J. Pet. Technol. 2011, 63, 106–112. [Google Scholar] [CrossRef]
  4. Sheng, J.J. Critical review of low-salinity waterflooding. J. Pet. Sci. Eng. 2014, 120, 216–224. [Google Scholar] [CrossRef]
  5. Hognesen, E.J.; Strand, S.; Austad, T. Waterflooding of preferential oil-wet carbonates: Oil recovery related to reservoir temperature and brine composition. In Proceedings of the SPE Europec/EAGE Annual Conference, Madrid, Spain, 13 June 2005. [Google Scholar] [CrossRef]
  6. Webb, K.J.; Black, C.J.J.; Tjetland, G. A laboratory study investigating methods for improving oil recovery in carbonates. In Proceedings of the SPE International Petroleum Technology Conference, Doha, Qatar, 21 November 2005. [Google Scholar] [CrossRef]
  7. Zhang, P.; Tweheyo, M.T.; Austad, T. Wettability alteration and improved oil recovery by spontaneous imbibition of seawater into chalk: Impact of the potential determining ions Ca2+, Mg2+, and SO42−. Colloid Surf. 2007, 301, 199–208. [Google Scholar] [CrossRef]
  8. Strand, S.; Puntervold, T.; Austad, T. Effect of temperature on enhanced oil recovery from mixed-wet chalk cores by spontaneous imbibition and forced displacement using seawater. Energy Fuels 2008, 22, 3222–3225. [Google Scholar] [CrossRef]
  9. Romanuka, J.; Hofman, J.; Ligthelm, D.J.; Suijkerbuijk, B.; Marcelis, F.; Oedai, S.; Brussee, N.; van der Linde, H.; Aksulu, H.; Austad, T. Low salinity EOR in carbonates. In Proceedings of the SPE Improved Oil Recovery Symposium, Tulsa, OK, USA, 14 April 2012. [Google Scholar] [CrossRef]
  10. Bagci, S.; Kok, M.V.; Turksoy, U. Effect of brine composition on oil recovery by waterflooding. J. Pet. Sci. Technol. 2001, 19, 359–372. [Google Scholar] [CrossRef]
  11. Gupta, R.; Smith, P.G.J.; Hu, L.; Willingham, T.W.; Cascio, M.L.; Shyeh, J.J.; Harris, C.R. Enhanced waterflood for middle east carbonate cores–impact of injection water composition. In Proceedings of the SPE Middle East Oil and Gas Show and Conference, Manama, Bahrain, 25 September 2011. [Google Scholar] [CrossRef]
  12. Yousef, A.A.; Al-Saleh, S.H.; Al-Kaabi, A.; Al-Jawfi, M.S. Laboratory investigation of the impact of injection-water salinity and ionic content on oil recovery from carbonate reservoirs. SPE Reserv. Eval. Eng. 2011, 14, 578–593. [Google Scholar] [CrossRef]
  13. Zahid, A.; Shapiro, A.; Skauge, A. Experimental studies of low salinity water flooding in carbonate reservoirs: A new promising approach. In Proceedings of the SPE EOR Conference at Oil and Gas West Asia, Muscat, Oman, 16 April 2012. [Google Scholar] [CrossRef]
  14. Chandrasekhar, S.; Mohanty, K.K. Wettability alteration with brine composition in high temperature carbonate. In Proceedings of the SPE Annual Technical Conference and Exhibition, New Orleans, LA, USA, 30 September 2013. [Google Scholar] [CrossRef] [Green Version]
  15. Al-Attar, H.H.; Mahmoud, M.Y.; Zekri, A.Y.; Almehaideb, R.A.; Ghannam, M.T. Low Salinity Flooding in a Selected Carbonate Reservoir: Experimental Approach. In Proceedings of the EAGE Annual Conference & Exhibition Incorporating SPE Europec, London, UK, 10 June 2013. [Google Scholar] [CrossRef]
  16. Awolayo, A.; Sarma, H.; AlSumaiti, A.M. A laboratory study of ionic effect of smart water for enhancing oil recovery in carbonate reservoirs. In Proceedings of the SPE EOR conference at oil and gas West Asia, Muscat, Oman, 31 March 2014. [Google Scholar] [CrossRef]
  17. Nasralla, R.A.; Mahani, H.; van der Linde, H.A.; Marcelis, F.H.; Masalmeh, S.K.; Sergienko, E.; Brussee, N.J.; Pieterse, S.G.; Basu, S. Low salinity waterflooding for a carbonate reservoir: Experimental evaluation and numerical interpretation. J. Petrol. Sci. Eng. 2018, 164, 640–654. [Google Scholar] [CrossRef]
  18. Feldmann, F.; Strobel, G.J.; Masalmeh, S.K.; AlSumaiti, A.M. An experimental and numerical study of low salinity effects on the oil recovery of carbonate rocks combining spontaneous imbibition, centrifuge method and coreflooding experiments. J. Petrol. Sci. Eng. 2020, 190. [Google Scholar] [CrossRef]
  19. Yousef, A.A.; Al-Saleh, S.; Al-Jawfi, M.S. Improved/enhanced oil recovery from carbonate reservoirs by tuning injection water salinity and ionic content. In Proceedings of the SPE improved oil recovery symposium, Tulsa, OK, USA, 14 April 2012. [Google Scholar] [CrossRef]
  20. Zhang, P.; Austad, T. Wettability and oil recovery from carbonates: Effects of temperature and potential determining ions. Colloid Surf. 2006, 279, 179–187. [Google Scholar] [CrossRef]
  21. Austad, T.; Shariatpanahi, S.F.; Strand, S.; Black, C.J.J.; Webb, K.J. Conditions for a low-salinity enhanced oil recovery (EOR) effect in carbonate oil reservoirs. Energy Fuels 2012, 26, 569–575. [Google Scholar] [CrossRef]
  22. Hiorth, A.; Cathles, L.M.; Madland, M.V. The impact of pore water chemistry on carbonate surface charge and oil wettability. Transp. Porous Media 2010, 85, 1–21. [Google Scholar] [CrossRef]
  23. Zaretskiy, Y. Towards Modelling Physical and Chemical Effects during Wettability Alteration in Carbonates at Pore and Continuum Scales. Ph.D. Thesis, Heriot-Watt University, Edinburgh, UK, 2012. Available online: http://hdl.handle.net/10399/2543 (accessed on 11 June 2019).
  24. Nasralla, R.A.; Sergienko, E.; Masalmeh, S.K.; van der Linde, H.A.; Brussee, N.J.; Mahani, H.; Suijkerbuijk, B.M.; Al-Qarshubi, I.S. Potential of low-salinity waterflood to improve oil recovery in carbonates: Demonstrating the effect by qualitative coreflood. SPE J. 2016, 21, 1643–1654. [Google Scholar] [CrossRef]
  25. Masalmeh, S.K.; Sorop, T.G.; Suijkerbuijk, B.M.; Vermolen, E.C.M.; Douma, S.; Van Del Linde, H.A.; Pieterse, S.G.J. Low salinity flooding: Experimental evaluation and numerical interpretation. In Proceedings of the International Petroleum Technology Conference, Doha, Qatar, 19 January 2014. [Google Scholar] [CrossRef]
  26. Berg, S.; Unsal, E.; Dijk, H. Non-uniqueness and uncertainty quantification of relative permeability measurements by inverse modelling. Comput. Geotech. 2021, 132. [Google Scholar] [CrossRef]
  27. Chang, D.; Vinegar, H.J.; Morriss, C.; Straley, C. Effective porosity, producible fluid and permeability in carbonates from NMR logging. In Proceedings of the SPWLA 35th Annual Logging Symposium, Tulsa, OK, USA, 19 June 1994. [Google Scholar]
  28. Masalmeh, S.K. Determination of waterflooding residual oil saturation for mixed to oil-wet carbonate reservoir and its impact on EOR. In Proceedings of the SPE Reservoir Characterization and Simulation Conference and Exhibition, Abu Dhabi, United Arab Emirates, 16 September 2013. [Google Scholar] [CrossRef]
  29. Sheldon, J.W.; Cardwell Jr, W.T. One-dimensional, incompressible, noncapillary, two-phase fluid flow in a porous medium. Trans. AIME 1959, 216, 290–296. [Google Scholar] [CrossRef]
  30. Aziz, K.; Settari, A. Multiphase Flow in One Dimension. In Petroleum Reservoir Simulation, 1st ed.; Applied Science Publishers: Calgary, Canada, 1979; Volume 1, pp. 125–199. [Google Scholar]
  31. Lie, K.A. Introduction. In An Introduction to Reservoir Simulation Using MATLAB/GNU Octave: User Guide for the MATLAB Reservoir Simulation Toolbox (MRST), 1st ed.; Cambridge University Press: Cambridge, UK, 2019; Volume 1, pp. 1–17. [Google Scholar] [CrossRef] [Green Version]
  32. LeVeque, R.J. Finite volume methods. In Finite Volume Methods for Hyperbolic Problems, 1st ed.; Cambridge University Press: Cambridge, UK, 2002; Volume 31, pp. 64–85. [Google Scholar]
  33. Lenormand, R.; Lorentzen, K.; Maas, J.G.; Ruth, D. Comparison of four numerical simulators for SCAL experiments. Petrophysics 2017, 58, 48–56. [Google Scholar]
  34. Brooks, R.H.; Corey, A.T. Hydraulic properties of porous media and their relation to drainage design. Trans. ASAE 1964, 7, 26–28. [Google Scholar]
  35. Sorop, T.G.; Masalmeh, S.K.; Suijkerbuijk, B.M.; van der Linde, H.A.; Mahani, H.; Brussee, N.J.; Marcelis, F.A.; Coorn, A. Relative permeability measurements to quantify the low salinity flooding effect at field scale. In Proceedings of the SPE Abu Dhabi International Petroleum Exhibition and Conference, Abu Dhabi, United Arab Emirates, 9 November 2015. [Google Scholar] [CrossRef]
Figure 1. Computed tomography (CT) scans of the core samples.
Energies 14 01979 g001
Figure 2. Oil recovery and pressure drop for USS-1.
Energies 14 01979 g002
Figure 3. Oil recovery and pressure drop for USS-2.
Energies 14 01979 g003
Figure 4. Comparison between USS-1 and USS-2.
Energies 14 01979 g004
Figure 5. Water saturation functions for verification case.
Energies 14 01979 g005
Figure 6. Average water saturation verification.
Energies 14 01979 g006
Figure 7. Differential pressure verification.
Energies 14 01979 g007
Figure 8. Water saturation profile for USS-1.
Energies 14 01979 g008
Figure 9. Water saturation profile for USS-2.
Energies 14 01979 g009
Figure 10. History matching of USS-1.
Energies 14 01979 g010
Figure 11. History matching of USS-2.
Energies 14 01979 g011
Figure 12. FW and low salinity waterflooding (LSW) extracted relative permeability.
Energies 14 01979 g012
Figure 13. FW and LSW extracted capillary pressure curves.
Energies 14 01979 g013
Table 1. Ionic composition (mg/L), viscosity and density of formation water (FW), and SW/50.
IonFWSW/50
Na+44,261335
Ca2+13,84014
Mg2+160443
K+013
Cl96,560619
SO42−88579
HCO33322
Viscosity (cP) @ 3000 psi, 120 °C0.360.25
Density (g/cm3) @ 3000 psi, 120 °C1.0190.959
Total dissolved solids (mg/L)157,4821105
Table 2. Basic properties of the core samples.
Sample IDOC-9OC-10
Length (cm)7.467.49
Diameter (cm)3.773.77
Porosity (%)14.7414.72
Air permeability (mD)10.259.49
Brine permeability (mD)7.595.45
Effective oil permeability (mD)5.912.13
Pore volume (cm3)12.2712.30
NMR cut-off (%)—T2cuttoff = 100 ms8.17.4
Swi (%)3633
Table 3. Fluid and core sample properties for verification case.
Core Sample Length (cm)7.99
Core sample diameter (cm)4.00
Permeability (mD)100
Porosity (%)25
Water viscosity (cP)1
Water density (g/cm3)1
Oil viscosity (cP)5
Oil density (g/cm3)0.8
Table 4. Simulation time and injection rates for verification case.
Time (h)Injection Rate (cm3/h)
101
1310
1670
21200
26300
Publisher’s Note: MDPI stays neutral with regard to jurisdictional claims in published maps and institutional affiliations.

