Article

Spectrum Analysis for Condition Monitoring and Fault Diagnosis of Ventilation Motor: A Case Study

1
Department of Electrical Power Engineering & Mechatronics, Tallinn University of Technology, 19086 Tallinn, Estonia
2
Department of Electrical and Computer Engineering, COMSATS University Islamabad, Islamabad 45550, Pakistan
3
Department of Electrical Engineering, University of Engineering & Technology, Lahore 54890, Pakistan
*
Author to whom correspondence should be addressed.
Energies 2021, 14(7), 2001; https://doi.org/10.3390/en14072001
Submission received: 2 March 2021 / Revised: 30 March 2021 / Accepted: 31 March 2021 / Published: 5 April 2021
(This article belongs to the Special Issue Novel Approaches to Electrical Machine Fault Diagnosis)

Abstract

:
In modern power systems, since most loads are inductive by nature, there is an ongoing power quality issue and researchers’ interest in improving the power factor is widespread, as inductive loads have a low power factor that depletes the system’s capacity and has an adverse effect on the voltage level. The measurement and acute analysis of voltage- and current-level waveforms is essential to tackle power quality issues. This article presents a detailed case study and analysis of real-time data measured from a frequency converter, which is used to operate the motor of a ventilation system. The output of the frequency converter is a highly distorted current wave. A hybrid Fourier transform (FT)- and wavelet transform-based solution has been proposed here to diagnose and identify the causes of motor failure in the ventilation system. The traditional FT did not give a detailed analysis of this type of signal, which is highly contaminated by noise. Therefore, first, the signal is preprocessed for data denoising using the wavelet transform. Second, the Fourier analysis is performed on the filtered signal for frequency analysis and segregation of fundamental frequency components, higher-order harmonics, and suppressed noise. The spectrum analysis reveals that the noise is generated due to the rapidly switching circuits in the frequency converter and this unfiltered signal at the output of the frequency converter causes motor failure.

1. Introduction

In the modern power system, a vital factor is the power quality (PQ), which describes the difference between the theoretical (specified by the designed) and measured waveforms for current and voltage. Ideally, both current and voltage waveforms should be sinusoidal. However, the presence of nonlinear loads produces harmonics and these waveforms do not remain purely sinusoidal [1]. Therefore, the precise detection and accurate analysis of the PQ indices is an important area of concern.
According to the IEC 64000-4-30 Standard [2] and IEEE 1159-2009 Standard [3], the variations in the voltage and current waveforms are used to monitor the electric PQ in single-phase or polyphase electric power systems. According to this standard, multiple faults can occur due to the presence of nonlinear loads, such as swells, sags, transients, oscillations, and harmonics. The end-users are exposed to device malfunctions and can be negatively affected by unexpected variations due to the presence of power electronic loads and devices that are highly sensitive to the aforementioned PQ variations [4]. In particular, the IEC-64000-4-7 Standard describes some commonly used time-domain and frequency measurement methods for PQ [5]. However, the time-domain analysis is simpler but lacks in performance. Therefore, in power systems, fault detection and diagnosis (FDD) are widely used for PQ analysis.
One of the most common methods used for FDD is signal processing techniques, such as Fourier transform (FT), S-transform (ST), and wavelet transform (WT) [6]. The Fourier analysis of current and voltage waveforms using fast Fourier transform (FFT), along with Kalman filter and ST, are the most commonly used methods for analysis in the frequency domain [7,8,9,10,11]. However, Fourier analysis or ST alone is not enough for the detection of low-magnitude transients because of their sensitivity over discontinuities. Moreover, the FT decomposes a signal into its frequency components, and it is very effective for detecting stationary signals. S-transform also gives the time–frequency distribution of the signal, but it is more suitable for the detection of high-frequency bursts. Meanwhile, in the power system, the current and voltage are nonstationary; therefore, using only FT is not suitable [12]. Another method used by the researchers is to use a fixed window of operation for the analysis of nonstationary signals for a certain period of time; such analysis is known as short-time FT (STFT). The STFT is useful for smooth signals; if sudden variations are present in the signal, such as voltage or current waveforms, the fixed window of operation of STFT makes it fail to detect complex uncertainties [13]. The WT allows the decomposition of the signal into the time domain and frequency domain representation, which gives precise information about the variations and transients [14]. Moreover, for high-frequency components present in the signal, the WT applies a short window, and for low-frequency components, the WT applies a long window of operation [15]. Therefore, the WT is more suitable for nonstationary signals for detailed analysis. Recently, the ST has been used for the phase correction of WT and ST can detect faults due to the presence of noise. Therefore, the ST is also a promising option in the PQ field.
In the past, many researchers have attempted to detect harmonics in the current waveforms [16]. The FT is also used to detect the time location of the harmonic distortions in an unbalanced electricity distribution network [17]. In [18], the spectrum analysis is conducted using frequency sub-bands to find imbalance and distortion components in the presence of harmonics and inter-harmonics. In [19], harmonic analysis is conducted on three-phase currents in the presence of a neutral conductor in distorted and unbalanced conditions. The harmonic components’ characterization can be suitable in the diagnostics procedure and can help in the evaluation of harmonic mitigation and balancing methods [20]. A new frequency analysis-based approach is proposed in [21], where the RMS value of the current is decomposed into balanced and unbalanced fundamental, balanced, and unbalanced harmonic components, and similarly for distortions. Currently, the WT is widely used for the analysis of most PQ parameters. Voltage stages and swells can be detected using discrete wavelet transform (DWT), which can identify the exact time location of the transients [4,8]. Similarly, in [22], an analysis of harmonic variations is conducted in power systems using the WT. The analysis of power grid harmonics using WT is proposed in [23]. In [24], the wavelet packet transform (WPT) is used for the real-time estimation of the PQ components. The WPT is also used to analyze the power factor, active and apparent power, and total harmonic distortion (THD) [25]. The authors in [26] proposed a WPT-based algorithm for the detection of the power factor, harmonic distortions, and crest factors. A generalized empirical wavelet transform (EWT)-based algorithm is proposed to detect low-frequency harmonics and the results indicate that its performance is far better than FFT [12].
The wavelet detection method (WDM) based on the early detection of short circuits in power systems has been described in [27]. The DWT is also used for the detection of arc faults in a household [28]. Multiresolution WT is used for the localization and detection of a fault in DC microgrids [29]. The multiresolution WT is also used for noise reduction in voltage puncture testing [10]. In [30], a comparison of the WT and FFT is conducted for PQ parameters in balanced and unbalanced conditions. In [31], fuzzy-WPT is used for the evaluation of PQ parameters in balanced and unbalanced conditions. The DWT [32] and EWT [33] are used to measure PQ parameters and the results are compared with the IEEE 1459-2000 Standard for balanced and unbalanced conditions.
The aforementioned studies show that both FFT and WT are widely used for the analysis of PQ indices. The usage of FFT is not beneficial for the analysis of the PQ parameters in modern power systems as it has limitations. Therefore, a combination of both FFT and WT is vital and beneficial for FDD in power systems.
This paper presents a comprehensive analysis and real-time fault detection for a ventilation system in a factory in Estonia by applying the combination of FFT and WT to the current signal coming from a frequency converter attached to the motor of the ventilation system. The current signal is heavily distorted due to the high switching frequency of the convertor, resulting in generating harmonics and noise. We believe that our detailed study could serve as a guideline for the industry to conduct detailed analysis of high-frequency spectra in detecting the reasons for failure under similar environments.
In light of the above-described real-time system, the contributions of the paper are as follows:
  • A detailed analytical method is evaluated for the testing and harmonic analysis of the faulty current signal of the motor in the ventilation system.
  • The current signal is denoised using wavelet decomposition and further divided into three categories, namely noise, transients, and harmonics. The FFT is applied for further detection in all three categories. The proposed method identifies the causes of motor failure in the ventilation system with a relative degree of accuracy.
  • The experimental results reveal the effectiveness of the employed technique by computing the number of harmonics in the current signal along with the maximum harmonics present in the signal. The analysis reveals that the reason for the harmonics is the high switching frequency of the motor cover, which causes motor failure.
  • By effective utilization of motor current signature analysis (MCSA), preventive maintenance can improve the ventilation system’s reliability. The fault detection at the developing stage can save the system from any catastrophic situation and give enough repair and maintenance time. Since the inverter-fed motor’s current contains a variety of harmonics, it is important to segregate them. This paper proposes a wavelet transform for the division of current harmonics.
The rest of the paper is structured as follows: Section 2 describes the details of the system under detailed diagnostic testing. Section 3 contains detailed theoretical information on WT and FT. Section 4 covers the real-time measurement procedure of the cur- rent signal from the frequency converter-based ventilation motor. Section 5 presents the denoising procedure and analysis of the signal along with comprehensive discussion. Section 6 is about the qualitative comparison of this study with previous existing studies. The paper is concluded in Section 7.

2. System under Fault Diagnostic Test

The faulty system is a ventilation system in a factory in Estonia. The block diagram of the ventilation system and its components is shown in Figure 1. Real-time measurement time-domain signals is conducted on the system for fault diagnosis and analysis. In Figure 1, an electromagnetic interference (EMI) filter, the Mitsubishi FS23353-18-1, is used for the three-phase input power supply of the motor to protect it from EMI. The EMI occurs due to electrical or electronic switching that creates high-frequency noise signals, producing disruptions in the operation of the motor. Frequency converter Advantech 5.5 M430-M with 5.5 kW rated power and a switching frequency of 8 kHz is used for adjustable voltage and frequency for the speed control of the AC motor. To assess the power supply quality, we select “measurement point 1” at the supply terminal of the frequency converter, as shown in Figure 1. At this measurement point, the data of three-phase supply voltages and currents of the frequency inverter are measured. Another measurement point, “measurement point 2”, is selected to analyze the three-phase output of the frequency converter along with the measurement of the neural wire current. The detailed analysis of the measured data is presented in the subsequent section.
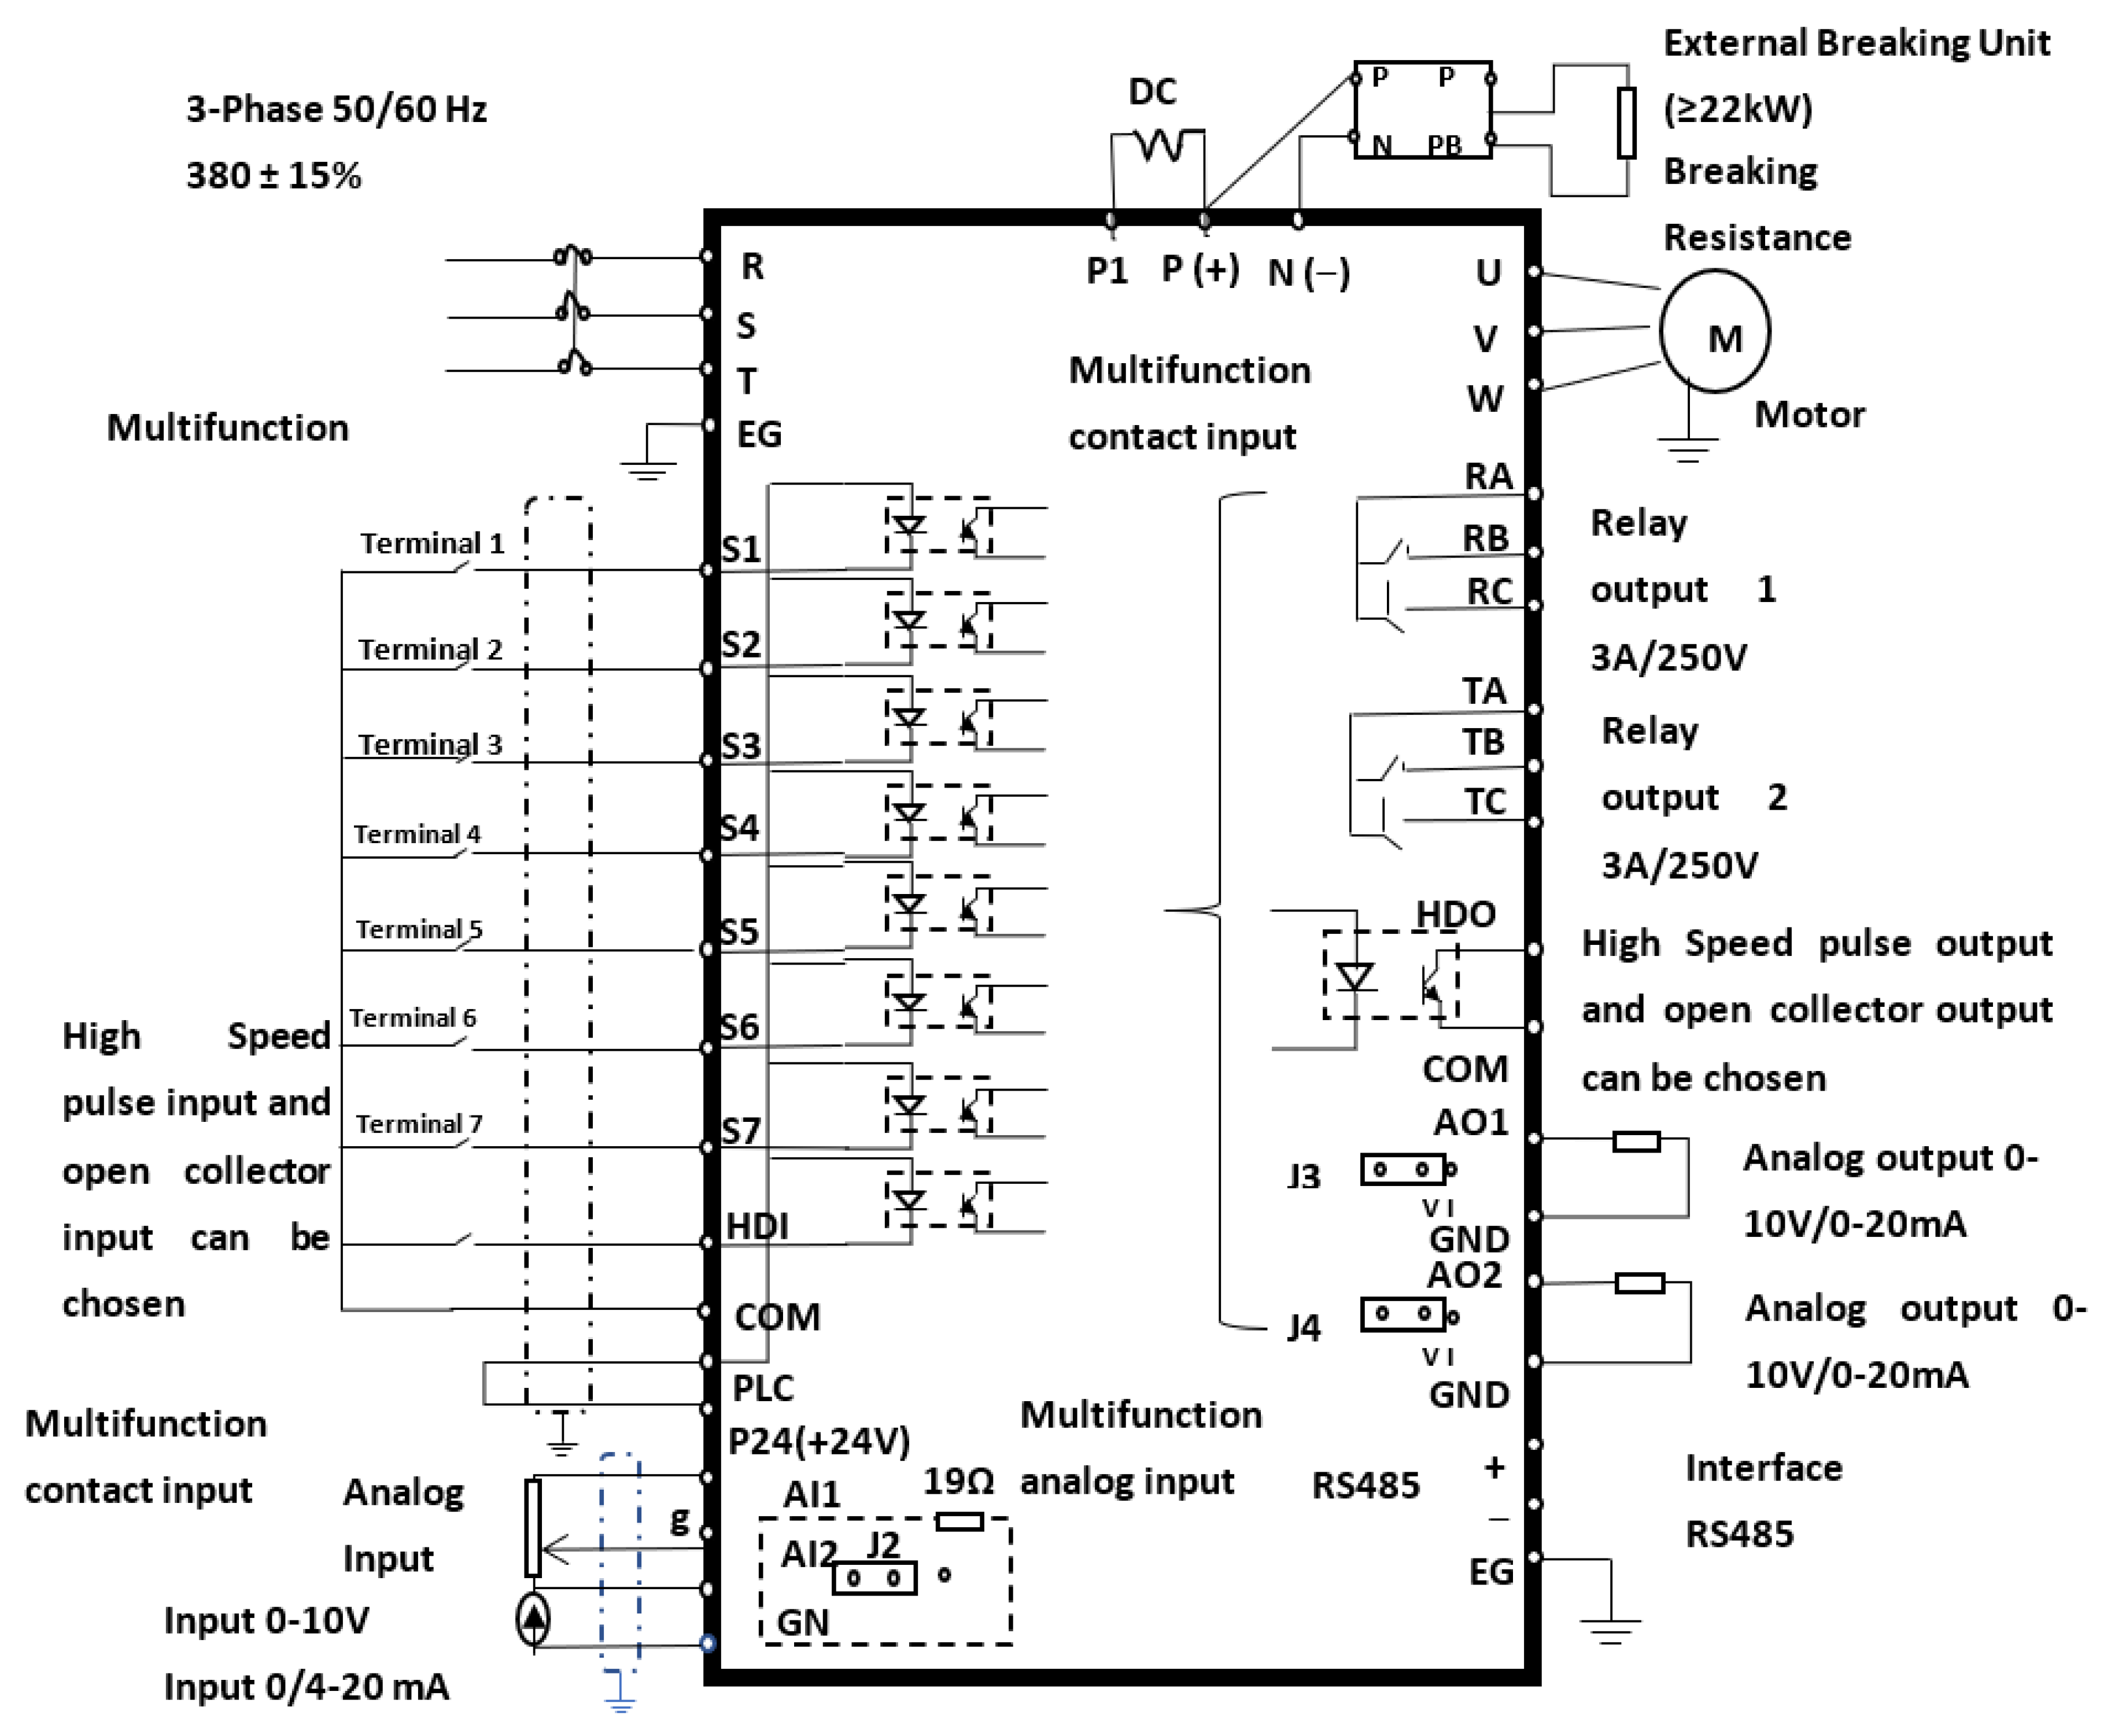
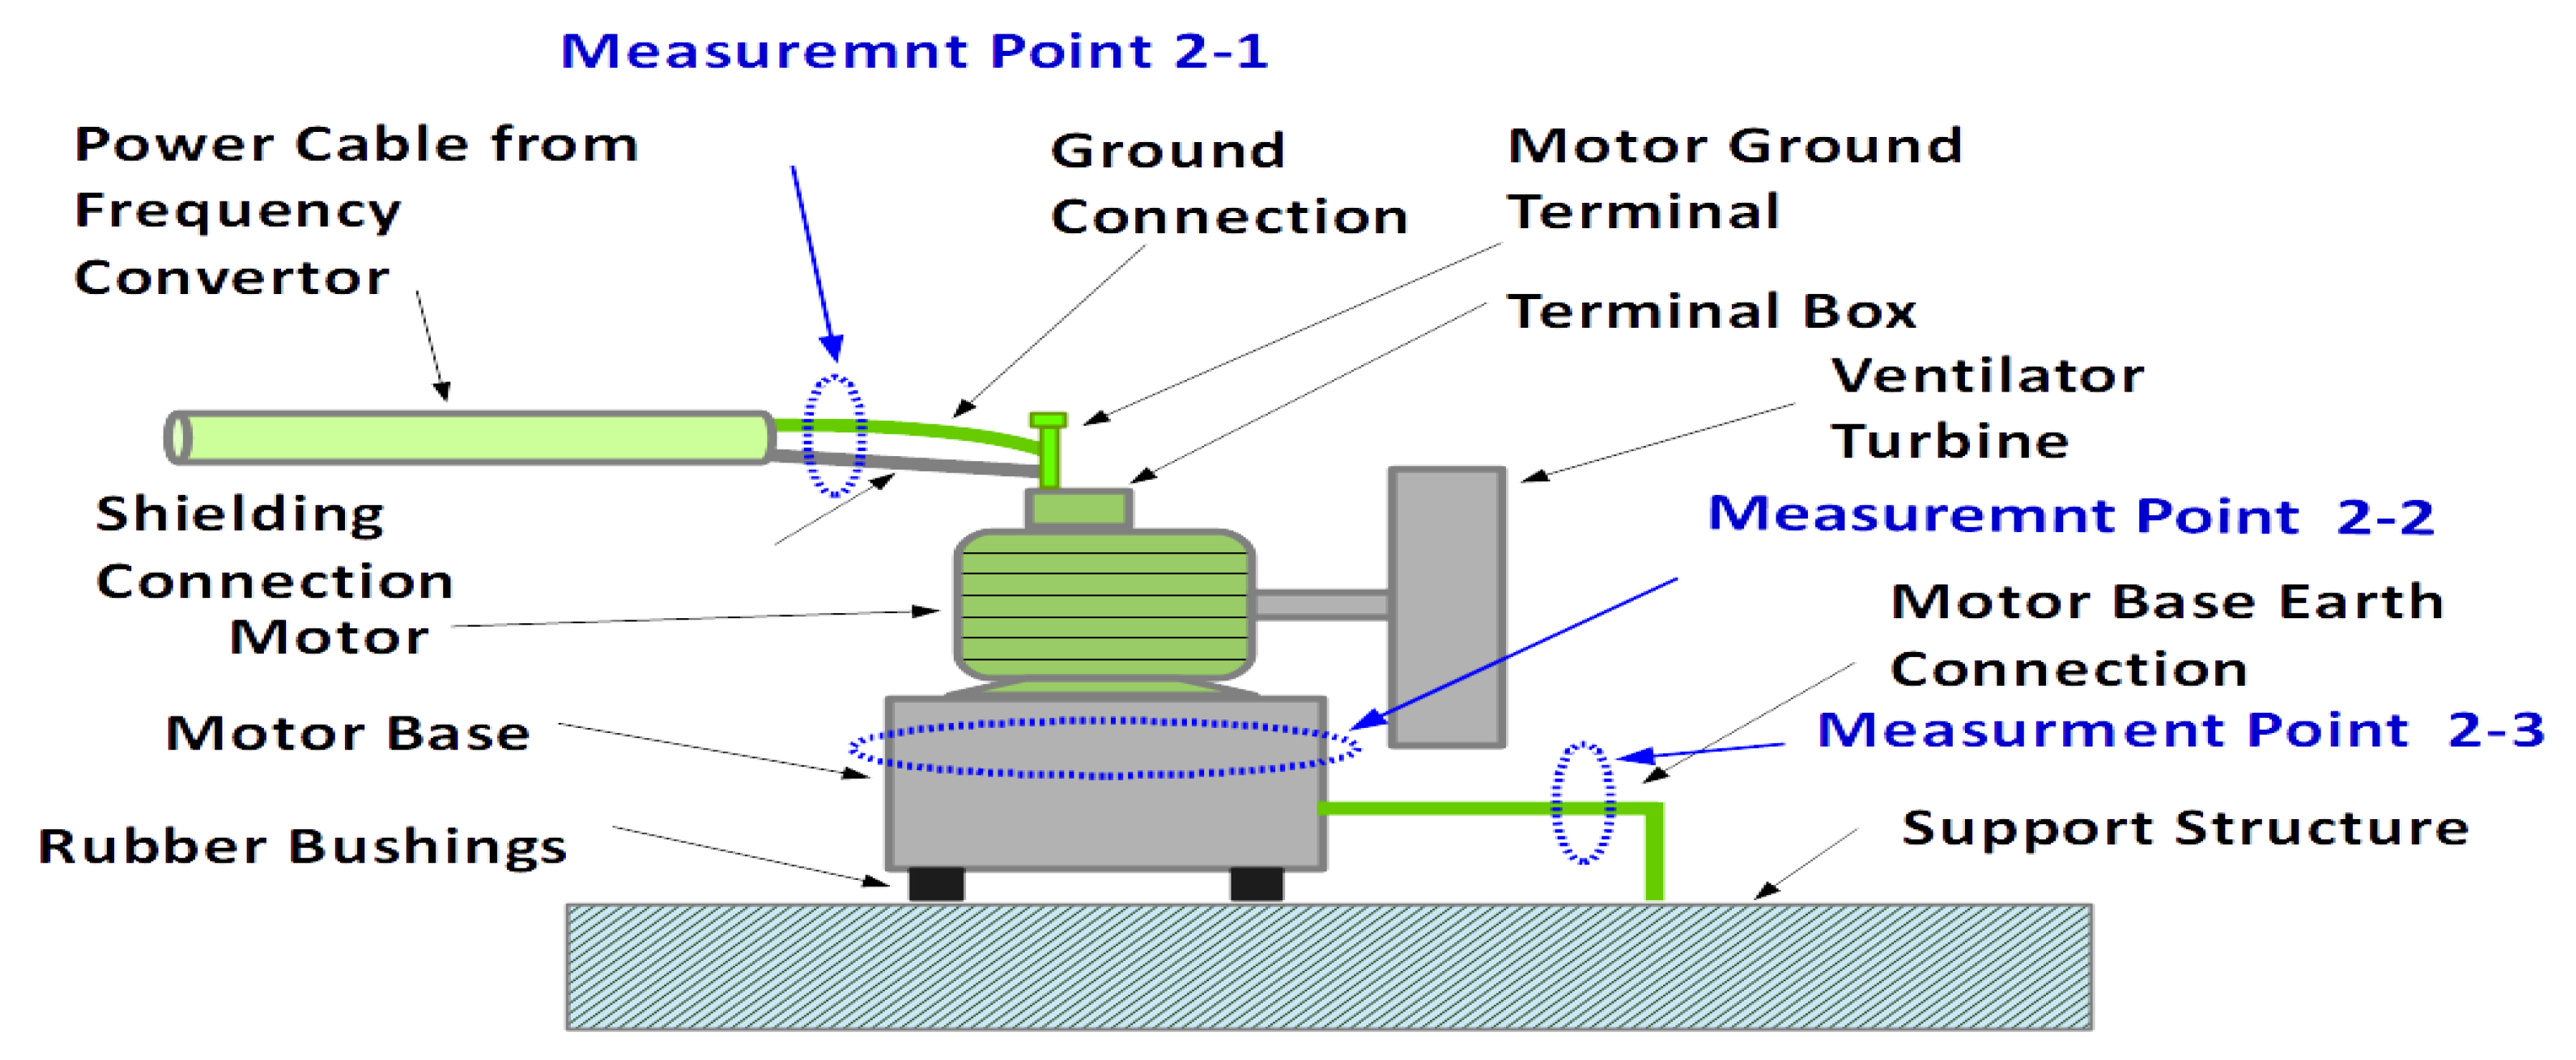
The frequency converter is the main component of the ventilation system, which is 3-phase 5.5 kW rated with a maximum frequency of 400 Hz and an output current of 13 A. The detailed technical specifications of the frequency converter are given in Table 1 and the circuit and wiring diagram of the frequency converter is depicted in Figure 2 [34]. Moreover, the ventilation motor, its components, three signal measuring points, and connections are shown in Figure 3. The 3-phase input signal is given to pins R, S, and T while the motor is connected to U, V, and W. The 8 switches generate the pulse width modulation (PWM) signal for the switching.

3. Measurement of the Signal

The signal measurement and recording procedure were conducted in the ventilation room of an Estonian factory. The electricity network monitoring of the factory was based on the voltage quality indicators presented in the standard EVS-EN 50160: 2010, “voltage characteristics of public electricity networks”. However, this standard is not directly applicable to the voltage quality of a plant’s internal power supply (this standard is intended to regulate public access networks). The conditions listed in this standard confirm that the equipment connected to the plant is provided with an adequate power supply and thus rated power conditions. The most important subcomponents that are considered in the context of the operation of the frequency converter are:
  • Voltage level, which should be at the level of every 10 min observation window (90–110%)·UNIMI, where UNIMI is in the low voltage network 230/400 V.
  • The level of voltage distortion is given by the level of both the general nonlinear distortion factor (THDu) and the individual harmonics.
The standard EVS-EN IEC 61800-3:2018 is also specified for frequency converters and used in industrial environments; for example, it sets limits for high-frequency conductive emissions for network connection [35]. The aforementioned conditions are fulfilled during the conducting of our experiment’s. The standard EVS-EN IEC 61800-3:2018 does not set limits or reference values for the connection between the motor and the frequency converter, provided that the emission standards for the radiation in the environment are met.

3.1. Measurement Procedure

For the analysis of the power supply quality of the motor, the voltage quantities were measured as phase voltages from the motor terminals in “measurement point 2”. The phase currents and the earth connection currents were also recorded. In the high-frequency analysis, phase voltage and phase current values were measured at specified locations (measuring points 2-1, 2-2, and 2-3), as shown in Figure 3. The ground connection current values are also analyzed. In addition, probing measurements are performed using various current samples to identify possible causes of ground currents. Figure 3 further shows the connections related to the ventilation fan motor in detail.

3.2. Measuring Instrument

The measurements at “point 1” were conducted using a Fluke 1760-type power analyzer with a rated voltage of up to 600 V and rated current of up to 5 A. The RMS values of the voltage and currents were recorded for two time intervals, such as 200 ms and 1 min. The voltage and current distortion levels, including various distortion components, were recorded for an average time interval of 1 min. The maximum frequency of the recordable quantities was 5 kHz. After every 10 min, the time representation of the measurement results was recorded with a sampling rate of 10,240 Hz, and the time length of the recorded section was 0.5 s.

3.2.1. Frequency Analysis up to 2.5 kHz

At “measurement point 2”, the ventilation motor power analysis up to 2.5 kHz was carried out using A-Eberle PQbox 200 with a built-in measuring range up to 1000 V and a current measuring range of 5 A. Both the RMS values of voltage and current were in the interval of 200 ms and 1 min. The maximum frequency of the recordable quantity was 20 kHz. The time representation of the measurement results was also recorded for every 10 min, with a sampling rate of 40,960 Hz, and the time length of the recorded section was 0.5 s.

3.2.2. Frequency Analysis of the Motor Power Supply above 20 kHz

The high-frequency analysis of the motor power supply above 20 kHz was carried out using a Rohde & Schwarz RTO-1044 oscilloscope. The current samples were taken using a Rohde & Schwarz ZC-10 (measuring range up to 150 A), Rohde & Schwarz ZC-20 probe (measuring range up to 30 A), and Rogowski-type sensor with a large diameter and measuring range up to 2000 A (sensitivity 0.1 mV/A).

3.3. Supply Current Measurement

The results of the power quality monitoring are presented based on the FLUKE 1760 measurements; the measuring instrument was set up at “measuring point 1”. The power supply circuits of the frequency converter were connected in such a way that the power input did not use a neutral connection.
For the analysis of the motor supply currents, key motor parameters, such as supply voltage and current, were measured for an entire week for the realistic mapping of a typical production cycle for the entire plant. The shape of the load currents in different operating modes and the harmonics contained in them concerning the motor supply frequency were analyzed separately. The working frequency range and details of the motor-generated harmonics can be studied in [36]. For the analysis of the frequency converter, load current/motor supply current measurements were performed at the motor terminals, observing the supply currents of all 3 phases simultaneously and analyzing the current shape.
The operation of the motor is dictated by the current through the windings and is relatively uniform in shape. The rapid voltage changes through stray capacitance, which are inevitable in any current conductor configuration, can result in significant capacitive currents in the motor structure and cables as well. The purpose of this measuring point was to record the current shape parameters, which would provide information about the frequency components close to the motor supply frequency. For this purpose, current patterns at different possible operating frequencies, such as 25, 33, 41, and 50 Hz, have been analyzed.
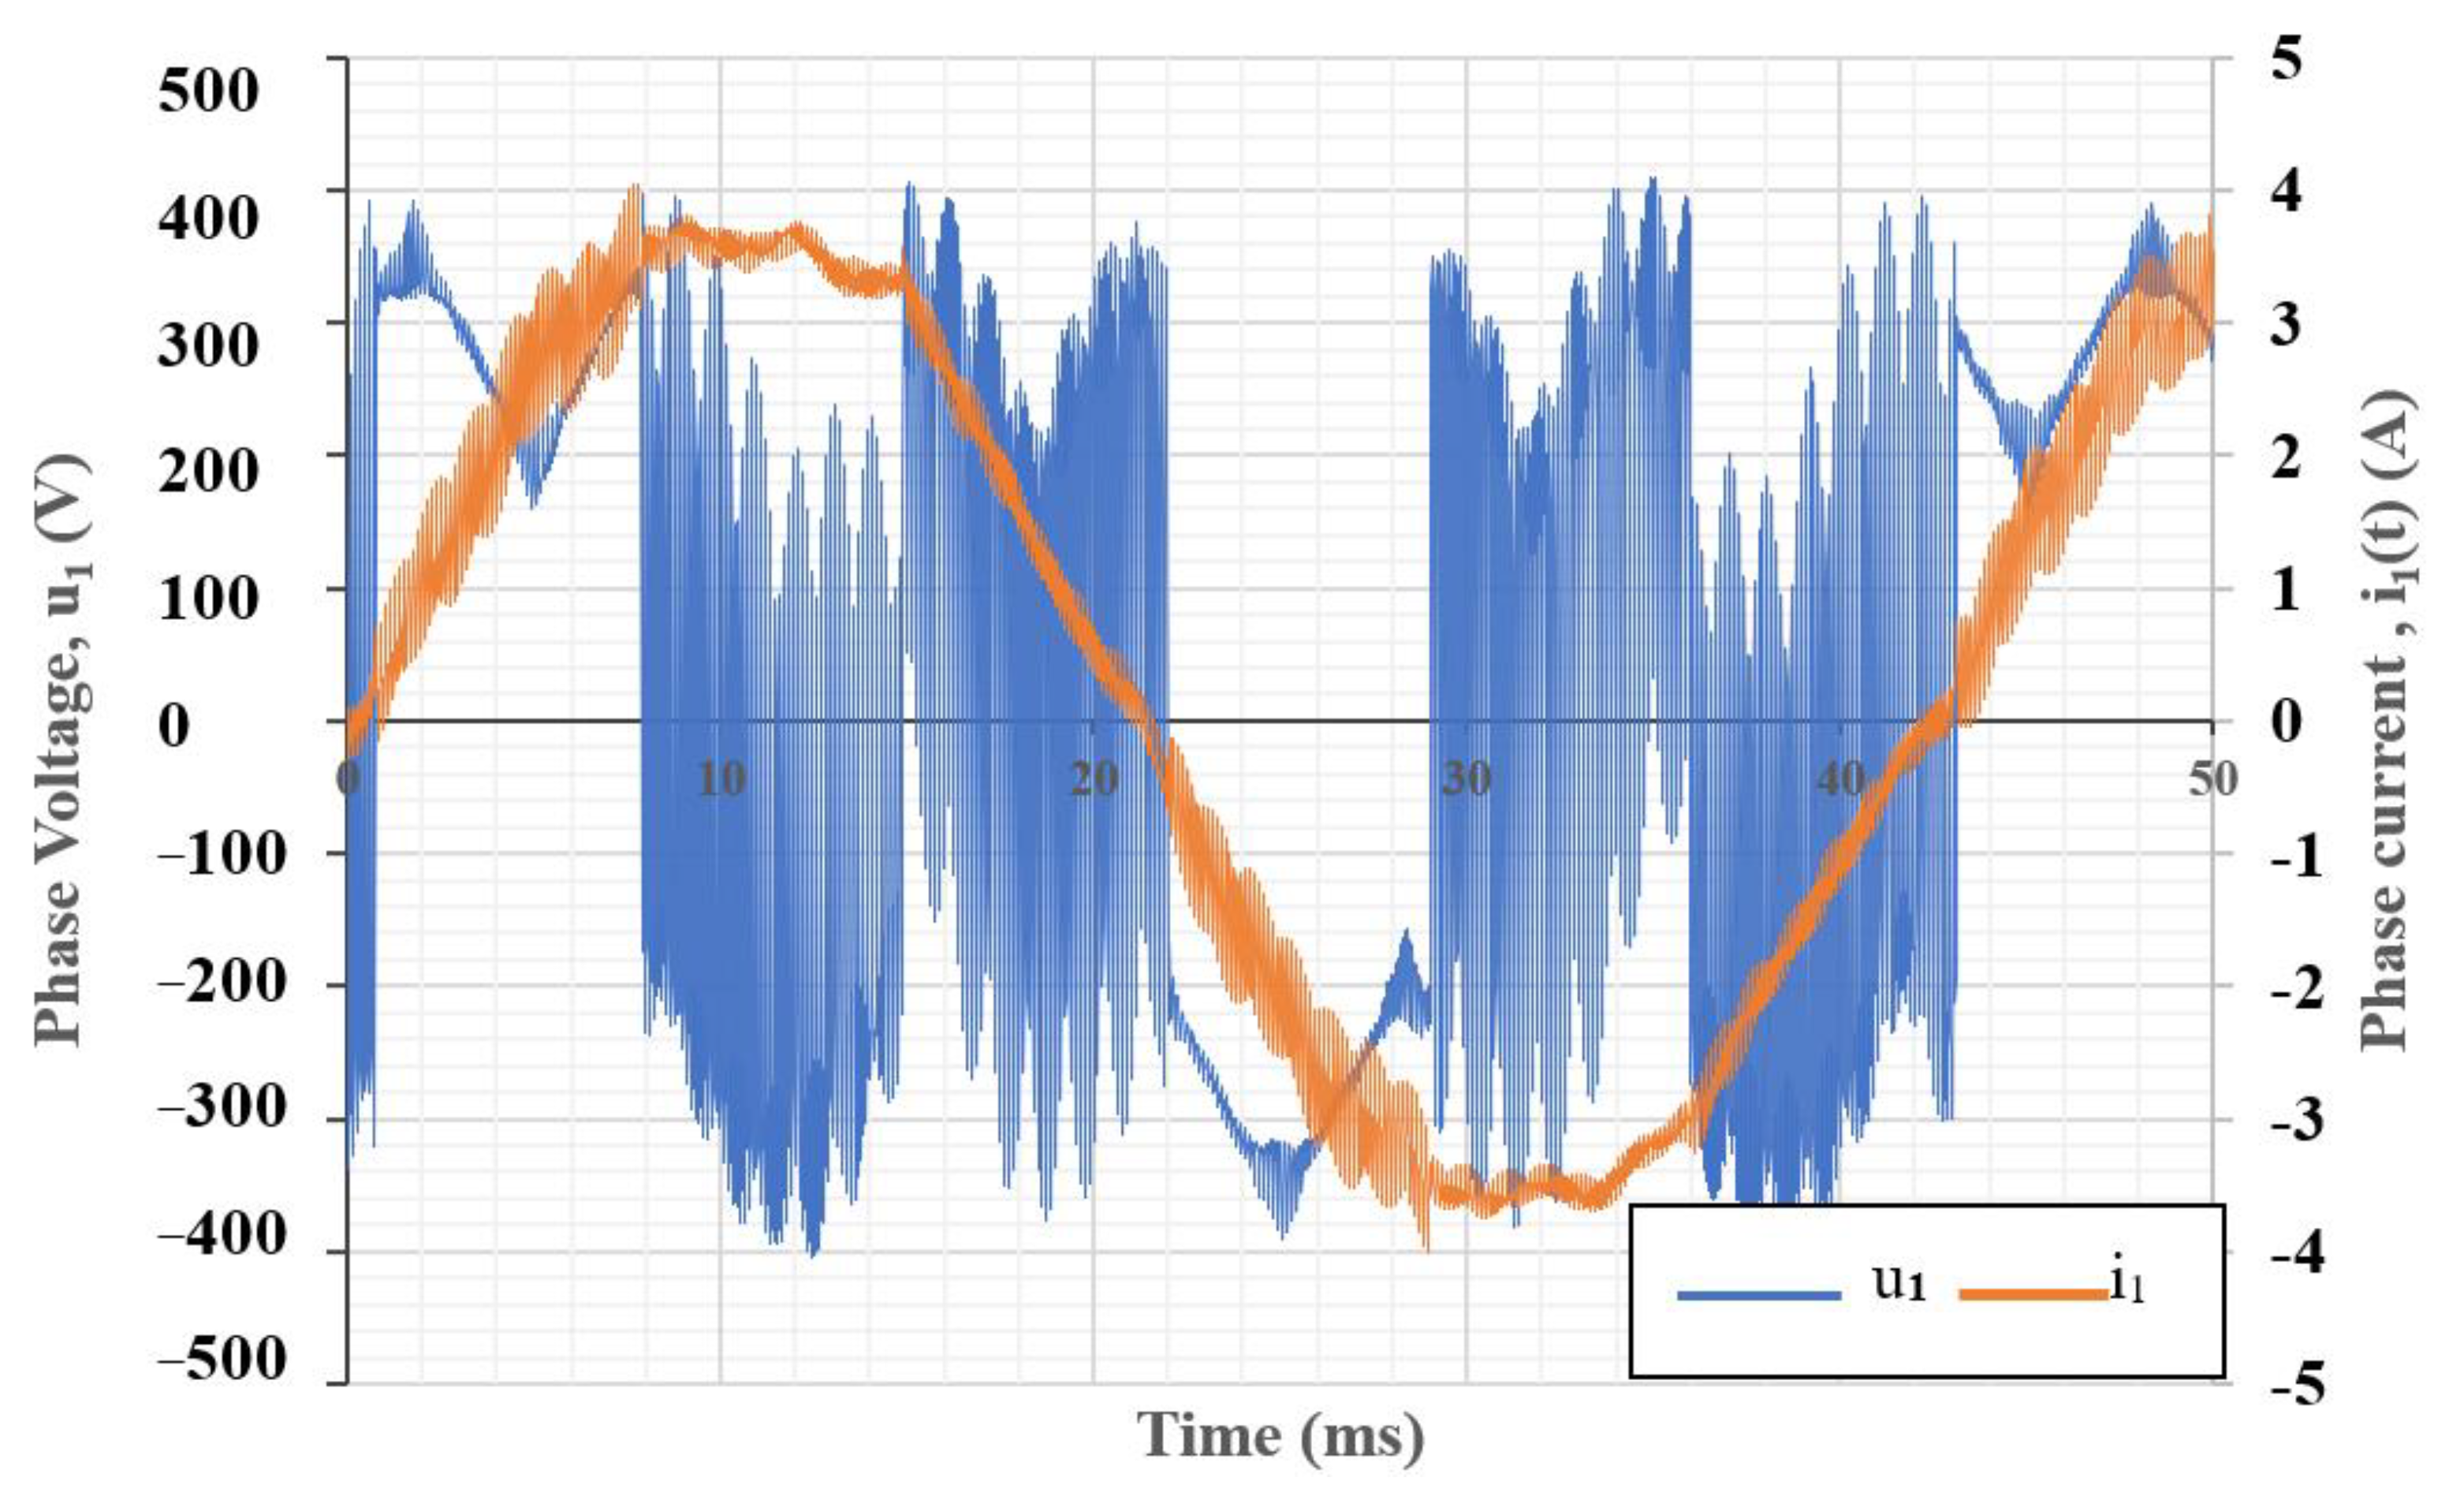
The aim was to determine how, in a 3-phase system, these currents behave relative to each other and whether their harmonics can cause a significant high-frequency counter moment (caused by harmonics 5, 11, 19, etc.). Phase voltage values and phase current values are shown in Figure 4.

4. Signal Processing Techniques

4.1. Wavelet Transform

The usage of the WT has been increasing in signal processing applications. The WT provides simultaneous information in both time and frequency for the signal, which is very helpful in the analysis of the PQ parameters of the signals [8]. The most commonly used wavelet algorithms for frequency systems are DWT, WPT, and WDM.

Discrete Wavelet Transform

The DWT is simply a one-dimensional WT and it decomposes the original signal into a shifted and scaled version [37,38]. DWT requires fewer computations compared to continuous wavelet transform (CWT). It decomposes the signal into a set of orthogonal wavelets. These wavelets are derived from the pyramidal algorithm of convolution with quadrature mirror filters [38]. The coefficients of the filter are defined in Equations (1) and (2).
A j , k = l g l 2 k A j 1 , l
D j , k = l h l 2 k A j 1 , l
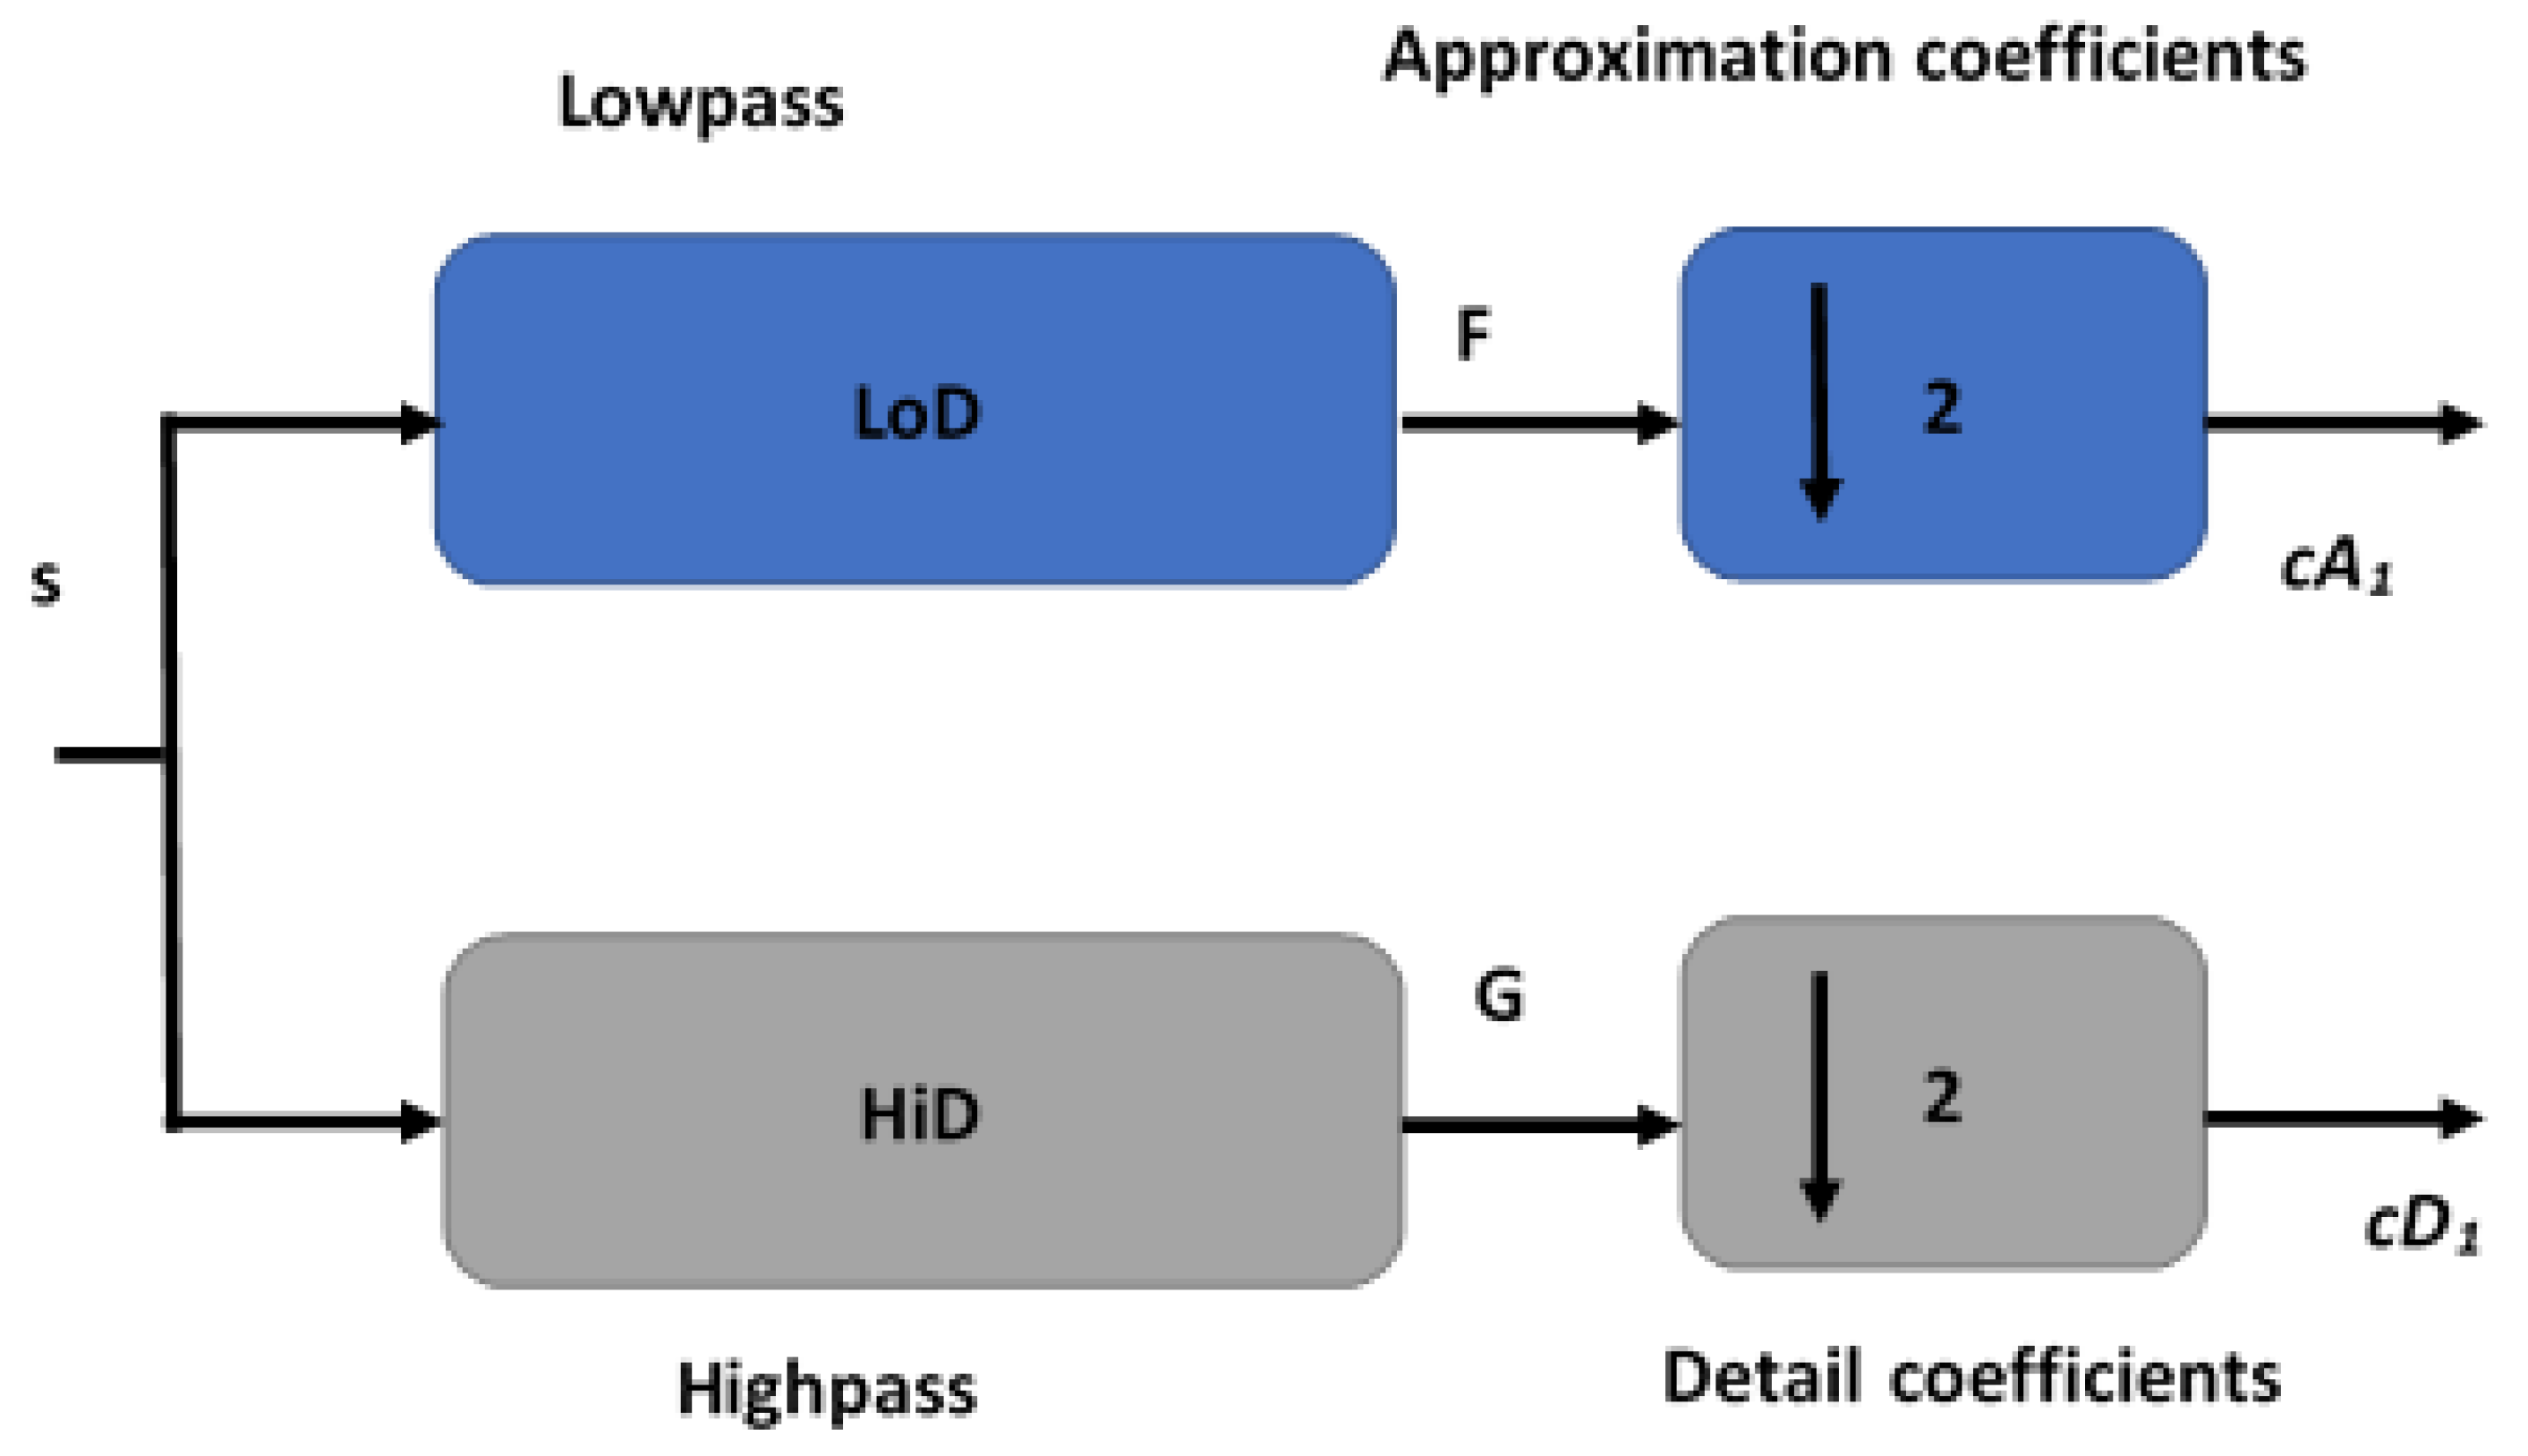
Here, j is the number of levels (from 1, 2 to k), k is the number of coefficients (from 1, 2 to Nx2j), where N is the number of samples, l is the length of the filter, g and h are the low- and high-pass coefficients of the scaled function, and WT and Aj,k, Dj,k are the scaled and wavelet coefficients for the filter bank. A reference filter bank is depicted in Figure 5 [39].
There are two filters in the filter bank. The low-pass filter removes the high frequencies and stores the low frequency Aj,k while the high-pass filter preserves only higher frequencies in the signal Dj,k. The output of both filters provides the detailed coefficients. The signal “s” is shifted and scaled in the first level to get A1 and D1. This process is then repeated recursively to achieve AA2 and DA2 and then continued for the next level until the required level of decomposition is achieved.
The wavelet denoising of the signal is usually done in three steps. The first step is an analysis in which the signal is decomposed into different levels using the WT. Then, in the second step, the detailed coefficients are compared, and different threshold levels are defined. Finally, the values exceeding a certain level are approximated and time-domain analysis is conducted. The specific wavelet used in this study for the decomposition of the signal is the “Sym4”. It is one of the most commonly used algorithms and is quite easy to implement, which is why it was selected.

4.2. Fourier Transform

Fourier transform is one of the most important tools in signal processing. It converts the signal from the time domain to the frequency domain. The most commonly used algorithm is FFT, which computes the discrete Fourier transform (DFT) of the signal [40,41]. DFT and inverse DFT were calculated using Equations (3) and (4), respectively.
X k = n = 0 N 1 x n e i 2 π k n / N
x n = 1 N n = 0 N 1 X k e i 2 π k n / N
where xn is the time-domain signal, Xk is the frequency-domain signal, N is the data size, and k = 1, 2, to N−1. Several algorithms are available for the computation of FFT. The most commonly used is the Cooley–Tukey FFT algorithm, which was published in 1965 [42]. This algorithm divides the transform into two parts and limits the power of two sizes.

5. Analysis of the Signal

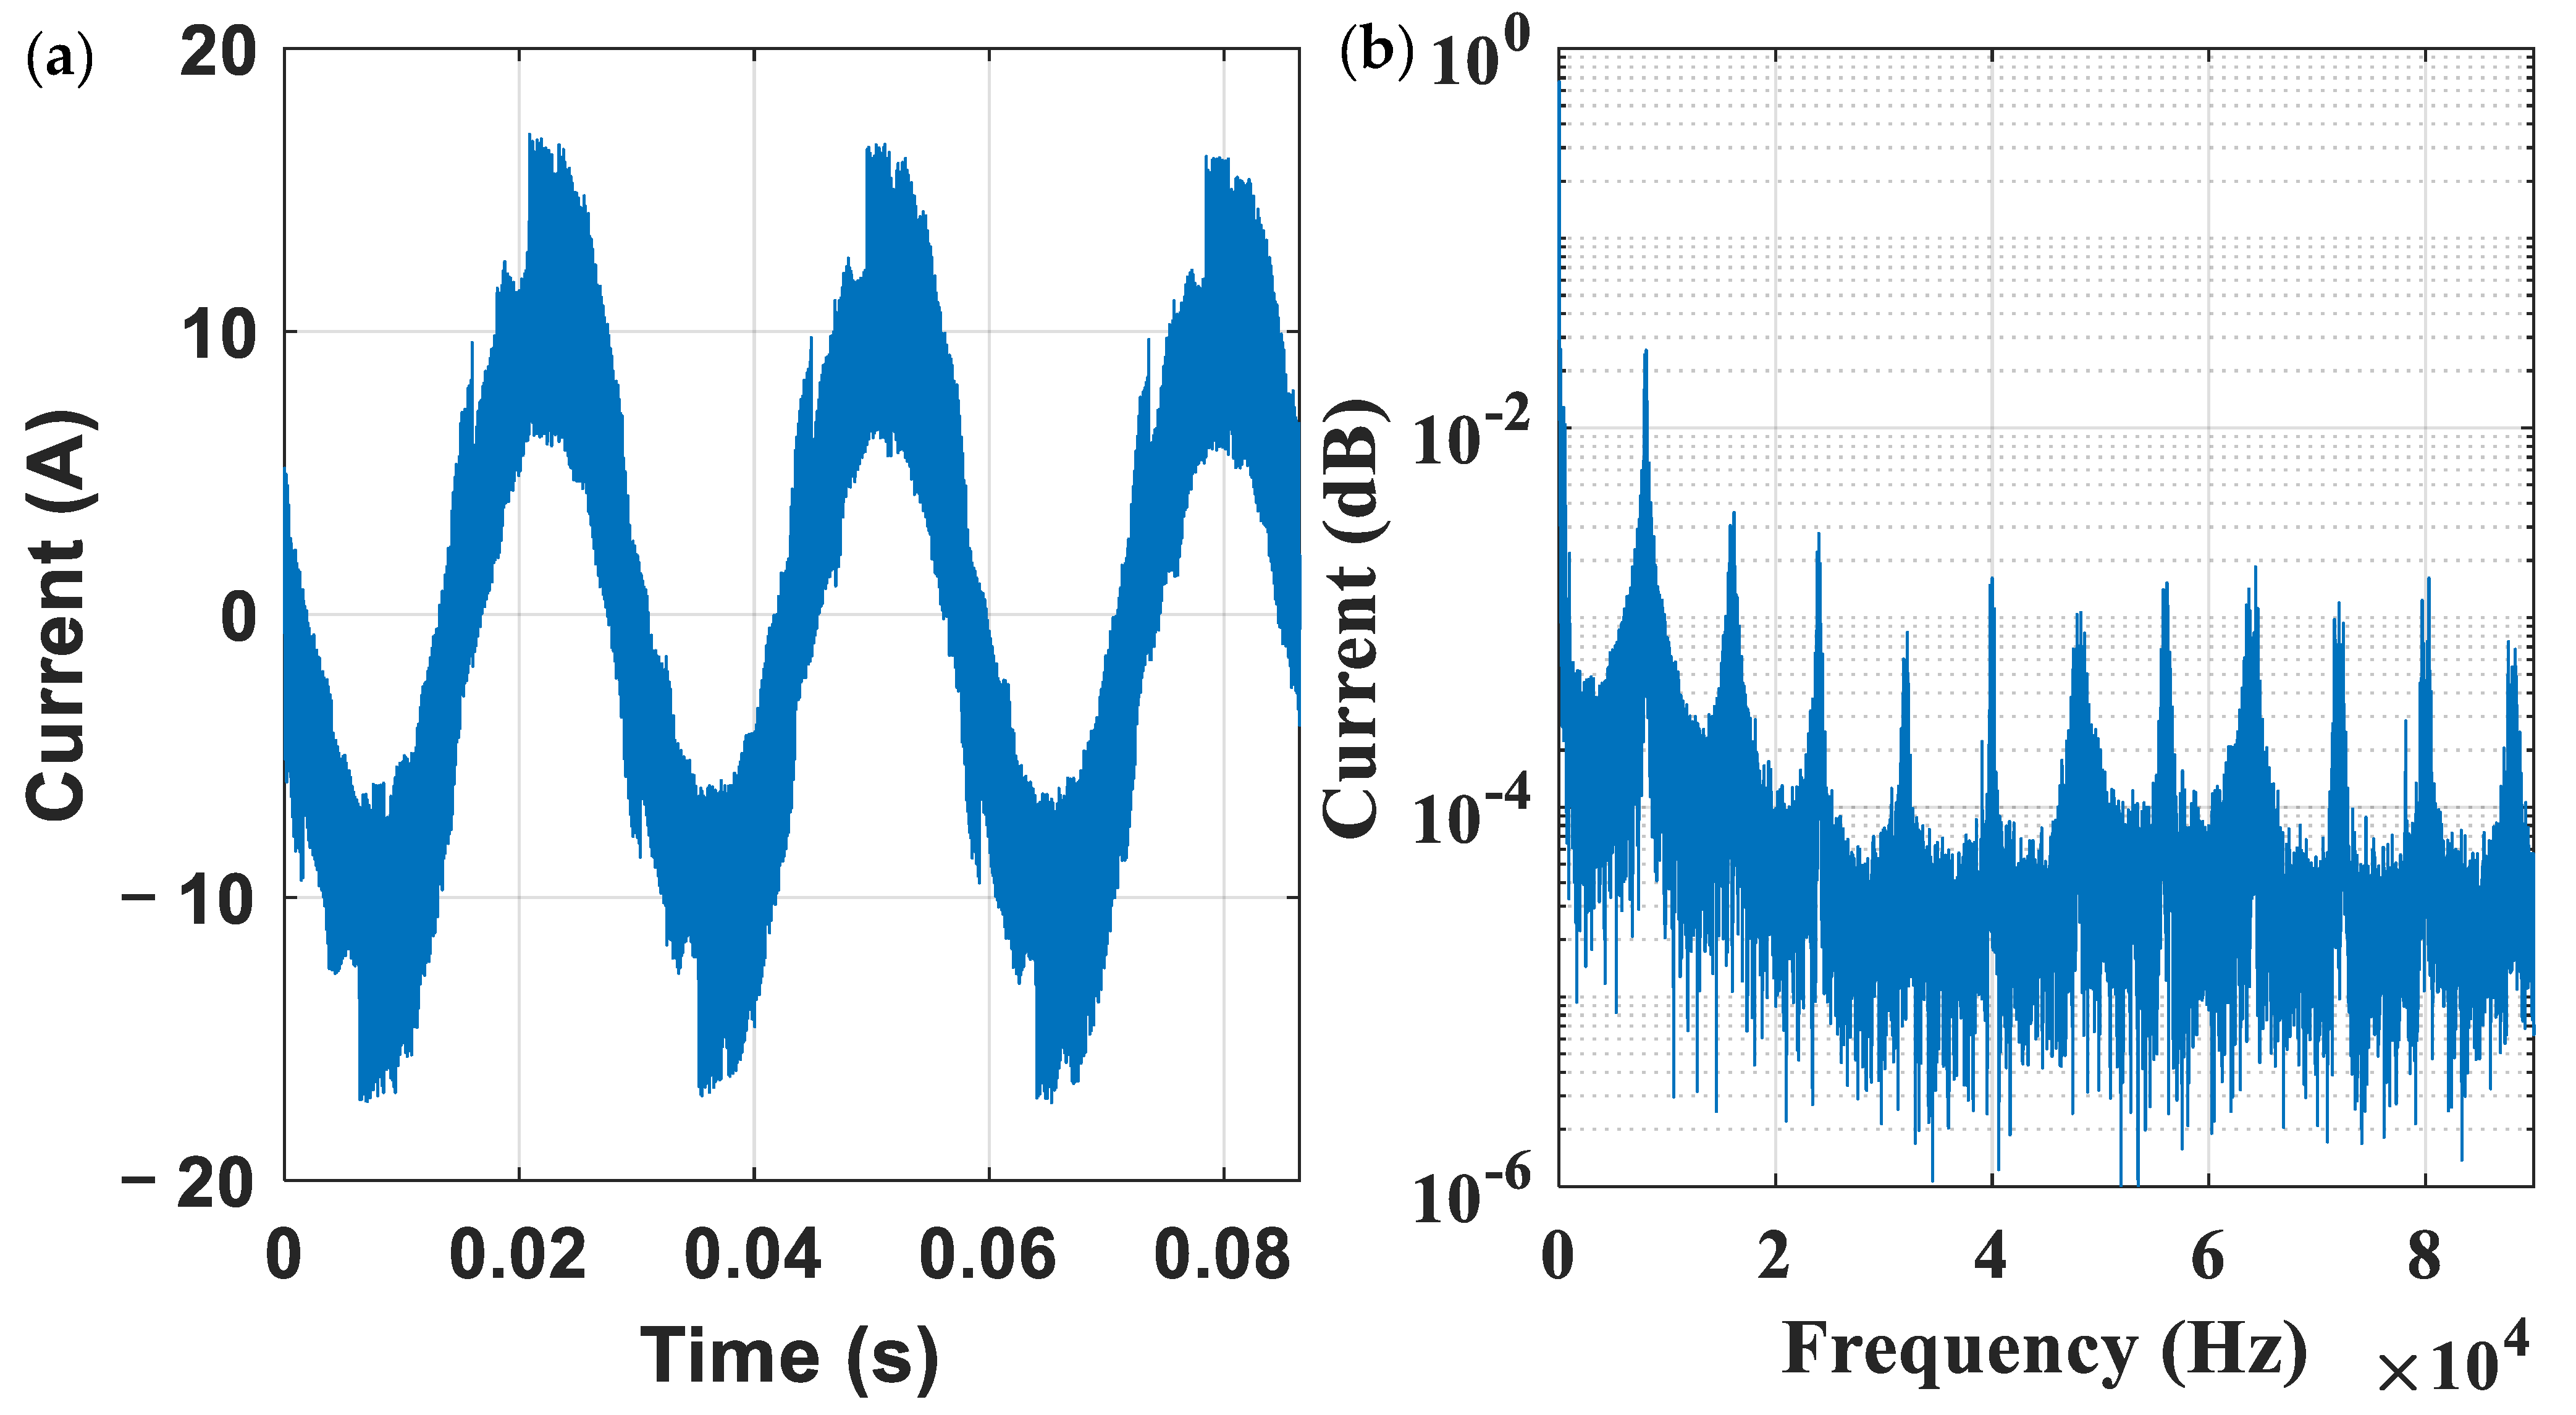
The current signal was measured with a sampling frequency of 10 MHz to investigate the causes of motor failure. The signal under consideration was measured for 1 s and a very high-resolution signal was recorded. The whole experimental process was divided into three parts: measurement, denoising, and spectrum analysis, as shown in Figure 6 The current signal is depicted in Figure 7a. It is clear from the figure that the measured signal is non-sinusoidal. The signal is heavily distorted by the noise and it shows three and a half time periods in one sec. The Fourier transform of the original signal is shown in Figure 7b. All the analysis was performed in Matlab 2020b running on an Intel Core i7-9700 CPU with 64 GB Ram. The spectrum analysis was performed in Matlab using FFT. The signal had a 10 MHz resolution and FFT was taken with 1,048,576 data points. The spectrum of the current signal did not show any substantial information as the signal had many variations. Therefore, in the first step, the signal was denoised using WT. Wavelet decomposition divides the signal into its fundamental components.
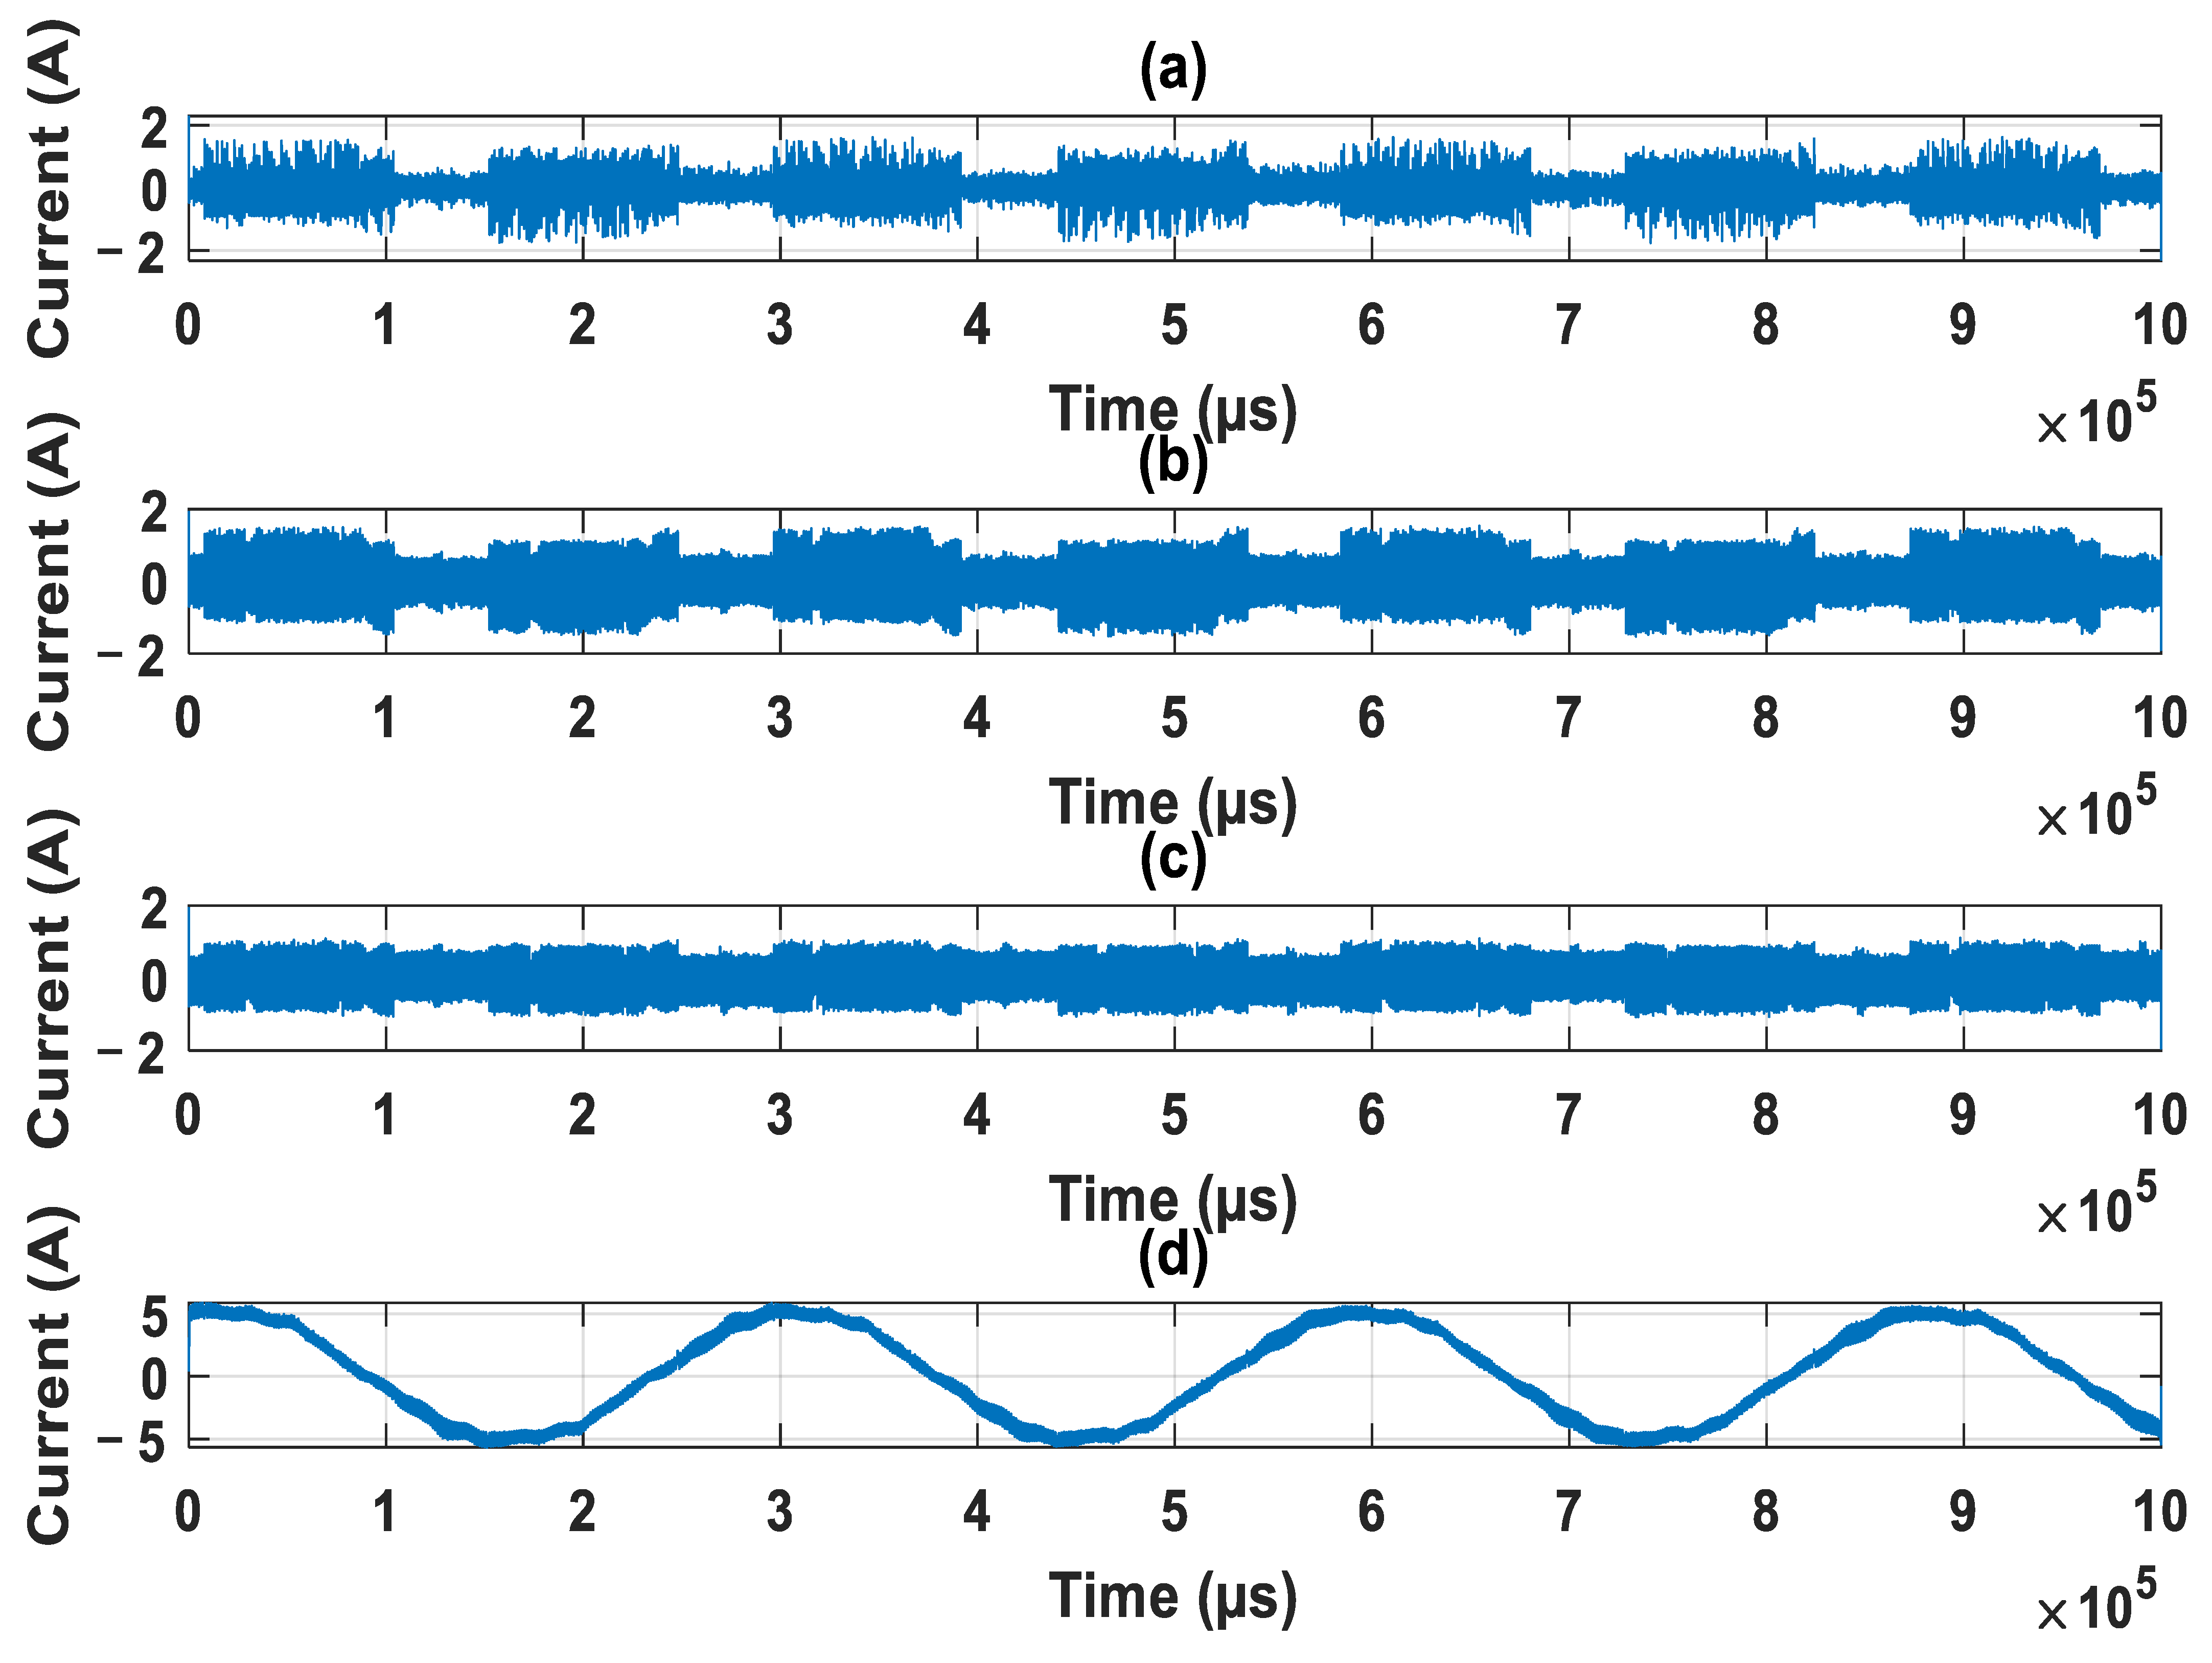
The wavelet decomposition method was used to divide the signal initially into 4 levels using “sym 4” decomposition. Sym4 belongs to the family of Symlet wavelets. The Symlet is a slight modification of Daubechies (dB) wavelets. The properties of both wavelet families are similar. However, the symlets are much simpler and they offer more symmetry. The signal decomposition in four levels is shown in Figure 8. However, it is clear from the figure that the signal contains very high-power noise at different frequency levels. It requires further decomposing for better harmonics analysis.
In power systems, the analysis of harmonics is essential for PQ. Harmonics are the presence of frequency components, which are the multiples of the fundamental frequency. Harmonics in current and voltage are usually caused by the presence of nonlinear loads. The nonlinear load in the present study is the frequency converter before the motor, as shown in Figure 1. This frequency converter has power electronics equipment with a very high switching frequency. This is the cause of the high amount of noise in the signal.
The signal was then decomposed into 19 different frequency levels for more accurate analysis using the Sym 4 WT. For the spectrum analysis, the signal was divided into only three categories, signal above 9 kHz, below 9 kHz, and finally below 62 Hz, because, in power systems, the fundamental frequency is usually 50 or 60 Hz.
Harmonics are usually categorized as frequency disturbances up to 9 kHz, but according to some standards, they can be up to 150 kHz. However, the harmonics are more significant up to 9 kHz. Between 9 kHz and 150 kHz, the disturbances are termed super harmonics as, in some rare cases, there can exist some substantial frequency components.
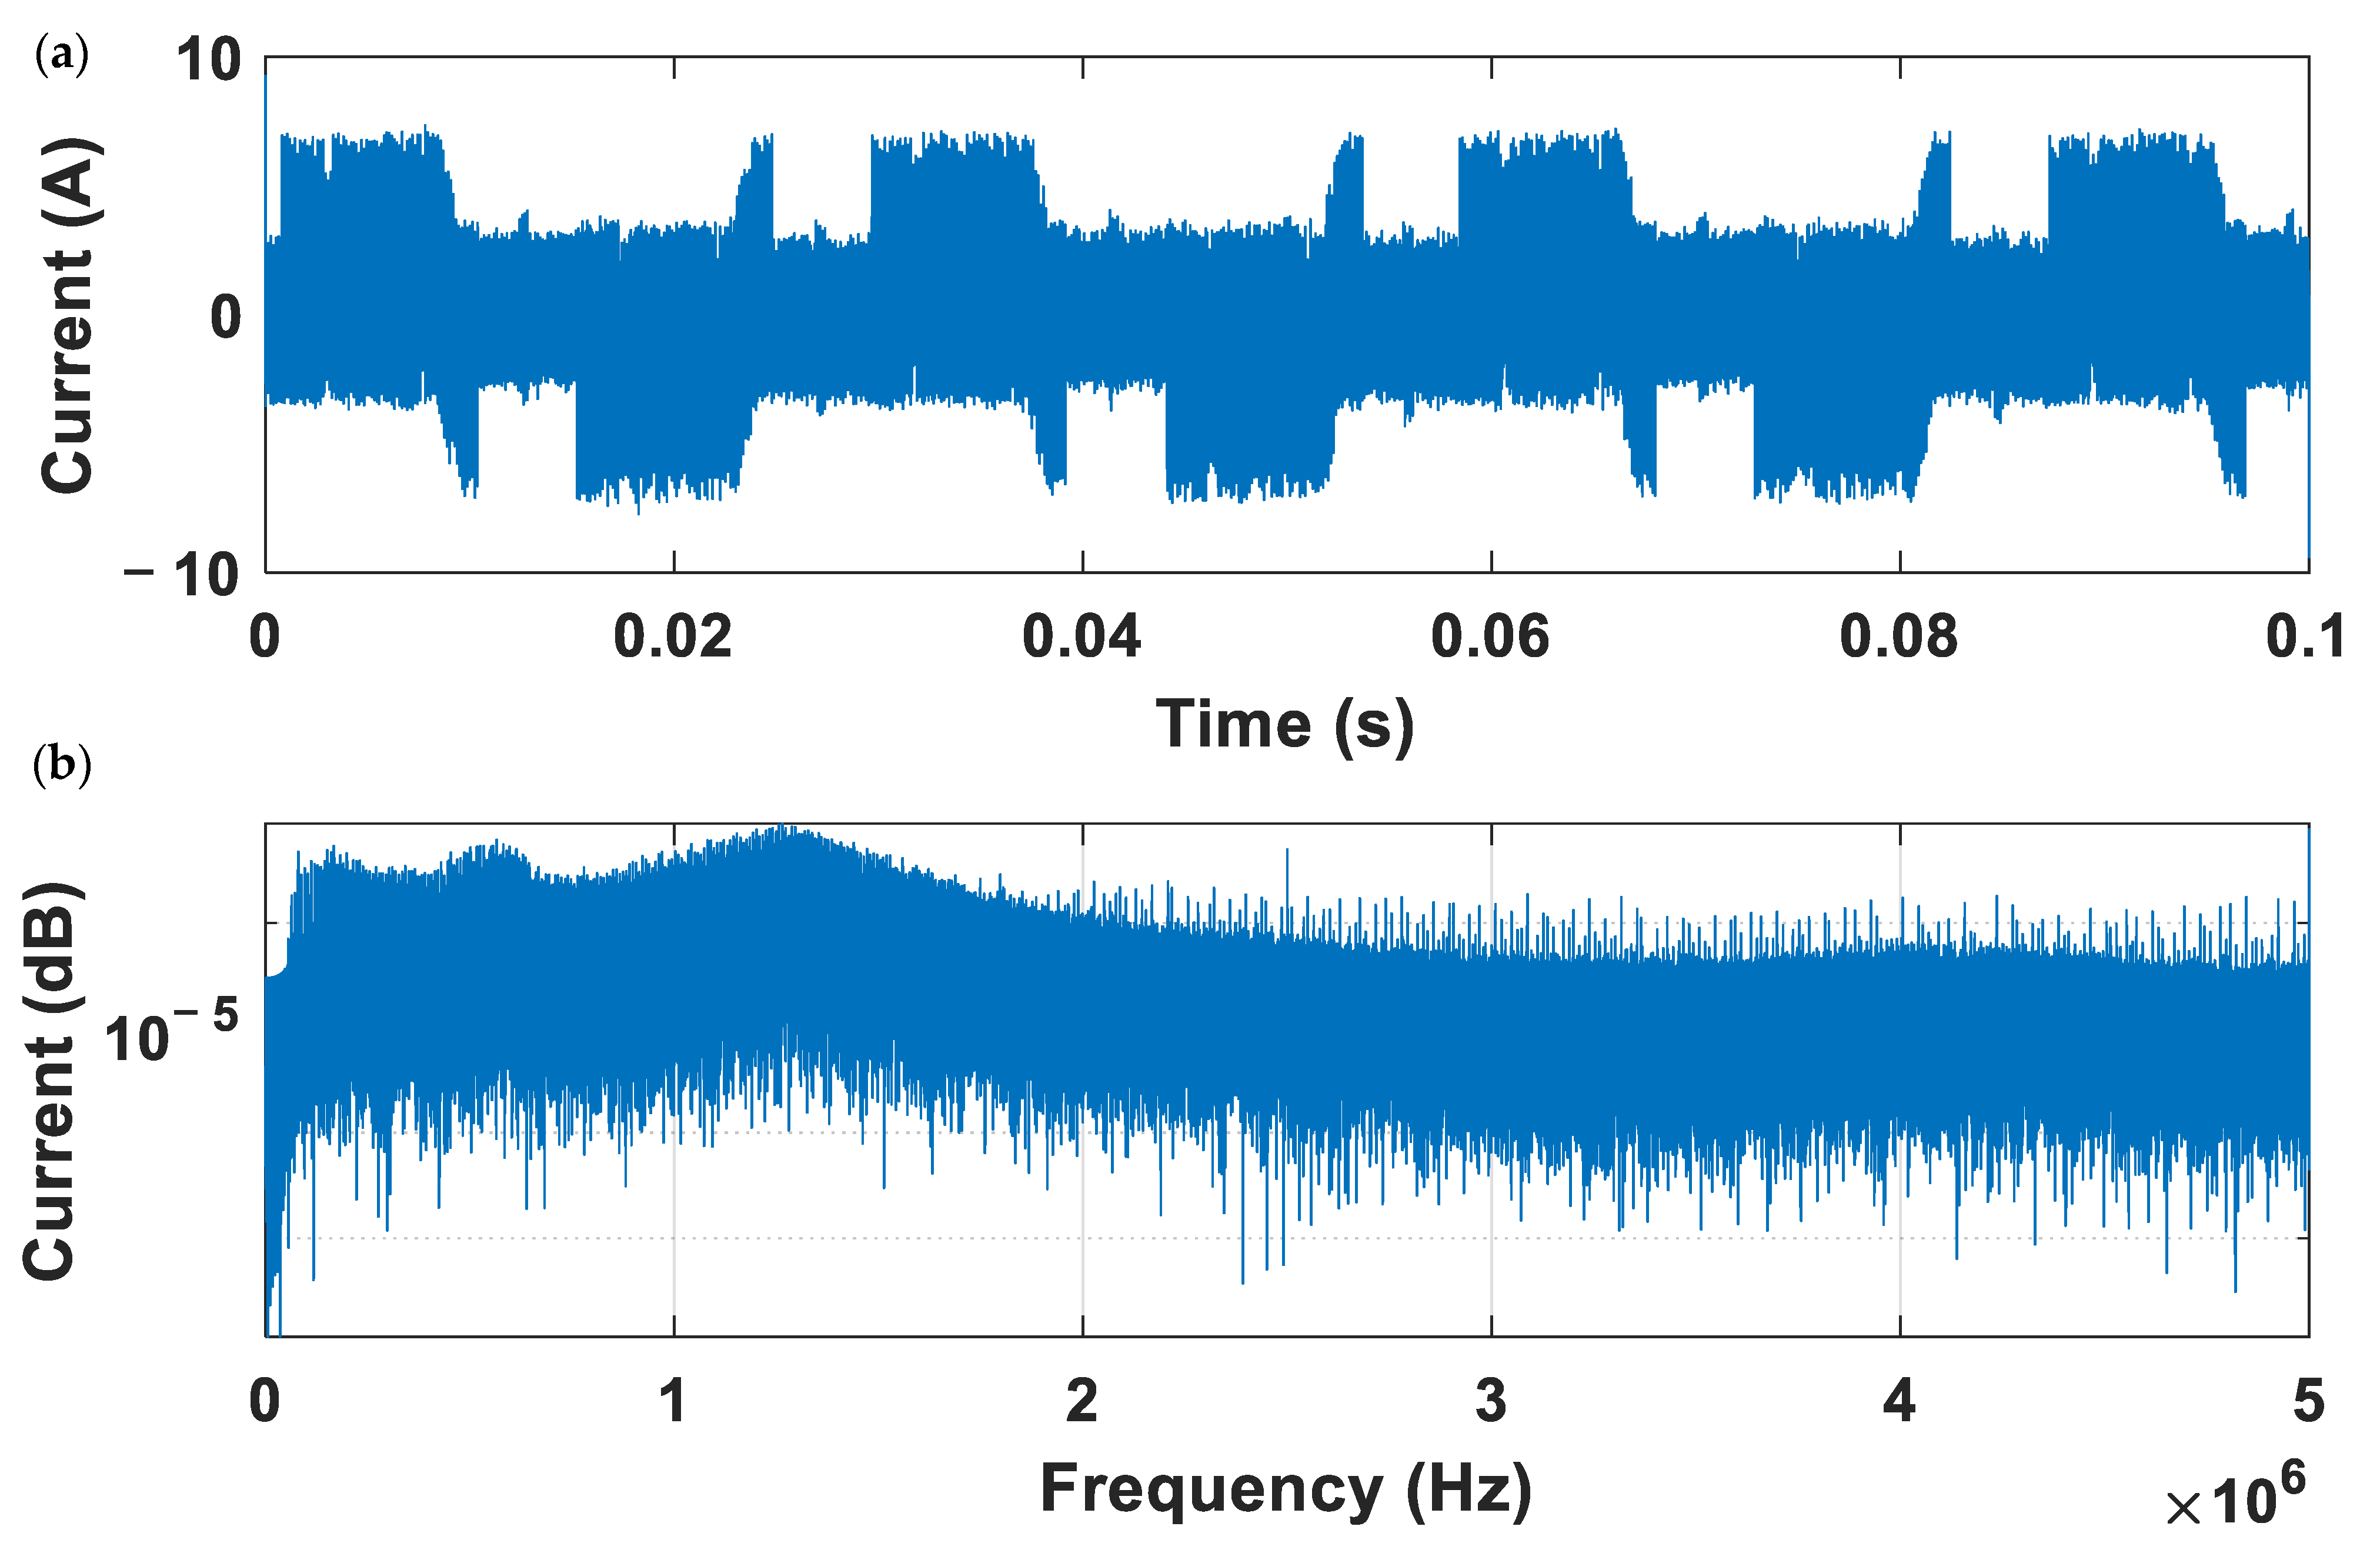
After 150 kHz, it is usually the noise that is superimposed in the signal by nonlinear loads. The decomposed current signal above 9 kHz is shown in Figure 9a and its FFT in Figure 9b. It is clear from the figures that this is a noise signal which consists of very high-frequency signals and is spread throughout the spectrum. The time-domain signal shows a switching pattern, which is the switching noise generated by the high-frequency switches present in the inverter. Therefore, this entire noise signal can be excluded from the analysis of harmonics.
The decomposed signal below 9 kHz is shown in Figure 10a. The time-domain signal is almost sinusoidal. However, the effect of harmonics is visible around the peaks. These harmonics are quite significant, and they are also caused by the switching circuitry of the inverter. Figure 10b is the spectrum analysis of the signal below 9 kHz. Here, the signal shows significant harmonics even around 8 kHz, and similarly, it has at 16 kHz due to the 8 kHz switching of the frequency converter. In addition, most of the values of the harmonic are still present before 600 Hz.
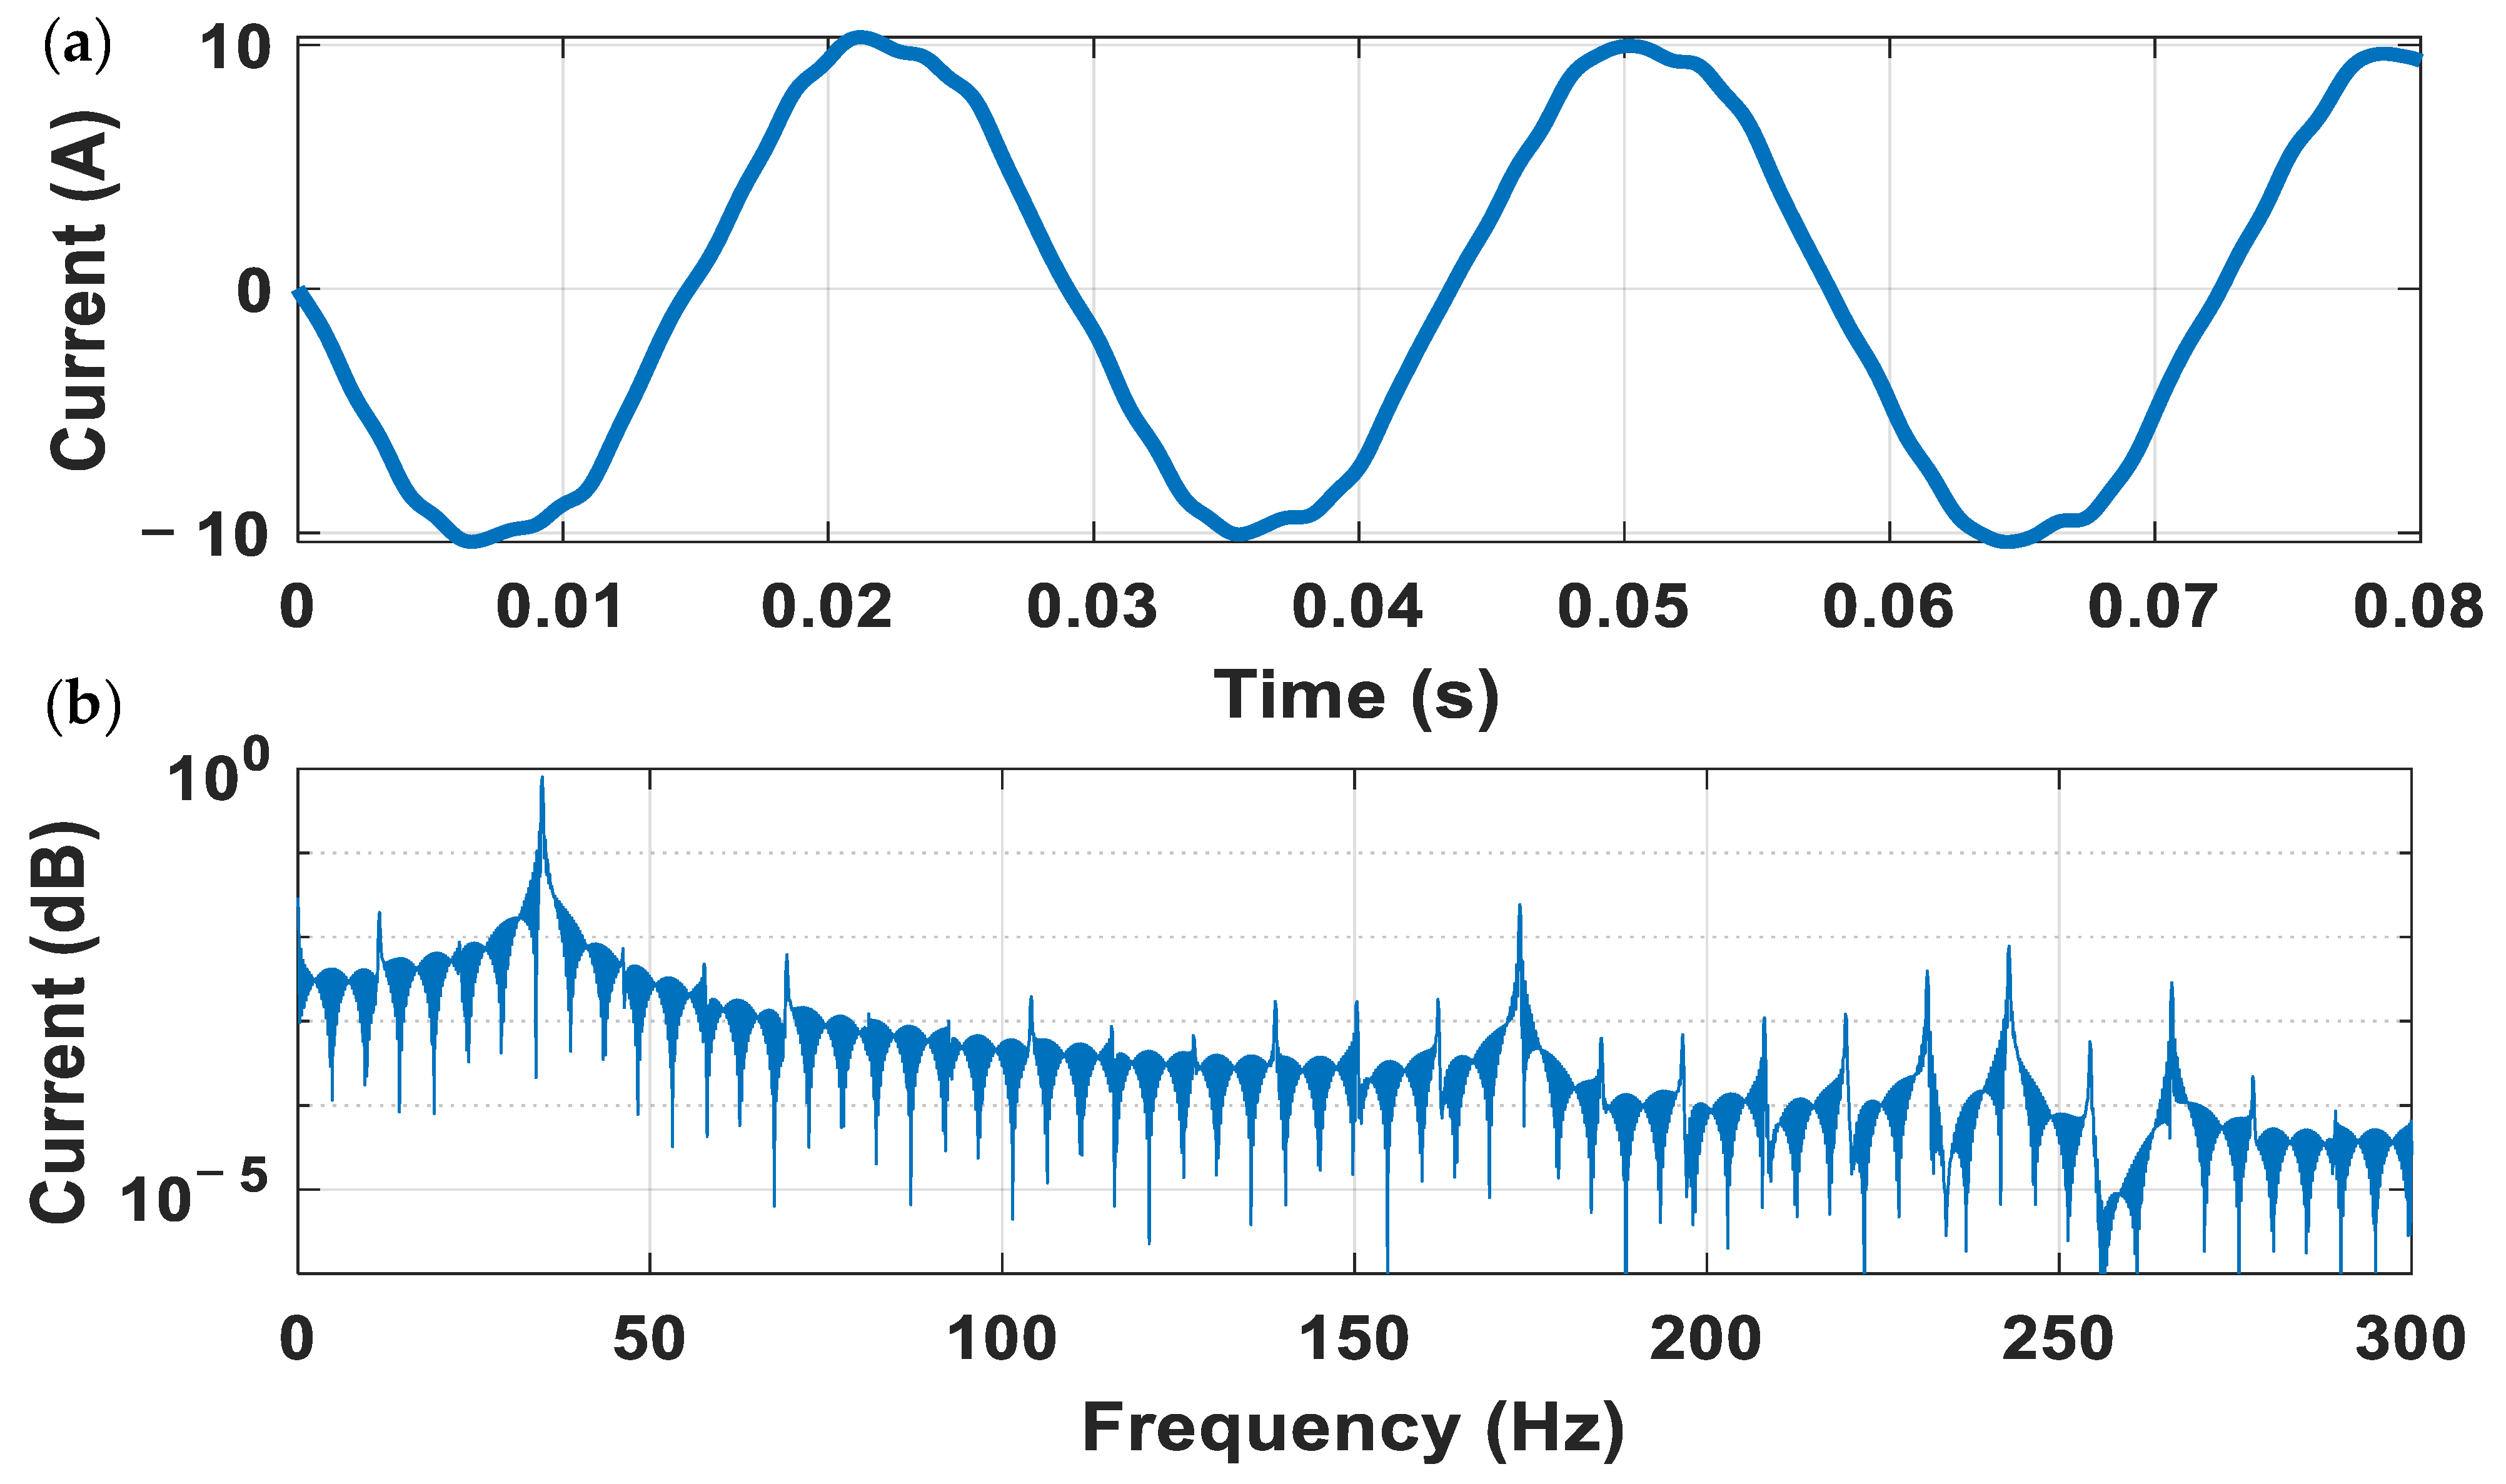
Figure 11a depicts the time-domain signal below 62 Hz, which is a quite a smooth signal, only containing minor distortion. The distortions near the peak values still indicate the existence of harmonics. However, here, only the harmonics that exist below 630 Hz are considered in order to make the spectrum analysis more understandable.
The spectrum analysis in Figure 11b shows that the main frequency component is 34.7 Hz. It can also be verified from the time-domain signals, as Figure 11a indicates that the signals have around three and a half cycles in 0.1 s. The major third harmonic in this signal is not present, while the significant fifth and seventh are presented at 173.5 Hz and 242.9 Hz, respectively. This conversion in frequency and the harmonics associated with it are again caused by the frequency converter and its switching circuits. Here, the signal is only depicted up to 300 Hz, as the harmonics present in this signal after the ninth are not very significant in value.

6. Comparison of This Study with Existing Studies

As this article is related to a specific industrial problem and the real-time data were measured at a specific factory in Estonia, a qualitative comparison of this method with other studies is made here. Fourier and WTs are popular for the analysis of PQ signals for industrial applications and several research articles are already available for different applications. The WT has been used for the detection of transients [43], harmonic distortions [12], voltage sag [4,44], faults in the electrical grid [27,29], and denoising of PQ signals [10]. These PQ anomalies and the most responsible harmonics cause noise, vibrations, harmonic fluxes, heating, and failure of motors.
Harmonic fault diagnosis and identification using a modified WT known as the harmonic WT is used in [14]. The denoising of the signal and detection of motor bearing faults using the WT has been proposed in [45]. The WT has also been used to detect induction motor faults such as stator open and short-circuiting and speed sensor faults [46]. In [47], a combination of Fourier and wavelet transforms is used to detect the broken bar faults in a three-phase induction motor.
The WT is used to denoise the signal of a VFD and the wavelet decomposition level gives information about faults [48]. In a similar study [49], the effect of harmonic distortion, which results in broken bars in inverter-fed motors, is discussed. A time–frequency analysis similar to the WT has been carried out to identify and locate faults. This new technique is termed the dragon transform. The early detection of stator faults using WT and neural networks has been carried out in [50]. The results indicate an error rate of 10−9.
The future industry 4.0 standard includes the representation of all physical entities in simulation software [51]. This method can help in the identification, diagnostics, and irradiation of these types of faults in electrical machines [52].

7. Conclusions

PQ indices are extremely important in the evaluation of any power system. The presence of distorted sine wave, blown fuses, overheating, and failure of electrical equipment such as transforms and motors indicates harmonics. These harmonics are caused by the nonlinear loads and power electronic circuits. The analysis of these harmonics is carried out in the frequency domain mostly using FFT.
In this article, a current signal was measured in the ventilation system of a factory in Estonia. The motor of this ventilation system failed frequently. This motor was attached to the output of a frequency converter. Therefore, the output current signal of the frequency converter was measured for PQ analysis. The observed signal was severely distorted by noise and harmonics. The simple FFT-based spectrum analysis of the signal did not give much information about the harmonics as it contained a large amount of noise.
Therefore, a wavelet-based denoising technique was used to first eliminate the noise from the signal, and then its spectrum analysis was carried out using FFT. The signal was decomposed into 19 levels using a sym4 WT. Then, the signal was analyzed in three phases: signal above 9 kHz, signal below 9 kHz, and signal below 630 Hz.
The analysis results of this current signal show that the frequency converter causes the problem as its output is not filtered. This is responsible for the introduction of large noise in the signals and harmonics as well. Its switching frequency is 8 kHz, and this frequency is directly visible in the harmonic current patterns, where each switching is accompanied by a specific high-frequency transition, resulting in a high level of harmonic components and noise.
The existence of such transients suggests the theoretical possibility that one of the causes of motor failure may be the presence of a strong, in-phase, high-frequency current in the motor windings. The motor torque and speed ripples depend upon the non-sinusoidal distribution of the stator and rotor windings, slot openings, nonlinear behavior of the magnetic material, and poor PQ of the input supply. The motors are designed efficiently to attenuate the harmonics, which are related to their structure and can work reliably if the power supply is of better quality. In this case study, the analysis of the input current reveals that a huge number of high-frequency components may increase the speed and torque ripples beyond the threshold level. In this case, the system’s protection turns off the system to avoid any catastrophic situation. Hence, to improve the reliability of the system, the supply harmonics should be removed either by improving the quality of the frequency converter or by using an intermediate filter between the supply and the motor.

Author Contributions

Conceptualization, N.S. and L.K.; Data curation, M.J.; Formal analysis, M.J. and M.N.I.; Funding acquisition, L.K.; Methodology, N.S. and B.A.; Resources, K.D.; Software, N.S., B.A. and M.J.; Supervision, L.K.; Validation, K.D.; Visualization, B.A.; Writing—original draft, N.S.; Writing—review and editing, M.N.I. and K.D. All authors have read and agreed to the published version of the manuscript.

Funding

This work was supported by the Estonian Research Council grants PSG142, PUT1680 and the Estonian Centre of Excellence in Zero Energy and Resource Efficient Smart Buildings and Districts ZEBE, grant 2014-2020.4.01.15-0016, funded by the European Regional Development Fund.

Institutional Review Board Statement

Not Applicable.

Informed Consent Statement

Not Applicable.

Data Availability Statement

Not Applicable.

Conflicts of Interest

The authors declare no conflict of interest.

References

  1. Karafotis, P.A.; Evangelopoulos, V.A.; Georgilakis, P.S. Evaluation of harmonic contribution to unbalance in power systems under non-stationary conditions using wavelet packet transform. Electr. Power Syst. Res. 2020, 178, 106026. [Google Scholar] [CrossRef]
  2. International Electrotechnical Commission. IEC 61000-4-30. Electromagnetic Compatibility (EMC)—Part 4-30: Testing and Measurement Techniques—Power Quality Measurement Methods; International Electrotechnical Commission: Geneva, Switzerland, 2000; p. 134. [Google Scholar]
  3. IEEE Power and Energy Society. IEEE Recommended Practice and Requirements for Harmonic Control in Electric Power Systems IEEE Power and Energy Society. IEEE Std 519-2014; IEEE: New York, NY, USA, 2014; Volume 2014. [Google Scholar] [CrossRef]
  4. Latran, M.B.; Teke, A. A novel wavelet transform based voltage sag/swell detection algorithm. Int. J. Electr. Power Energy Syst. 2015, 71, 131–139. [Google Scholar] [CrossRef]
  5. International Electrotechnical Commission. IEC 61000-4-7. Electromagnetic Compatibility (EMC)—Part 4-7: Testing and Measurement Techniques—General Guide on Harmonics and Interharmonics Measurements and Instrumentation, for Power Supply Systems and Equipment Connected; International Electrotechnical Commission: Geneva, Switzerland, 2002. [Google Scholar]
  6. Kudelina, K.; Asad, B.; Vaimann, T.; Belahcen, A.; Rassõlkin, A.; Kallaste, A.; Lukichev, D.V. Bearing fault analysis of bldc motor for electric scooter application. Designs 2020, 4, 42. [Google Scholar] [CrossRef]
  7. Zhao, H.; Lu, B.; Yu, L.; Zhao, S.; Zeng, L.; Zhang, Z.; You, P. A fourier series-based anomaly extraction approach to access network traffic in power telecommunications. In Proceedings of the 2017 12th International Conference on Computer Science and Education (ICCSE), Houston, TX, USA, 22–25 August 2017; pp. 550–553. [Google Scholar] [CrossRef]
  8. Barros, J.; Diego, R.I.; De Apráiz, M. Applications of wavelets in electric power quality: Voltage events. Electr. Power Syst. Res. 2012, 88, 130–136. [Google Scholar] [CrossRef]
  9. Najafi, E.; Yatim, A.H.M.; Mirzaei, A. An improved sag detection approach based on modified Goertzel algorithm. Int. J. Electron. 2019, 106, 36–47. [Google Scholar] [CrossRef]
  10. Dos Santos, I.S.; Hall Barbosa, C.R.; da Silva, M.T.F.; de Oliveira Filho, O.B. Multi-resolution wavelet analysis for noise reduction in impulse puncture voltage measurements. Measurement 2020, 153, 107416. [Google Scholar] [CrossRef]
  11. Asad, B.; Vaimann, T.; Rassõlkin, A.; Kallaste, A.; Belahcen, A. Review of Electrical Machine Diagnostic Methods Applicability in the Perspective of Industry 4.0. Electr. Control Commun. Eng. 2019, 14, 108–116. [Google Scholar] [CrossRef] [Green Version]
  12. Thirumala, K.; Shantanu; Jain, T.; Umarikar, A.C. Visualizing time-varying power quality indices using generalized empirical wavelet transform. Electr. Power Syst. Res. 2017, 143, 99–109. [Google Scholar] [CrossRef]
  13. Jalayer, M.; Orsenigo, C.; Vercellis, C. Fault detection and diagnosis for rotating machinery: A model based on convolutional LSTM, Fast Fourier and continuous wavelet transforms. Comput. Ind. 2021, 125, 103378. [Google Scholar] [CrossRef]
  14. Kordestani, M.; Safavi, A.A.; Saif, M. Harmonic Fault Diagnosis in Power Quality System Using Harmonic Wavelet. IFAC-PapersOnLine 2017, 50, 13569–13574. [Google Scholar] [CrossRef]
  15. Xinmin, T.; Chao, R.; Yongkang, W.; Qing, L.; Wenjie, G.; Rui, L.; Qing, H.; Junrong, Z. Bearings fault detection using wavelet transform and generalized Gaussian density modeling. Measurement 2020, 155. [Google Scholar] [CrossRef]
  16. Vaimann, T.; Sobra, J.; Belahcen, A.; Rassõlkin, A.; Rolak, M.; Kallaste, A. Induction machine fault detection using smartphone recorded audible noise. IET Sci. Meas. Technol. 2018, 12, 554–560. [Google Scholar] [CrossRef] [Green Version]
  17. Pérez Vallés, A.; Salmerón Revuelta, P. A new distributed measurement index for the identification of harmonic distortion and/or unbalance sources based on the IEEE Std. 1459 framework. Electr. Power Syst. Res. 2019, 172, 96–104. [Google Scholar] [CrossRef]
  18. Chicco, G.; Postolache, P.; Toader, C. Analysis of three-phase systems with neutral under distorted and unbalanced conditions in the symmetrical component-based framework. IEEE Trans. Power Deliv. 2007, 22, 674–683. [Google Scholar] [CrossRef]
  19. Chicco, G.; Pons, E.; Russo, A.; Spertino, F.; Porumb, R.; Postolache, P.; Toader, C. Assessment of unbalance and distortion components in three-phase systems with harmonics and interharmonics. Electr. Power Syst. Res. 2017, 147, 201–212. [Google Scholar] [CrossRef]
  20. Boudebbouz, O.; Boukadoum, A.; Leulmi, S. Effective apparent power definition based on sequence components for non-sinusoidal electric power quantities. Electr. Power Syst. Res. 2014, 117, 210–218. [Google Scholar] [CrossRef]
  21. Zheng, T.; Makram, E.B.; Girgis, A.A. Evaluating power system unbalance in the presence of harmonic distortion. IEEE Trans. Power Deliv. 2003, 18, 393–397. [Google Scholar] [CrossRef]
  22. Gudaru, U.; Waje, V.B. Analysis of Harmonics in Power System Using Wavelet Transform. In Proceedings of the 2012 IEEE Students’ Conference on Electrical, Electronics and Computer Science Analysis, Bhopal, India, 1–2 March 2012. [Google Scholar]
  23. Yuan, X.L.; Peng, G.; Zhang, F.D.; Yang, C.L.; Yin, Z.; Ren, S.L.; Li, J.F. Analysis of power grid harmonics with wavelet network. In Proceedings of the 2017 29th Chinese Control And Decision Conference (CCDC), Chongqing, China, 28–30 May 2017; pp. 6052–6055. [Google Scholar] [CrossRef]
  24. Alves, D.K.; Costa, F.B.; Lucio De Araujo Ribeiro, R.; Martins De Sousa Neto, C.; De Oliveira Alves Rocha, T. Real-time power measurement using the maximal overlap discrete wavelet-packet transform. IEEE Trans. Ind. Electron. 2017, 64, 3177–3187. [Google Scholar] [CrossRef]
  25. Mustafa, T.I.A.H.; Cabral, S.H.; Almaguer, H.D.; Meyer, L.H.; Puchale, L.H.B.; Cereja, J.E.M.; Vier, G.B. Analysis of the Behavior of the 3rd Harmonic over Power Transmission Lines. In Proceedings of the 2019 IEEE PES GTD Grand International Conference and Exposition Asia (GTD Asia), Bangkok, Thailand, 19–23 March 2019; pp. 310–313. [Google Scholar] [CrossRef]
  26. Morsi, W.G.; El-Hawary, M.E. Novel power quality indices based on wavelet packet transform for non-stationary sinusoidal and non-sinusoidal disturbances. Electr. Power Syst. Res. 2010, 80, 753–759. [Google Scholar] [CrossRef]
  27. Guo, M.; Yang, N.; You, L. Wavelet-transform based early detection method for short-circuit faults in power distribution networks. Int. J. Electr. Power Energy Syst. 2018, 99, 706–721. [Google Scholar] [CrossRef]
  28. Qi, P.; Jovanovic, S.; Lezama, J.; Schweitzer, P. Discrete wavelet transform optimal parameters estimation for arc fault detection in low-voltage residential power networks. Electr. Power Syst. Res. 2017, 143, 130–139. [Google Scholar] [CrossRef]
  29. Jayamaha, D.K.J.S.; Lidula, N.W.A.; Rajapakse, A.D. Wavelet-Multi Resolution Analysis Based ANN Architecture for Fault Detection and Localization in DC Microgrids. IEEE Access 2019, 7, 145371–145384. [Google Scholar] [CrossRef]
  30. Morsi, W.G.; El-Hawary, M.E. Wavelet packet transform-based power quality indices for balanced and unbalanced three-phase systems under stationary or nonstationary operating conditions. IEEE Trans. Power Deliv. 2009, 24, 2300–2310. [Google Scholar] [CrossRef]
  31. Morsi, W.G.; El-Hawary, M.E. Power quality evaluation in smart grids considering modern distortion in electric power systems. Electr. Power Syst. Res. 2011, 81, 1117–1123. [Google Scholar] [CrossRef]
  32. Morsi, W.G.; El-Hawary, M.E. Reformulating three-phase power components definitions contained in the IEEE standard 1459–2000 using discrete wavelet transform. IEEE Trans. Power Deliv. 2007, 22, 1917–1925. [Google Scholar] [CrossRef]
  33. Thirumala, K.; Umarikar, A.C.; Jain, T. Estimation of single-phase and three-phase power-quality indices using empirical wavelet transform. IEEE Trans. Power Deliv. 2015, 30, 445–454. [Google Scholar] [CrossRef]
  34. AdvanTech M430 Series. Available online: http://www.advcontrol.eu/download/files/M430_en.pdf?fbclid=IwAR0FXN7N1PzL-F_zGUgnWkwH8HDA42T1mG0pMzL4OgZLfLDJDQbSTJ9nUi8 (accessed on 23 January 2021).
  35. International Electrotechnical Commission. IEC 61800-3:2018. Adjustable Speed Electrical Power Drive Systems—Part 3: EMC Requirements and Specific Test Methods; International Electrotechnical Commission: Geneva, Switzerland, 2018. [Google Scholar]
  36. Asad, B.; Vaimann, T.; Belahcen, A.; Kallaste, A.; Rassõlkin, A.; Iqbal, M.N. Broken rotor bar fault detection of the grid and inverter-fed induction motor by effective attenuation of the fundamental component. IET Electr. Power Appl. 2019, 13, 2005–2014. [Google Scholar] [CrossRef]
  37. García Plaza, E.; Núñez López, P.J. Application of the wavelet packet transform to vibration signals for surface roughness monitoring in CNC turning operations. Mech. Syst. Signal Process. 2018, 98, 902–919. [Google Scholar] [CrossRef]
  38. RX Gao, R.Y. Wavelets: Theory and Applications for Manufacturing; Springer: Boston, MA, USA, 2010. [Google Scholar]
  39. Matlab Discrete Wavelet Transform. Available online: https://se.mathworks.com/help/wavelet/ref/dwt.html (accessed on 26 May 2020).
  40. Johnson, S.G.; Frigo, M. A modified split-radix FFT with fewer arithmetic operations. IEEE Trans. Signal Process. 2007, 55, 111–119. [Google Scholar] [CrossRef]
  41. Xia, J.; Tashpolat, T.; Zhang, F.; Ji, H.-J. The Design and Implementation of FFTW3. Proc. IEEE 2005, 93, 216–231. [Google Scholar] [CrossRef]
  42. Cooley, J.W.; Tukey, J.W. An algorithm for the machine calculation of complex Fourier series. Math. Comput. 1965, 19, 297. [Google Scholar] [CrossRef]
  43. De Apráiz, M.; Barros, J.; Diego, R.I. A real-time method for time-frequency detection of transient disturbances in voltage supply systems. Electr. Power Syst. Res. 2014, 108, 103–112. [Google Scholar] [CrossRef]
  44. Gencer, Ö.; Öztürk, S.; Erfidan, T. A new approach to voltage sag detection based on wavelet transform. Int. J. Electr. Power Energy Syst. 2010, 32, 133–140. [Google Scholar] [CrossRef]
  45. Li, J.; Wang, H.; Wang, X.; Zhang, Y. Rolling bearing fault diagnosis based on improved adaptive parameterless empirical wavelet transform and sparse denoising. Measurement 2020, 152, 107392. [Google Scholar] [CrossRef]
  46. Ping, H.W.; Gaeid, K.S. Detection of induction motor faults using direct wavelet transform technique. In Proceedings of the 2012 15th International Conference on Electrical Machines and Systems (ICEMS), Sapporo, Japan, 21–24 October 2012. [Google Scholar]
  47. Singh, M.; Shaik, A.G. Broken Rotor Bar Fault Diagnosis of a Three-phase Induction Motor using Discrete Wavelet Transform. In Proceedings of the 2019 IEEE PES GTD Grand International Conference and Exposition Asia (GTD Asia), Bangkok, Thailand, 19–23 March 2019; pp. 13–17. [Google Scholar] [CrossRef]
  48. Ameid, T.; Menacer, A.; Talhaoui, H.; Azzoug, Y. Discrete wavelet transform and energy eigen value for rotor bars fault detection in variable speed field-oriented control of induction motor drive. ISA Trans. 2018, 79, 217–231. [Google Scholar] [CrossRef]
  49. Fernandez-Cavero, V.; Pons-Llinares, J.; Duque-Perez, O.; Morinigo-Sotelo, D. Detection and quantification of bar breakage harmonics evolutions in inverter-fed motors through the dragon transform. ISA Trans. 2021, 109, 352–367. [Google Scholar] [CrossRef]
  50. Cherif, H.; Benakcha, A.; Laib, I.; Chehaidia, S.E.; Menacer, A.; Soudan, B.; Olabi, A.G. Early detection and localization of stator inter-turn faults based on discrete wavelet energy ratio and neural networks in induction motor. Energy 2020, 212, 118684. [Google Scholar] [CrossRef]
  51. Rassolkin, A.; Rjabtsikov, V.; Vaimann, T.; Kallaste, A.; Kuts, V.; Partyshev, A. Digital Twin of an Electrical Motor Based on Empirical Performance Model. In Proceedings of the 2020 XI International Conference on Electrical Power Drive Systems (ICEPDS), St. Petersburg, Russia, 4–7 October 2020; pp. 8–11. [Google Scholar] [CrossRef]
  52. Rassolkin, A.; Vaimann, T.; Kallaste, A.; Kuts, V. Digital twin for propulsion drive of autonomous electric vehicle. In Proceedings of the 2019 IEEE 60th International Scientific Conference on Power and Electrical Engineering of Riga Technical University (RTUCON), Riga, Latvia, 7–9 October 2019; pp. 1–4. [Google Scholar] [CrossRef]
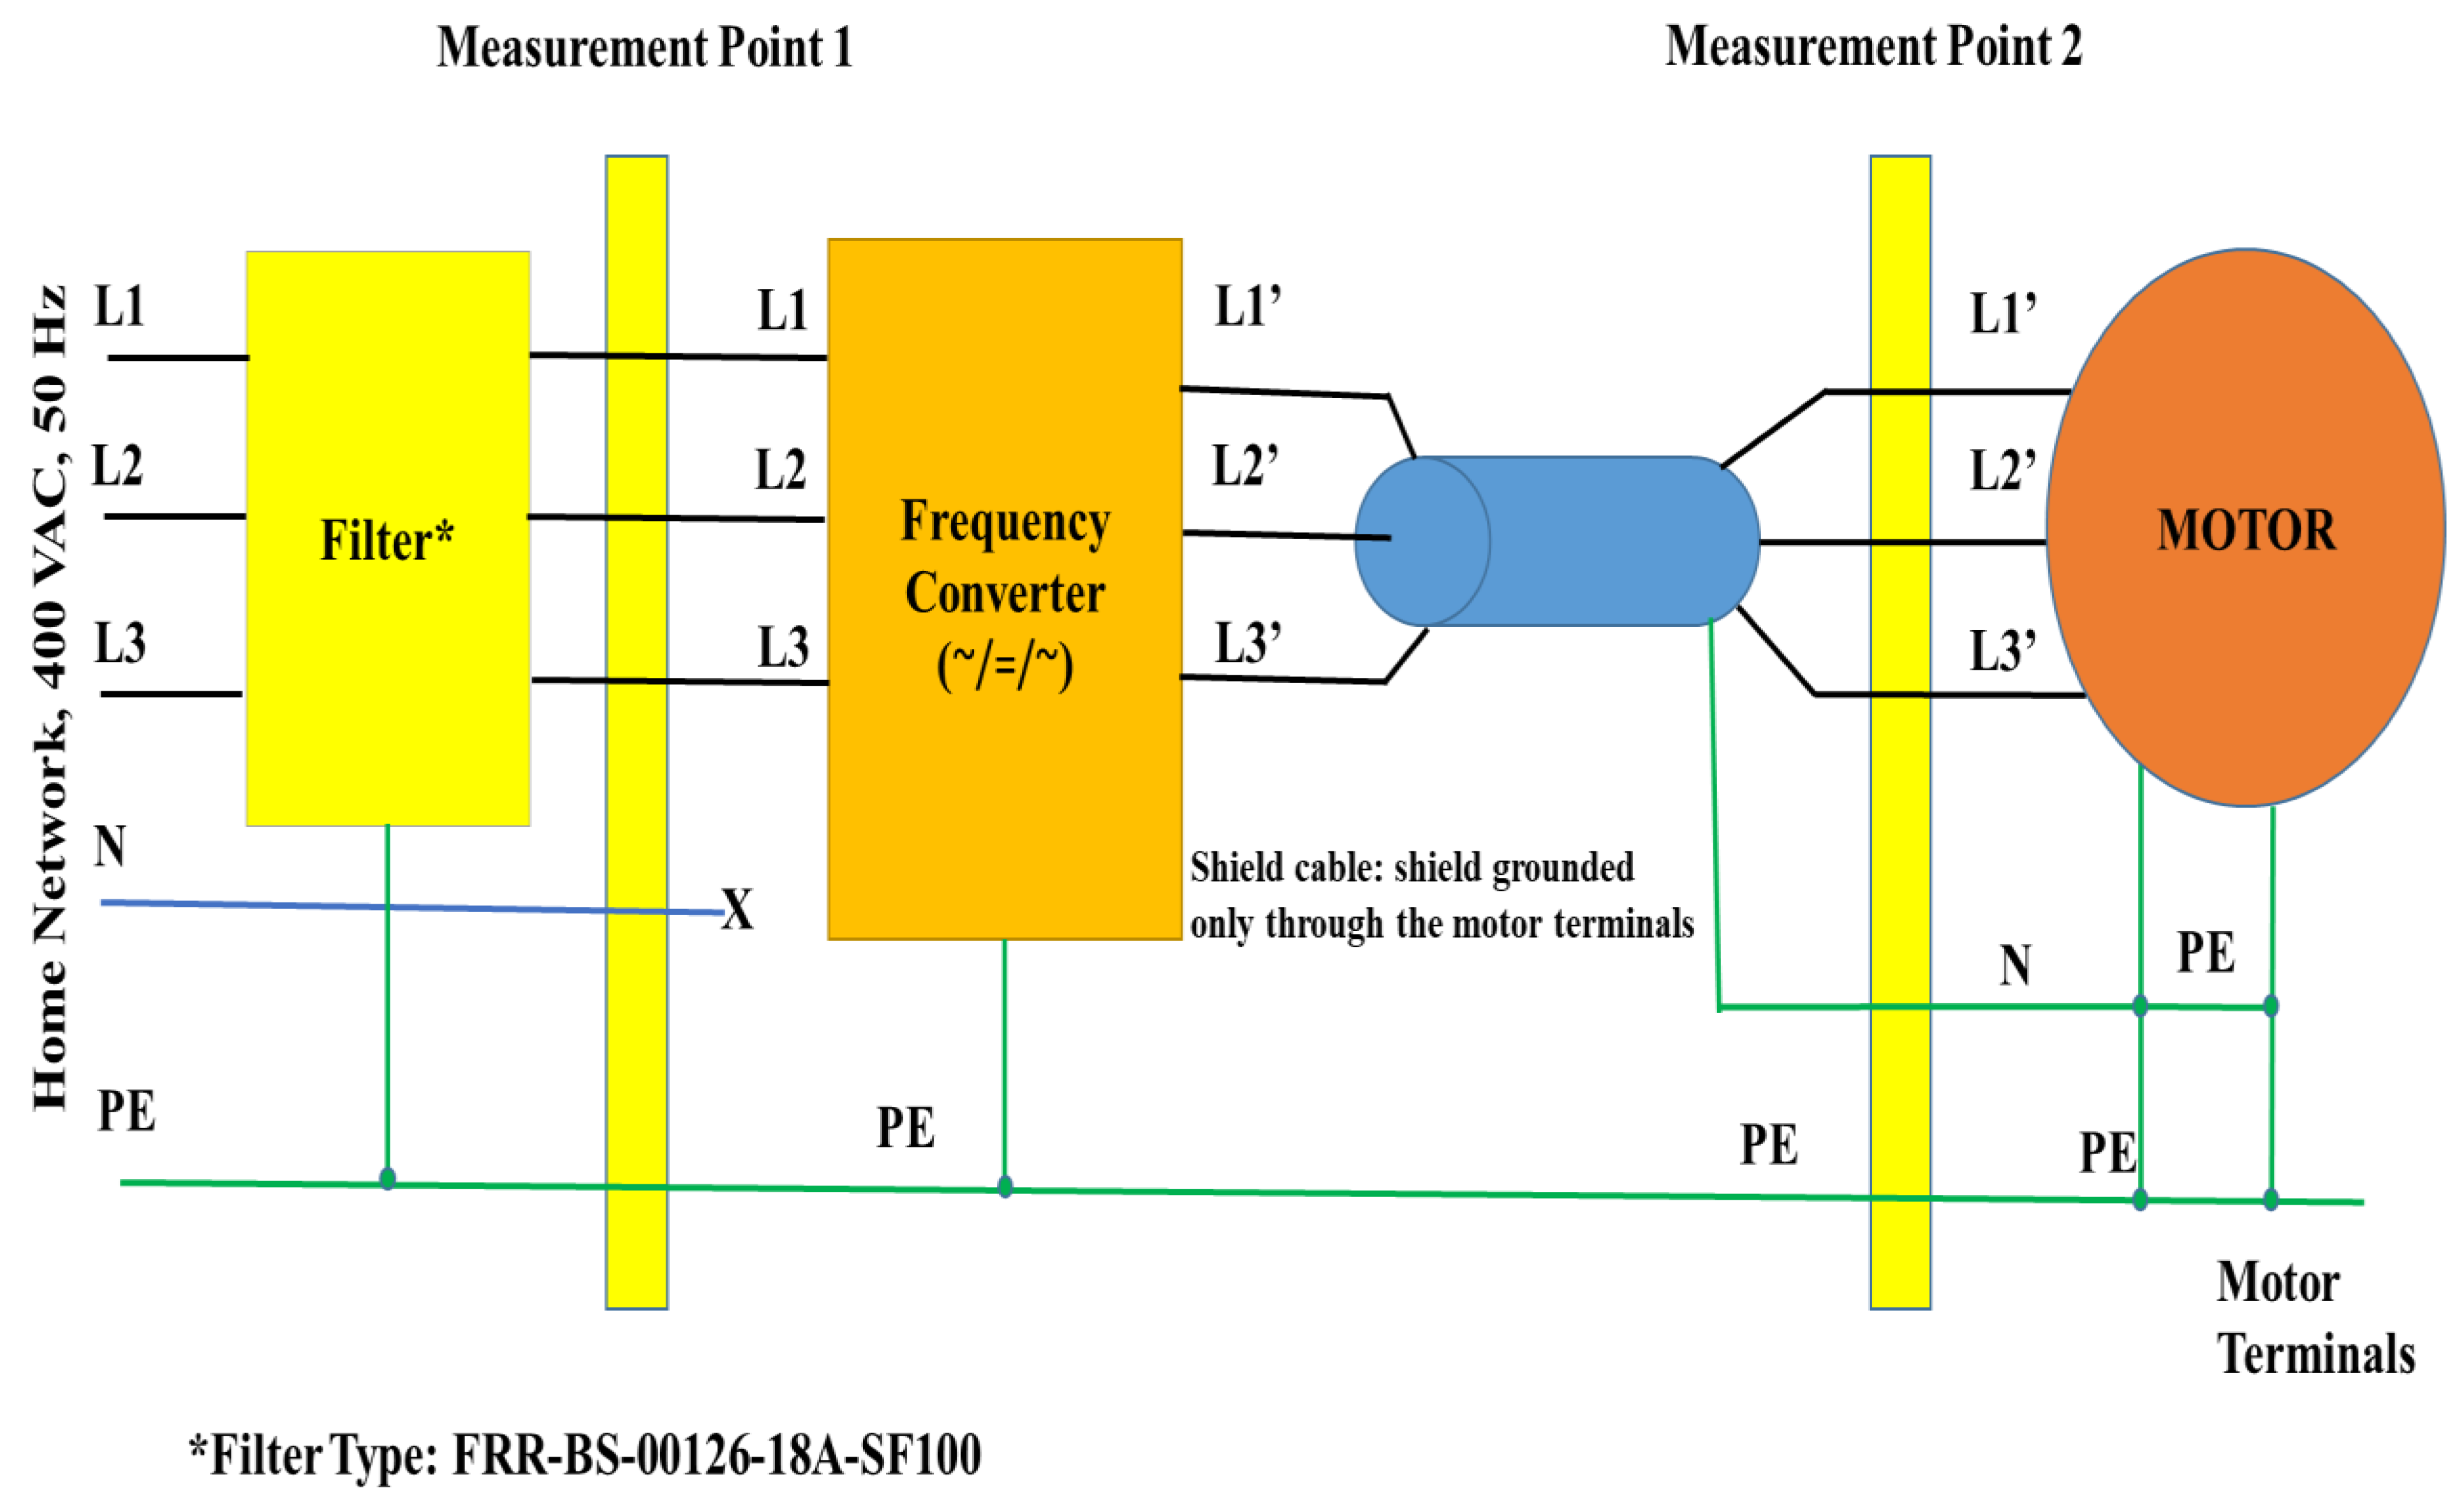
Figure 1. Drive supply circuit diagram (high current component).
Energies 14 02001 g001
Figure 2. Wiring diagram for the frequency converter.
Energies 14 02001 g002
Figure 3. Components related to the fan motor in the ventilation unit and earth connection.
Energies 14 02001 g003
Figure 4. Phase voltage values and phase current values.
Energies 14 02001 g004
Figure 5. Filter bank of discrete wavelet transform.
Energies 14 02001 g005
Figure 6. Block diagram of the frequency analysis.
Energies 14 02001 g006
Figure 7. The measured current signal. (a) Original signal in the time domain, (b) Fourier transform of the signal.
Energies 14 02001 g007
Figure 8. Decomposition of the signal. (a) Signal above 2.5 MHz, (b) Signal between 1.2 MHz and 2.5 MHz, (c) Signal between 600 kHz and 1.2 MHz, (d) Signal below 600 kHz.
Energies 14 02001 g008
Figure 9. Decomposed signal above 9 kHz. (a) Time-domain signal, (b) Fourier transform of the signal.
Energies 14 02001 g009
Figure 10. Decomposed signal below 9 kHz. (a) Time-domain signal, (b) Fourier transform of the signal.
Energies 14 02001 g010
Figure 11. Decomposed signal below 630 Hz. (a) Time-domain signal, (b) Fourier transform of the signal.
Energies 14 02001 g011
Table 1. Technical specification of the frequency converter [34].
Input Voltage [V]3-Phase 380 (50/60 Hz)Voltage Range [V]323–437
Rated Output Power [kW]5.5/4Startup Torque150%, 0.5 Hz (sensorless vector control) 150%, 1 H (V/f control)
Input Current [A]15/10Maximum Frequency [Hz]400
Output Current [A]13/9Carrier Frequency [kHz]1–15
Overload Capacity 60 s [A]19.5/13.5V/f CurveLinear, Square, Multipoint
Applicable Motor [kW]5.5/4ProtectionOverload, over and under voltage, overheat, over current, phase loss
Publisher’s Note: MDPI stays neutral with regard to jurisdictional claims in published maps and institutional affiliations.