Abstract
In this paper the multi-phenomena deflagration model is used to simulate deflagrative combustion of several fuel–air mixtures in various scale closed vessels. The experimental transient pressure of methane–air, ethane–air, and propane–air deflagrations in vessels of volume 0.02 m3, 1 m3, and 6 m3 were simulated. The model includes key mechanisms affecting propagation of premixed flame front: the dependence of laminar burning velocity of concentration, pressure, and temperature; the effect of preferential diffusion in the corrugated flame front or leading point concept; turbulence generated by flame front itself or Karlovitz turbulence; increase of the flame front area with flame radius by fractals; and turbulence in the unburned mixture. Laminar velocity dependence on concentration, pressure, and temperature were calculated using CANTERA software. Various scale and geometry of used vessels induces various combustion mechanism. Simulations allow insight into the dominating mechanism. The model demonstrated an acceptable predictive capability for a variety of fuels and vessel sizes.
1. Introduction
Gaseous deflagration is a typical accident scenario, which may generate pressure and thermal effect hazardous for humans and with potential to damage structures. Initial conditions for combustions vary a lot, deflagration may start from either initially quiescent or turbulent mixture in the open space free of congestionor in a closed or vented space, etc. Various flame acceleration mechanisms dominate the process of flame acceleration. The worst-case scenario is the deflagration-to-detonation transition process (DDT), followed by stable detonation, which should be avoided. Ideally explosion models should predict not only deflagrative overpressure and flame propagation dynamics but also the moment and location of DDT. This is a very challenging task that has been under investigation by the industrial and academic combustion community over the last decades.
From the industrial community point of view predictive explosion models should be thoroughly validated against various scales including the large-scale experiments. The multi-phenomena deflagration model, which has been under development at the Ulster University during the last two decades, is one of the models addressing these challenges. The description of versions of the model and its development can be found elsewhere [1,2,3,4,5,6,7,8,9,10,11] and were summarized in the monograph [12]. The developing versions of the model have been applied at different stages to various CFD benchmark scenarios [13,14,15,16,17]. The same approach with the use of the progress variable equation and the gradient method as the source term was applied in due course to successfully simulate the propagation of detonations [18,19]. The multi-phenomena model of gaseous deflagrations is currently used in industry and academia in Canada, Greece, Japan, and the UK.
The development of the multi-phenomena model was previously focused on hydrogen–air mixtures due to Ulster University involvement in safety research of hydrogen and fuel cells. This paper demonstrates further code development for application to hydrocarbon–air deflagrations such that methane–air, ethane–air, and propane–air deflagrations. The multi-phenomena model has been under development with the aim to include as many mechanisms affecting flame propagation and the combustion rate as possible. Currently, the model integrates the parameterized dependence of the turbulent burning velocity on the following factors: the dependence of laminar burning velocity (LBV) on temperature and pressure, which are changing during progression of deflagration, the dependence of laminar burning velocity on fuel concentration (in the case of non-uniform mixtures), the effect of turbulence in unburned mixture on turbulent burning velocity, the effect of turbulence generated by the flame front itself on the combustion rate, the effect of preferential diffusion in turbulent flames on the burning rate (leading point concept), and fractals structure of the corrugated (turbulent) flame.
There are two key parameters affecting the deflagration pressure transient in a closed vessel: initial laminar burning velocity, Su0, which depends on initial pressure and temperature and a concentration of fuel in the mixture with air, and thermokinetic index, ε, which is a function of pressure, n, and temperature, m, indices, and the specific heats ratio for unburned mixture, γu, in the dependence of the laminar burning velocity, Su, on changing pressure and temperature:
where π = p/p0 is the dimensionless pressure with standing for transient pressure and p0 for initial pressure, and ε is the thermokinetic index that integrates effects of changing during adiabatic compression temperature and pressure in a form ε = m + n − m/γu.
There are several LBV data describing dependence on pressure and temperature in hydrogen–air and methane–air mixtures. The baric index for methane–air mixtures is in the range from n = 0.20 (for pressure range 0.1–1.0 MPa) to n = 0.53 (0.3–4.0 MPa) [20]. Babkin and Kozachenko [20] stated that the temperature index for methane–air mixture is decreasing at atmospheric pressure from 2.20 to 1.75 with the increase of methane concentration from 9% to 10% by volume, i.e., for a stoichiometric mixture of 9.5% it is about m = 1.97. These would give thermodynamic index in a range (with γu = 1.39) of quite high values of ε = 0.75–1.08. Later Babkin et al. published data on thermokinetic index for stoichiometric methane–air at 323 K for a range of pressures 0.1–7.1 MPa as ε = 0.13–0.26, and at 300 K and 0.101 MPa as ε = 0.25–0.31 (the last for methane concentrations 6–10%) [21,22]. For hydrogen–air mixtures in the concentration range of hydrogen 10–75% it has been derived that ε = 0.49–0.68 at 298 K and 0.101 MPa [21,22]. The thermokinetic index obtained by the methodology [20] for stoichiometric methane–air mixture is ε = 0.30–0.35 for closed vessel deflagration at initial pressure 0.101 MPa and initial temperature 293 K (laminar burning velocity is 29–32 cm/s).
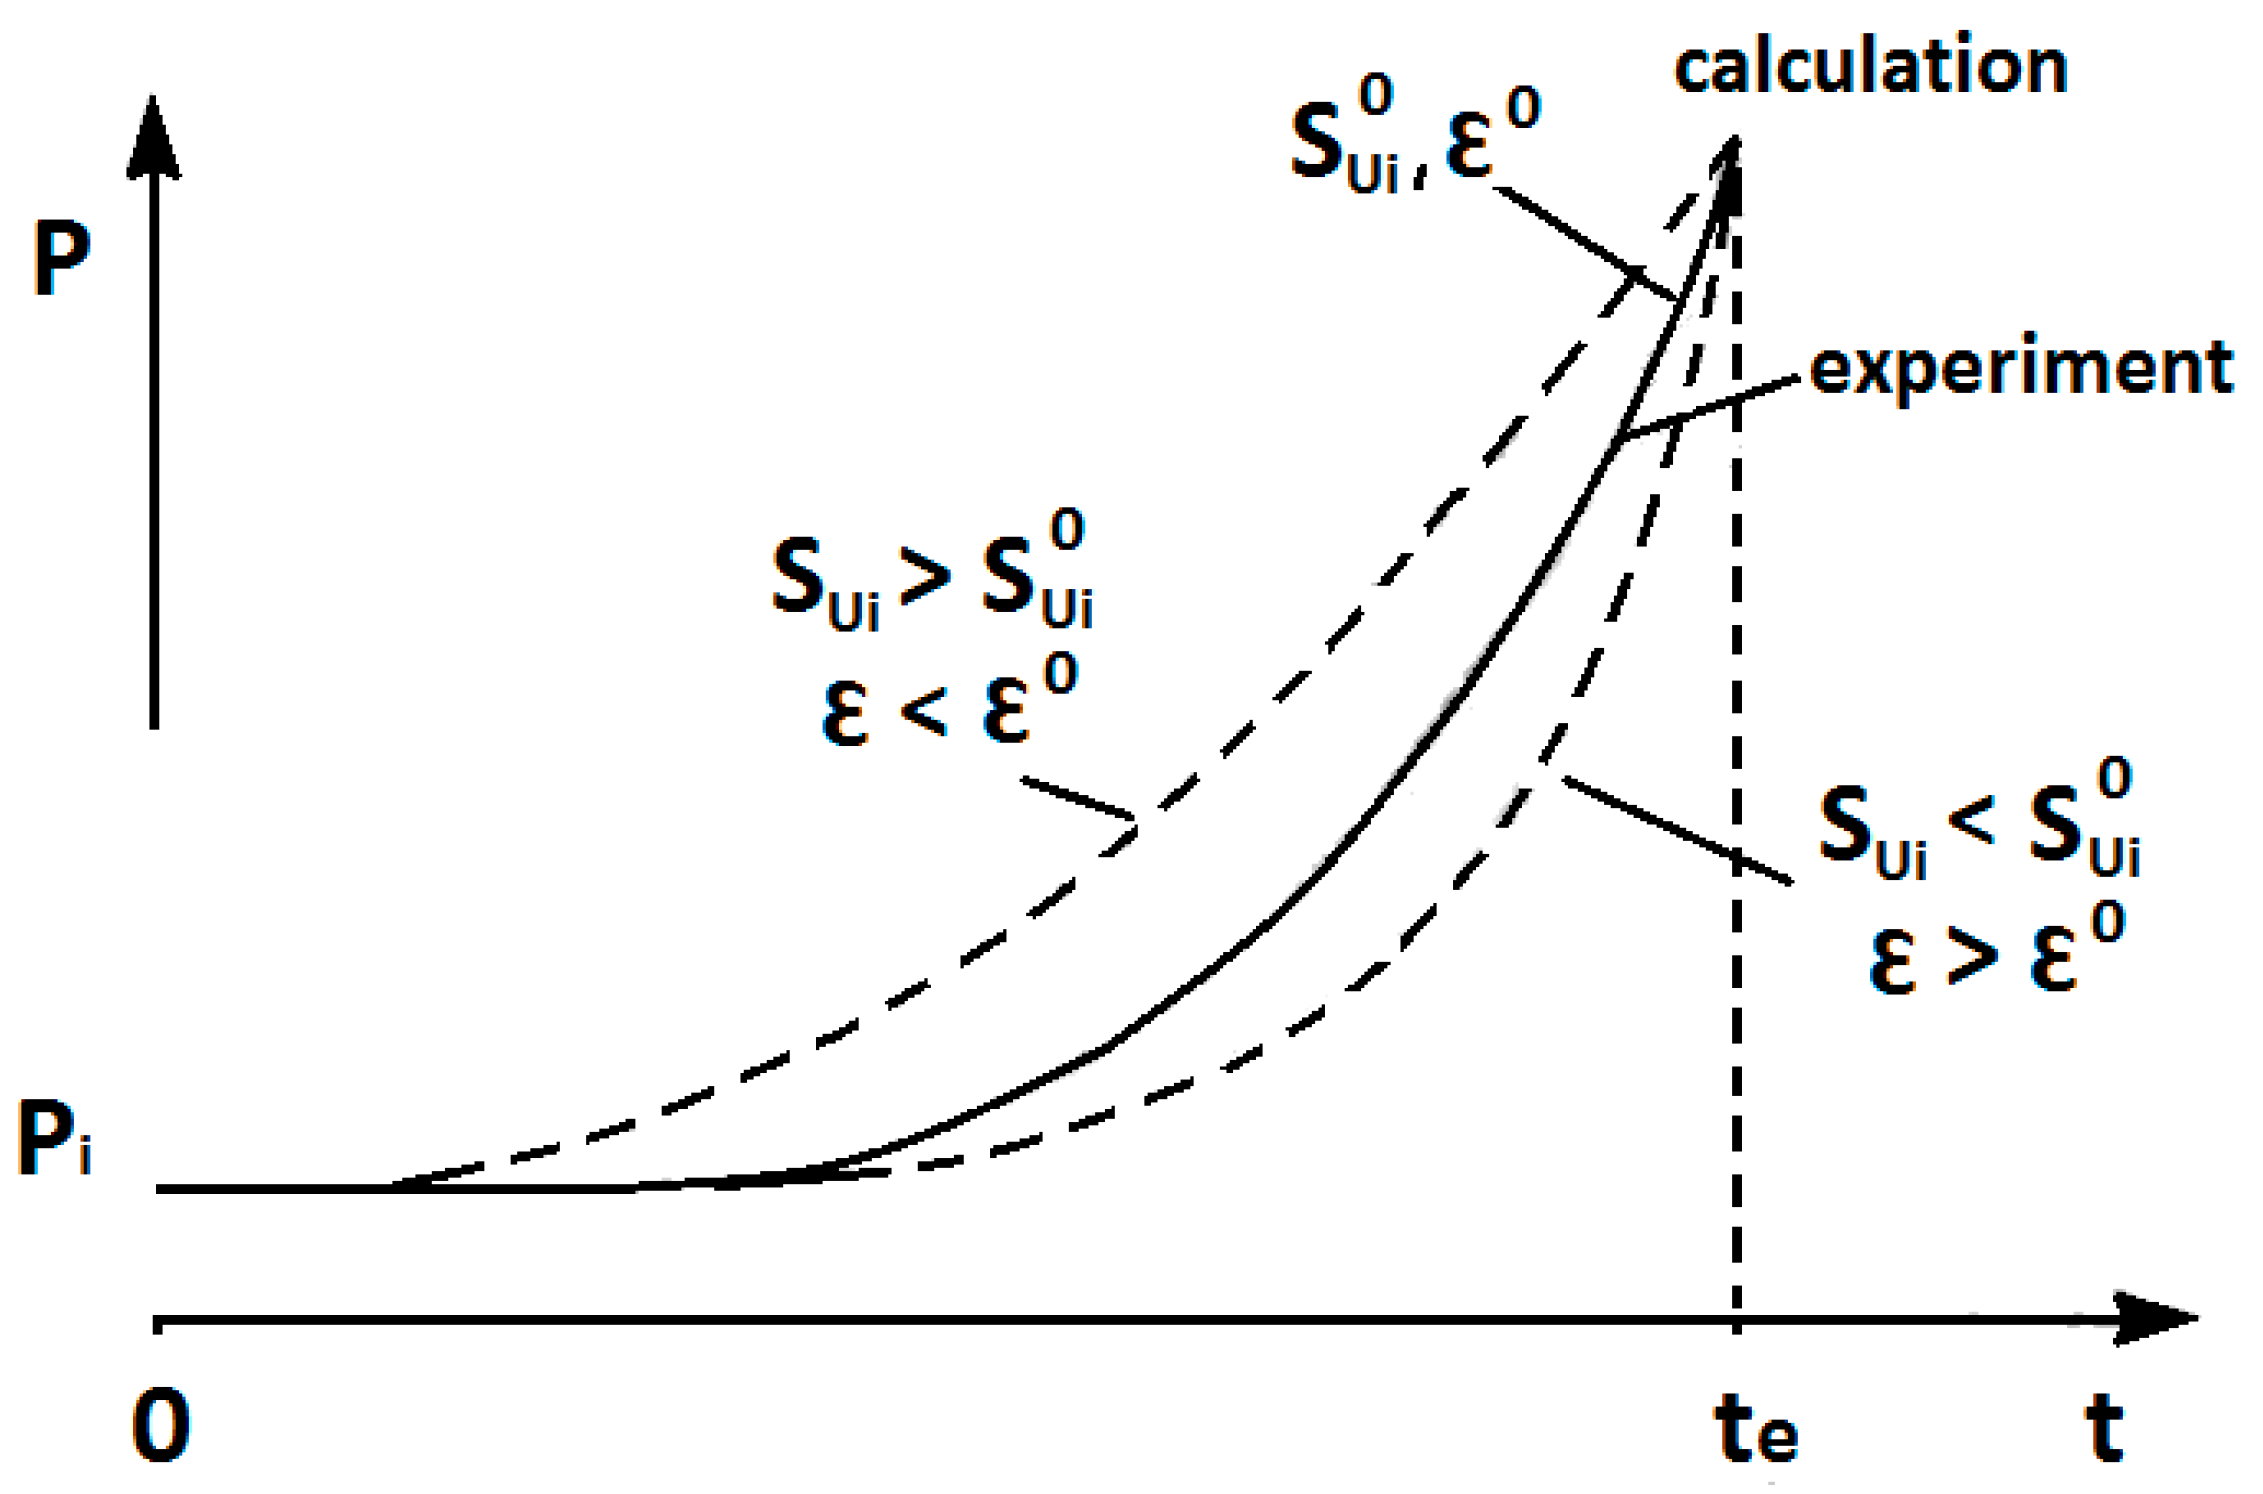
The effect of initial laminar burning velocity, Su,i, and thermokinetic index, ε, on deflagration dynamics can be found in Figure 1. By changing these parameters, the simulated pressure curve can be optimized to meet a transient experimental pressure. The increase of Su,0 and simultaneous decrease of ε (to keep the same time of mixture combustion) would produce simulated pressure transient with a smaller second derivative (see Figure 1).
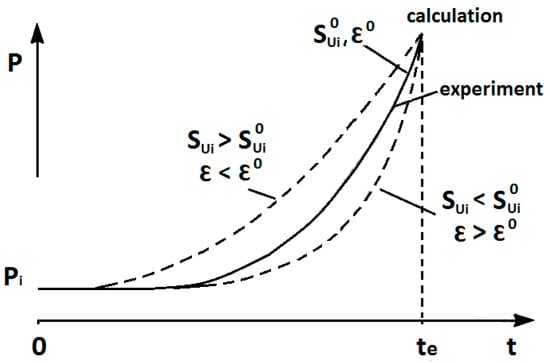
Figure 1.
The effect of initial laminar burning velocity, Sui and thermokinetic index, ε on the deflagration pressure transient.
Zero-dimensional lamped parameters in the thermokinetic index ε, include not only thermokinetic phenomena (chemistry) but the effects of unresolved cellular structure on the flame propagation as well. It has been demonstrated previously that with the increase of pressure and temperature the difference between the laminar burning velocity simulated by 1D models with chemistry and derived by inverse problem method from closed bomb experiments using the lamped parameter model is increasing [23]. There is another important aspect in the validation of models against experimental deflagrations. This is the fact that an ignition source could give about ±10% of the pressure transient shift along the time axis [20]. Apart from the above aspects related to model validation we might expect that in experiments the influence of the heat losses on the pressure trace will be the highest when the flame will approach the vessel walls.
In this paper the authors aim to improve the understanding of closed vessel deflagration modeling and validate the multi-phenomena turbulent burning velocity model against experimental deflagrations in closed vessels of different sizes with various fuel mixtures. As the model up-to-date has been tested and validated for hydrogen–air mixtures only and mainly in open space configurations, this paper is the next step to extend the code validity range to different fuels and to constant volume combustion class.
2. Description of Experiments
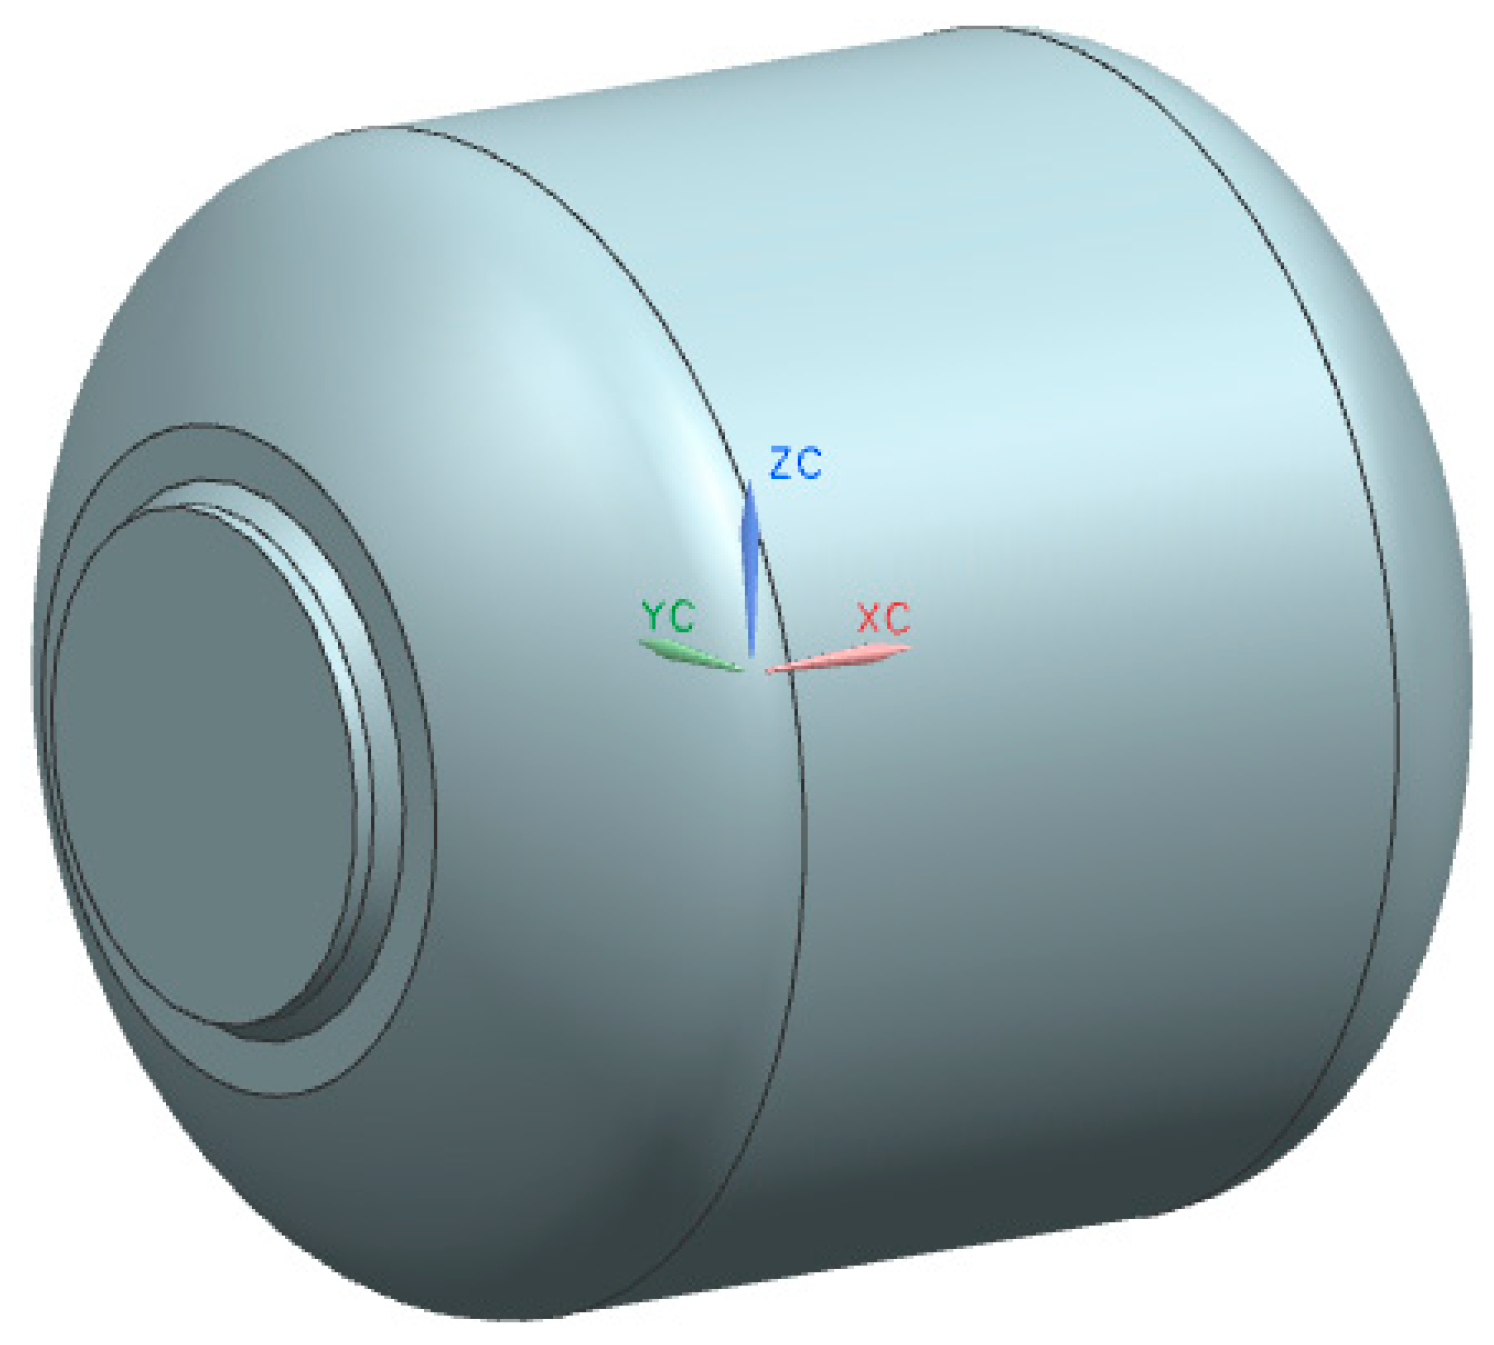
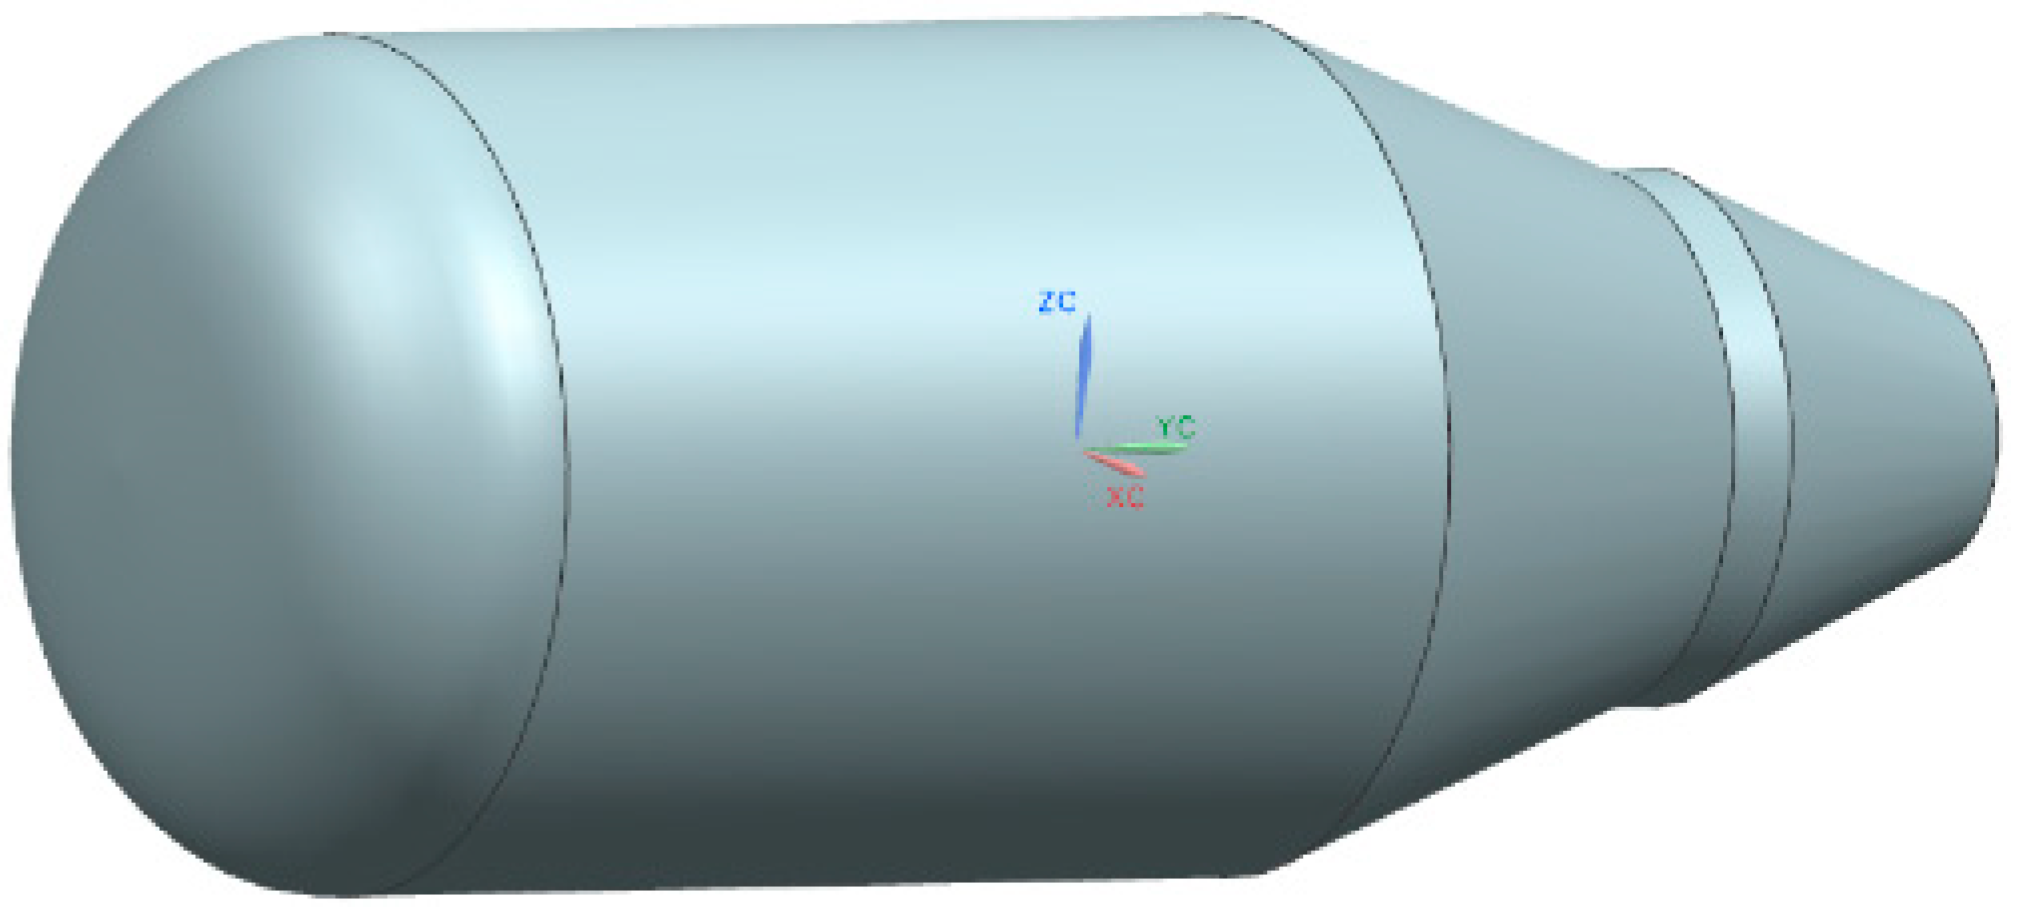
Experiments were performed in closed vessels of 0.02 m3, 1 m3, and 6 m3 volume, experiments in 1 and 6 m3 volume were conducted at the Experimental Mine Barbara of Central Mining Institute, Poland. The spherical 0.02 m3 vessel is described in detail in standard EN 15967. Ignition was initiated by electric spark in the center of the volume. The ignition energy was in the range of 10–20 J according to the spark generation methodology described in EN 15,967 standard. The 1 m3 vessel shape (L/D is close to1) was composed of a cylindrical part of diameter 1.1 m and convex sides fitted with flat closing lids. The 3D model of the 1 m3 vessel fluid volume is presented in Figure 2. The spark plug was used as the ignition source placed in the center of the tank. More detailed information about the 1 m3 vessel might be found in [24]. The 6 m3 vessel (L/D ≈ 2.5) was composed of a cylindrical part of 1600 mm in diameter closed by semi-spherical-like bottom at one side and extendable, conical shape parts closed with a flat lid. The 3D drawing of the vessel volume is presented in Figure 3. Ignition source was electrical spark placed in the geometrical center of the cylindrical part.
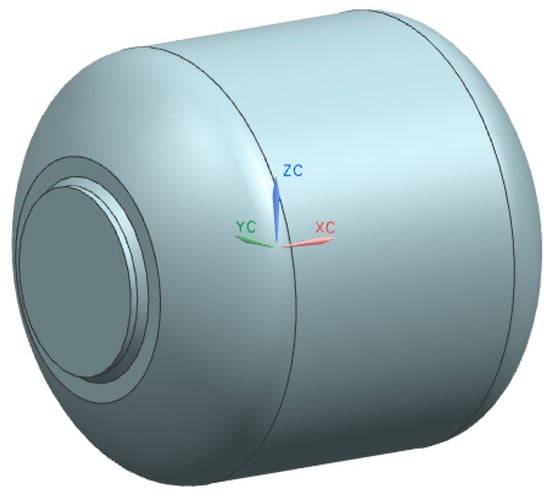
Figure 2.
3D drawing of 1 m3 vessel fluid volume.
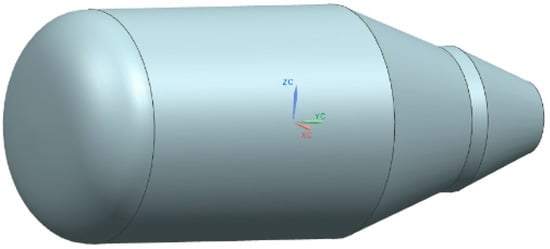
Figure 3.
3D drawing of 6 m3 vessel fluid volume.
3. The Multi-Phenomena Model of Deflagration
The multi-phenomena model of deflagration has been under development with the aim to include as many mechanisms affecting flame propagation and combustion rate as possible. The model used is based on the interaction of three mechanisms responsible for the increase of flame surface area (ΞK, Ξlp, and Ξf). The implemented modified version of Yakhot’s [25] equation describing turbulent flame propagation velocity integrates the following factors:
- -
- the dependence of LBV on changing pressure, temperature and fuel concentration in air (in case of non-uniform mixtures)—Su (φ, P, and T),
- -
- the effect of turbulence in unburned mixture of turbulent burning velocity, exponential function in Yakhot’s equation,
- -
- the effect of turbulence generated by flame front itself on combustion rate, ΞK,
- -
- the effect of preferential diffusion in turbulent flames of burning rate (leading point concept), Ξlp,
- -
- fractals structure of the corrugated (turbulent flame), Ξf, which define flame surface area.
The modified Yakhot’s equation for premixed turbulent flame velocity:
where:
St—turbulent flame velocity,
u’—turbulence intensity (root mean square velocity),
The flame propagation is simulated by the progress variable equation with the gradient method applied for the source term:
The gradient method allows one to decouple a physical requirement to keep the turbulent mass burning rate and a numerical requirement for a simulated flame front to occupy 4–5 control volumes, independent of the numerical mesh size and a scale of the numerical domain. Integrating the source term will always give a correct value of mass burning rate per unit area independently of flame front thickness (numerical). Therefore, using the gradient method, simulations of flame front propagation and pressure dynamics should not be affected noticeably by the mesh size, although the size and structure of a numerical flame front are not actual characteristics of the real flame front [12]. More detailed information about the multi-phenomena model has been included elsewhere [1,2,3,4,5,6,7,8,9,10,11,12,13], so the reader is referred to these papers. The parameters ΞLP and R0 used in simulations are presented in Figure 4 and in Table 1.

Figure 4.
Leading point factor ΞLP (effect of preferential diffusion) [23] for: (a) CH4–air, (b) C2H6–air, and (c) C3H8–air.

Table 1.
R0—characteristic dimension-radius at which transition to the self-similar turbulent regime takes place.
4. Calculation of Laminar Burning Velocity
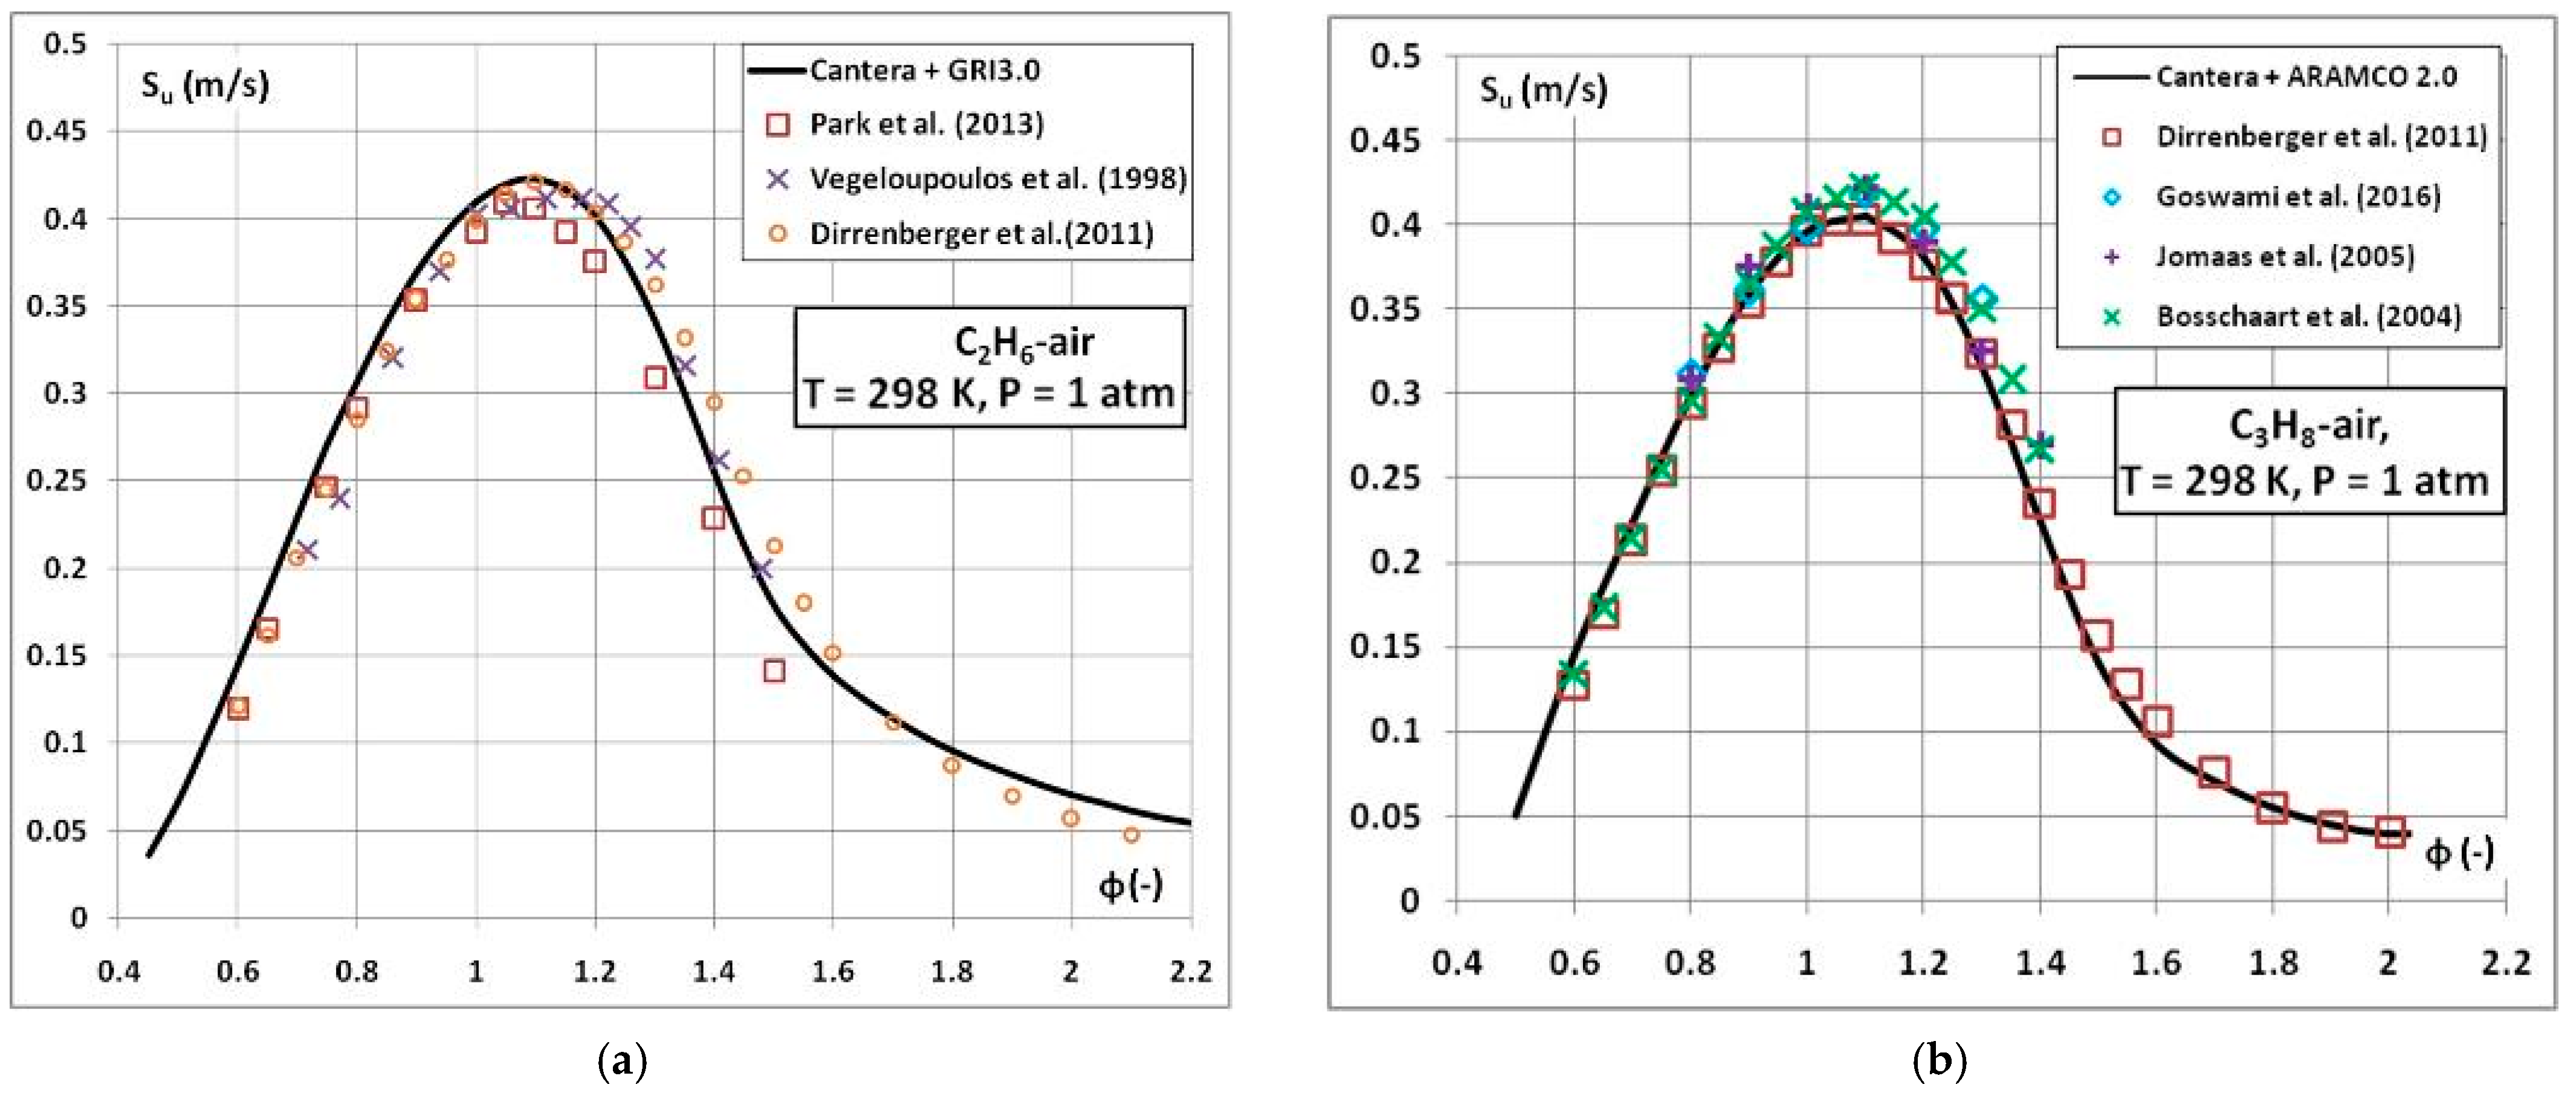
The calculations of LBV were done with Cantera code version 2.2 [27]. The method used for calculation was Freeflame class with a model of flat, freely propagating flame. The results of the LBV calculations are presented in Figure 5. Chemical reaction mechanisms used for the calculations were GRI 3.0 [28] for ethane–air and ARAMCO 2.0 [29] for propane–air mixtures. LBV for stoichiometric methane–air was taken from the work of Pekalski [30] who performed LBV calculations with Chemkin software. Table 2 summarizes the values of LBV, m, n, thermokinetic indexes and specific heat ratios parameters obtained under stoichiometric conditions.
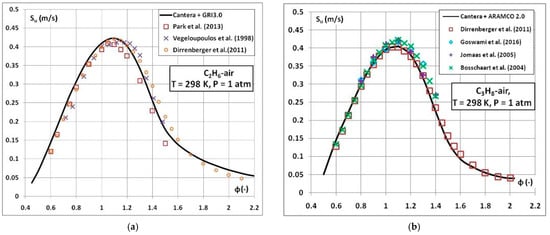
Figure 5.
LBV for (a) ethane–air and (b) propane–air calculated with Cantera code–comparison with experimental data [31,32,33,34,35,36].

Table 2.
Parameters for stoichiometric hydrocarbon–air mixtures calculated with Cantera code.
The deflagration model needs additional mixture parameters including adiabatic flame temperature, expansion ratio, heat of combustion and density of unburned mixture. All of these parameters (Figure 6) were calculated with Cantera and implemented into the code (in a form of up to 6th order polynomial curve) along with laminar burning velocity.


Figure 6.
Example input data calculated with Cantera: (a) adiabatic flame temperature, (b) expansion ratio, (c) heat of combustion, and (d) unburned mixture density (solid lines) as a function of CH4 fraction in air. Cantera generated data with 1–6th order polynomial fit curve (dashed lines). Data generated for initial temperature 293 K and pressure 1.01325 bar.
5. Numerical Simulations Description
Numerical simulations were performed with Fluent 15.0 software and the Ulster University multi-phenomena model has been implemented as a User-Defined Function (UDF) file. A coupled compressible solver with explicit linearization of the equation set was used with CFL number of 0.8. A second-order central scheme was applied for diffusion terms and a second-order upwind difference scheme for discretization of convection terms.
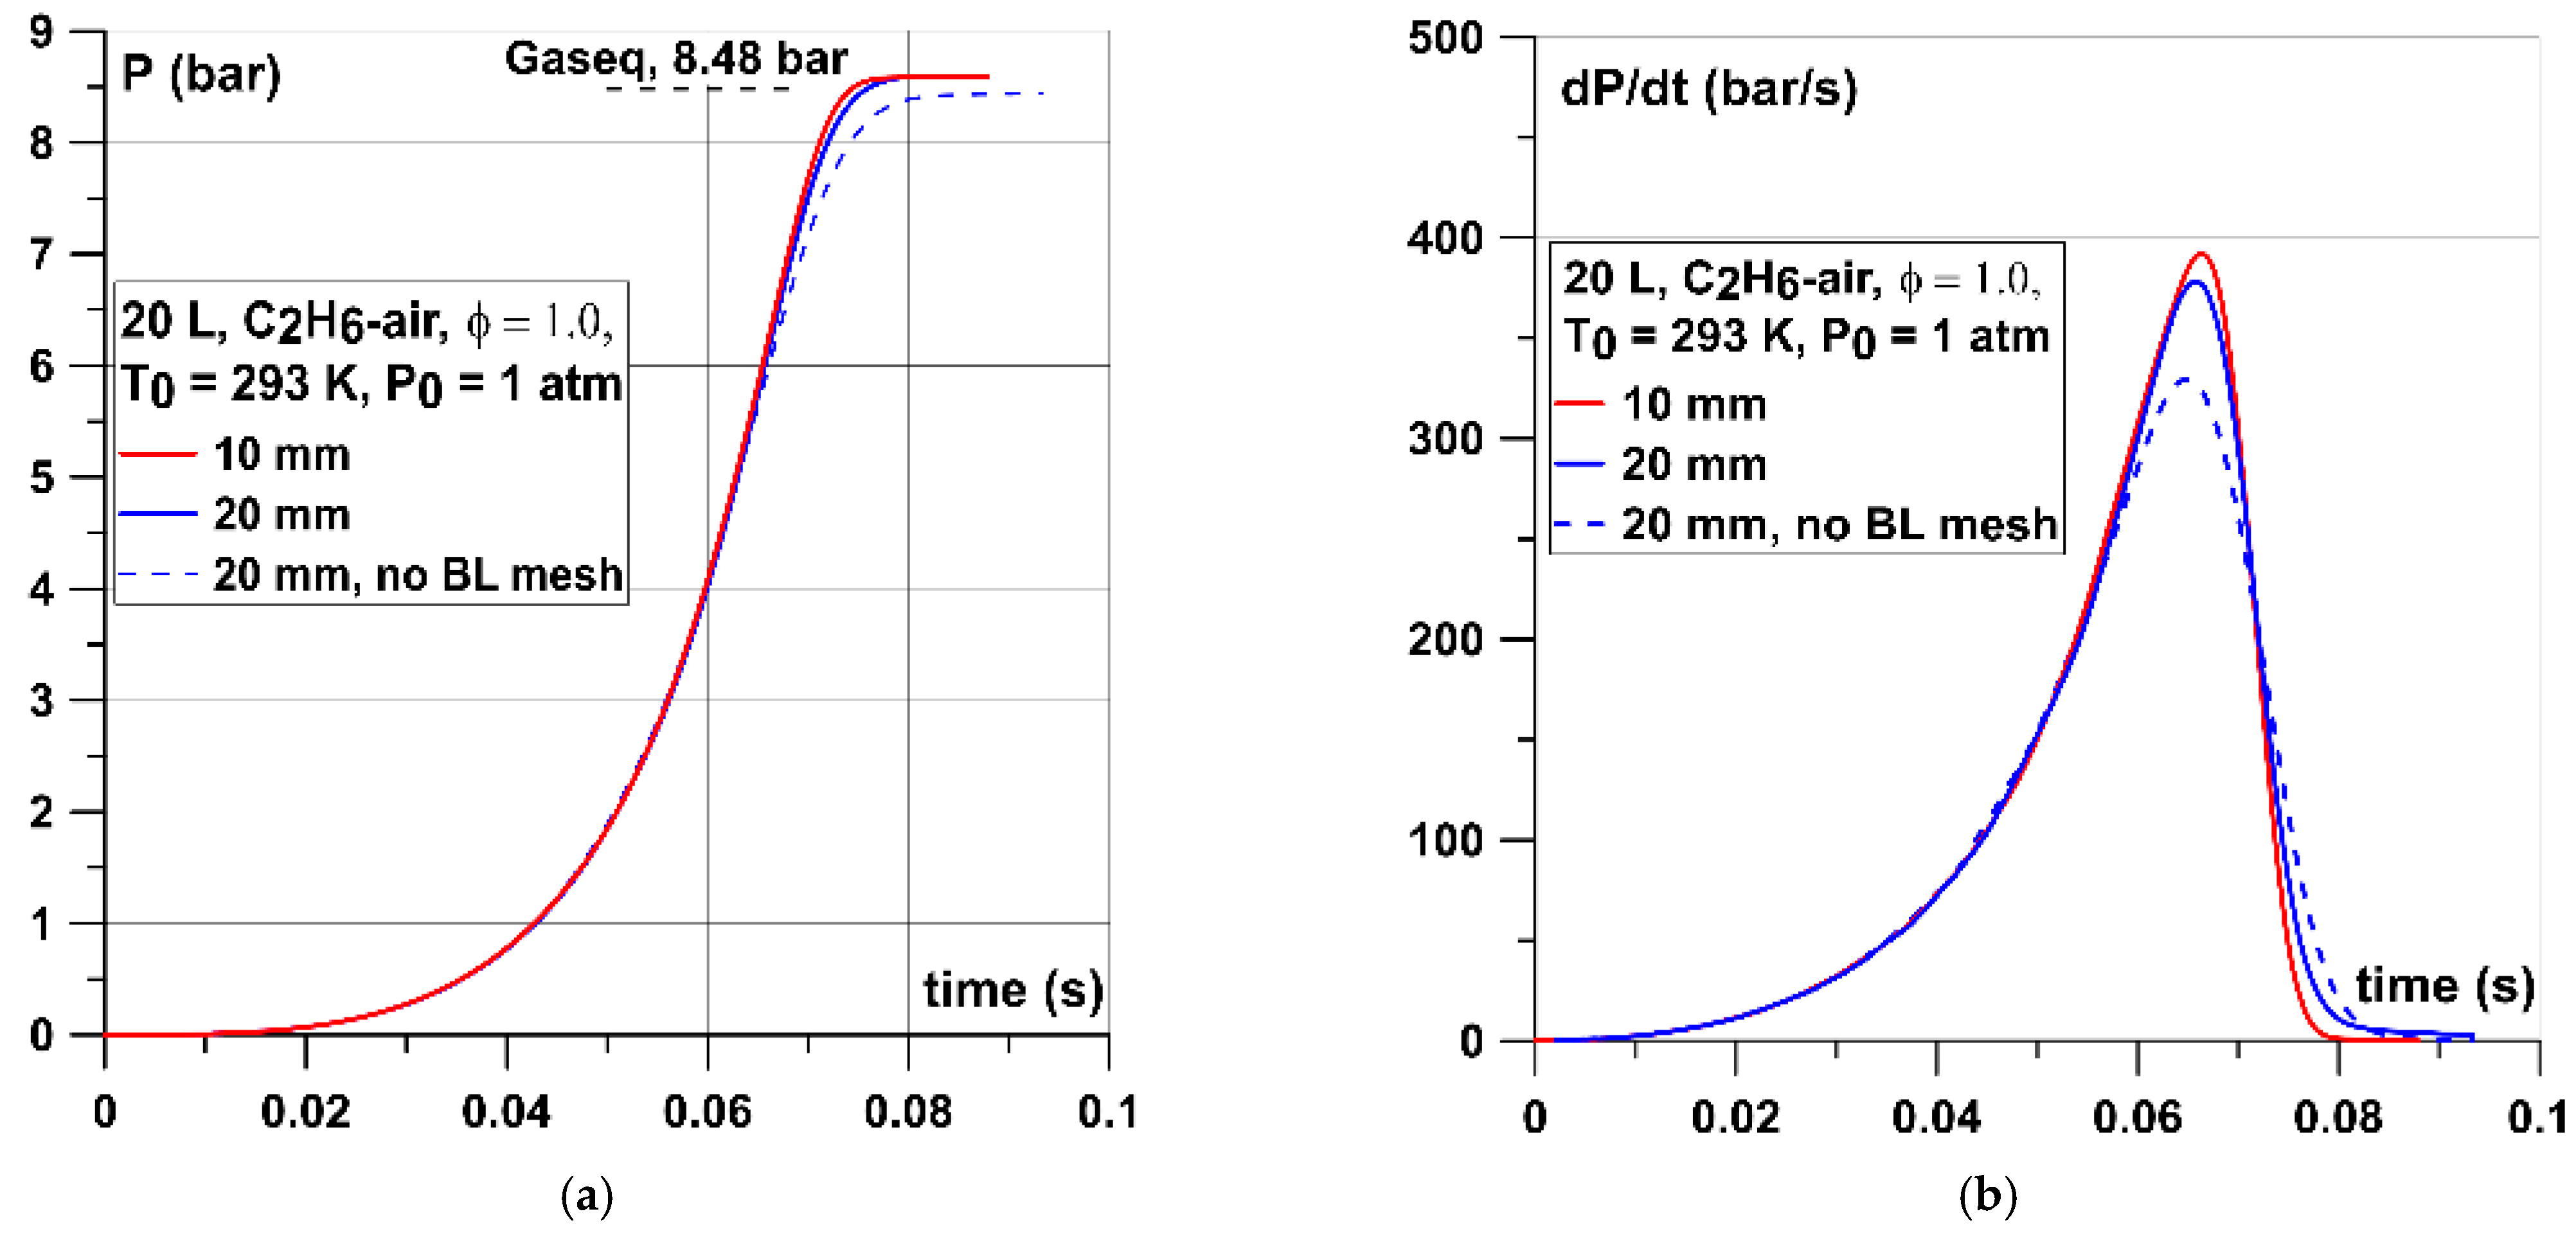
The geometries considered were meshed with tetragonal control volumes of nominal sizes equal to 10 mm, 50 mm and 80 mm for 0.02 m3, 1 m3 and 6 m3 vessels, respectively. Initially performed simulations showed that when the flame approached the walls the maximum pressure was reached asymptotically. This behavior caused by the utilized gradient method and relatively large cells at walls was reduced by adding additional four-five layers of prism cells with gradual decrease of the cells height while approaching the wall. The effect of this operation is presented in Figure 7 where pressure and dP/dt traces of C2H6–air combustion are compared for meshes of 20 mm nominal mesh size but with and without the boundary layer cells. Additionally, the simulation with the mesh of 10 mm nominal mesh size shows little difference of the results comparing to the 20 mm mesh.
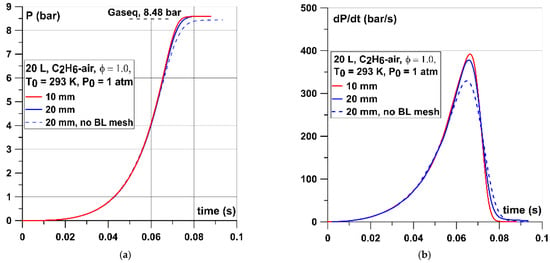
Figure 7.
Influence of the mesh size and boundary layer mesh at wall on the: (a) pressure and (b) dP/dt traces for stoichiometric C2H6–air mixture at standard conditions. Gaseq line shows the theoretical pressure under constant volume combustion conditions.
The walls were modeled as non-slip, adiabatic, impermeable boundaries. Additional simulations were performed with the discrete ordinates (DO) radiation model activated to account for heat losses. The Planck mean absorption coefficients for radiation modeling for water vapor and carbon dioxide were taken from [37] and implemented into the code. The wall boundary condition for the non-adiabatic case was internal emissivity of value 0.9 (default Fluent value 1.0).
6. Results
The following graphs compare the obtained numerical and experimental results with respect to the vessel size and fuel type. The results have been compared to theoretical calculations of adiabatic constant volume explosions obtained with Gaseq software [38]. Each graph presents the cases with and without heat losses due to the radiation.
The effects of initial burning velocity and thermokinetic index on transient pressure were mentioned in the introduction (Figure 1), along with the uncertainty at the start of propagation of flame after ignition. While the coupled Su0 and ε parameters are responsible for a “curvature” of the pressure–time dependence, the ignition source may simply shift the transient pressure along the x-axis (time) within about 10% for performed tests in [21]. Therefore, it was suggested to process the transient pressure not from initial pressure, p0, but from 1.1p0 [21]. Similarly, in this numerical research, in order to exclude the effect of numerical flame front formation the processing of transient pressure was done not from initial pressure, p0, but from 1.1 p0 [21]. It was a straightforward procedure when the lamped parameters model was applied to process a transient pressure to extract the initial burning velocity and the thermokinetic index by the inverse problem method (because in the lamped parameter model “ignition moment” is exactly “0”).
In the CFD model the “ignition moment” must be corrected in the following way: the numerically simulated dependence of flame radius (level of progress variable c = 0.5) in time has to be shifted to match the theoretical curve , where Er—expansion ratio and t—time, which is definitely valid until the radius of the flame is below 15% of vessel radius [21]. The analysis showed that the results of CFD simulations (both flame radius in time and transient pressure) had to be shifted by around −1.5 ms in the case of the 0.02 m3 vessel and for CH4–air mixtures. The methodology assumed that this shifted simulated pressure curve was used for comparison with experiment. The experimental curve was cut for pressures below 1.1 pi and shifted in the way that the point with experimental pressure 1.1 pi coincided in time with simulated pressure point 1.1 pi at shifted by 1.5 ms simulated curve. This second shift to exclude experimental ignition uncertainty was 12.5 ms making a total shift of 14 ms in the case of CH4–air in 0.02 m3 vessel. The methodology described above was used to process all of the graphs presented in the following sections.
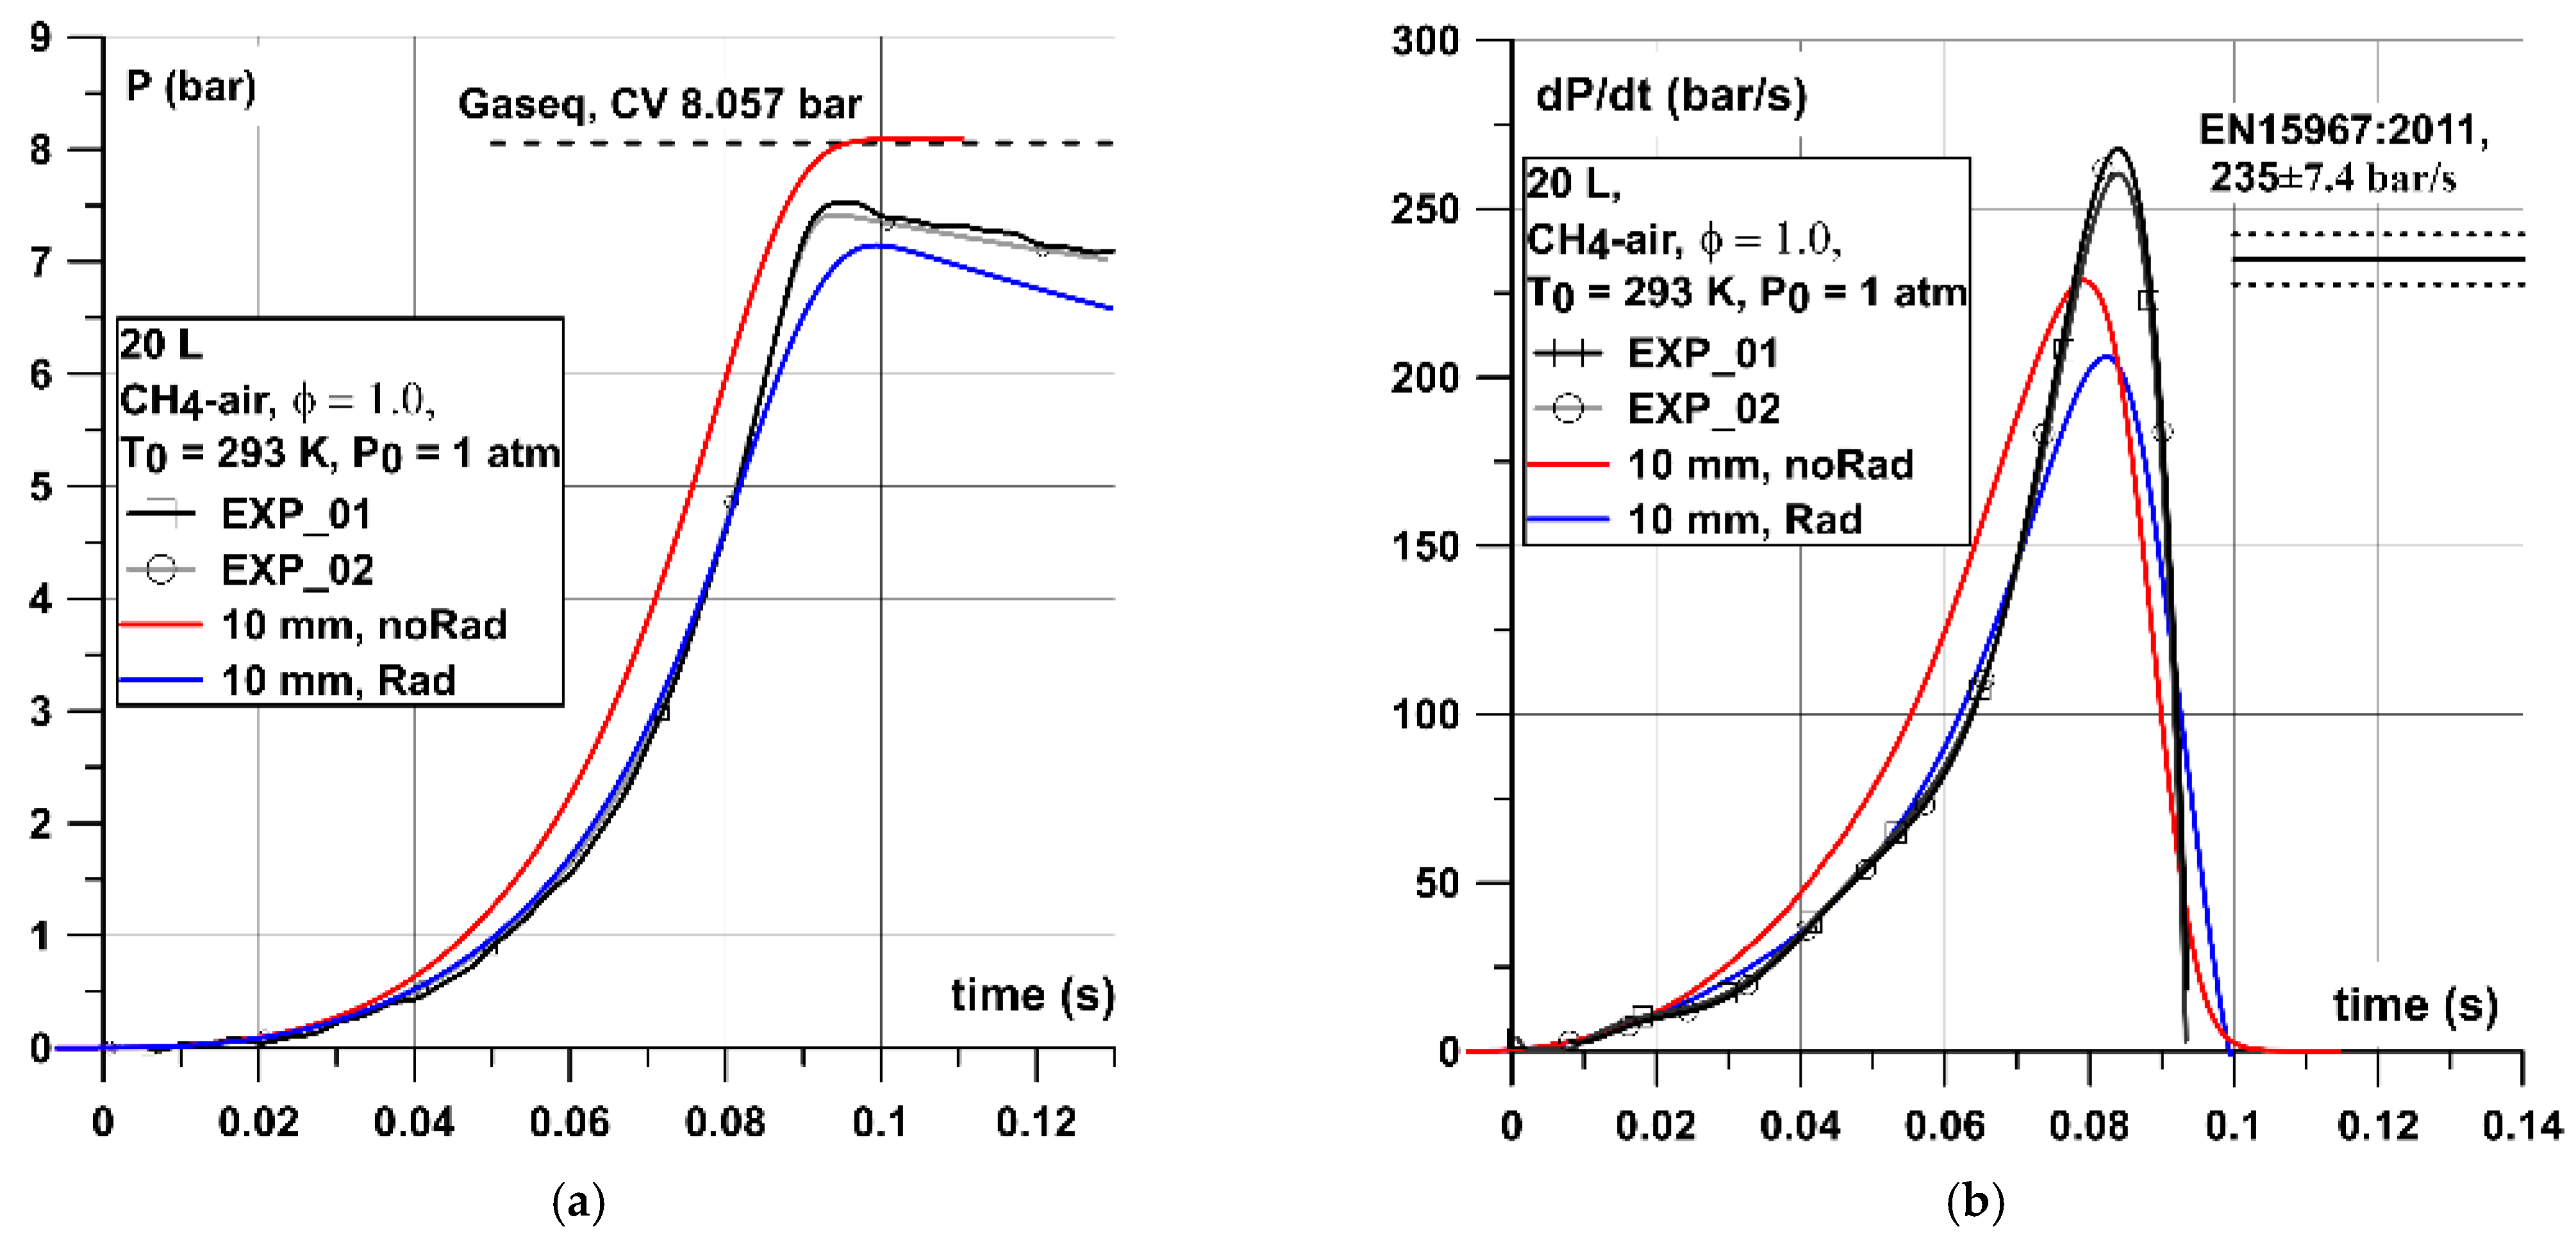
The following graphs show the comparison between experimental and numerical results of pressure and pressure dynamics (dP/dt) for cases with and without radiation in the model. The (dP/dt)max values were often used to assess the explosion severity of particular mixture and to design adequate mitigation techniques, e.g., venting devices. The (dP/dt)max parameter is also provided in standard EN 15,967 for a variety of experimental vessels volume to verify the performance of an experimental apparatus. The (dP/dt)max value provided for methane–air in 20 L sphere at stoichiometric concentration and initial conditions of 25 °C and 0.1 MPa was equal to 235 ± 7.4 bar/s. On each pressure–time graph theoretical value of maximum pressure under constant volume combustion conditions was presented. The match of this theoretical value with simulated one under adiabatic conditions confirmed the correctness of the implemented thermodynamic parameters of the mixture.
6.1. Methane–Air Mixture
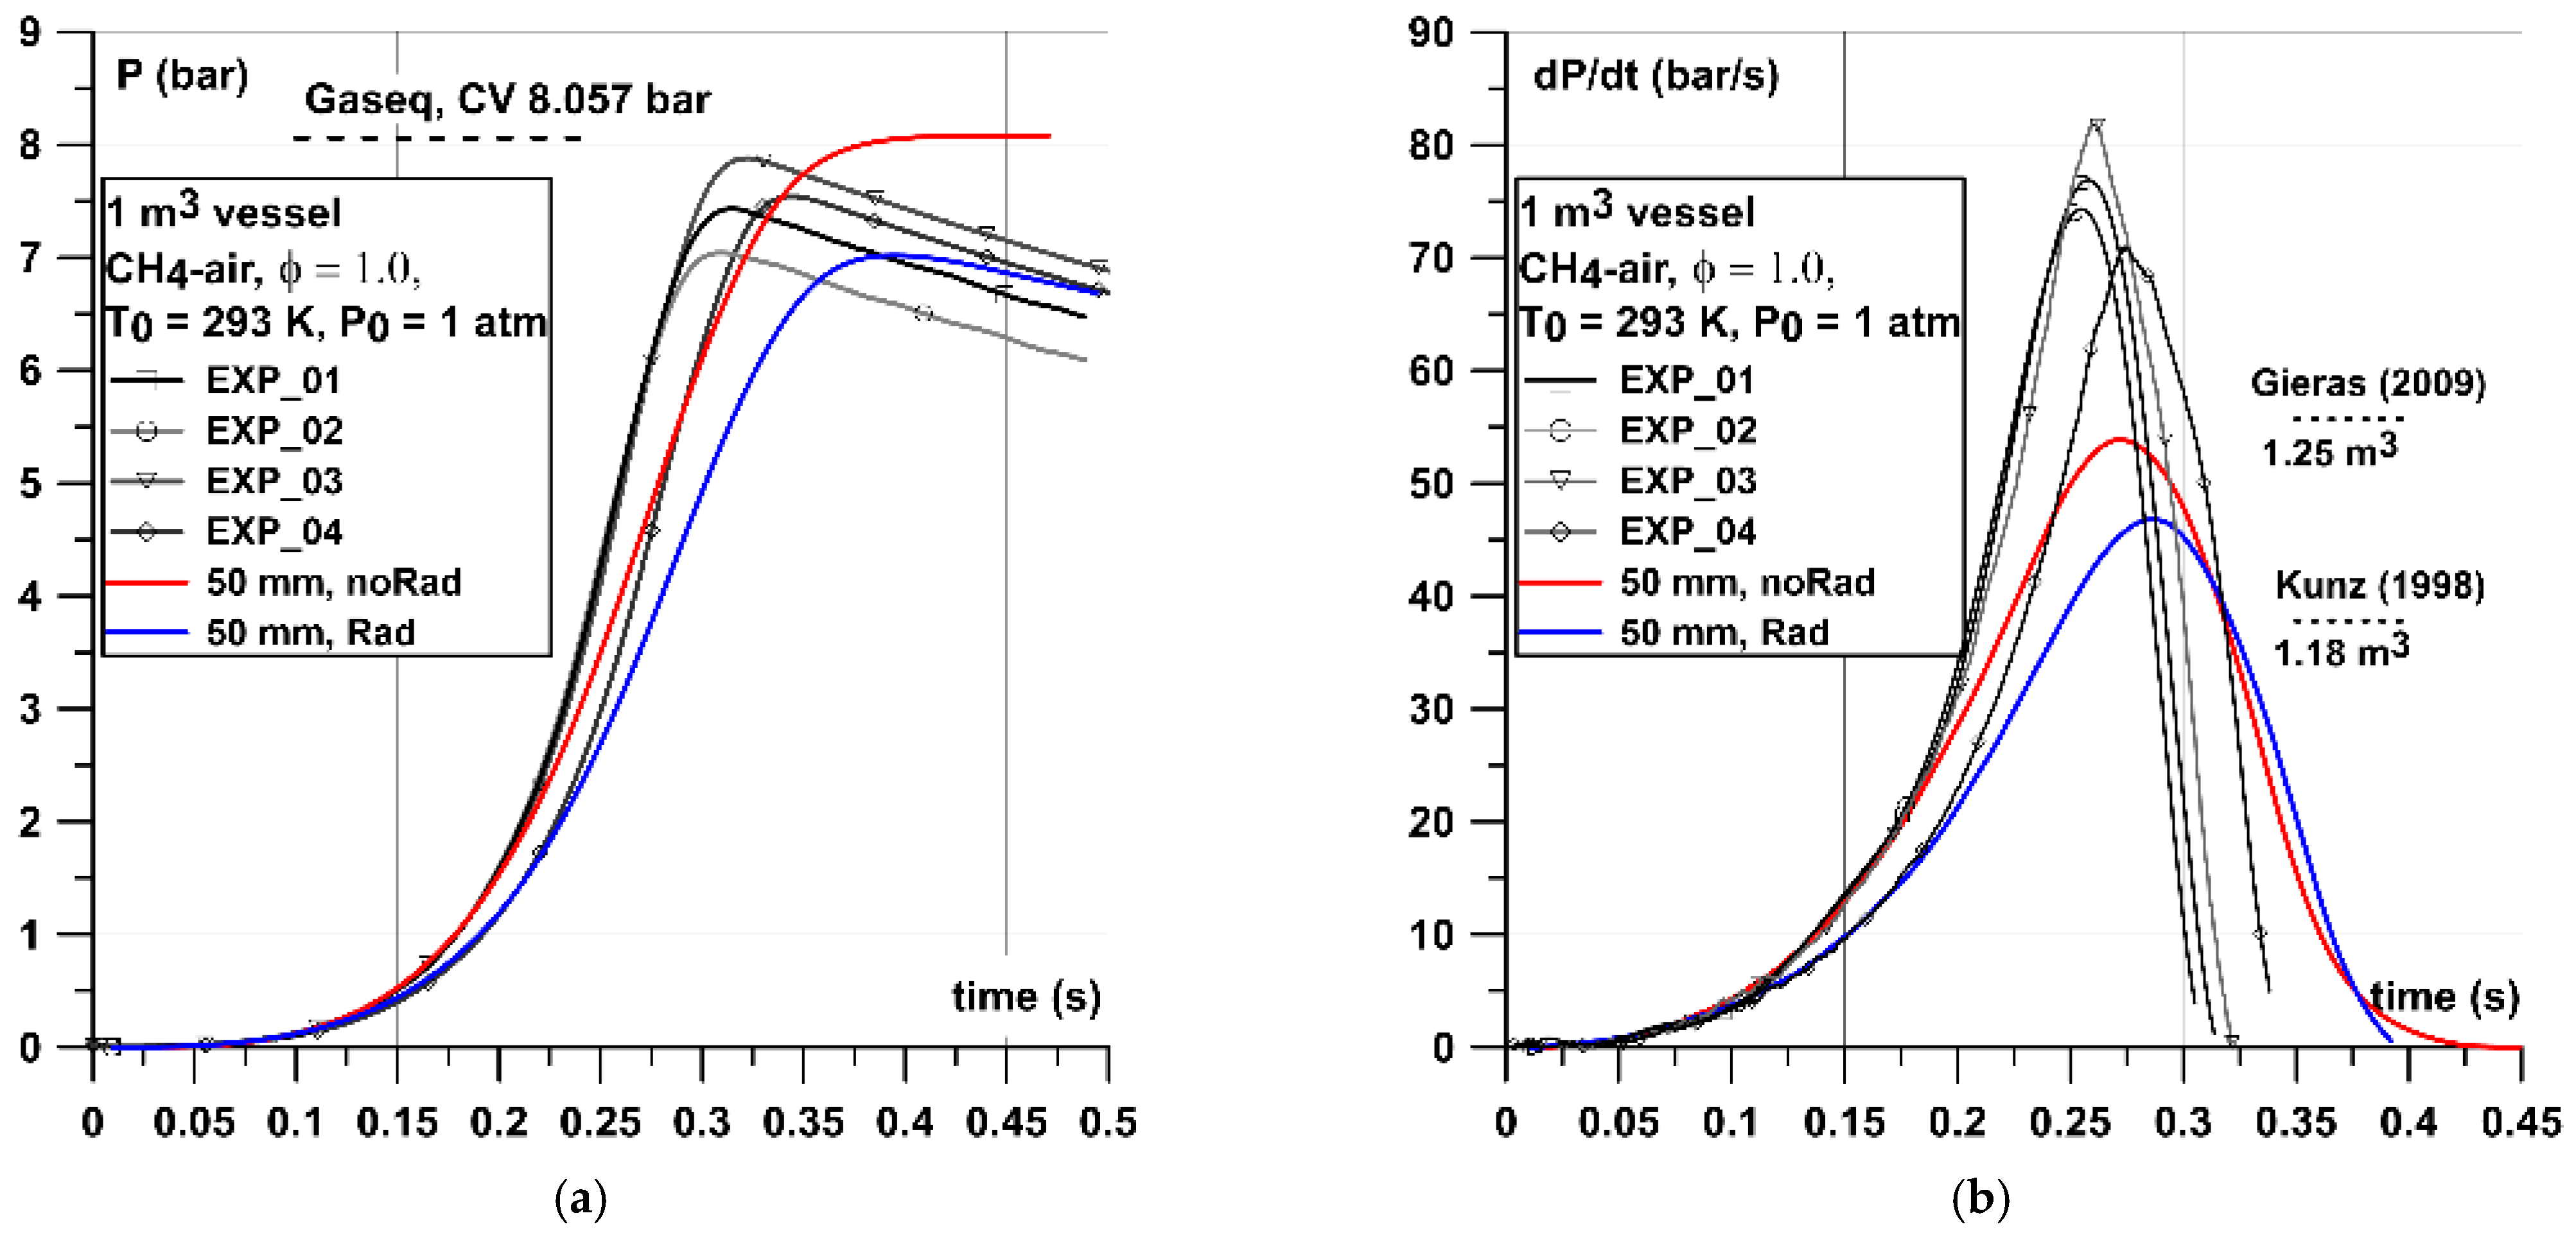
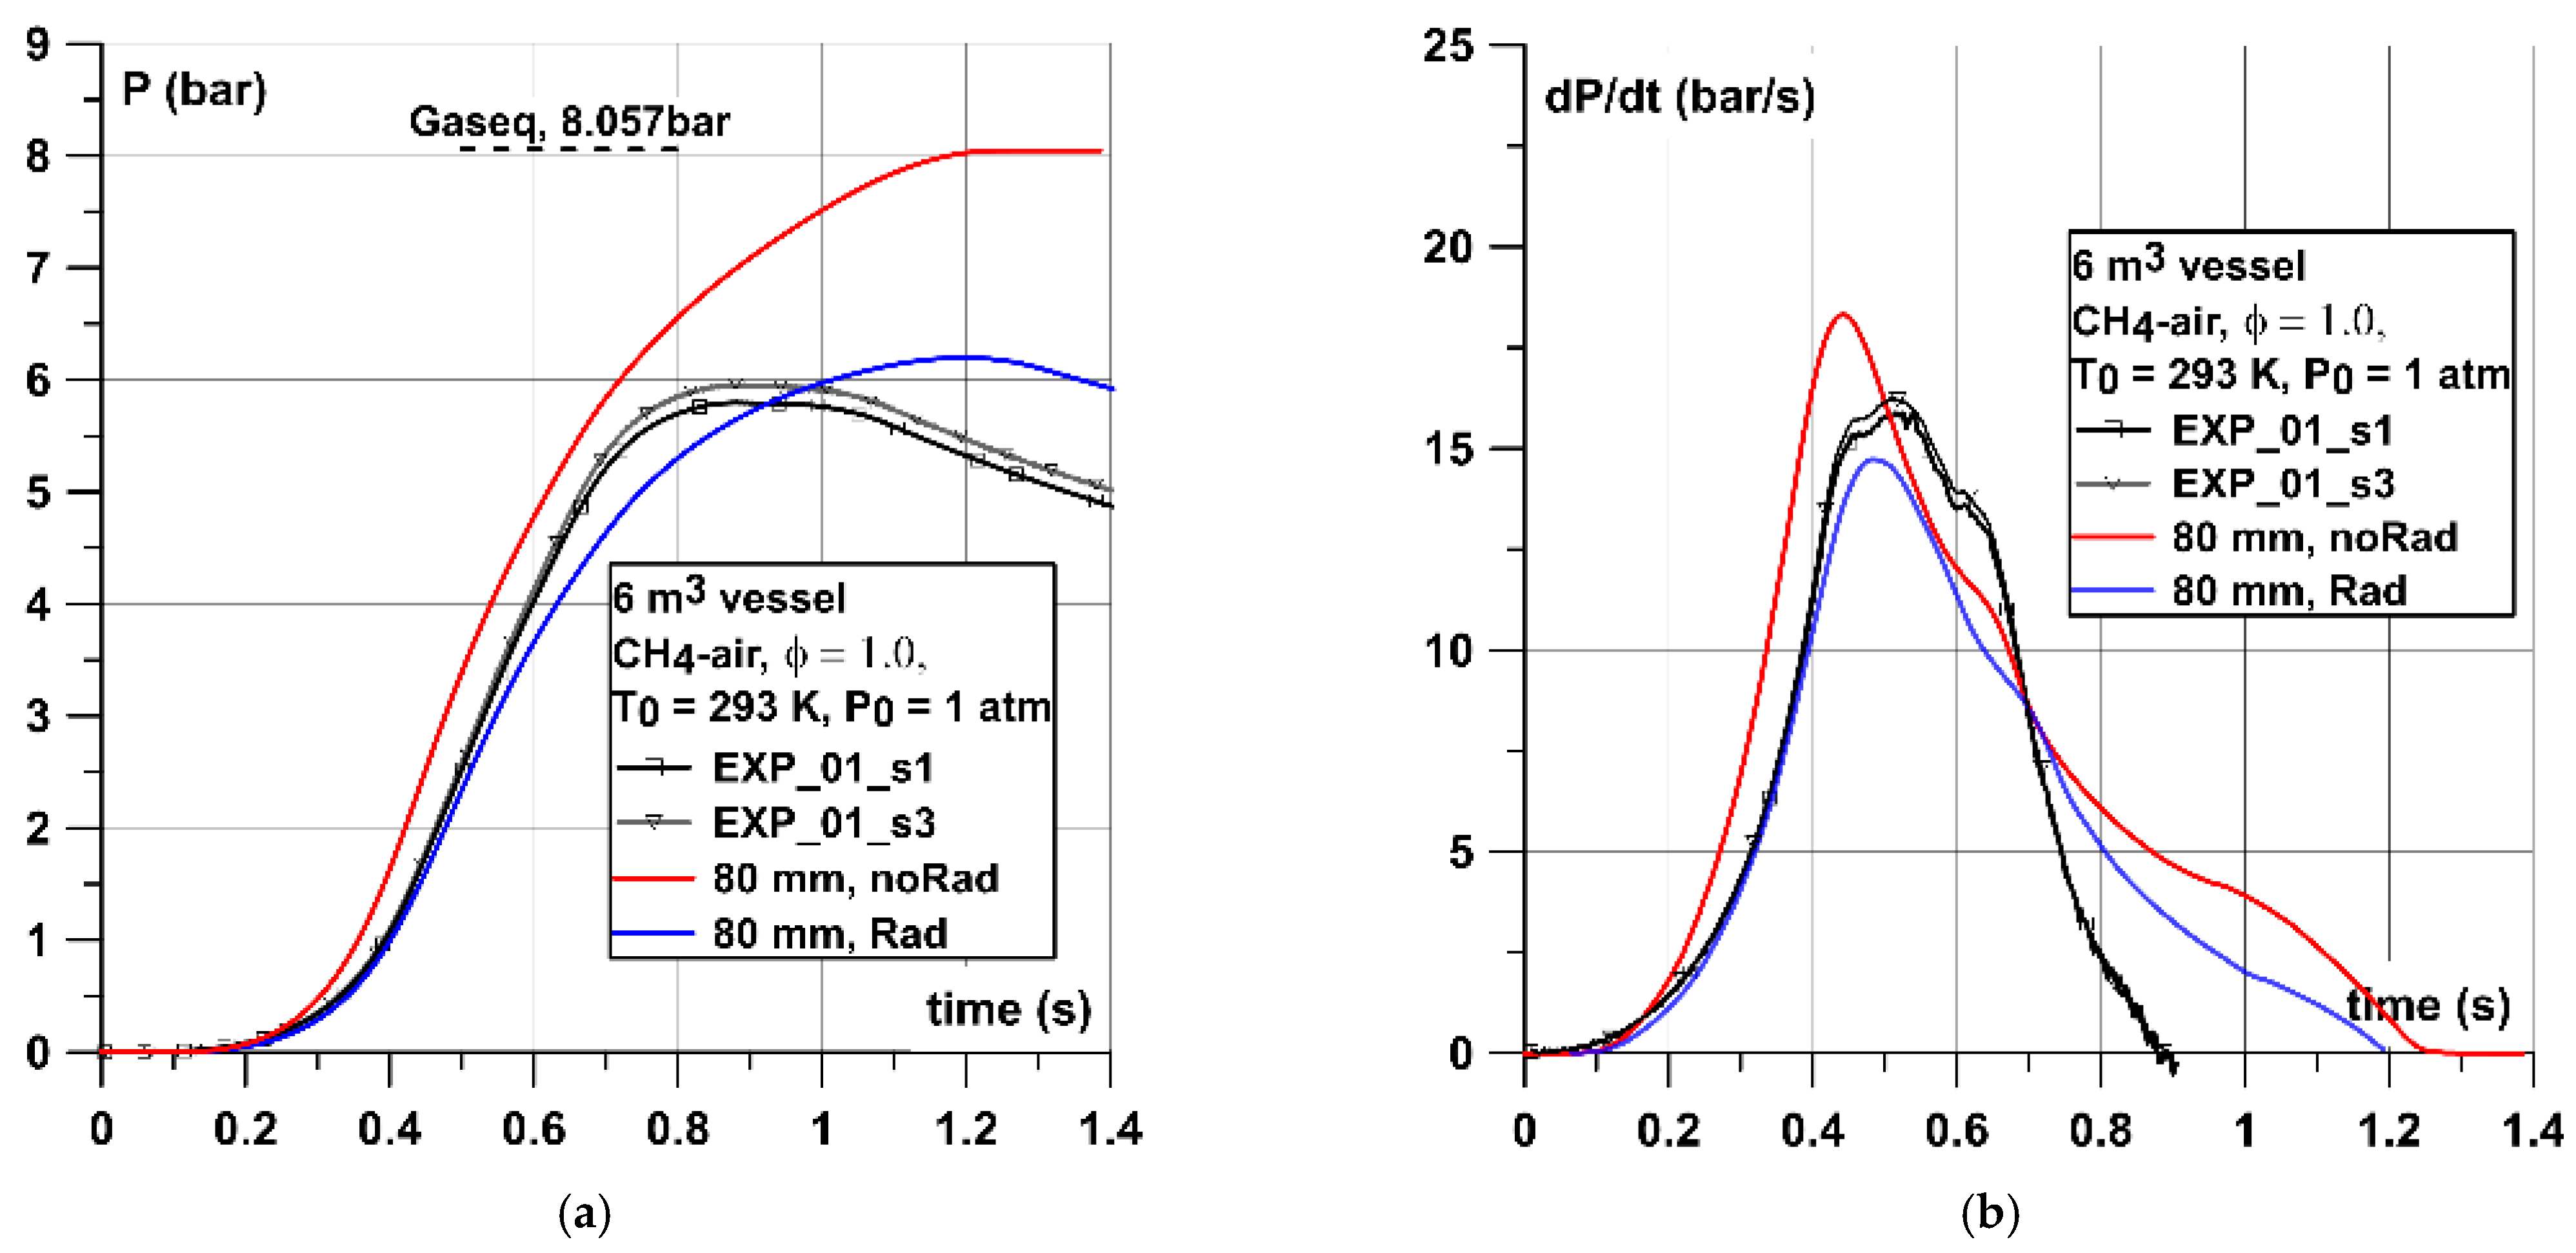
Figure 8, Figure 9 and Figure 10 show the comparison between simulated and experimental pressure–time and dP/dt curves for cases with stoichiometric CH4–air mixtures. In the case of 0.02 m3 vessel (Figure 8) the experimental pressure curve was almost in line with simulated non-adiabatic one. The importance of radiation was visible as the model with radiation slightly underestimates (0.4 bar) the experimental maximum explosion pressure. However, the time to reach Pmax was very close to the experimental one. Some discrepancies close to the maximum pressure peak were due to the vicinity of the walls and higher heat losses than in experiments as the simulated pressure curve decreased faster than the experimental one after reaching the maximum pressure. As regards dP/dt curves both, adiabatic and non-adiabatic simulations underestimated the (dP/dt)max parameter by around 40 and 65 bar/s (15–25%), respectively. As the dP/dt curve was generated by differentiation of the P(t), it will express all the differences in pressure dynamics built-up. However, the numerical (dP/dt)max (206 bar/s) underestimated only slightly the value provided in European standard EN 15,967 of 235 ± 7.4 bar/s.
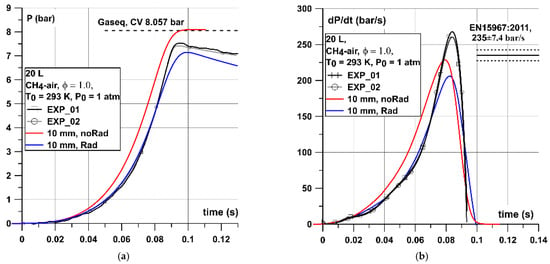
Figure 8.
(a) Pressure and (b) dP/dt graphs for stoichiometric CH4–air mixture in the 0.02 m3 vessel.
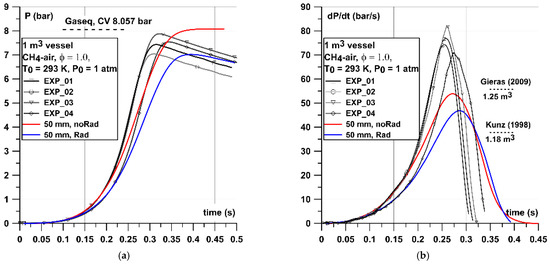
Figure 9.
(a) Pressure and (b) dP/dt graphs for stoichiometric CH4–air mixture in the 1 m3 vessel. Dotted lines mark (dp/dt)max values provided by Gieras [39] and Kunz [40] in the vessels of a similar volume and shape.
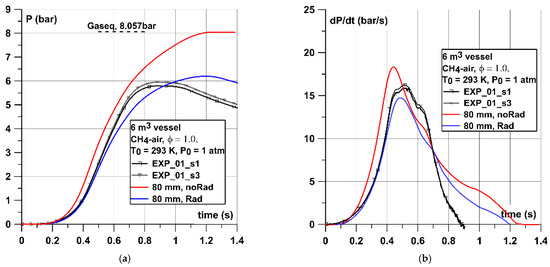
Figure 10.
(a) Pressure and (b) dP/dt graphs for stoichiometric CH4–air mixture in 6 m3 vessel. Grey lines show the experimental pressures recorded.
Comparing the experimental pressure histories with simulated ones in a 1 m3 vessel (Figure 9) is somehow different than in the 0.02 m3 case. The simulated pressure did not follow the experimental curve so well and underestimates the (dP/dt)max by around 30–35 bar/s (30–40%). However, the comparison with (dp/dt)max provided by Gieras [39] and Kunz [40] in vessels of similar volume and shape were very close to the value obtained numerically. Experiments shown in Figure 9 also show some discrepancies between maximum pressures achieved Pmax between 7.0 and 7.93 bar and this range was very close to the values recorded by both simulations (7.0–8.06 bar).
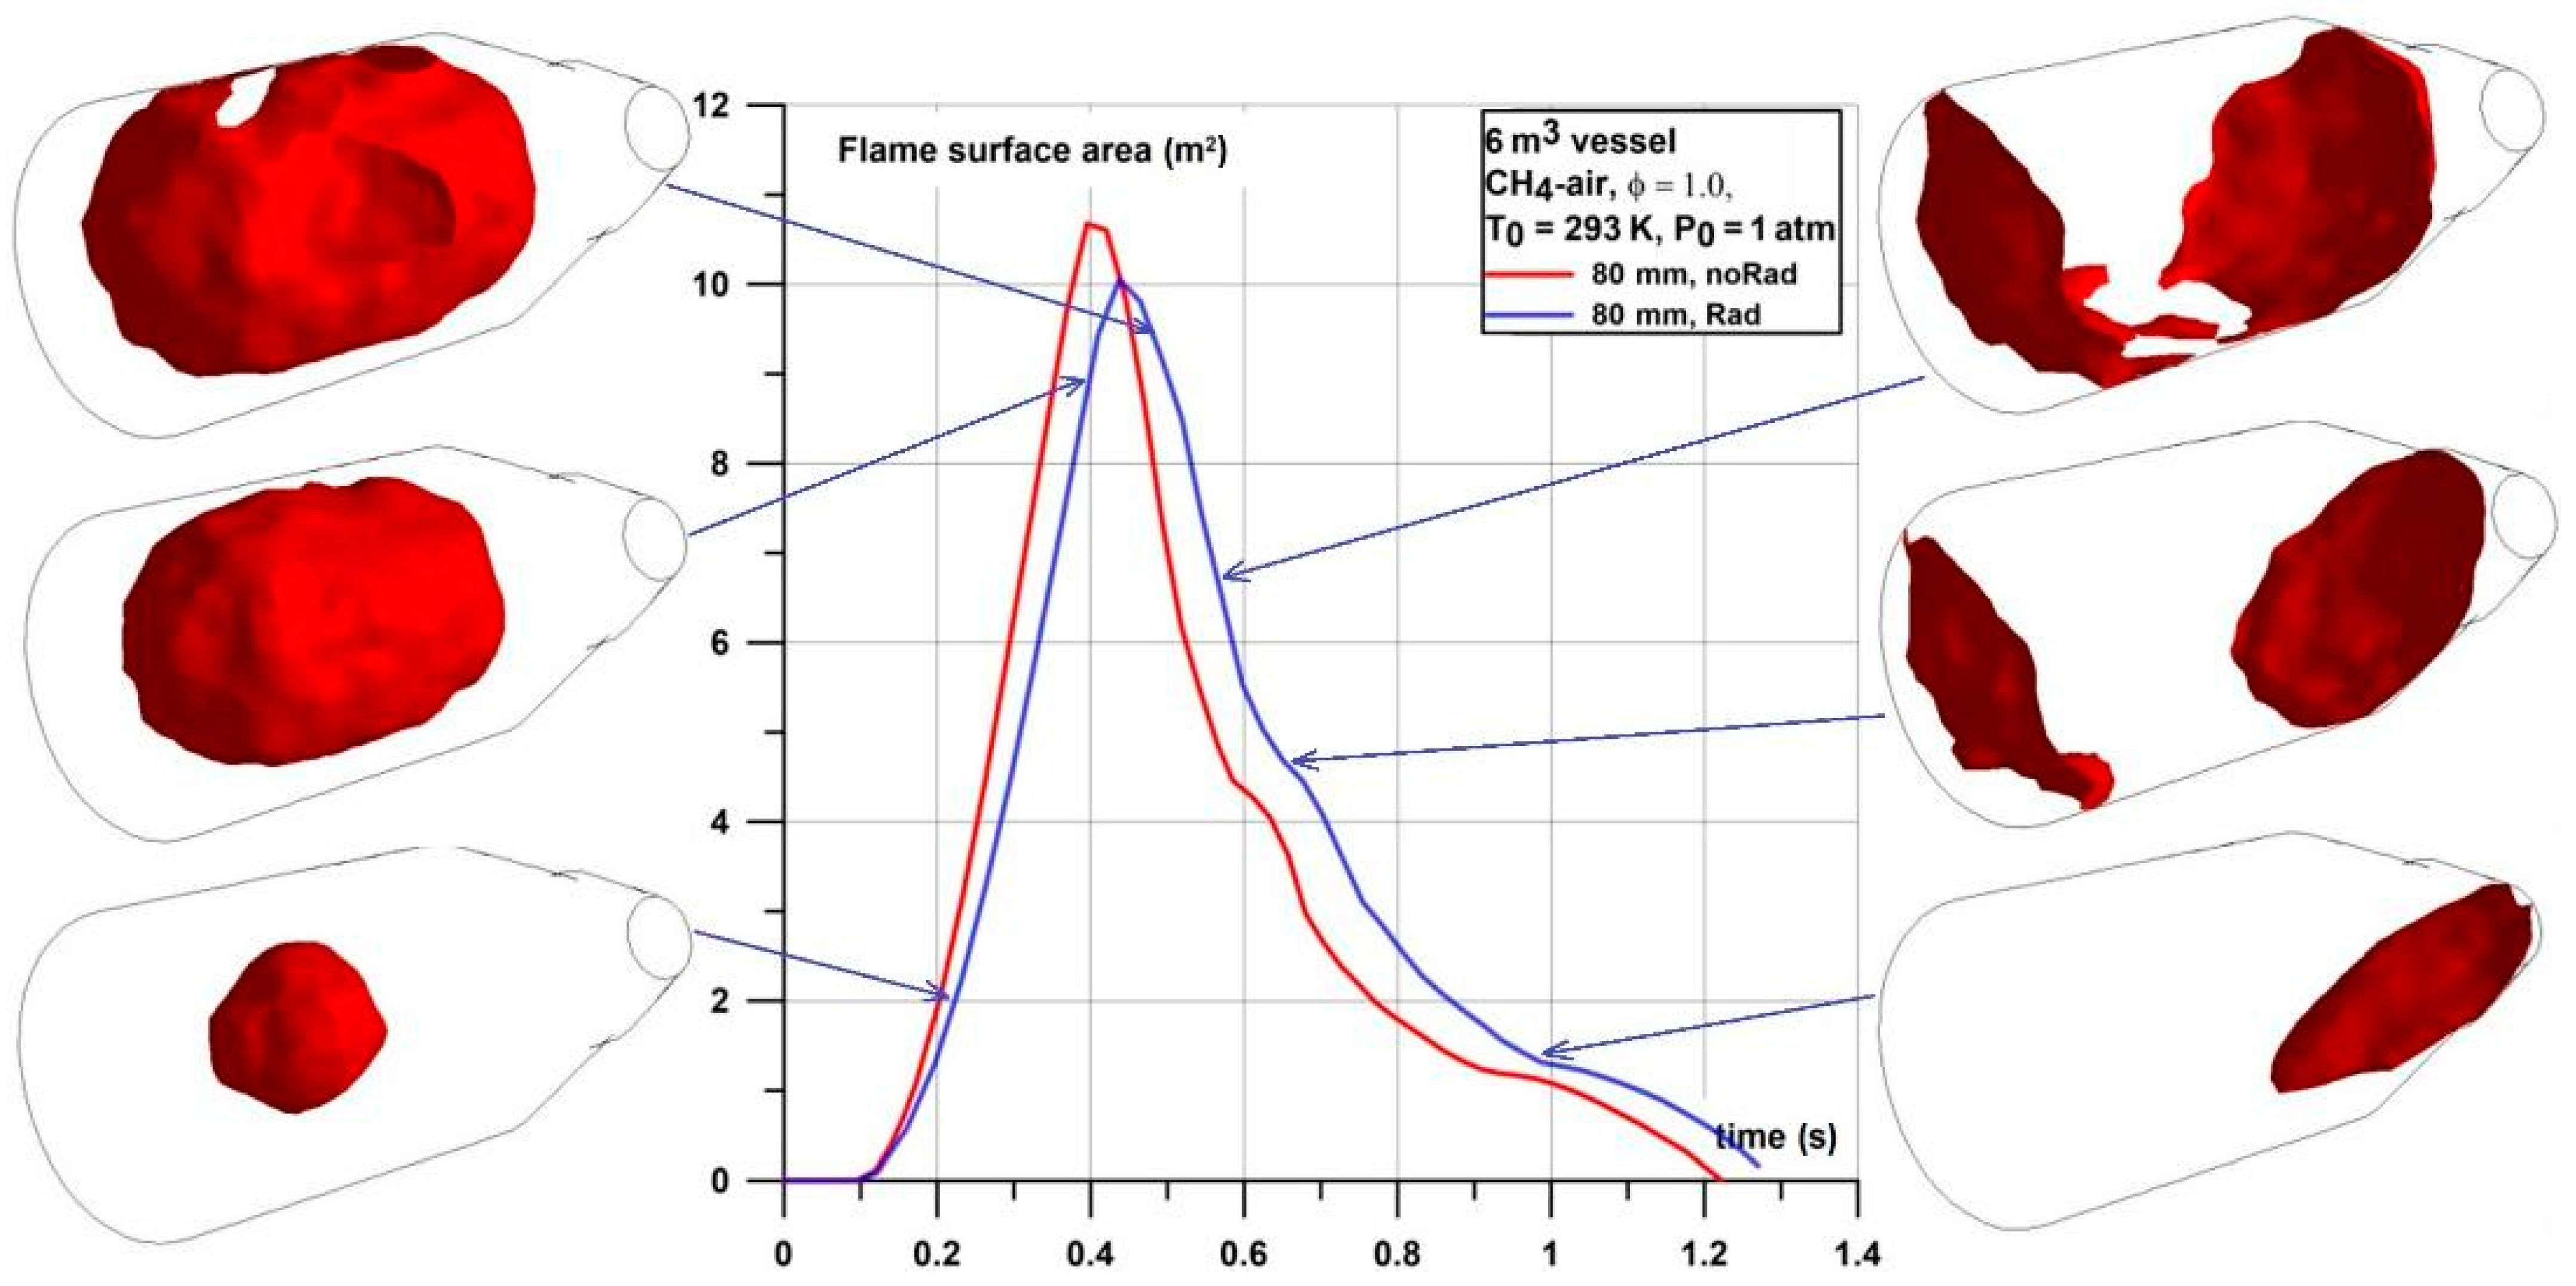
In the case of the 6 m3 vessel (Figure 10) one can observe high influence of the vessel geometry on the recorded pressures in both simulation and experiments. Firstly, in the experiment the pressure increased progressively to around 2–3 bar (until 0.45 s) and the slope stabilized at the relatively constant level of 15 bar/s (and lasts until around 0.65 s) represented by the plateau in the dP/dt graph. This layout of the pressure curve was observed independently on the flammable mixture investigated. As the dP/dt curve delivered the information about the pressure dynamics, a relatively constant value at the plateau means that the increase of the pressure was due to the relatively constant mixture consumption by the flame. An additional analysis was performed of the flame front development for this geometrical case. Details of the flame front area development at the selected times of simulations are shown in Figure 11. The flame front area was calculated as the area of iso-surface of progress variable equal to 0.5. The analysis shows that the flame front area development curve defines the dP/dt curve. Initially, flame propagates as a spherical shape but due to an interaction of pressure waves with the vessel geometry it transforms into an ellipsoidal shape. Shortly after the flame reaches the upper vessel wall the dP/dt curve reaches maximum. The following drop in flame area is due to contact with vessel walls that prevents further development of the flame area, moreover the flame is quenched by the walls. The buoyancy is observed at that time the flame does not touch the bottom wall of the vessel. In the time range 0.42–0.5 s the flame is stopped and quenched by walls and subsequently the flame transformed into two separate zones with flame propagating in the opposite directions through the unburned mixture. Then, flame surfaces start to tilt due to the buoyancy effect with respect to the horizontal direction and starts to quench at around 0.8 s at the semispherical surface of the vessel. Flame area in the narrower conical shape part of the vessel starts to tilt even more and propagates almost vertically downwards at the time of around 1.0 s. Finally, the flame quenches totally at the time of around 1.17 s or 1.25 s for cases with and without radiation model activated, respectively.
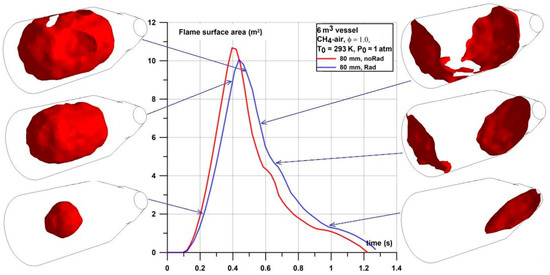
Figure 11.
Flame surface area development curve with flame surface (iso-surface of progress variable of value 0.5) at selected times.
Simulations of CH4–air combustion in closed vessels showed that the implemented model predicts the pressure history and pressure dynamics curve with the acceptable level of accuracy. Adiabatic simulations predict properly the theoretical Pmax values, which indicated that heat losses are negligible in the considered case. Non-adiabatic simulations slightly underestimated the Pmax in the case of 0.02 and 1 m3 vessels. However, in the case of a 1 m3 vessel experimental Pmax are within the range of 7–8 bar, which is very close to the range bounded by simulated adiabatic and non-adiabatic Pmax. Parameter (dp/dt)max from simulations in 0.02 m3 is lower than experimental but very close to the value provided in European standard EN 15,967 of 235 ± 7.4 bar/s. In case of 1 m3 simulated (dp/dt)max was underestimated by around 30–40% with respect to the experimental value but within the range of (dp/dt)max provided by Gieras [39] and Kunz [40] in vessels of similar volume and shape. Combustion in a 6 m3 vessel shows high influence of the vessel geometry on the recorded pressures in both simulations and experiments. Non-adiabatic simulations predicted properly the experimental value of Pmax and (dp/dt)max. However, the time to reach Pmax was around 0.3 s longer in simulations than in the experiment. The simulated dP/dt curve was well represented up to the time to reach (dp/dt)max and further dP/dt curve shows a qualitatively good agreement. Additional analysis shows that the flame front area development curve defines the dP/dt curve.
6.2. Ethane–Air Mixture
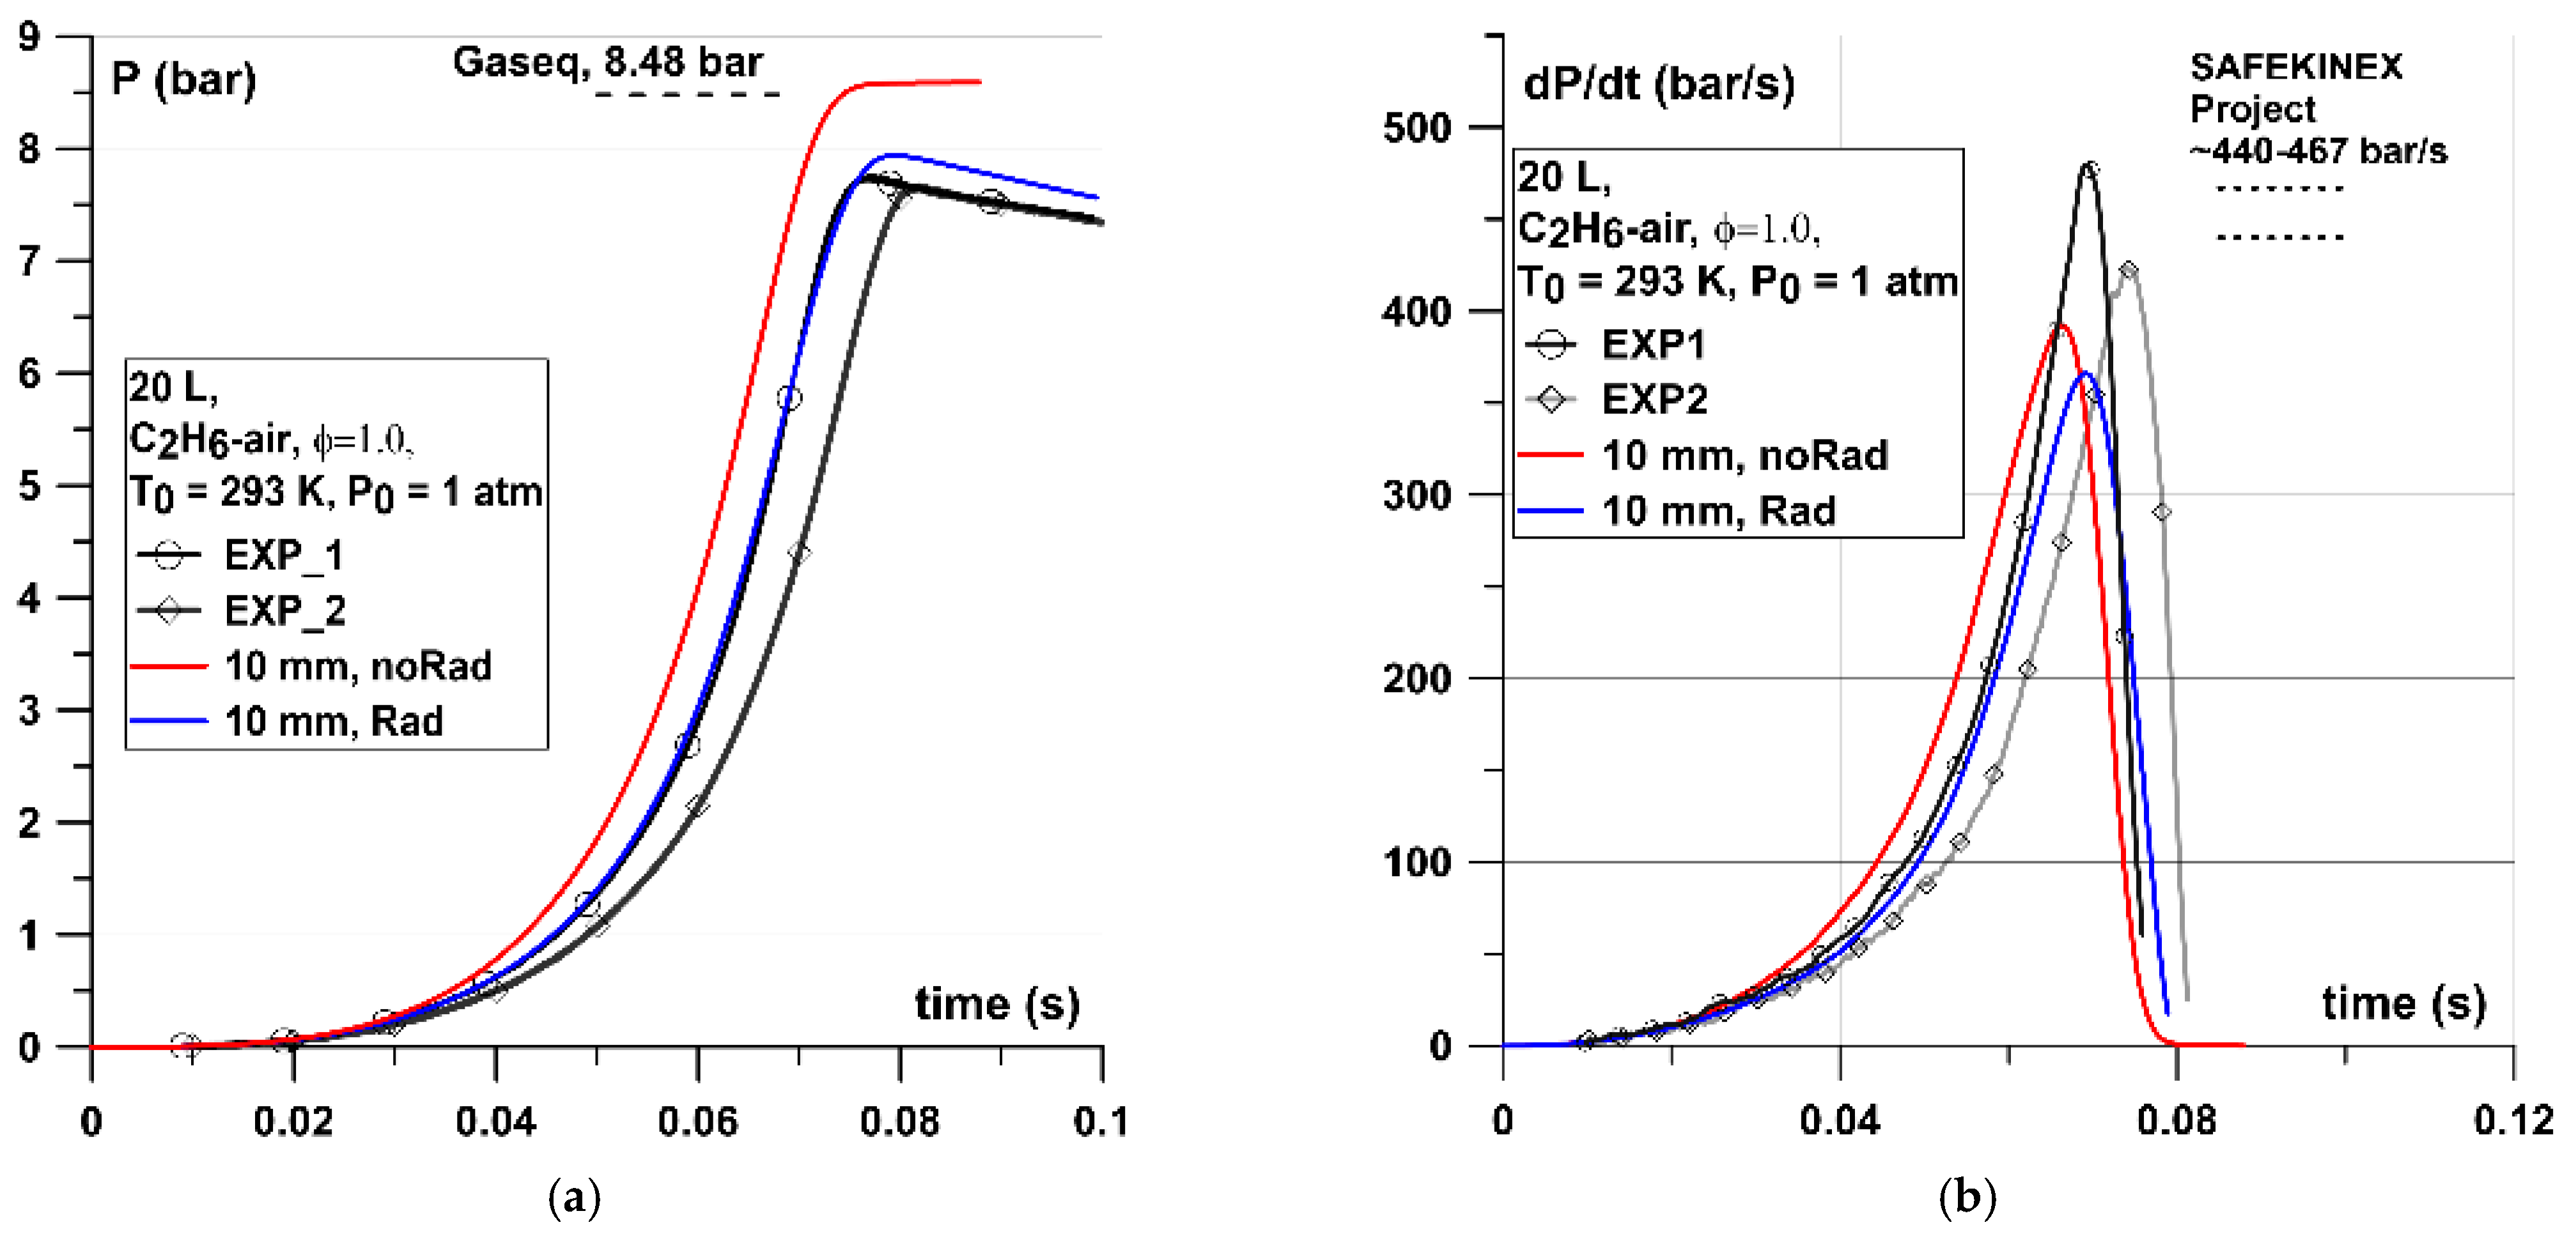
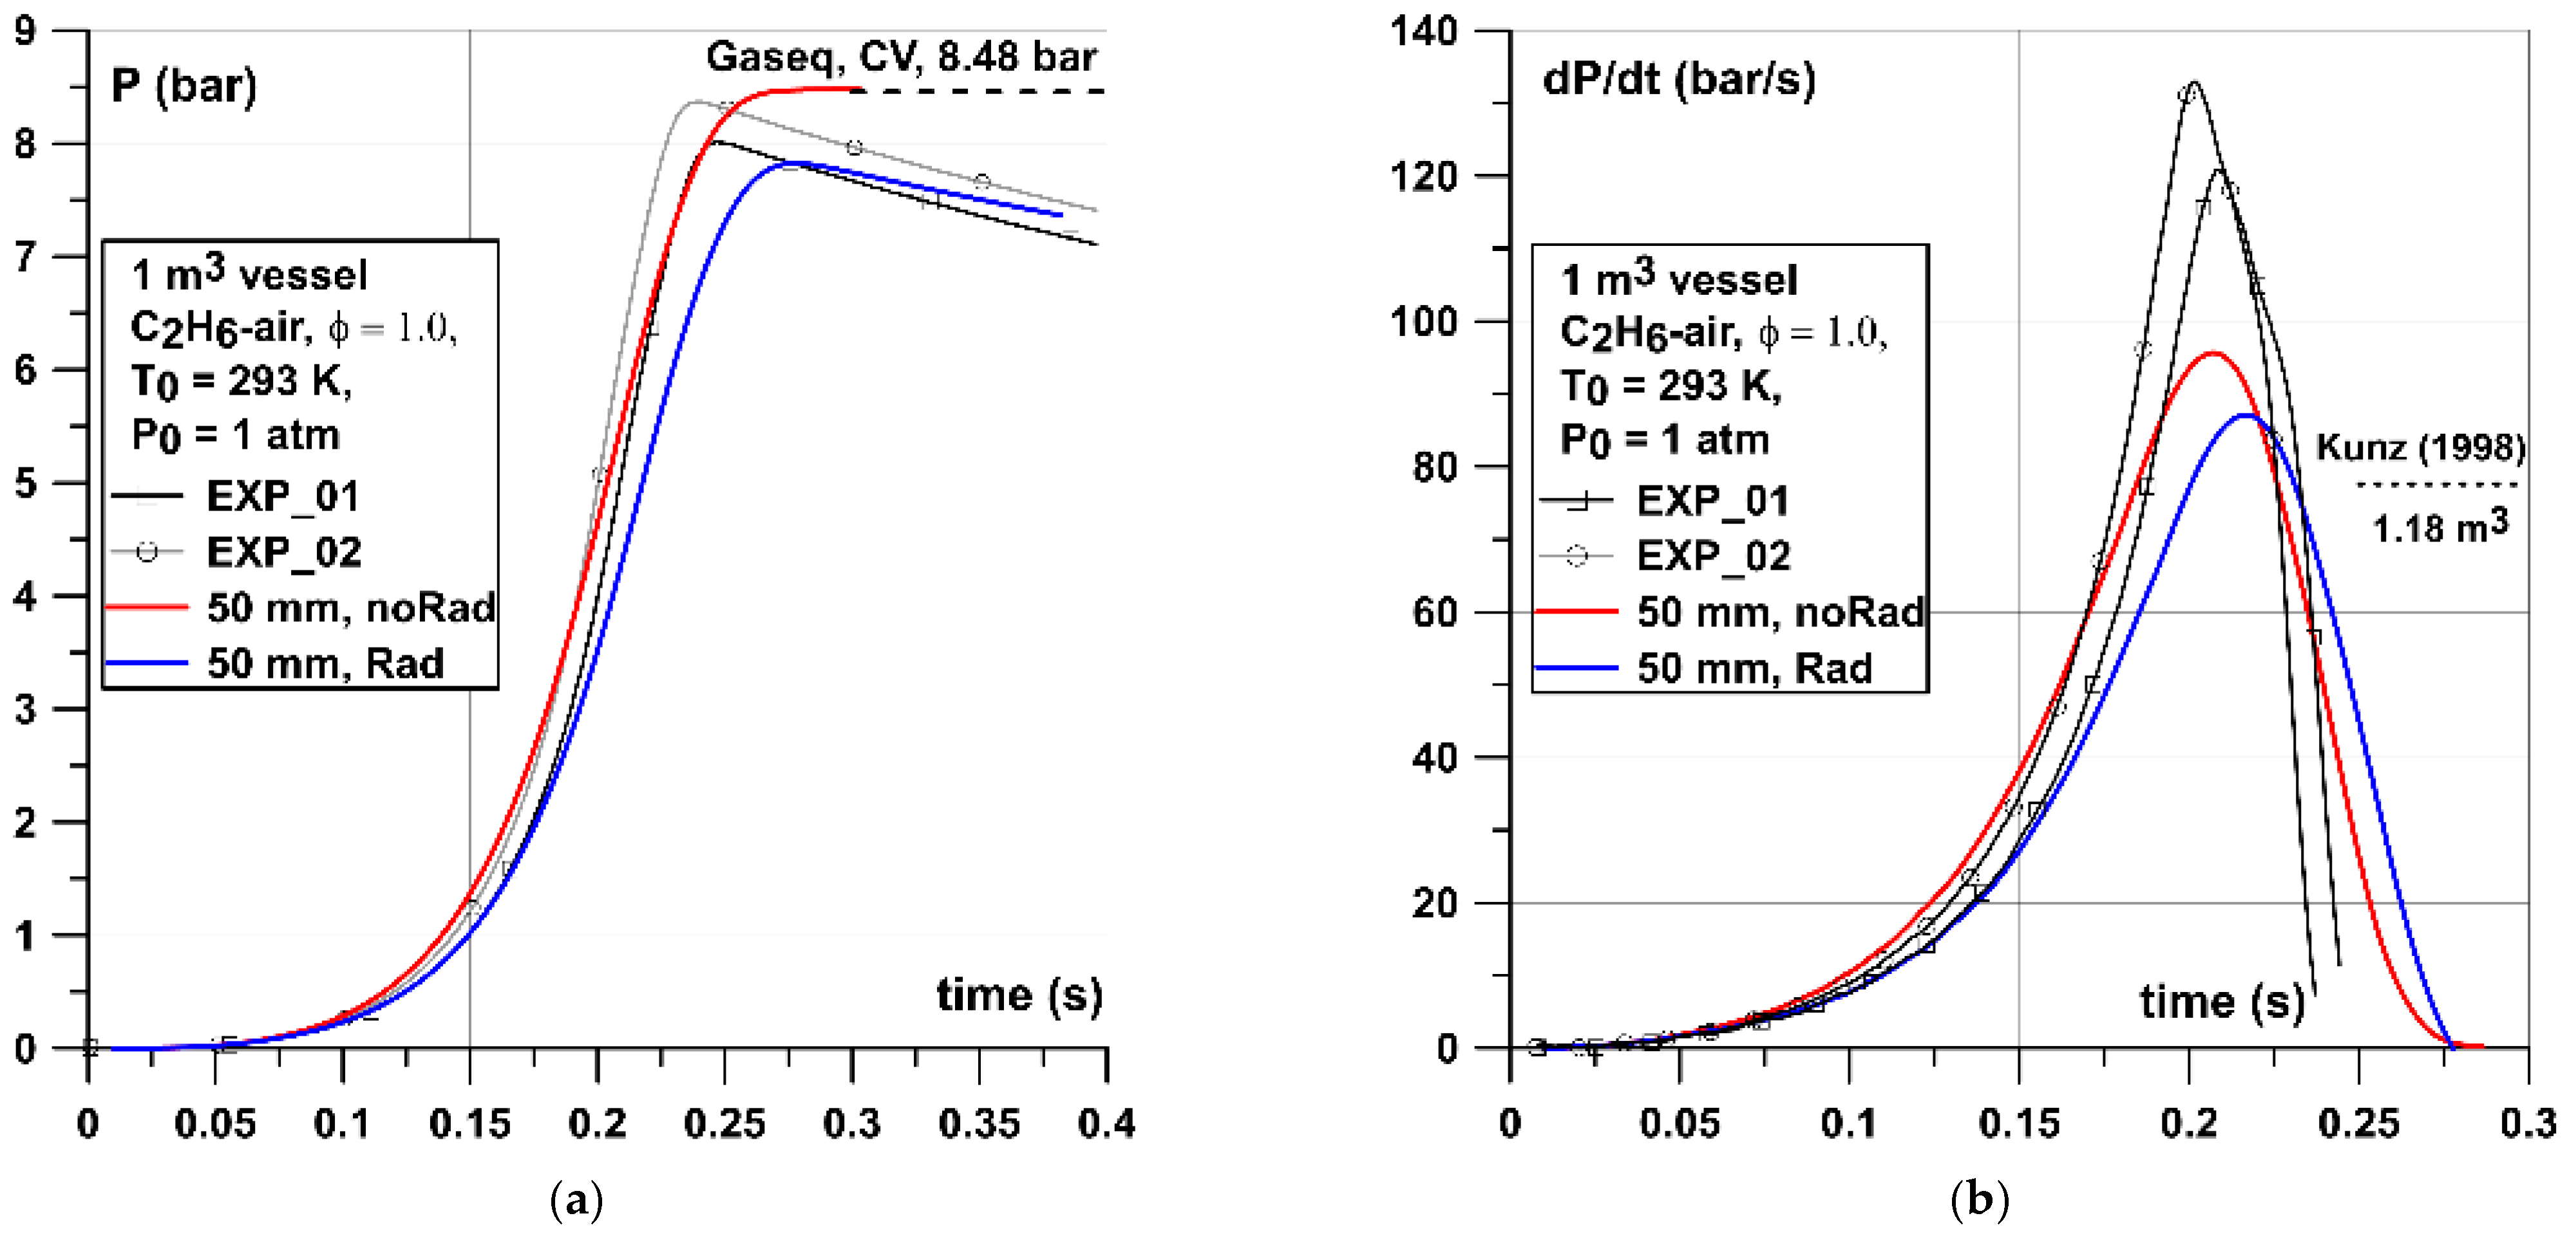
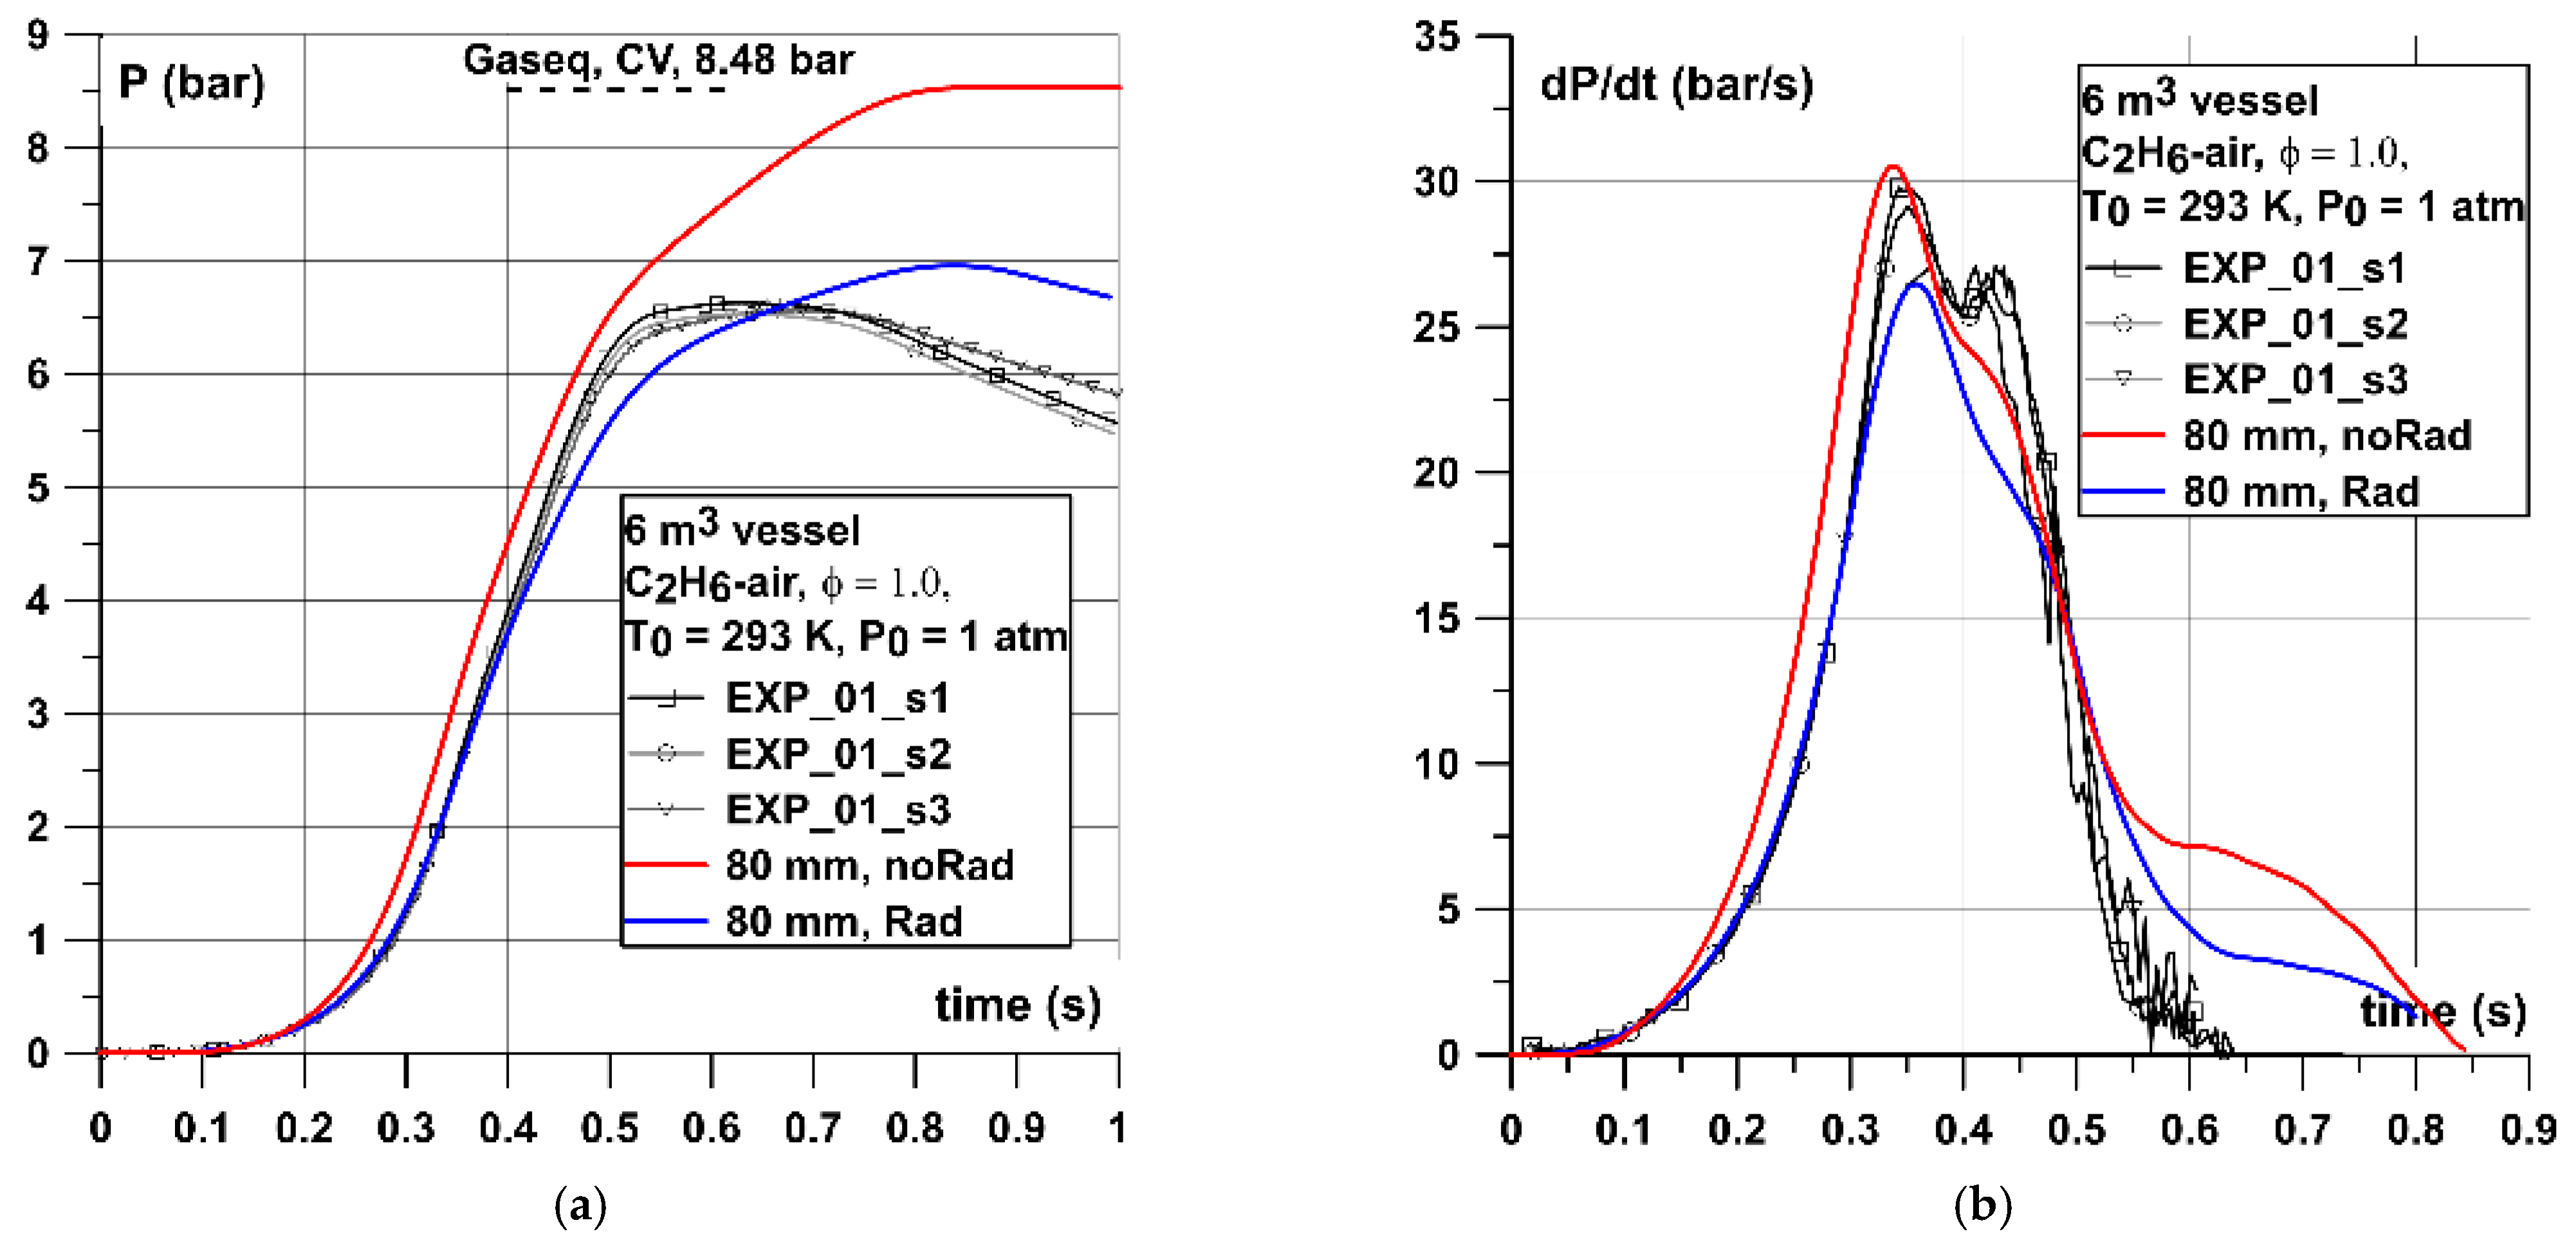
Figure 12, Figure 13 and Figure 14 show the comparison between simulated and experimental pressure–time and dP/dt curves for cases with stoichiometric C2H6–air mixtures. In the case of a 0.02 m3 vessel (Figure 12) the simulated non-adiabatic case almost overlapped with experimental pressure curve. The difference between maximum pressures obtained was around 0.25 bar. The following simulated pressure line slope was also very close to the experimental one. As regards dP/dt curves both adiabatic and non-adiabatic simulations underestimated the (dP/dt)max parameter by around 50 and 80 bar/s (10–17%), respectively. However, two experimental (dP/dt)max values differed between themselves by around 60 bar/s. The (dP/dt)max values available from SAFEKINEX project [41] are within the range of 440–467 bar/s, which was close to the experimental values presented here (420–475 bar/s) and these two values were higher than delivered by simulations (360–390 bar/s). The numerical underestimation of (dP/dt)max value was caused by the fact that this value was obtained at the pressures in the vessel of around 7 bar when the unburned mixture was compressed in the thin layer very close to the walls where influence of the wall was observed. For the 1 m3 vessel (Figure 13) the simulated curve was also very close to the experimental one up to the pressure of around 4 bar and with similar underestimation of (dP/dt)max of around 30–35 bar/s (30–40%) as in the case of the CH4–air mixture but only slightly higher than obtained by Kunz [40] in the vessel of a similar volume. Simulation of combustion in the 6 m3 vessel (Figure 14) gave a similar curve shape as in the case of CH4–air with similar characteristic points at the P(t) and dP/dt curve. The non-adiabatic numerical case shows only slight overestimation of the Pmax by around 0.5 bar. However, the dP/dt curve and (dP/dt) max both for adiabatic and non-adiabatic case were very close to the curves observed experimentally. Additionally, experimental dP/dt curve shows a second peak at the time of around 0.45 s. At the same time numerical dP/dt curve shows a distinct lower drop rate.
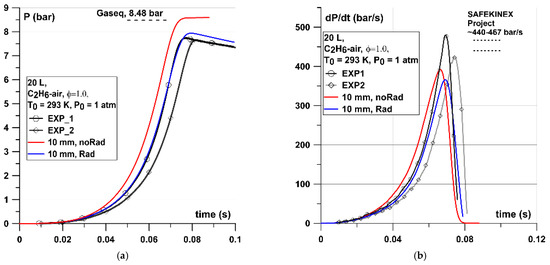
Figure 12.
(a) Pressure and (b) dP/dt graphs for stoichiometric C2H6–air mixture in the 0.02 m3 vessel.
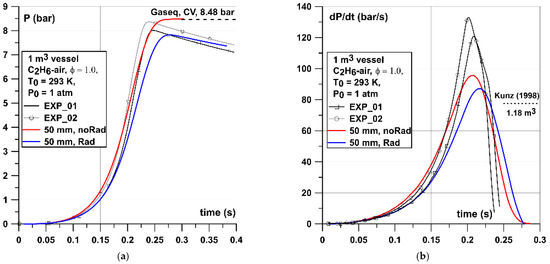
Figure 13.
(a) Pressure and (b) dP/dt graphs for stoichiometric C2 H6–air mixture in the 1 m3 vessel. Dotted line mark (dp/dt)max value provided by Kunz [40] in the vessel of a similar volume and shape.
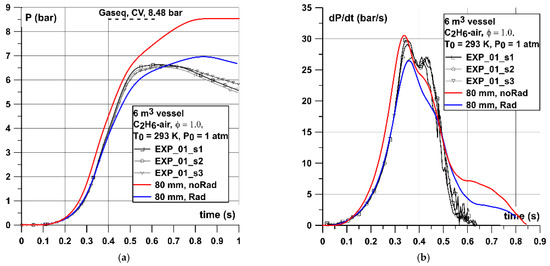
Figure 14.
(a) Pressure and (b) dP/dt graphs for stoichiometric C2H6–air mixture in the 6 m3 vessel.
Simulations of C2H6–air combustion in closed vessels showed that the implemented model predicted the pressure history and pressure dynamics curve with the acceptable level of accuracy. Adiabatic simulations predicted properly the theoretical Pmax values. Non-adiabatic simulations well represent the experimental P(t) curve but slightly (0.2 bar) overestimated the Pmax in 0.02 m3, underestimated (0.25 bar) in 1 m3, and overestimated (0.4 bar) in the 6 m3 vessel. Additionally, in the case of the 1 m3 vessel experimental Pmax were within the range of 8–8.4 bar, which was very close to the range bounded by simulated adiabatic and non-adiabatic Pmax of 7.8–8.48 bar. Parameter (dp/dt)max from simulations in 0.02 m3 was underestimated by around 10–17% but the dP/dt curve was qualitatively well represented. In the case of 1 m3 simulated (dp/dt)max was underestimated by around 30–40% with respect to the experimental value but close to the value provided by Kunz [40] in a vessel of similar volume. Combustion in the 6 m3 vessel show high influence of the vessel geometry on the recorded pressures in both simulations and experiments similarly as in the case of the CH4–air mixture. Non-adiabatic simulations only slightly overestimated the experimental Pmax and simulated (dp/dt) max value of 26.5 bar/s was very close to the experimental one (27–29 bar/s). Additionally, the simulated non-adiabatic dP/dt curve was almost in line with the experimental one up to the (dp/dt)max. Further flame propagation was highly influenced by the walls and the dP/dt curve shows similar characteristic points as experimental one, similarly as in case of simulation of CH4–air.
6.3. Propane–Air Mixture
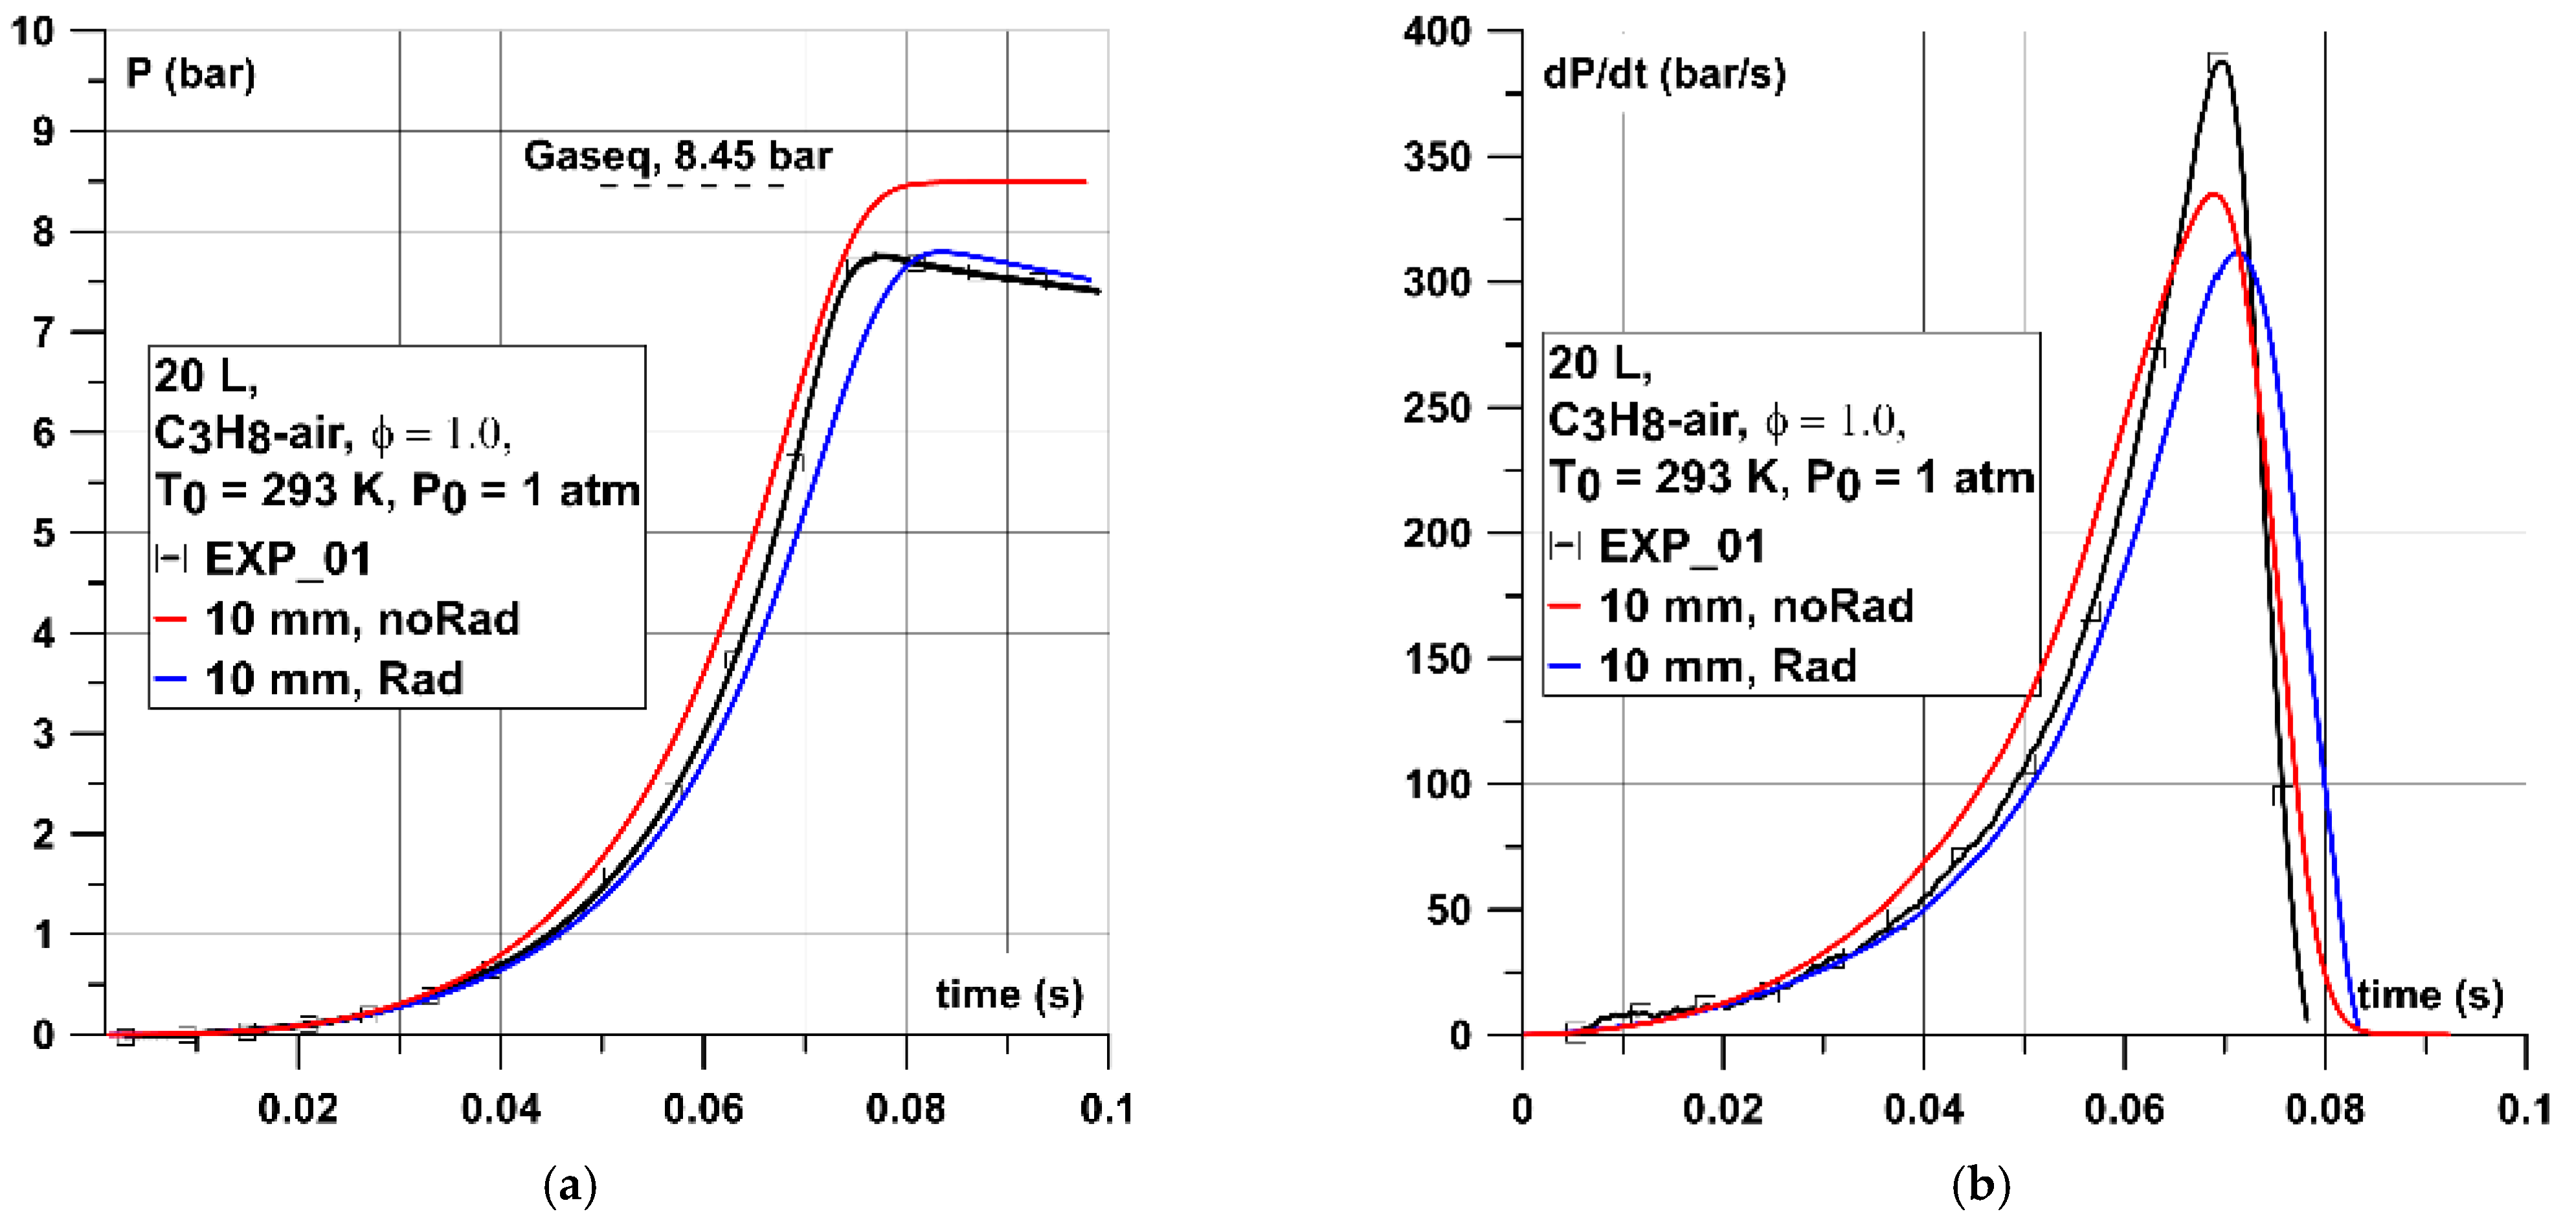
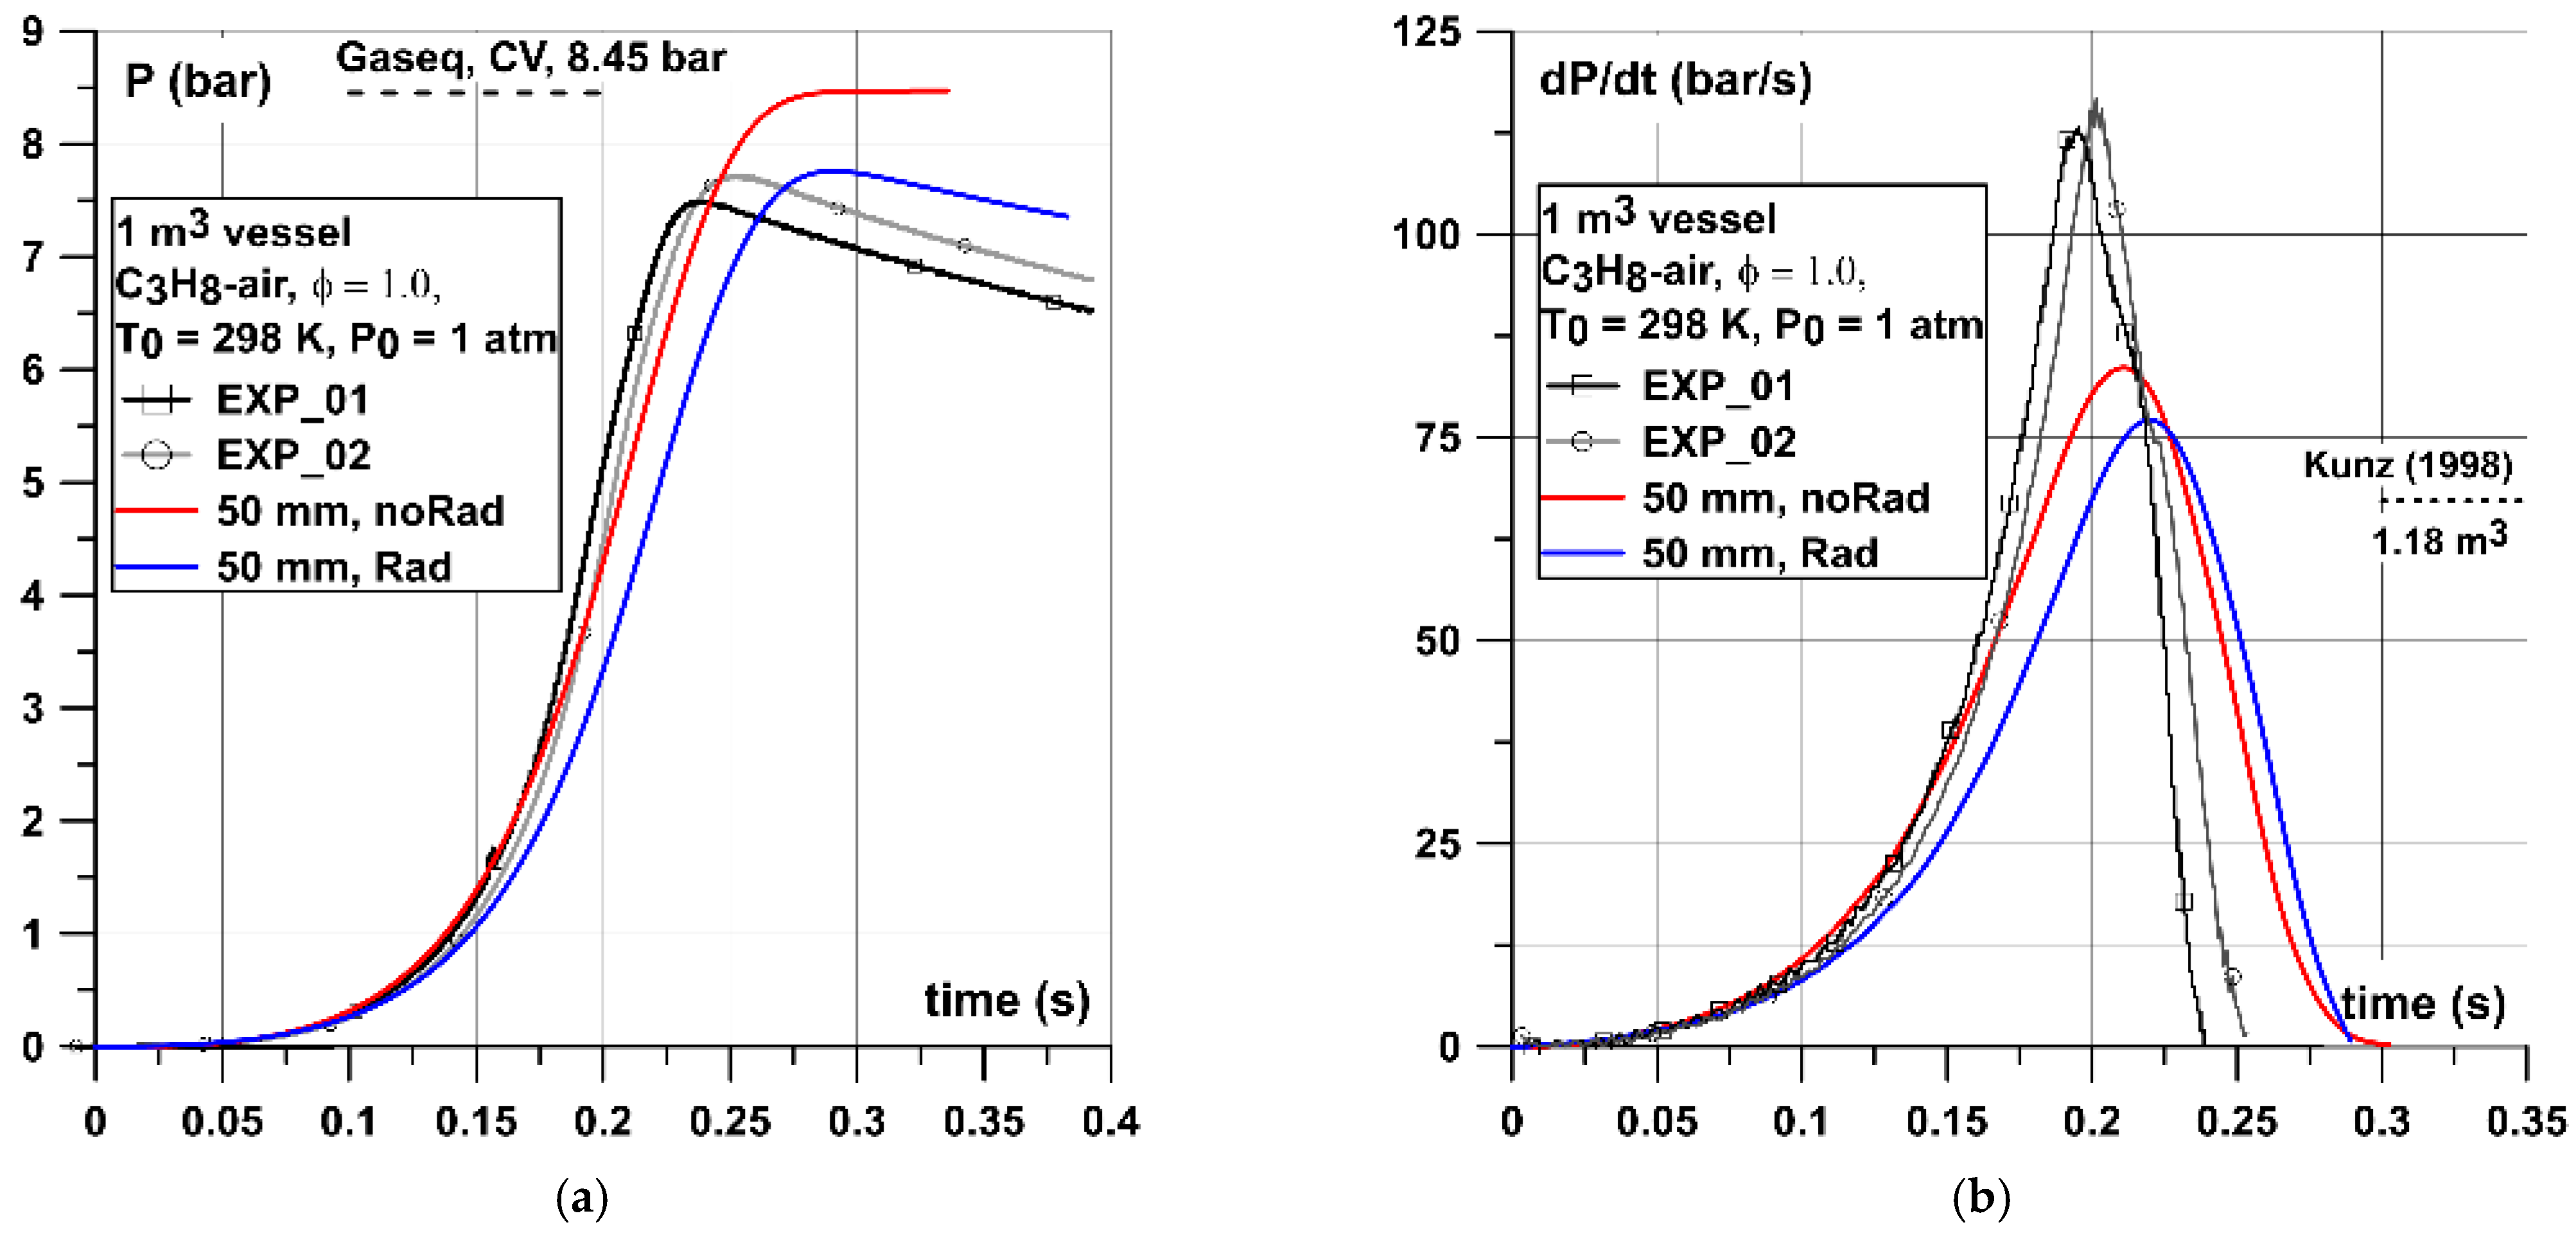
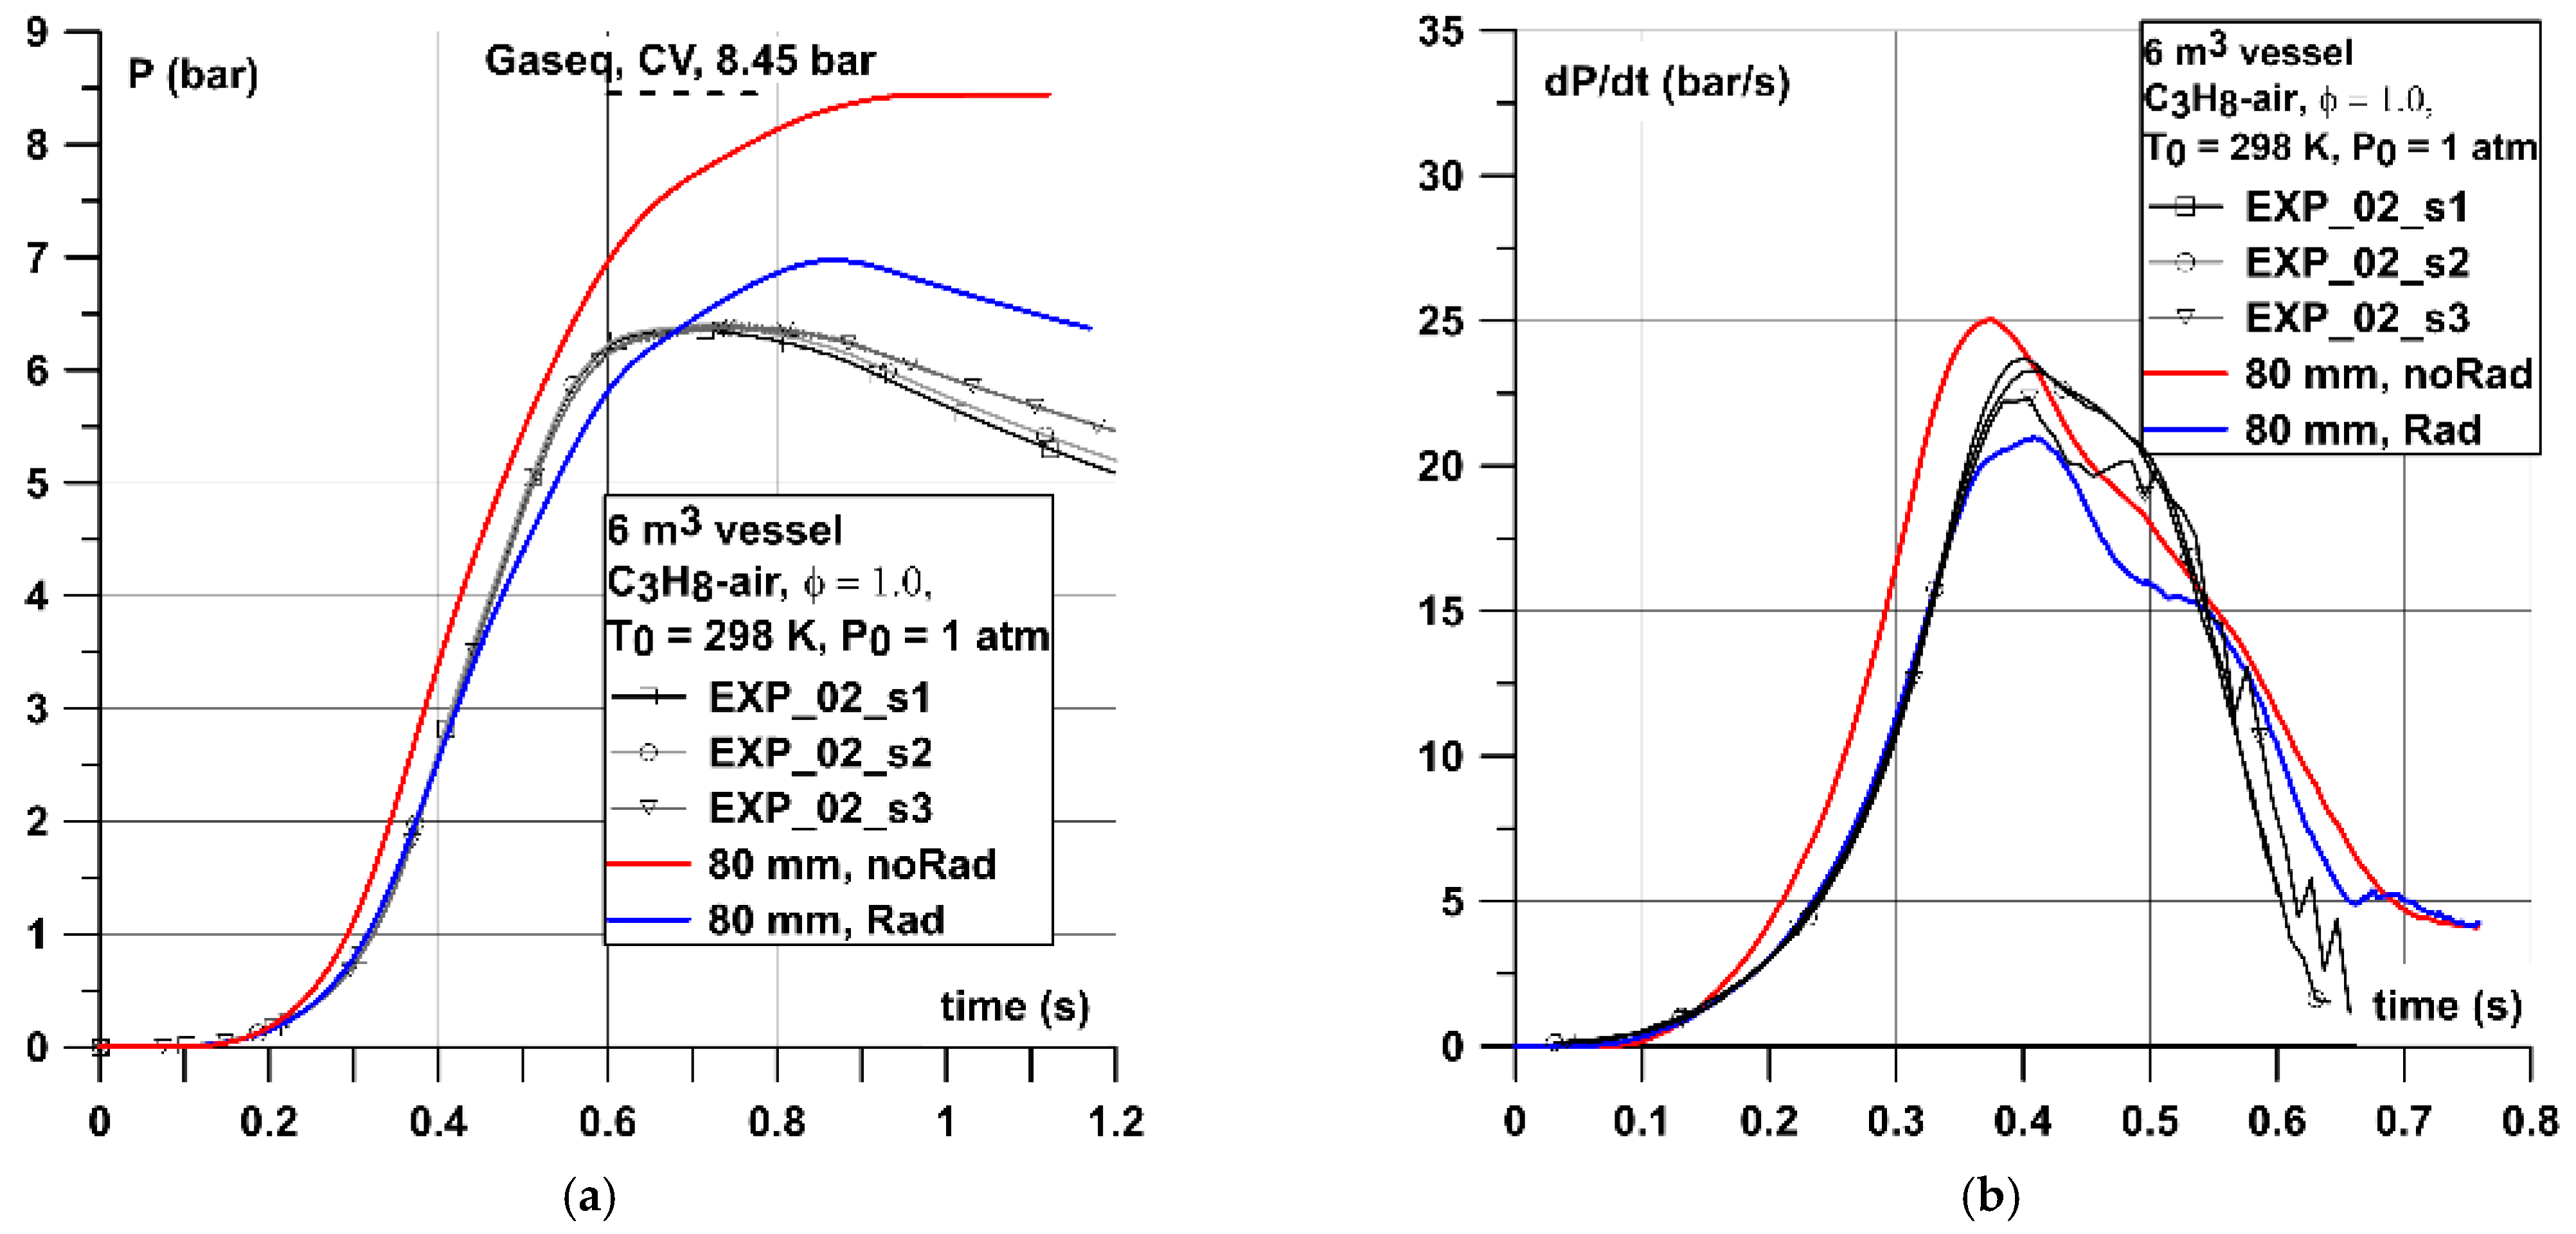
Figure 15, Figure 16 and Figure 17 show the comparison between simulated and experimental pressure–time and dP/dt curves for cases with stoichiometric C3H8–air mixtures. In the case of the 0.02 m3 vessel (Figure 15) the experimental curve was between the simulated non-adiabatic and adiabatic cases with similar underestimation of the pressure rise rate close to the maximum pressure. However, the experimental Pmax was the same (7.7 bar) as observed numerically for non-adiabatic case but the time to reach Pmax was around 10 ms longer than in the experiment. The underestimation of the (dP/dt) max was similar as observed in previous simulations with difference of around 50–70 bar/s (15–20%). In the case of the 1 m3 vessel (Figure 16) both numerical curves P(t) and dP/dt were underestimated, similarly as observed in simulations of CH4–air and C2H6–air. This characteristic underestimation of around 30–40 bar/s (25–30%) is present for all simulated mixtures in the 1 m3 vessel. However, the comparing simulated (dp/dt)max with a value provided by Kunz [40] in the vessel of a similar volume shows only slight overestimation.
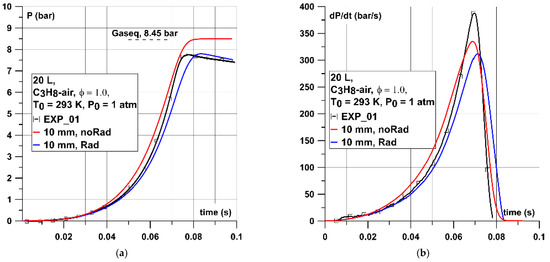
Figure 15.
(a) Pressureand (b) dP/dt graphs for stoichiometric C3H8–air mixture in the 0.02 m3 vessel.
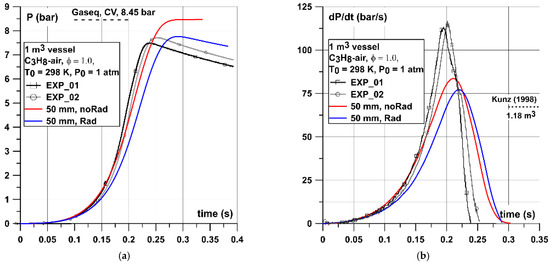
Figure 16.
(a) Pressure and (b) dP/dt graphs for stoichiometric C3H8–air mixture in the 1 m3 vessel. Dotted line mark (dp/dt)max value provided by Kunz [40] in the vessel of a similar volume and shape.
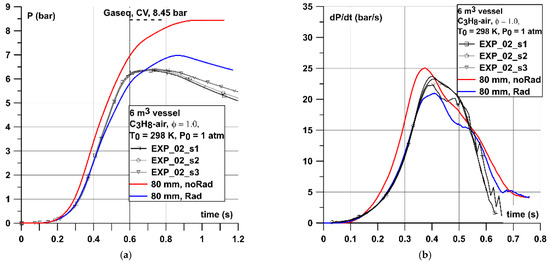
Figure 17.
(a) Pressure and (b) dP/dt graphs for stoichiometric C3H8–air mixture in the 6 m3 vessel.
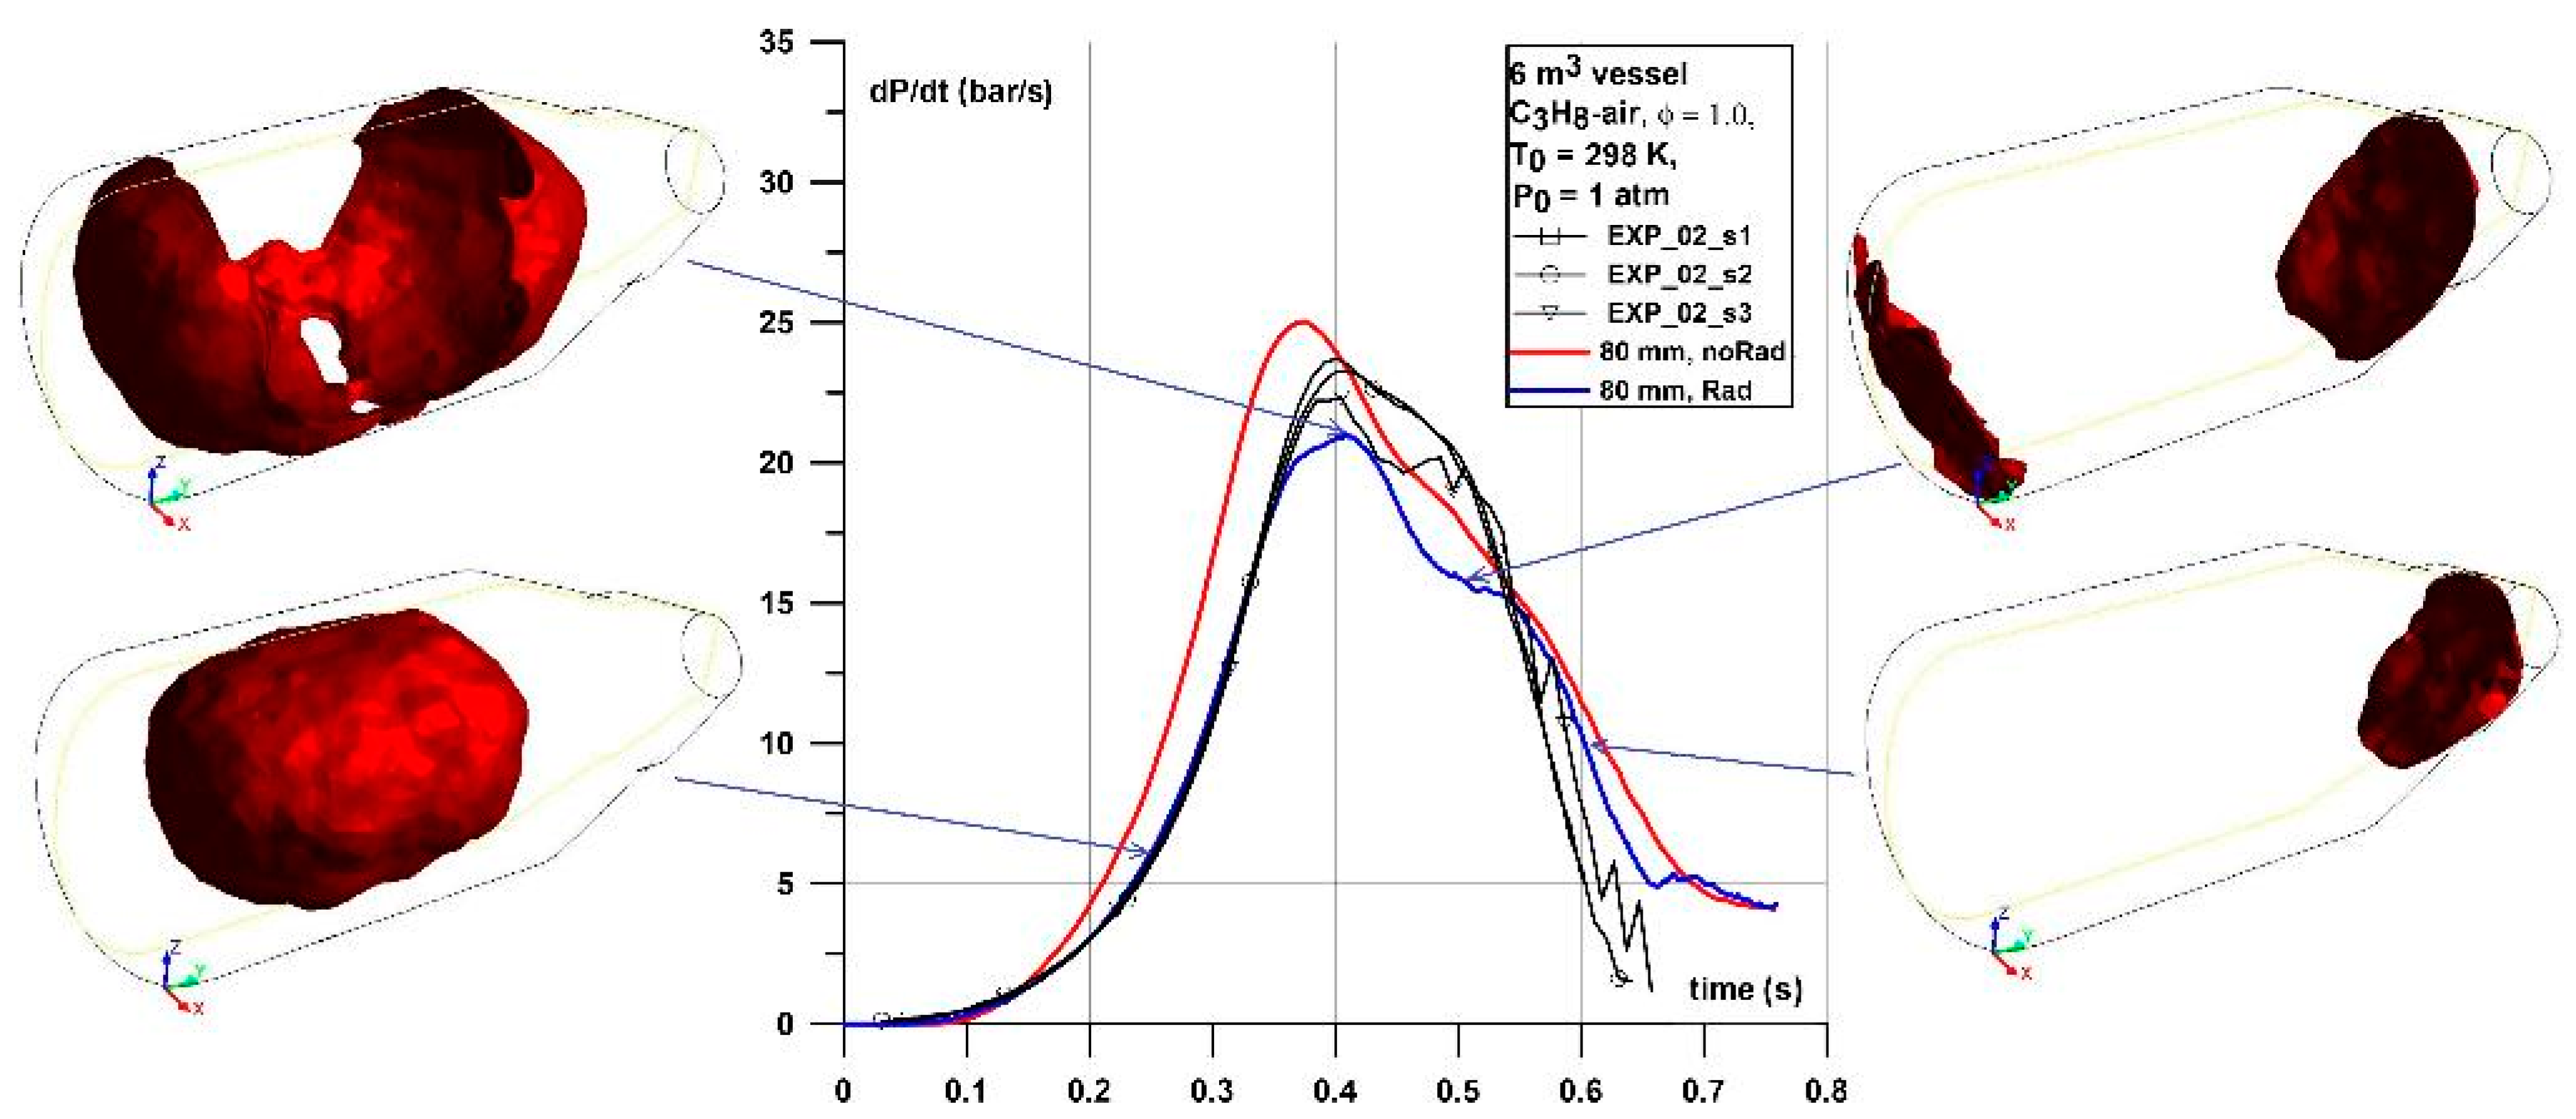
Simulation in the 6 m3 vessel (Figure 17) gave similar curve shape as in case of CH4–air and especially C2H6–air with similar characteristic points at the P(t) and dP/dt curve. Non-adiabatic numerical case shows only slight overestimation of the Pmax of around 0.5 bar and around 0.2 s longer time to reach Pmax. The dP/dt curve and (dP/dt)max for the non-adiabatic case was very close to the experimental one. The similarity of the simulated P(t) and dP/dt curves of C3H8–air and C2H6–air were due to the fact that for both mixtures laminar burning velocities and their dependence on pressure and temperature (indexes m and n) had similar values (see Table 2) therefore one might expect similar simulation results. Figure 18 shows the details of the flame front surface development at the selected, characteristic times of the dP/dt curve. The maximum value of the dP/dt was related to the maximum flame front area before it reached the vessel’s walls. Further flame surface development highly relates to the vessel’s shape with similar transition to two separate flame zones as described in detail for CH4–air combustion (Figure 11).
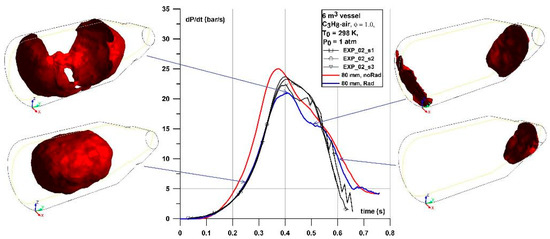
Figure 18.
Flame front positions in the 6 m3 vessel at various simulation times. C3H8–air mixture.
Simulations of C3H8–air mixture combustion in closed vessels showed that the implemented model predicts the pressure history and pressure dynamics curve with the acceptable level of accuracy. Adiabatic simulations predicted properly the theoretical Pmax values non-adiabatic simulations represent well the experimental P(t) curve with the same or almost the same as experimental Pmax value in 0.02 m3 and 1 m3 vessels. In the case of the 6 m3 vessel one might observe slight overestimation of Pmax by around 0.6 bar. Parameter (dp/dt)max from simulations in 0.02 m3 was underestimated by around 15–20% but the dP/dt curve was well represented. In the case of 1 m3 simulated (dp/dt)max was underestimated by around 30–40% with respect to the experimental value and close to the value provided by Kunz [40] in the vessel of a similar volume. Combustion in the 6 m3 vessel show high influence of the vessel geometry on the recorded pressures in both simulations and experiments similarly as in case of CH4–air and C2H6–air mixture. Non-adiabatic simulations overestimated the experimental Pmax by 0.6 bar and a simulated (dp/dt)max value range of 21 bar/s was close to the experimental range of 22–23 bar/s. Additionally, the simulated non-adiabatic dP/dt curve was in line with the experimental one up to the (dp/dt)max and with almost the same time to reach (dp/dt)max. Further flame propagation was highly influenced by the walls and the dP/dt curve shows similar characteristic points as the experimental one, similarly as in the case of simulation of CH4–air and C2H6–air mixtures.
7. Discussion
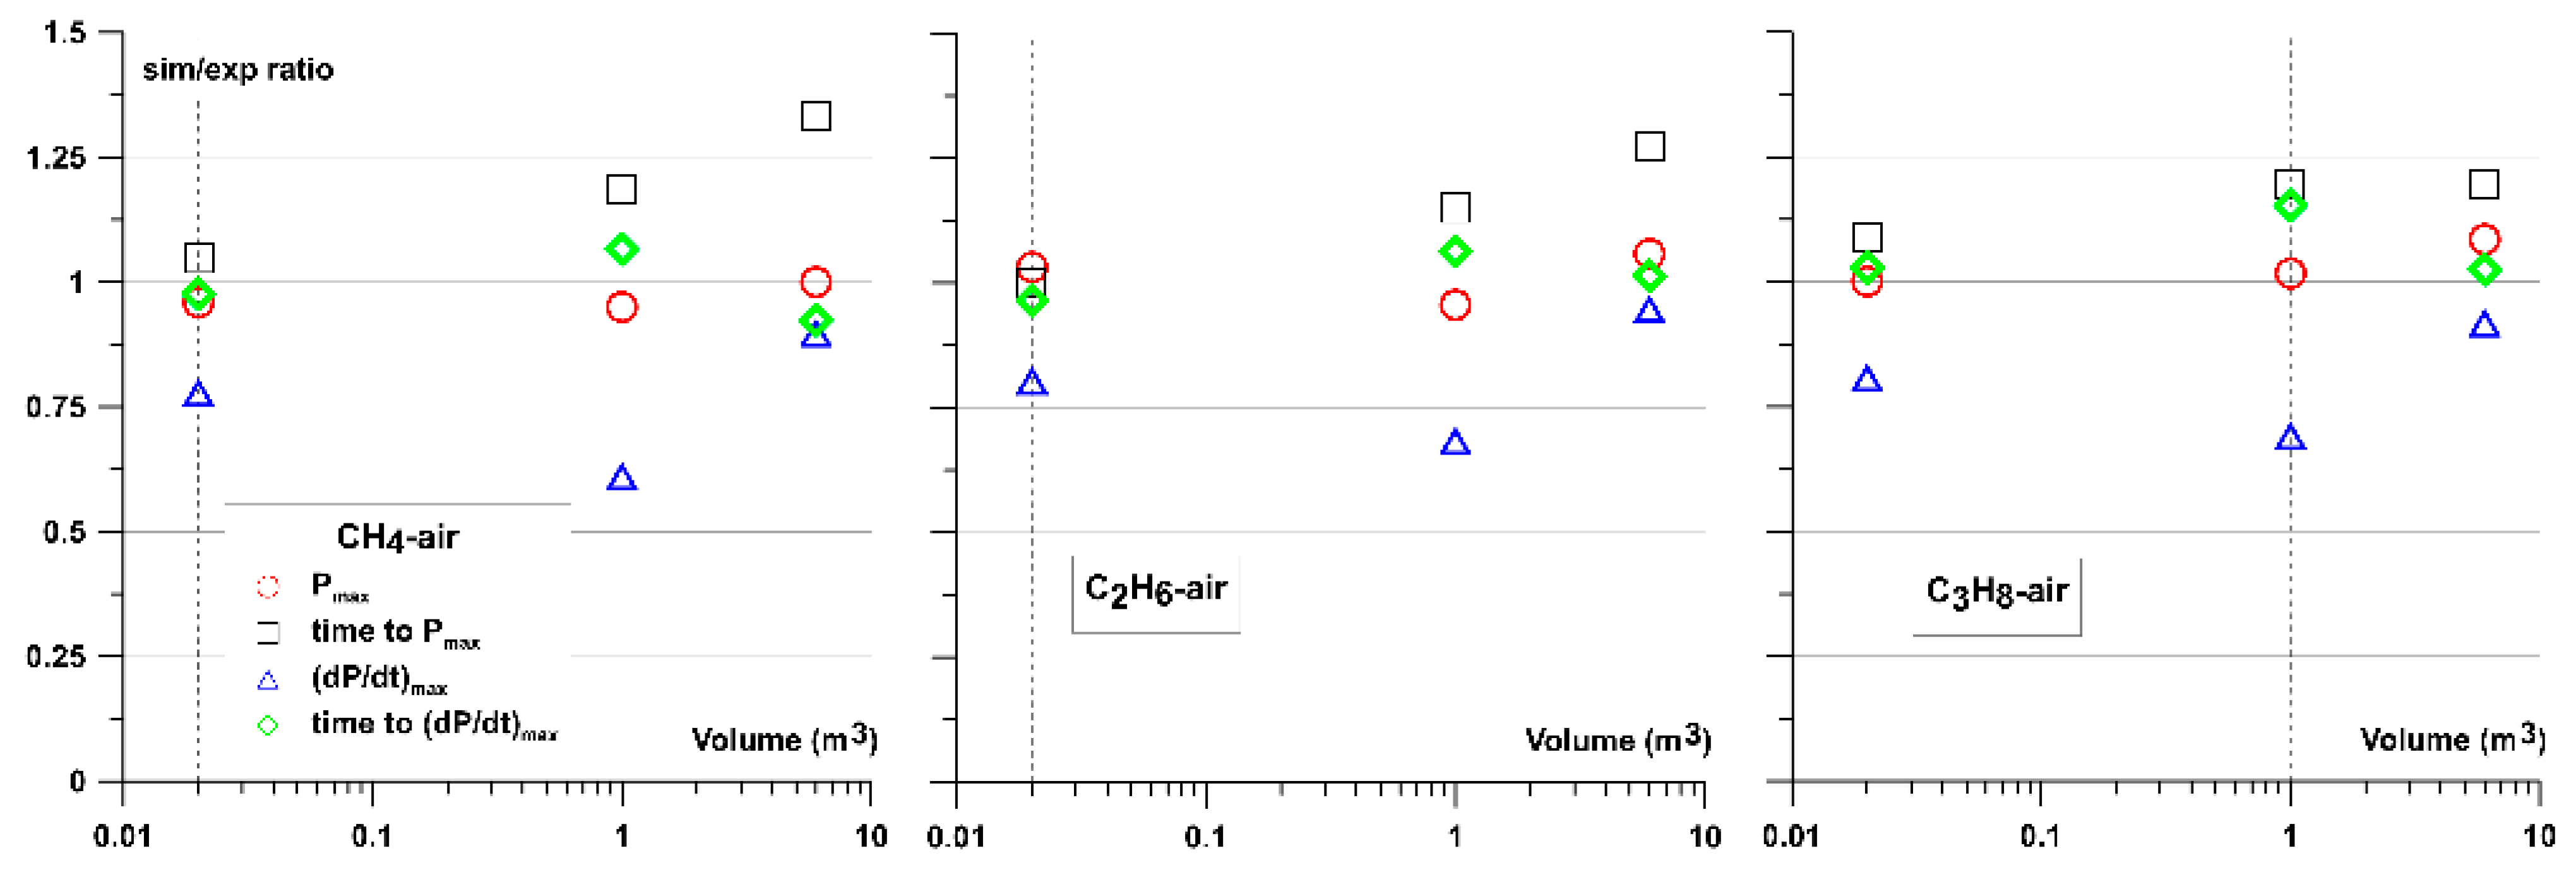
The results showed that the used deflagration model might be successfully used for closed volume combustion modeling with a satisfactory level of accuracy for a given scale of a problem. Simulations of each vessel sizes 0.02, 1, and 6 m3 gave good predictions. It should be noted that the way of generating input data for simulation, especially LBV and its dependence on temperature and pressure might introduce some level of uncertainty. There are various experimental data of the LBV. Large scatter of the experimentally obtained laminar burning velocities makes it difficult to validate kinetic mechanism especially for higher initial pressures and temperatures where very limited data is available. Considering the above mentioned issues it is expected to observe some level of discrepancy between simulated and experimental results, especially at higher pressures. To assess the simulations quantitatively the ratios between simulated (non-adiabatic) and experimental values of the main parameters characterizing constant volume combustion were calculated and summarized in Table 3: Pmax (absolute values ratio), time to reach Pmax, (dP/dt)max, and time to reach (dP/dt)max. Graphical interpretation of Table 3 is shown in Figure 19. Values less than one mean the simulation underestimates specific parameter and a value more than one means that simulation overestimates parameter with respect to the experimental value.

Table 3.
Ratios of simulated, “sim” (non-adiabatic) and experimental “exp” parameters describing combustion in considered vessels.
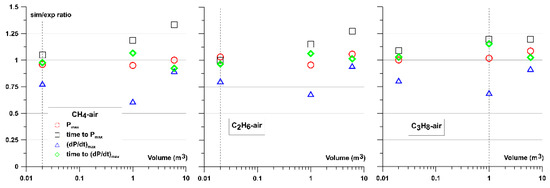
Figure 19.
Ratios of simulated (non-adiabatic) and experimental parameters for all considered mixtures.
In Figure 19 one can observe repeatable underestimation of the (dP/dt)max value. This is probably caused by the fact that (dP/dt) reached its maximal value at the time when the flame approached the vessel’s wall and simultaneously, the pressure and temperature in the unburned mixture were relatively high so that values of LBV were outside the conditions reported in the literature or its reliability was low. As the structure of the laminar flame front changes at higher initial pressures, the current deflagration model will need to be improved to include the high-pressure influence on the LBV. In general, the lowest level of differences between simulated and experimentally obtained results has been observed for combustion in the perfectly spherical 0.02 m3 vessel. For all the mixtures considered in the 0.02 m3 vessel the experimental pressure–time curve was between the simulated adiabatic and non-adiabatic pressure–time curves or almost in line with experimental curve as in case of the C2H6–air mixture. The highest level of discrepancy was observed for the 1 m3 vessel. In this case results of the simulations for all the mixtures were underestimated in respect of P(t) and dP/dt curves shape and (dP/dt)max values. However, comparison with available in the literature (dP/dt)max values measured in vessels of similar volumes and shapes [39,40] are close to that provided by simulations. In the case of simulations in the 6 m3 vessel one can observe a relatively low level of discrepancy in respect of the P(t) shape and Pmax value with good prediction of the dP/dt curve, (dP/dt)max values, and time to reach these Pmax and (dP/dt)max. Combustion in the 6 m3 vessel shows high influence of the geometry on the flame development process and simulations were able to reproduced all characteristic points of the experimentally observed P(t) and dP/dt curves. It shall be noted that the experimental maximum explosion pressure in the 6 m3 vessel was around 2 bar lower comparing to the tests in 0.02 (spherical) or 1 m3 (almost spherical), stressing the importance of geometry and heat losses to the walls. An additional comment should be devoted to the non-adiabatic cases, which include heat losses due to the radiation of the flame. As radiation modeling is very difficult due to the large number of unknown parameters especially related to the vessels’ internal wall surface type and quality, which change over time, the authors did not perform additional investigation apart from the presented comparison between pressure and dP/dt curves. Nevertheless, the presented comparison and simple approach for radiation modeling presented in this paper might be used as a base for a more thorough analysis. The implemented parameters for radiation modeling gave good prediction in respect of experimental P(t), dP/dt curves, and Pmax and (dP/dt)max values, especially for 0.02 m3 and 6 m3 volume vessels.
8. Conclusions
The deflagration model developed at Ulster University previously used for hydrogen–air combustion was modified to simulate hydrocarbon–air mixtures combustion and tested with a new set of experiments performed in various vessels of 0.02, 1.0, and 6 m3. The results showed that the modified deflagration model might be successfully used for modeling of hydrocarbon–air mixtures combustion in closed vessels of given sizes. The utilized methodology for input parameters generation and estimation of the heat losses due to the radiation proved to be sufficient to reproduce the closed volume combustion at the acceptable level of accuracy, especially for vessels of 0.02 and 6 m3 volume. However, in the case of non-symmetrical geometries and with the presence of walls the mesh preparation demands more attention due to the faster flame quenching at walls when/where? relatively large nominal cells are used. This effect might be reduced by using mesh refinement at the walls. The upgraded deflagration model will be tested further with different geometries including closed tanks and open but congested spaces.
Author Contributions
Conceptualization, W.R., A.P., A.T., V.M., D.M.; methodology, W.R., A.P., A.T., V.M., D.M.; software, W.R., D.M.; validation, W.R. and A.P.; formal analysis, W.R., A.P., A.T., V.M., D.M.; investigation, W.R., A.P., D.M.; resources, W.R. and A.P.; data curation, W.R.; writing—original draft preparation, W.R; writing—review and editing, W.R., A.P., A.T., V.M., D.M.; visualization, W.R.; supervision, A.P., A.T., V.M., D.M.; project administration, W.R. and A.P.; funding acquisition, A.P., A.T., V.M., D.M.; All authors have read and agreed to the published version of the manuscript.
Funding
This work has been financially supported by European Union within FP7 Marie Curie Industry-Academia Pathways and Partnerships (IAPP) action, GENFUEL project–610897 WP6.
Institutional Review Board Statement
Not applicable.
Informed Consent Statement
Not applicable.
Data Availability Statement
The data presented in this study are available on request from the corresponding author.
Conflicts of Interest
The authors declare no conflict of interest.
References
- Molkov, V.; Makarov, D.; Grigorash, A. Cellular Structure of Explosion Flames: Modeling and Large-Eddy Simulation. Combust. Sci. Technol. 2004, 176, 851–865. [Google Scholar] [CrossRef]
- Makarov, D.V.; Molkov, V.V. Modeling and Large Eddy Simulation of Deflagration Dynamics in a Closed Vessel. Combust. Explos. Shock Waves 2004, 40, 136–144. [Google Scholar] [CrossRef]
- Keenan, J.; Makarov, D.; Molkov, V. Rayleigh–Taylor instability: Modelling and effect on coherent deflagrations. Int. J. Hydrog. Energy 2014, 39, 20467–20473. [Google Scholar] [CrossRef]
- Molkov, V.; Makarov, D.; Schneider, H. Physical and numerical analysis of large-scale hydrogen-air deflagrations in open at-mosphere. J. Phys. D Appl. Phys. 2006, 39, 4366–4376. [Google Scholar] [CrossRef]
- Molkov, V.; Makarov, D. Rethinking the Physics of a Large-Scale Vented Explosion and its Mitigation. Process. Saf. Environ. Prot. 2006, 84, 33–39. [Google Scholar] [CrossRef]
- Molkov, V.; Makarov, D.; Puttock, J. The nature and large eddy simulation of coherent deflagrations in a vented enclosure-atmosphere system. J. Loss Prev. Process. Ind. 2006, 19, 121–129. [Google Scholar] [CrossRef]
- Makarov, D.; Molkov, V.; Gostintsev, Y. Comparison between Rng and Fractal Combustion Models for Les of Unconfined Explosions. Combust. Sci. Technol. 2007, 179, 401–416. [Google Scholar] [CrossRef]
- Molkov, V.; Makarov, D.; Schneider, H. Hydrogen-air deflagrations in open atmosphere: Large eddy simulation analysis of experimental data. Int. J. Hydrogen Energy 2007, 32, 2198–2205. [Google Scholar] [CrossRef]
- Makarov, D.; Verbecke, F.; Molkov, V. Numerical analysis of hydrogen deflagration mitigation by venting through a duct. J. Loss Prev. Process. Ind. 2007, 20, 433–438. [Google Scholar] [CrossRef]
- Molkov, V.; Verbecke, F.; Makarov, D. LES of Hydrogen-Air Deflagrations in a 78.5-m Tunnel. Combust. Sci. Technol. 2008, 180, 796–808. [Google Scholar] [CrossRef]
- Xiao, H.; Makarov, D.; Sun, J.; Molkov, V. Experimental and numerical investigation of premixed flame propagation with dis-torted tulip shape in a closed duct. Combust. Sci. Technol. 2012, 159, 1523–1538. [Google Scholar]
- Molkov, V. Fundamentals of Hydrogen Safety Engineering, Part I and II. 2012. Available online: https://www.arma.org.au/wp-content/uploads/2017/03/fundamentals-of-hydrogensafety-engineering-i.pdf (accessed on 1 February 2016).
- Makarov, D.; Verbecke, F.; Molkov, V.; Roe, O.; Skotenne, M.; Kotchourko, A.; Lelyakin, A.; Yanez, J.; Hansen, O.; Middha, P.; et al. An inter-comparison exercise on CFD model capabilities to predict a hydrogen explosion in a simulated vehicle refuelling environment. Int. J. Hydrogen Energy 2009, 34, 2800–2814. [Google Scholar] [CrossRef]
- Baraldi, D.; Kotchourko, A.; Lelyakin, A.; Yanez, J.; Middha, P.; Hansen, O.; Gavrikov, A.; Efimenko, A.; Verbecke, F.; Makarov, D.; et al. An inter-comparison exercise on CFD model capabilities to simulate hydrogen deflagrations in a tunnel. Int. J. Hydrogen Energy 2009, 34, 7862–7872. [Google Scholar] [CrossRef]
- Garcia, J.G.; Baraldi, D.; Gallego, E.; Beccantini, A.; Crespo, A.; Hansen, O.; Høiset, S.; Kotchourko, A.; Makarov, D.; Migoya, E.; et al. An intercomparison exercise on the capabilities of CFD models to reproduce a large-scale hydrogen deflagration in open atmosphere. Int. J. Hydrogen Energy 2010, 35, 4435–4444. [Google Scholar] [CrossRef]
- Makarov, D.; Verbecke, F.; Molkov, V.; Kotchourko, A.; Lelyakin, A.; Yanez, J.; Baraldi, D.; Heitsch, M.; Efimenko, A.; Gavrikov, A. An inter-comparison of CFD models to predict lean and non-uniform hydrogen mixture explosions. Int. J. Hydrogen Energy 2010, 35, 5754–5762. [Google Scholar] [CrossRef]
- Yanez, J.; Kotchourko, A.; Lelyakin, A.; Gavrikov, A.; Efimenko, A.; Zbikowski, M.; Makarov, D.; Molkov, V. A comparison exercise on the CFD detonation simulation in large-scale confined volumes. Int. J. Hydrogen Energy 2011, 36, 2613–2619. [Google Scholar] [CrossRef]
- Zbikowski, M.; Makarov, D.; Molkov, V. Numerical simulations of large-scale detonation tests in the RUT facility by the LES model. J. Hazard. Mater. 2010, 181, 949–956. [Google Scholar] [CrossRef]
- Zbikowski, M.; Makarov, D.; Molkov, V. LES model of large scale hydrogen–air planar detonations: Verification by the ZND theory. Int. J. Hydrogen Energy 2008, 33, 4884–4892. [Google Scholar] [CrossRef]
- Babkin, V.S.; Kozachenko, L.S. Burning velocity of methane-air mixture at high pressures. Combust. Explos. Shock Waves 1966, 2, 77–88. [Google Scholar]
- Babkin, V.S.; Babushok, V.I.; Senachin, D.K. Modelling of explosion dynamics in closed vessel. Arch. Combust. 1982, 2, 227–241. [Google Scholar]
- Molkov, V.; Shamonin, V.G.; Baratov, A.N. Burning Velocities and Peculiarities of Flame Spread at High Pressures and Temperatures, in: Combust. Heterog. Gaseous Syst. In Proceedings of the VIII All-Union Symposium on Combustion and Explosion; OIKhF Akad Nauk SSSR: Chernogolovka, Russia, 1986; pp. 11–14. [Google Scholar]
- Zimont, V.L.; Lipatnikov, A.N. A numerical model of premixed turbulent combustion of gases. Chem. Phys. Rep. 1995, 14, 993–1025. [Google Scholar]
- Dyduch, Z.; Toman, A.; Adamus, W. Measurements of turbulence intensity in the standard 1 m3 vessel. J. Loss Prev. Process. Ind. 2016, 40, 180–187. [Google Scholar] [CrossRef]
- Yakhot, V. Propagation Velocity of Premixed Turbulent Flames. Combust. Sci. Technol. 1988, 60, 191–214. [Google Scholar] [CrossRef]
- Gostintsev, Y.A.; Istratov, A.G.; Shulenin, Y.V. Self-similar propagation of a free turbulent flame in mixed gas mixtures. Combust. Explos. Shock Waves 1989, 24, 563–569. [Google Scholar] [CrossRef]
- Goodwin, D.; Moffat, H.; Speth, R. Cantera: An Object-Oriented Software Toolkit for Chemical Kinetics, Thermodynamics, and Transport Processes, Cantera Version 2.2.1. 2016. Available online: www.cantera.org (accessed on 1 February 2016).
- Smith, G.P.; Golden, D.M.; Frenklach, M.; Moriarty, N.W.; Eiteneer, B.; Goldenberg, B.; Bowman, C.T.; Hanson, R.K.; Song, S.; Gardiner, W.C., Jr.; et al. GRI-Mech 3.0. Available online: http://www.me.berkeley.edu/gri_mech/ (accessed on 1 February 2015).
- Metcalfe, W.K.; Burke, S.M.; Ahmed, S.S.; Curran, H.J. A Hierarchical and Comparative Kinetic Modeling Study of C1—C2 Hydrocarbon and Oxygenated Fuels. Int. J. Chem. Kinet. 2013, 45, 638–675. [Google Scholar] [CrossRef]
- Pekalski, A.A. Theoretical and Experimental Study on Explosion Safety of Hydrocarbons Oxidation at Elevated Conditions: Rel-Evance for Safe Design and Operation of Industrial Processes. Ph.D. Thesis, Delft University of Technology, Delft, The Netherlands, 2004. [Google Scholar]
- Park, O.; Veloo, P.S.; Egolfopoulos, F.N. Flame studies of C2 hydrocarbons. Proc. Combust. Inst. 2013, 34, 711–718. [Google Scholar] [CrossRef]
- Vagelopoulos, C.M.; Egolfopoulos, F.N. Direct experimental determination of laminar flame speeds. Symp. Combust. 1998, 27, 513–519. [Google Scholar] [CrossRef]
- Dirrenberger, P.; Le Gall, H.; Bounaceur, R.; Herbinet, O.; Glaude, P.-A.; Konnov, A.; Battin-Leclerc, F. Measurements of Laminar Flame Velocity for Components of Natural Gas. Energy Fuels 2011, 25, 3875–3884. [Google Scholar] [CrossRef]
- Goswami, M.; Bastiaans, R.J.M.; De Goey, L.P.H.; Konnov, A. Experimental and modelling study of the effect of elevated pressure on ethane and propane flames. Fuel 2016, 166, 410–418. [Google Scholar] [CrossRef]
- Jomaas, G.; Zheng, X.; Zhu, D.; Law, C. Experimental determination of counterflow ignition temperatures and laminar flame speeds of C2–C3 hydrocarbons at atmospheric and elevated pressures. Proc. Combust. Inst. 2005, 30, 193–200. [Google Scholar] [CrossRef]
- Bosschaart, K.; De Goey, L. The laminar burning velocity of flames propagating in mixtures of hydrocarbons and air measured with the heat flux method. Combust. Flame 2004, 136, 261–269. [Google Scholar] [CrossRef]
- Linbo, Y.; Guanghi, Y.; Boshu, H. Development of an absorption coefficient calculation method potential for combustion and gasification simulations. Int. J. Heat Mass Transf. 2015, 91, 1069–1077. [Google Scholar]
- Morley, C. Gaseq—A Chemical Equilibrium Program for Windows. 2005. Available online: http://www.gaseq.co.uk/ (accessed on 15 May 2015).
- Gieras, M.; Klemens, R. Experimental Studies of Explosions of Methane-Air Mixtures in a Constant Volume Chamber. Combust. Sci. Technol. 2009, 181, 641–653. [Google Scholar] [CrossRef]
- Kunz, O. Combustion Characteristics of Hydrogen-and Hydrocarbon-Air Mixtures in Closed Vessels, Explosion Dynamics Laboratory Report FM 98–4; Universtiy of Stuttgart: Stuttgart, Germany, 1998. [Google Scholar]
- Holtappels, K. Report on the Experimentally Determined Explosion Limits, Explosion Pressures and Rates of Explosion Pressure Rise Part 2: Ethane, Ethylene, Propane, n-Butane, Ammonia and Carbon Monoxide; Federal Institute for Materials Research and Testing (BAM): Berlin, Germany, 2006. [Google Scholar]
Publisher’s Note: MDPI stays neutral with regard to jurisdictional claims in published maps and institutional affiliations. |
© 2021 by the authors. Licensee MDPI, Basel, Switzerland. This article is an open access article distributed under the terms and conditions of the Creative Commons Attribution (CC BY) license (https://creativecommons.org/licenses/by/4.0/).

