Article

A Comparative Study on the Performance of Single and Multi-Layer Encapsulated Phase Change Material Packed-Bed Thermocline Tanks

1
Key Laboratory of Condition Monitoring and Control for Power Plant Equipment, North China Electric Power University, Ministry of Education, Beijing 102206, China
2
School of Energy and Power Engineering, Lanzhou University of Technology, Lanzhou 730050, China
*
Authors to whom correspondence should be addressed.
Energies 2021, 14(8), 2175; https://doi.org/10.3390/en14082175
Submission received: 11 March 2021 / Revised: 25 March 2021 / Accepted: 9 April 2021 / Published: 13 April 2021
(This article belongs to the Section D: Energy Storage and Application)

Abstract

:
This paper presents a numerical study that aims at investigating the effects of different parameters on the dynamic performance of single and multi-layer encapsulated phase material (PCM) thermocline tanks. A transient, one-dimensional, two-phase, concentric-dispersion model is formulated to evaluate such performance. Encapsulated paraffin waxes having different melting-points are used as PCMs, with water as heat transfer fluid. Comprehensive comparisons between single-PCM and multiple-PCMs systems are numerically analyzed first. Second, the effects of the PCM volume fraction (VF) and the inverse Stefan number have been discussed. The results show that among the various cases the single-PCM70 system has the highest performance in terms of charging and discharging efficiency, followed by a multiple-PCMs system with average performance. Compared with the PCM40 case, the PCM70 case has a 29% increase in the output energy from the system. The VF of PCMs influences the system output, both in terms of energy storage and release, the heat storage period and the total energy stored increased by 4.5%, when the VF of the PCM70 increases from 33.33% to 50%, respectively. Furthermore, it increases the system’s overall efficiency and total utilization ratio by 13.7% and 25%, respectively, when compared to the arrangement in which the PCM40 occupies 50% of the total bed height. The effect of the inverse Stefan number has a significant impact on the system’s utilization ratio. Compared with all other 3-PCM systems, the scenario with the lowest inverse Stefan number in the middle PCM has the highest charging and discharging efficiencies of 83.9% and 80.8%, respectively. The findings may be beneficial for the design and optimization of packed-bed tanks.

1. Introduction

The past decade has witnessed the rapid progress of solar and wind power. However, with the increase of wind and solar power, there must be abundant peak load regulation plants in the power grid because of their intrinsic intermittence and fluctuation. In China, coal-fired thermal power generation is the dominating electrical power production method, and the coal-fired thermal power plants have to be operated under frequent peak-shaving mode.
The combined heat and power (CHP) plants installed in northern China account for nearly 30% of the total existing thermal power generating units [1]. However, the mismatch between heat-supply demand and electricity of CHP units leads to a major obstacle for the functioning of peak load regulation [2]. To circumvent this issue, thermal energy storage (TES) technology is employed in CHP units to match electrical and thermal demands, thereby enhancing the load regulation capability [3].
Concerning TES tank systems, the single-tank with thermocline layer has a series of advantages including less land use and it can reduce costs by 30%, compared to the two-tank system in which the two fluids (cold and hot) are stored separately [4,5]. Water has the highest potential storage medium for a low-temperature heat storage system, due to its higher specific heat capacity and availability [6]. Several experimental and numerical investigations have been conducted to verify the dynamic performance of a water thermocline tank. Karim et al. [7] performed a numerical study on stratified TES tank systems to identify the parameters that strongly affect the dynamic behavior. He found that the thermal stratification behavior enhances with the increase of temperature difference, higher length to diameter ratio, and operating at lower inlet flow rates. The effects of aspect-ratios, as well as mixing coefficient, significantly influences the dynamic performance [8].
Many investigators focus on the dynamic performance of a thermocline tank by incorporating the phase change materials as part of the storage medium, due to its merits of high energy storage density and the temperature stability of the heat storage phase [9,10]. The results reported that the adoption of PCMs in water storage tanks utilized for domestic hot-water supply is a favorable technique. Besides, the thermal stratification analysis of a water tank with and without PCM as filler material was experimentally investigated [11]. The heat exchange mechanisms between PCM capsules and the heat transfer fluid (HTF) were discussed at different locations over the packed-bed height and within a certain PCM capsule [12,13]. Nallusamy et al. [14] experimentally investigated the effects of the inlet fluid temperature and the flow rates on the dynamic performance of a hybrid thermal storage unit incorporated with fixed and varying heat sources. The major findings of these studies revealed that the use of PCM as a storage medium has significant effects on dynamic performance characteristics, such as thermal stratification [15], the heat storage/release rate [16]. Most recently, the dynamic performance of a water thermocline tank filled with encapsulated paraffin wax as a PCM was experimentally investigated under various modes of operation, i.e., cyclic operation [17] and simultaneous operation [18]. The results indicated that the cut-off temperatures of charging and discharging and the flow rate mixing ratio are good performance parameters for predicting the dynamic behavior.
It has been reported that the implementation of multi-layer PCMs in TES systems significantly enhances the dynamic performance [19,20]. Gong and Mujumdar reported that the second-law efficiency of a TES system packed with three-stage PCMs was 74% higher than that of a single-stage PCM [21]. A substantial reduction was revealed in the irreversibility by adopting a multi-layer of PCM [22]. The dynamic performance of three-stage PCMs with different melting points arranged from the top to the bottom of the tank is investigated [23]. The results show that increasing the number of PCM stages in the TES tank to three, results in a significant improvement in the dynamic performance, while any further increase in PCMs stage more than three, does not affect the system performance. These key findings proved that a multi-layer PCM TES system is a promising option for thermal energy storage.
However, the literature review found that the previous work of a low-temperature thermocline tank packed with spherical PCM capsules mainly focused on investigating the dynamic performance of a single-PCM TES tank during a single charging and discharge process. Besides, a few studies were carried out on a low-temperature multiple-PCMs TES tank during a single charging and discharging process. The dynamic thermal performance of a multiple-PCMs thermocline TES system employed in CHP units needs further investigation via various operation strategies.
Hence, the aim of this work to evaluate the effects of various operating parameters on the dynamic thermal performance of single-PCM and multiple-PCMs based on the following knowledge gaps in the literature:
  • Investigate the transient thermal evaluation (temperature maps and dynamic performance analyses) of single-PCM and multiple-PCMs thermocline TES systems which use in combined heat and power units for district heating (not reported in detail in the literature and need further study).
  • Investigate the effects of the volume fraction of PCM and the inverse Stefan number on the dynamic performance of a multiple-PCMs thermocline TES system for low-temperature via various operation modes, such as a single charge/discharge and cyclic operation. The former two parameters are not addressed before for multiple-PCMs water thermocline tank and need further study.
For these objectives, a detailed concentric-dispersion numerical model is established to investigate and predict the charging and discharging processes using a custom MATLAB code. The behavior of a single charge/discharge process and cyclic operation are analyzed through a comprehensive temperature field, followed by a performance analysis of results revealed based on the effects of each parameter.

2. Physical and Mathematical Model

2.1. System Modeling Formulation

The present study deals with single-stage and multi-stages packed-bed TES systems, which are integrated into CHP units and are relevant for district heating applications. The proposed design consists of a storage tank packed with spherical PCM capsules of paraffin wax with an equal radius, forming a packed-bed. The possible use of paraffin wax as a storage media enhances the thermal performance of the TES system and makes it more stable for the heat-supply network.
As illustrated in Figure 1a, the hot and cold water is stored in a TES tank with paraffin wax capsules. The TES tank system is stored by injecting hot water at its top while extracting cold water at its bottom. Oppositely, the tank system is released by injecting cold water at its bottom while extracting hot water at its top [24]. Based on the above system described, a numerical model is established as illustrated in Figure 1b, in which Dbed is the diameter of the bed, Hbed is the height of the bed. The main material properties and simulation parameters of the multi-layer PCMs thermocline tank utilized in this study are listed in Table 1.

2.2. Mathematical Model

The thermal energy storage modeling of a packed-bed system can be divided into four different models, such as Schumann’s model, a single-phase model, a continuous solid phase model, and a concentric-dispersion model [25]. A concentric-dispersion model theory employed in the present study is based on a two-phase model in which the packed-bed is treated as an isotropic porous medium consisting of individual spherical capsules.
The following assumptions are considered in the present model:
(1)
The fluid flow of water exhibits dispersed plug flow [26].
(2)
All the PCM filler materials are spherical capsules with the same diameter treated as a homogenous and isotropic porous medium. Since the temperature variation in the radial direction of the tank is neglected.
(3)
The distributors (spiral nozzles) are not taken into consideration in the current numerical model.
(4)
The heat losses at the top and the bottom surfaces of the tank are neglected. The heat loss occurred by the heat exchange between HTF and tank wall is only considered.
(5)
The finalized shape of the numerical model domain is the cylindrical part only of 0.9 m height.
(6)
The thermo-physical properties of HTF are determined based on the inlet and exit temperature, Tave = (Tin + Tex)/2 [26], where Tave, is the average temperature, Tin is the inlet temperature of HTF, and Tex is the exit temperature of HTF.
(7)
Heat transfer by radiation is neglected.
With the assumptions pointed out above, the model is simplified as a one-dimensional model. The cylindrical section of the tank under study is divided into Nx elements in the axial direction in which the temperature of the fluid is considered uniform. Each spherical capsule is considered to be axisymmetric and divided radially into Rx nodes as illustrated in Figure 1b.
  • Energy balance equation for the HTF (water)
T H T F t = α a x 2 T H T F x 2 U ε T H T F x h v c p , H T F ρ H T F ε ( T H T F T s ) U W D b e d π c p , H T F ρ H T F ε A b e d ( T H T F T i n f )
where THTF, Ts, and Tinf represent the temperatures of HTF, solid PCM, and ambient temperature respectively, t is the time, α a x   is the axial thermal diffusivity, ε   is the porosity of packed-bed region, Dbed is the diameter of the packed-bed, Abed is the area of the packed-bed, hv is the interstitial heat transfer coefficient, UW is the overall heat transfer coefficient, U is the fluid inlet velocity, cp,HTF and ρ H T F   are the specific heat and density of HTF.
  • Energy balance equation for the solid phase of PCM
T s t = k s ρ s c p , s ( 2 T s r 2 + 2 r T s r )
where   ρ s , cp,s, and ks are the density, the specific heat, and the thermal conductivity of the PCM material respectively.
The above energy balance equations are coupled by the interstitial heat transfer coefficient hv between the HTF and interfacial area density as. The particle heat transfer coefficient hp is a function of Reynolds number (Re) and Prandtl number (Pr) and it determines from the following correlation reported in [27]:
h p = k H T F Nu D p = k H T F D p   2 + 1.1 Re 0.6   Pr 1 3 , 15 < Re < 8500
where kHTF is the thermal conductivity of HTF, Dp is the outer diameter of PCM capsules, Nu is Nusselt number.
The interfacial area density as is calculated from the following relation [28]:
a s = 6 1 ε D p
The interstitial heat transfer coefficient, hv, is determined based on the interfacial area density of the bed, as, multiplied by the particle heat transfer coefficient, hp. For spheres, it is estimated by the following equation [28]:
h v = a s h p = 6 1 ε D p h p
The thermal losses from the TES tank to the surroundings are estimated based on the overall heat transfer coefficient, UW, which is denoted in terms of inner heat transfer coefficient due to the convective heat transfer between liquid fluid and the tank wall, and conduction across the thickness of the tank wall and insulation layer, the heat loss by natural convection on the external tank wall surface is neglected [29]:
1 U W = 1 h i + r b e d j = 1 n 1 k j ln r j + 1 r j
where j means the index of insulation layers, kj is the thermal conductivity of insulation layer with index j, rbed is the radius of the bed, hi is the inner wall heat loss coefficient; j = 1 represents the inner tank wall, (r1 = rbed), and j = 3 represents the outer layer of insulation (r3 = router).
The heat loss coefficient of inner wall hi, is reported by Beek [30] as follows:
h i = k H T F D p   0.203 Re 1 3   Pr 1 3 + 0.220 Re 0.8   Pr 0.4  
The water effective thermal conductivity due to the effects of thermal diffusion occurred by solid PCM capsules with the surrounding HTF can be characterized by the formula described by Gonzo [31]:
k H T F , e f f = k H T F     1 + 2 β ϕ + 2 β 3 0.1 β ϕ 2 + ϕ 3   0.05 e x p 4.5 β 1 β ϕ
where = 1 ε   a nd β = ( k s k H T F )/(   k s + 2 k H T F ).
The pressure drop across the packed-bed tank can be determined according to this relation [32]:
Δ p = 150 H b e d 1 ε 2 ε 2 μ H T F U D p 2 + 1.7 H b e d 1 ε ρ H T F U 2 D p
where μ H T F is the dynamic viscosity of HTF, Hbed is the total bed height, and Δ p is the pressure drop across the bed.
  • The initial and boundary conditions
At the start of the charging process, the initial temperatures of HTF and PCM are below the melting-point, and vice versa, during the discharging process, the two temperatures are above the solidification point, so:
T H T F ( t = 0 ) = T i n i t i a l T s ( t = 0 ) = T i n i t i a l
For the charging process at the inlet:
x = H T H T f = T i n , H T f , T s / x = 0
For the charging process at the outlet:
x = 0 T H T f / x + = 0 , T s / x + = 0
For the discharging process at the bed inlet, the HTF temperature is assumed to be constant. Therefore:
x = 0 , T H T f + = T i n , H T f , T s / x + = 0
At the bed outlet when x > H:
x = H , T H T f / x = 0 , T s / x = 0
The solid boundary condition is formulated as:
T s r = 0 , r = 0
k s T s r = h p ( T H T F T s , R o ) , r = R o
To describe the phase transition of PCM occurred and to account for the latent heat during the charge or discharge process, the effective heat capacity approach is employed. The method regards the phase change is resulted within a small temperature interval ( Δ T m = 2   ) . Three stages are presented for obtaining the specific heat for PCM:
The solid sensible heating period:
c p = c p , s , k p = k s , T p < T m 1 , L F = 0
where Tp is the temperature of PCM particle, kp is the thermal conductivity of PCM particle, Tm1 is the peak temperature of PCM during the solid-solid transition, LF is the liquid fraction.
The phase transition thermal storage period:
c p = c p , l + c p , s 2 + L f u s T m 2 T m 1 = c p , l + c p , s 2 + L f u s Δ T m , k p = k s + k l 2 , T m 1 < T p < T m 2 , L F = T p T m 1 Δ T m
where Lfus is the heat of fusion, Tm2 is the peak temperature of PCM during the solid-liquid transition.
The liquid sensible heating period:
c p = c p , l , k p = k l , T p > T m 2 , L F = 1

2.3. Material Properties of PCM Multi-Layer TES System

Table 2 summarizes the thermo-physical properties of the PCMs filler materials adopted in the current work, which were fabricated by Shanghai Tianlan New Material Technology Co., Ltd. (Shanghai, China). The thermo-physical properties of the three selected PCMs are appropriate for the design of the multi-layer TES system. The selected PCMs having melting-points of 68 , 51 ,   and   43   , and are arranged from high to low melting-point.

2.4. The Substantial Indicators for the Dynamic Performance Assessment

2.4.1. System Energy Efficiency

The charge efficiency of the TES system is determined by comparing the total amount of energy stored in the bed fillers and confined HTF to the amount of energy input and pumped when the final charge phase is reached:
η c h = E s t o r e , t o t a l E i n p + E p u m p , c h
E s t o r e , t o t a l = E s t o r e , b e d + E s t o r e , H T F
E s t o r e , H T F = ρ H T F ε V tan k c p , H T F ( T c h T d i s c h )
where Vtank is the volume of the tank, Tch is the charging temperature, and Tdisch is the discharging temperature.
The discharge efficiency of the TES system is determined by comparing the amount of energy recovered to the amount of energy stored and pumped when the final discharge phase is reached:
η d i s c h = E r e c o v e r e d E s t o r e , t o t a l + E p u m p , d i s c h
The pumping energy of the charge/discharge phase is calculated as follows:
E p u m p = t , i n i t i a l t , f i n a l m ρ H T F Δ P d t
The overall efficiency of the charge and discharge phase of the TES system is defined as the ratio between energy recovered to that introduced with the heat transfer fluid during the charge phase and the charging and discharging pumping energy [33],
η o v e r a l l = E r e c o v e r e d E i n p + E p u m p , c h + E p u m p , d i s c h
The amount of energy stored in the packed-bed PCMs capsules during the charge/discharge phase is specified as follows [34]:
E s t o r e , b e d r e c o v e r e d = T i n i t i a l T p ρ c p s d T , i f   T p < T m 1 T i n i t i a l T m 1 ρ c p s d T + T m 1 T p ρ c p m d T + ρ m L f u s T m 2 T m 1 T p T m 1 , i f   T m 1 T p T m 2 T i n i t i a l T m 1 ρ c p s d T + T m 1 T m 2 ρ c p m d T + ρ m L f u s + T m 2 T p ρ c p l d T , i f   T p > T m 1

2.4.2. System Capacity and Total Utilization Ratios

The capacity ratio (CR) of the TES system describes the degree to which the maximum theoretical storage capacity is utilized during the charging process and is defined as [35]:
C R = E s t o r e , b e d Q b e d max
The utilization ratio (UR) of the TES system is the amount of energy that is extracted versus the maximum potential stored energy that could be recovered during the discharging process if the PCM were to be cooled to the initial bed temperature and it’s given as [35]:
U R = U R s e n s i b l e , o u t + U R l a t e n t , o u t Q b e d max
where Qbedmax is the theoretical heat storage capacity of PCMs filler materials and is determined as follow [17]:
Q b e d max = m P C M c p , s ( T m 1 T i n i t i a l ) + m P C M L f u s + m P C M c p , l ( T i n l e t T m 2 )

2.5. Numerical Approach and Model Validation

MATLAB 2014b software (MathWorks company, USA, Beijing office, China) was used to solve the governing equations that represented the model by applying the formulation of the direct finite difference method under the fully implicit scheme by dividing the spatial region of the thermocline tank into Nx sub-areas in the axial direction and dividing the interior of each sphere into Rx nodes. The advective and temporal terms in equation 1 were discretized by using the first-order upwind approach, whereas the diffusion part was discretized by using the second-order central differencing method. The physical properties of PCM material and the temperature of HTF are updated at each time step. The time step size is calculated as 1 s and each control volume height along the bed is determined as 0.0031 m. Based on the data calculated from the simulation process, such as temperature distribution maps and the amount of energy stored in both HTF and PCM material, the main indicators of the system’s dynamic performance can be evaluated.
The validation of the present model for a single-layer TES system is performed based on the experimental measurements published by Nallusamy et al. [14]. Experimental results of multi-layer PCM TES systems are not reported in the literature. Hence, the validation of the numerical model is conducted using a TES tank system packed with a single-layer PCM [14]. Validation is performed on a cylindrical container having dimensions of H = 0.46 m and D = 0.36 m and was used as a latent heat storage system. Paraffin wax of melting-point 60 was used as PCM, water was used as HTF, and the porosity of the bed was 0.5. Water at a constant volume flow rate of 2 L/min and constant temperature of 70   flows through the inlet port for 160 min. Variations in HTF temperatures with time at two different axial positions of X/H = 0.25 and X/H = 0.5 are compared with the experimental temperatures obtained as shown in Figure 2. It can be observed from the figure that a reasonable agreement is achieved between the present model and the experimental data measured. The maximum percentage error in the HTF temperature is found to be 3.7% at the start of the charging process, while this error is reduced to 0.5% during the phase change process. This is may be owing to the persistence effect of the initial conditions within the tank during the charging process.
The percentage error formula that used to describe the rightness of calculations is given as:
% e r r o r = T V E V E V × 100
where TV is the theoretical value calculated, and EV is the experimental value measured.

3. Results with Analysis

Dynamic performance analyses of various TES systems adopted with single-PCM and multiple-PCMs are the key factors to verify the feasibility analysis of such configurations. Analyses of results are discussed here as follows: (a) conducting comparisons among various TES systems to identify the significant differences between them, (b) adopting the effects of the following two essential factors on the dynamic performance of multi-layer system filled with three selected PCMs:
(1)
The volume fraction of PCMs packed in a tank. This parameter is addressed in a detailed description through a single charge/discharge and cyclic operation.
(2)
The inverse Stefan number during cyclic operation.
The operating conditions considered in this work calculations of all cases were carried out at inlet HTF temperature of 80 during the charging phase and 30 during the discharging phase. The outer diameter of the capsules is taken equal to 0.042 m, and the porosity of the bed is assumed to be 0.379. The initial temperature of the packed-bed is assumed to be 30 for the charging phase and 80 for discharging phase.

3.1. General Thermal Behavior Comparison of Single-PCM and Multi-PCM-TES Systems

This part presents comprehensive comparisons between single-PCM and multiple-PCMs-TES systems throughout temperature distribution maps and dynamic performance analysis. Four different cases under study are presented as shown in Figure 3. In the first three cases, the tank is filled with a single-layer PCM of different properties, while the fourth one is filled with multi-layer PCMs arranged from high, medium, and low melting points from top to bottom of the tank.
Figure 4 shows comprehensive HTF temperature field profiles of the case (a) during the charging phase in which the storage tank is packed with PCM40. Figure 4a shows axial temperature distribution plotted against the normalized bed height (X/H) at different time instants. The initial temperature of the confined HTF and PCM capsules inside the tank is kept at a cold water temperature of 30   (fully discharged state). When t = 0 min, hot water enters the tank at its top (X/H = 1) with a temperature of 80 , which contributes to the heat transfer mechanism between the hot water and the cold paraffin wax (solid phase) stored in capsules. The incoming hot water melts the paraffin wax within capsules. It is observed that when t = 300 min, the TES system is completely charged and reaches the inlet temperature of the hot water. The axial temperature profile consists of five zones, including (1) a constant-low temperature zone that is formed at the bed exit (X/H = 0), (2) a constant-high temperature zone that is formed at the bed exit (X/H = 1), (3) a thermocline zone (a sensible heat zone below the phase change temperature) in which the heat is transferred from the water to the packed bed, and (4) a phase transition zone in which the PCM melting process occurs, and (5) a sensible heat above the phase change temperature which is characterized by significant temperature changes in solid temperature which indicated that the heat transfer rate between solid and fluid is very fast and the thermal energy stored in flowing water can be effectively transferred to the packed bed. In constant temperature zones, the water and PCM fillers packed in the tank are in thermal equilibrium; in a thermocline zone, there is a sensible heat transfer from hot water to the PCM fillers; in a phase transition zone, a latent heat transfer between hot water and PCM capsules occurs.
Figure 4b presents the variations of HTF temperature with charging time at various axial positions. It is noted that the HTF temperature increases rapidly with charging time from the cold water temperature of 30   until reaches the melting temperature value of 43 . The HTF temperature stays constant at the melting-point during the melting process. It then increases gradually to the inlet temperature of hot water at the end of the charging phase. The time for total melting at the middle location (X/H = 0.5) is about 40 min and at the bed exit location (X/H = 0) it is about 150 min. This is due to the decrease of temperature differences between HTF and PCM, which results in a decrease in the heat transfer rate along the flow direction. It is obvious that the closer to the bed exit, the longer time for complete charging.

3.1.1. Comparison of Temperature Fields

This section demonstrates the temperature field comparisons between the different four cases shown in Figure 3. The multi-PCMs-TES case configured of [(H/3)PCM70-(H/3)PCM50-(H/3)PCM40]. This means each PCM material is packed in a tank with 1/3 of the bed height.
The axial HTF temperature profiles over the tank height after two hours of charge and discharge phases are illustrated in Figure 5a,b. In the charge phase, the PCM40 scenario is charged (stored) faster than other scenarios so that the temperature of the water reaches the maximum value. Oppositely, in the discharge phase, the PCM70 scenario is discharged (released) faster than other scenarios so that the temperature of water achieves the minimum value. Besides, the temperature distribution profiles of the multi-PCMs-TES system are located between three single-PCM cases. Thus, it assumes to show an average dynamic performance among all study cases. The HTF temperature of the multi-PCMs system presents a constant slope over the bed height in both the charging and discharging phase, which confirms that the multiple-PCMs case maintains high dynamic performance.
Figure 5c,d demonstrate the water temperature at the outlet of the bed during both charge and discharge phases. The slope of the outlet water temperature profiles clarifies the heat exchange rate between the water and the PCM fillers. As the slope becomes stepper, the heat transfer rate increases, resulting in faster heat storage or heat release [23]. In the charge phase, PCM40 exhibits a maximum performance, while PCM70 exhibits minimum performance. Oppositely, PCM70 shows the highest performance, and PCM40 shows the lowest performance during the discharge phase.
It is observed that the temperature profile of a multi-PCMs-TES system, i.e., case (d) presents a consistent performance in both charging and discharging phases. These results are confirmed with results reported in [23].

3.1.2. Comparison of Dynamic Performances

Performance indicators, such as the energy stored in both confined HTF and PCM filler materials, the total energy stored, energy recovered, and maximum bed energy stored (Qbedmax) are presented. Moreover, charging, and discharging efficiencies are presented to evaluate the performance of each case. The main indicators of performance analysis of cases (a–d) are presented in Figure 6a,b.
It is shown from Figure 6 that, the performance results show significant enhancements for the PCM40 case. PCM70 case stores and recovers the highest amount of energy of the four cases, followed by a multi-PCM case then PCM50 case. The PCM70 case is the highest in terms of charging and discharging efficiency of 99% and 90%, respectively. Compared with PCM40 case, PCM70 case exhibits a 29% increasing in the system recovered energy. A multi-PCMs case, with equal volume fractions of each layer, is the best in terms of the total energy stored and charging efficiency after PCM70 case, and also is the second of the maximum possible energy stored.
It is obvious that variations in sensible energy stored in HTF are constant for all studied cases, whereas the energy stored in the PCM increases. The increase of the latter depends on the increase in the amount of latent heat contained in different cases, which depends mainly on the thermo-physical properties of each case. The fixed amount of confined HTF in the tank contributes to a fixed sensible utilization ratio compared to a latent utilization ratio in all study cases.

3.2. Effects of Volume Fraction of PCMs

In this section, the effects of PCMs volume fraction (VF) are discussed during a single charge/discharge operation and cyclic operation, respectively. Table 3 summarizes study cases for each case/configuration considered for this analysis. The presented cases can be classified according to three PCM materials selected, forming a multi-layer PCMs thermal storage system. Values between brackets of each layer in Table 3 represent the fraction of total bed height filled by each PCM.

3.2.1. Temperature Field and Dynamic Performance during Single Charge/Discharge Phase

Figure 7 shows the PCM axial temperatures distribution of case 1 during the charging and discharging phases over the bed height at different time instants. During the charging phase, the initial temperature of the confined water and the PCMs filler is kept at 30 , and the multi-PCMs are in the solid-state (LF = 0). In general, the PCM axial temperature distribution of multi-PCMs configurations is different in evolution trend than a single PCM-layer configuration. As shown in Figure 7a when t = 0 min, the hot water introduced at the top of the tank (X/H = 1) with a temperature of 80 , results in the heat exchange mechanism between the hot fluid introduced and the cold bed fillers (three PCMs). The incoming hot water, resulting in the melting of the PCM70 in the upper layer, followed by melting of the PCM50 in the middle layer, and finally melting the PCM40 in the lower layer. It is observed that when t = 360 min, the multi-PCMs-TES system is completely charged (all PCMs melted) and attains the hot water inlet temperature of 80 .
Figure 7b shows the PCM axial temperature distribution at different time moments during the discharging phase. The initial temperature of the confined water and the PCMs filler is kept at 80 , and the multi-PCMs are in the molten state (LF = 1). Once the discharging phase starts, when t = 0 min, the cold water introduced at the bottom of the tank (X/H = 0) with a temperature of 30 , results in the heat transfer mechanism between the hot and molten PCMs and the incoming cold water. The incoming cold water, resulting in the faster solidification of encapsulated paraffin wax (PCM40) in the lower layer, then solidifying the PCM50 layer, and finally solidifying the PCM70 in the upper layer. It is clear that when t = 270 min, the multi-PCMs -TES system is completely discharged (all PCMs solidified) and reaches the inlet temperature of the cold water (30 ).
Figure 7c,d show the HTF temperature profiles over the bed height, after 90 min of starting the charge and discharge phases, for all cases. The higher the HTF temperature, the faster bed is charged (melted) or discharged (solidified). For the charge phase, case 2 is charged and melted faster than other cases 1, 3, and 4, respectively. This may be attributed to the higher temperature difference between the HTF and the PCM temperature at the first periods of charging, which promotes the heat transfer efficiency between the heat transfer fluid and PCMs capsules. In case 2, the total amount of heat storage in the bed was 36.8 kWh, which is the highest among various cases. Oppositely, during the discharging phase, case 4 is discharged (solidified) faster than other cases 1, 3, and 2, respectively. Compared with all cases, case 2 achieves higher energy stored during charging, this is due to the higher amount of latent heat contained in this case configuration.
Figure 8a,b present the system energy efficiency and the total utilization ratio of the different multi-PCMs-TES systems. It is obvious that case 2 shows higher dynamic performance, in terms of overall efficiency, followed by cases 1, 3, and 4, respectively. Also, case 3 is the best in terms of total utilization ratio, followed by case 4, 1, and 2 respectively. It is evident that, when the multi-PCMs-TES system is operated under complete charging and discharging phases, the effects of the volume fraction of PCMs do not imply significant variations on the system dynamic performance. The above discussion has confirmed the conclusion reported in [23]. Hence, this parameter is discussed in the following section to verify its effects when the TES system operates under multiple charging and discharging cycles.

3.2.2. Temperature Field and Dynamic Performance during Cyclic Operation

Figure 9 shows the effects of the PCM volume fraction on the system dynamic performance under cyclic operation for different cases listed in Table 3. The cut-off temperature of charging was 49.5 , whereas for discharging was 67 . The system is operated until reaches the steady-state period.
Figure 9a illustrates the axial temperature distribution of HTF during the cyclic operation of multi-PCMs-TES system configurations at the final charging/discharging state. As shown in Figure 9a, it is obvious that the VF of PCM40 has respectable effects on the established temperature distribution over the multi-PCMs-TES system and the system’s dynamic performance. For the charge profiles, case 4 is charged faster than other cases, in which its temperature achieves the peak value, while case 2 achieves the longest charging period with a minimum temperature value of HTF. For the discharge profiles, case 4 is the quickest to discharge, therefore the temperature value of HTF attains the highest one, while case 3 is the longest to discharge. It is also clear that the differences in the area between charge and discharge temperature profiles for all cases may be due to the selected cut-off temperatures.
Compared with case 1, the higher the volume fraction (VF) of PCM70 layer than the PCM50 and PCM40 layers, the higher the heat storage and release periods, and therefore, the higher the energy storage capacity. For instance, the heat storage period increases from 65 min to 68 min, when PCM70 layer on the top increases from 33.33% to 50%. Besides, the total energy stored increases from 12 kWh to 12.5 kWh, respectively, as shown in Figure 9b. This leads to allowing the storage device to store for longer periods and to release additional heat at a higher rate. It is also observed that increasing the volume fraction of PCM40 layer than the PCM70 and PCM40 layers, has noticeable effects on the quantity of heat stored in the confined water inside the tank and the heat stored in PCMs. For example, the sensible energy stored in the confined water increases from 5.9 kWh to 6.52 kWh as the PCM40 volume fraction increases from 33.33% to 50%. Besides, the energy stored in PCMs decreases from 6.1 kWh to 5.1 kWh.
Figure 9c,d show the variation of system efficiencies, capacity ratio, and total utilization ratio. It is clear that performance findings revealed significant improvements for case 1. Case 2 is the first of the highest transient behavior in terms of total utilization ratio and overall efficiency, followed by case 1, then case 3, and finally case 4. Compared with case 4, case 2 exhibits a 13.7% and 25% increase in the system’s overall efficiency and total utilization ratio, respectively. While, case 4 exhibits a 21.8% increase in the system capacity ratio, compared with case 2. This increase in capacity ratio than utilization ratio is due to a longer charging period than discharging period in all cases.

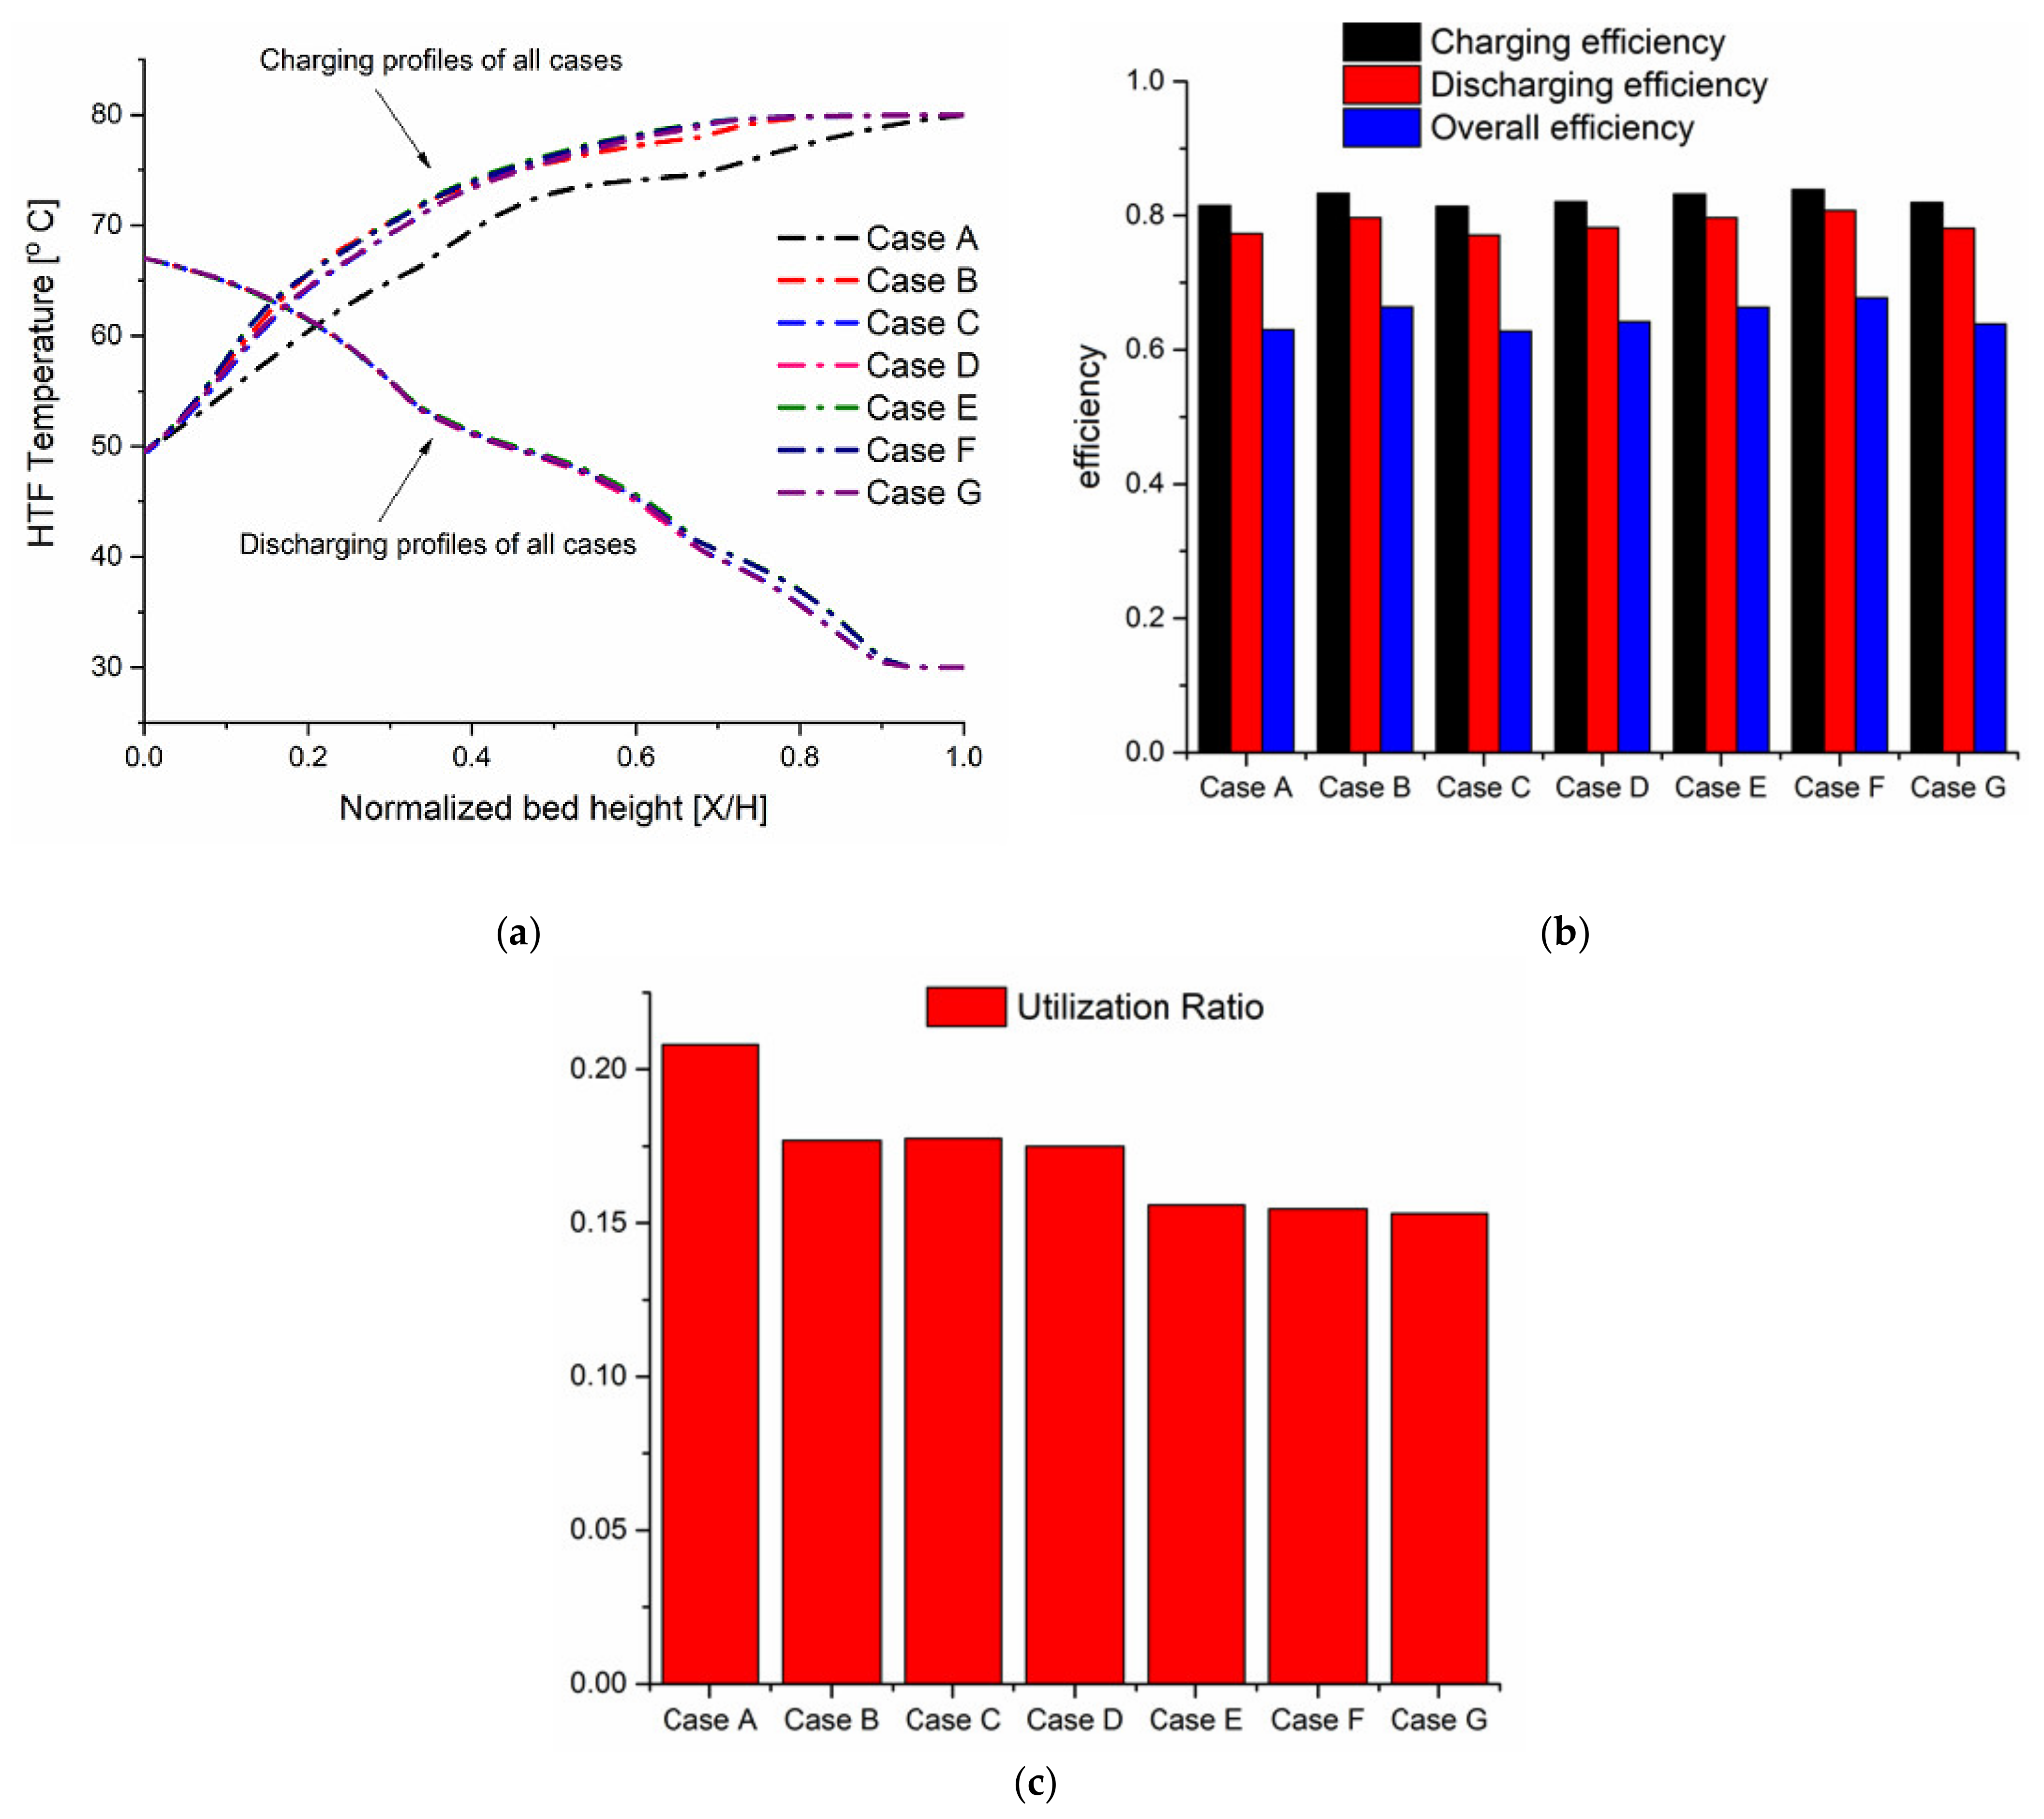
3.3. Effect of Inverse Stefan Number on the Multi-PCM-TES System

The inverse Stefan number is the ratio of the latent heat of fusion within the PCM to the sensible heat capacity, and is expressed as follows [34]:
InvSte = L f u s C p a v e T c h T d i s c h
The effect of inverse Stefan number (InvSte) on the dynamic performance of a multi-layer PCM-TES system is evaluated in this section. As stated before, the packed-bed under study consists of three layers of PCM materials, every layer of PCM capsules comprises one-third of the total tank height. The melting temperature drops in value from the upper PCM layer to the lower one within the TES system. In case A, all layers of PCMs are assumed to have the same latent heat and thus the same inverse Stefan number. In cases, B-D, one of the PCM layers is assumed to have a higher latent heat among the three layers, and this value is transferred from one cascade to the next, and the last cases, E-G, apply a high inverse Stefan number to two PCM layers among three to predict any benefits on the dynamic behavior. The cut-off temperatures of both charging and discharging are 49.5 and 67 , respectively. Table 4 summarizes all the cases studied.

Temperature Field and Dynamic Performance under Cyclic Operation

Figure 10 presents the axial temperature distribution for both charging and discharging phases as well as the performance indicators with different inverse Stefan numbers for all study cases.
Figure 10a illustrates the effects of inverse Stefan number (InvSte) on the axial temperature profiles of charging and discharging processes for all cases at the final state. During the charge phase, it is apparent that case A is charged slower than other cases, as the HTF temperature achieves the minimum value. All the charging profiles of other cases B-G show slight differences between them compared to case A. Besides, all cases are charged within a period ranging from 65 to 67 min. Hence, the effect of inverse Stefan number of multiple-PCM has no significant impact on the charging and discharging time. In case A, the TES system stores 81.5% of the total input energy, whereas it stores 83.3% in cases B and E, 81.4% in case C, 82% in cases D and G, and 83.9% in case F as shown in Figure 10b.
During the discharge phase, there are no significant differences in the discharge profiles which they characterized by a high degree of congruence if the system operates with the different values of latent heat. Thus, is difficult to identify the fastest/lowest discharged case from the graphs. All cases are discharged in 55 min, and the amount of heat recovered from each case is to some extent close. In case A, the TES system recovers 77.23% from the total energy stored, while it recovers 79.7% in cases B and E, 77.1% in case C, 78.2% in cases D and G, and 80.8% in case F as shown in Figure 10b.
It can be concluded that, when the middle and bottom PCMs have a high latent heat value (case E), the TES-system behaves in the same way as the condition when only the bottom PCM has a high latent heat (case B) in terms of system energy efficiency. Moreover, the scenario in which top PCMs have a high latent heat value (case D) shows the same system efficiency as the scenario in which the top and middle PCMs have a high latent heat value (Case G). The scenario in which the middle PCM has lower latent heat (case F), exhibits the highest promotion among the other three-PCMs cascades, in terms of system energy efficiency.
The effects of inverse Stefan number on the system utilization rate are evident in Figure 10c. One can observe, case A achieves the highest performance in terms of a total utilization ratio of 20.8%, followed by cases (B–D), and then cases (E–G). Case C is 14.8% higher than that of case F and 17.18% lower than that of case A. The total utilization ratio of case B is 14.4% higher than that of case E, this may be due to an improvement in both sensible and latent utilization ratios of case B.
It is clear that the two scenarios in which one layer of three PCMs allocated a higher inverse Stefan number, and the scenario in which two layers of three PCMs allocated a higher inverse Stefan number, show no significant differences in total utilization ratio.
The above discussion reveals that the effects of inverse Stefan number have significant effects on the performance and output of the three-PCM system.

4. Practical Significance and Usefulness

Based on the findings from this research, the results may be beneficial for the design and optimization of the water thermocline tank packed with a single-PCM and multiple-PCM, which integrated with combined heat and power units for district heating during the peak-shaving periods. Besides, this study gives dynamic performance guidelines of a new multiple-PCM heat storage system compared to various single-PCM systems, to identify the feasibility analysis of such system if it’s applied on a commercial scale.

5. Conclusions

A transient one-dimensional concentric-dispersion model has been developed to investigate the single charging/discharging processes and cyclic operation of a single and multi-layer packed-bed thermocline tank filled with encapsulated paraffin wax as phase change material. Comparisons between single-PCM and multi-PCM-TES systems are firstly analyzed. The effects of various operating parameters, such as the PCMs volume fraction and the inverse Stefan number on the dynamic performance have also been investigated. The following conclusions are summarized:
(1)
During a single charge/discharge phase, the single-PCM70 system is the highest performance, followed by the multi-PCM system. Besides, the multi-PCM system shows an average dynamic performance compared to the three-single PCM systems.
(2)
The effects of PCMs volume fraction do not add any significant differences in the system performance when the multi-PCM system is operated in a single charge/discharge phase.
(3)
During cyclic operation, the higher the volume fraction of a PCM70 layer, the higher the heat storage and release periods and, therefore, the higher the energy storage and release.
(4)
The effect of the inverse Stefan number has a strong influence on the dynamic performance. The TES system in which the middle and bottom PCMs have a high inverse Stefan number exhibits the same dynamic performance. The scenario in which the middle PCM has lower latent heat is most beneficial in terms of system energy efficiency.
The present study indicates some areas that require further investigations to understand the various mechanisms of thermal energy storage for low-temperature applications. Taking the present study as a reference, it is suggested that an extension of experimental and numerical investigation can be planned to cover the points stated below:
(1)
Due to the relatively low cost of both construction and operation of a water tank as well as the manufacturing of PCM capsules is very expensive. Besides, there are numerous technical issues in implementing encapsulation methods that can sustain thousands of thermal cycles. Hence, it is possible to propose a suitable packed-bed TES system pursuing economic and social benefits. The proposed system consists of a mixture of solid material and paraffin wax PCM capsules. The primary concept behind such arrangements is the use of high and low melting temperature PCM as filler material at the top and bottom of the tank close to the inlet/outlet ports while the solid filler is placed between the two PCM. The possible use of low-cost solid filler (quartzite rock or slag pebbles) with the high-cost PCM capsules reduces the capital cost of a TES system and to be more reliable for the heat-supply net.
(2)
Subsequent studies should focus on the feasibility and economic analyses of various volume fractions of PCM combined with solid filler within a thermocline tank to optimize the arrangement that achieves the highest performance with the lowest capital costs.

Author Contributions

H.G.: Investigation, Data curation, Writing-original draft preparation. E.S.E.: Methodology, Investigation, Data curation, Formal analysis, Visualization, Writing-original draft preparation, Writing-review and editing. Z.L.: Supervision and Reviewing. X.D.: Conceptualization, Supervision, Funding acquisition. All authors have read and agreed to the published version of the manuscript.

Funding

This research was funded by the National Natural Science Foundation of China (No. 52090062 and 51821004).

Institutional Review Board Statement

Not applicable.

Informed Consent Statement

Not applicable.

Data Availability Statement

Not applicable.

Acknowledgments

The financial supports from the National Natural Science Foundation of China (No. 52090062 and 51821004) are gratefully acknowledged.

Conflicts of Interest

The authors declare no conflict of interest.

Nomenclature

Aarea, m2
asinterfacial area density, 1/m
cpspecific heat at constant pressure, kJ/kg.K
CRcapacity ratio
Ddiameter, m
Dpparticle size diameter, m
Eenergy, J
EVexperimental value
Hheight, m
InvSteinverse Stefan number
hiinner wall heat loss coefficient, W/m2.K
hpparticle convective heat transfer coefficient, W/m2.K
hvvolumetric heat transfer coefficient, W/m3.K
kthermal conductivity, W/m.K
kHTF,effliquid effective thermal conductivity, W/m.K
Lfuslatent heat of fusion, kJ/kg
LFliquid fraction
m fluid mass flow rate, kg/s
NuNusselt number
Nxnodes in the axial direction
PrPrandtl number
Δ P pressure drop across the bed, Pa
Qbedmaxmaximum storage capacity of the bed, J
ReReynolds number
Rxnodes within each sphere
rradial direction within a sphere
ttime, s
Ttemperature, K
Tmmelting temperature, K
Tm1the peak temperature of PCM during solid-solid transition, K
Tm2the peak temperature of PCM during solid-liquid transition, K
TVtheoritical value
Δ T temperature differnce, K
Uinlet fluid velocity, m/s
UWoverall heat transfer coefficient between the tank and the surroundings, W/m2.K
Vtankvolume of the tank, m3
URtotal utilization ratio
X/Hnormalized bed height
Greek symbols
ε porosity of packed-bed region
η efficiency
β volumetric heat expansion coefficient of fluid, 1/K
α a x axial thermal diffusivity, m2/s
ρ density, kg/m3
μ dynamic viscosity, kg/m.s
Subscripts
aveaverage
bedpacked-bed
chcharging phase
dischdischarging phase
HTFheat transfer fluid
ininlet
exexit
infambient
inpinput
jindex of insulation layer
lliquid state of PCM
mmelting point
pparticle of PCM
pumppumping
ssolid state of PCM

References

  1. Sun, F.; Cheng, L.; Fu, L.; Gao, J. New low temperature industrial waste heat district heating system based on natural gas fired boilers with absorption heat exchangers. Appl. Therm. Eng. 2017, 125, 1437–1445. [Google Scholar] [CrossRef]
  2. Zhang, Y.; Tang, N.; Niu, Y.; Du, X. Wind energy rejection in China: Current status, reasons and perspectives. Renew. Sustain. Energy Rev. 2016, 66, 322–344. [Google Scholar] [CrossRef] [Green Version]
  3. Wang, H.; Yin, W.; Abdollahi, E.; Lahdelma, R.; Jiao, W. Modelling and optimization of CHP based district heating system with renewable energy production and energy storage. Appl. Energy 2015, 159, 401–421. [Google Scholar] [CrossRef]
  4. Xu, C.; Wang, Z.; He, Y.; Li, X.; Bai, F. Sensitivity analysis of the numerical study on the thermal performance of a packed-bed molten salt thermocline thermal storage system. Appl. Energy 2012, 92, 65–75. [Google Scholar] [CrossRef]
  5. Pacheco, J.E.; Showalter, S.K.; Kolb, W.J. Development of a molten-salt thermocline thermal storage system for parabolic trough plants. J. Sol. Energy Eng. Trans. ASME 2002, 124, 153–159. [Google Scholar] [CrossRef]
  6. He, Z.; Qian, Y.; Xu, C.; Yang, L.; Du, X. Static and dynamic thermocline evolution in the water thermocline storage tank. Energy Procedia 2019, 158, 4471–4476. [Google Scholar] [CrossRef]
  7. Karim, A.; Burnett, A.; Fawzia, S. Investigation of stratified thermal storage tank performance for heating and cooling applications. Energies 2018, 11, 1049. [Google Scholar] [CrossRef] [Green Version]
  8. Nelson, J.E.B.; Balakrishnan, A.R.; Murthy, S.S. Experiments on stratified chilled-water tanks. Int. J. Refrig. 1999, 22, 216–234. [Google Scholar] [CrossRef]
  9. Cabeza, L.F.; Ibáñez, M.; Solé, C.; Roca, J.; Nogués, M. Experimentation with a water tank including a PCM module. Sol. Energy Mater. Sol. Cells 2006, 90, 1273–1282. [Google Scholar] [CrossRef]
  10. Castell, A.; Solé, C.; Medrano, M.; Nogués, M.; Cabeza, L.F. Comparison of stratification in a water tank and a PCM-water tank. J. Sol. Energy Eng. Trans. ASME 2009, 131, 0245011–0245015. [Google Scholar] [CrossRef]
  11. Oró, E.; Castell, A.; Chiu, J.; Martin, V.; Cabeza, L.F. Stratification analysis in packed bed thermal energy storage systems. Appl. Energy 2013, 109, 476–487. [Google Scholar] [CrossRef]
  12. Xia, L.; Zhang, P.; Wang, R.Z. Numerical heat transfer analysis of the packed bed latent heat storage system based on an effective packed bed model. Energy 2010, 35, 2022–2032. [Google Scholar] [CrossRef]
  13. Zhao, W.; Neti, S.; Oztekin, A. Heat transfer analysis of encapsulated phase change materials. Appl. Therm. Eng. 2013, 50, 143–151. [Google Scholar] [CrossRef]
  14. Nallusamy, N.; Sampath, S.; Velraj, R. Experimental investigation on a combined sensible and latent heat storage system integrated with constant/varying (solar) heat sources. Renew. Energy 2007, 32, 1206–1227. [Google Scholar] [CrossRef]
  15. He, Z.; Wang, X.; Du, X.; Amjad, M.; Yang, L.; Xu, C. Experiments on comparative performance of water thermocline storage tank with and without encapsulated paraffin wax packed bed. Appl. Therm. Eng. 2019, 147, 188–197. [Google Scholar] [CrossRef]
  16. Wu, S.; Fang, G.; Liu, X. Dynamic discharging characteristics simulation on solar heat storage system with spherical capsules using paraffin as heat storage material. Renew. Energy 2011, 36, 1190–1195. [Google Scholar] [CrossRef]
  17. He, Z.; Wang, X.; Du, X.; Xu, C.; Yang, L. Cyclic characteristics of water thermocline storage tank with encapsulated PCM packed bed. Int. J. Heat Mass Transf. 2019, 139, 1077–1086. [Google Scholar] [CrossRef]
  18. Du, X.; He, Z.; Wang, X.; Xu, C.; Yang, L. Unsteady characteristics of water thermocline storage tank with encapsulated paraffin wax packed bed. In Proceedings of the International Heat Transfer Conference, Beijing, China, 10–15 August 2018; pp. 4287–4294. [Google Scholar]
  19. Domański, R.; Fellah, G. Exergy analysis for the evaluation of a thermal storage system employing PCMS with different melting temperatures. Appl. Therm. Eng. 1996, 16, 907–919. [Google Scholar] [CrossRef]
  20. Nkwetta, D.N.; Vouillamoz, P.E.; Haghighat, F.; El-Mankibi, M.; Moreau, A.; Daoud, A. Impact of phase change materials types and positioning on hot water tank thermal performance: Using measured water demand profile. Appl. Therm. Eng. 2014, 67, 460–468. [Google Scholar] [CrossRef]
  21. Gong, Z.X.; Mujumdar, A.S. Thermodynamic optimization of the thermal process in energy storage using multiple phase change materials. Appl. Therm. Eng. 1997, 17, 1067–1083. [Google Scholar] [CrossRef]
  22. Kousksou, T.; Strub, F.; Lasvignottes, J.C.; Jamil, A.; Bédécarrats, J.P. Second law analysis of latent thermal storage for solar system. Sol. Energy Mater. Sol. Cells 2007, 91, 1275–1281. [Google Scholar] [CrossRef]
  23. Aldoss, T.K.; Rahman, M.M. Comparison between the single-PCM and multi-PCM thermal energy storage design. Energy Convers. Manag. 2014, 83, 79–87. [Google Scholar] [CrossRef]
  24. ELSihy, E.S.; Wang, X.; Xu, C.; Du, X. Investigation on Simultaneous Charging and Discharging Process of Water Thermocline Storage Tank Employed in Combined Heat and Power Units. J. Energy Resour. Technol. 2020, 143. [Google Scholar] [CrossRef]
  25. de Gracia, A.; Cabeza, L.F. Numerical simulation of a PCM packed bed system: A review. Renew. Sustain. Energy Rev. 2017, 69, 1055–1063. [Google Scholar] [CrossRef] [Green Version]
  26. Leiva, L. Heat and Mass Transfer in Packed Beds. pages. AICHE J. 1983, 29, 1055. [Google Scholar] [CrossRef]
  27. Wakao, N.; Kaguei, S.; Funazkri, T. Effect of fluid dispersion coefficients on particle-to-fluid heat transfer coefficients in packed beds. Correlation of nusselt numbers. Chem. Eng. Sci. 1979, 34, 325–336. [Google Scholar] [CrossRef]
  28. Abdulla, A.; Reddy, K.S. Effect of operating parameters on thermal performance of molten salt packed-bed thermocline thermal energy storage system for concentrating solar power plants. Int. J. Therm. Sci. 2017, 121, 30–44. [Google Scholar] [CrossRef]
  29. Hänchen, M.; Brückner, S.; Steinfeld, A. High-temperature thermal storage using a packed bed of rocks—Heat transfer analysis and experimental validation. Appl. Therm. Eng. 2011, 31, 1798–1806. [Google Scholar] [CrossRef]
  30. Beek, J. Design of Packed Catalytic Reactors. Advances in Chemical Engineering; Elsevier: Amsterdam, The Netherlands, 1962; pp. 203–271. [Google Scholar]
  31. Gonzo, E.E. Estimating correlations for the effective thermal conductivity of granular materials. Chem. Eng. J. 2002, 90, 299–302. [Google Scholar] [CrossRef]
  32. Gunarathne, D.S.; Chmielewski, J.K.; Yang, W. Pressure drop prediction of a gasifier bed with cylindrical biomass pellets. Appl. Energy 2014, 113, 258–266. [Google Scholar] [CrossRef]
  33. Elfeky, K.E.; Mohammed, A.G.; Ahmed, N.; Lu, L.; Wang, Q. Thermal and economic evaluation of phase change material volume fraction for thermocline tank used in concentrating solar power plants. Appl. Energy 2020, 267. [Google Scholar] [CrossRef]
  34. Bellan, S.; Alam, T.E.; González-Aguilar, J.; Romero, M.; Rahman, M.M.; Goswami, D.Y.; Stefanakos, E.K. Numerical and experimental studies on heat transfer characteristics of thermal energy storage system packed with molten salt PCM capsules. Appl. Therm. Eng. 2015, 90, 970–979. [Google Scholar] [CrossRef]
  35. Jegadheeswaran, S.; Pohekar, S.D.; Kousksou, T. Exergy based performance evaluation of latent heat thermal storage system: A review. Renew. Sustain. Energy Rev. 2010, 14, X2580–X2595. [Google Scholar] [CrossRef]
Figure 1. (a) Schematic diagram of the packed-bed TES system employed in CHP units [15], (b) Numerical domain of concentric-dispersion model.
Energies 14 02175 g001aEnergies 14 02175 g001b
Figure 2. Validation of numerical model with experimental results during the charging process [14]. Validation was performed under a charging inlet HTF temperature of 70 , a discharging temperature of 32 , a charging water flow rate of 2 l/min, a capsule size of 0.052 m, and a bed porosity of 0.5.
Energies 14 02175 g002
Figure 3. Schematic diagram of various PCMs arrangements in a packed-bed thermocline tank.
Energies 14 02175 g003
Figure 4. Case (a). Comprehensive temperature field; (a) axial temperature distribution over the bed height at different time instants, (b) temperature variations with charging time at various axial positions. The charging inlet HTF temperature of 80 and a discharging temperature of 30 , a capsule size of 0.042 m, and a bed porosity of 0.379.
Energies 14 02175 g004
Figure 5. Cases (ad). Comprehensive temperature field comparisons between different four cases, (a) HTF temperature profiles after 120 min of charging time, (b) HTF temperature profiles after 120 min of discharging time, (c) HTF temperature at the bed exit section during the charging process, and (d) HTF temperature at the bed exit section during the discharging process.
Energies 14 02175 g005
Figure 6. Performance analysis comparisons of different cases of PCM TES systems at the final charging and discharging state, (a) distribution of energy stored and recovered for all cases, (b) distribution of charging and discharging efficiencies for all cases.
Energies 14 02175 g006
Figure 7. (a,b): Axial temperature profiles of PCM during charging and discharging phases; (c,d): HTF temperature profiles after 90 min of charging and discharging phases for all cases (1–4).
Energies 14 02175 g007aEnergies 14 02175 g007b
Figure 8. Performance analysis comparisons for various cases under the effect of PCMs volume fraction during a single charging and discharging phases, (a) distribution of charging, discharging, and overall efficiencies for all cases, (b) distributions of total utilization ratio for all cases.
Energies 14 02175 g008
Figure 9. The effects of PCM volume fraction on the system dynamic performance during cyclic operation for different cases, (a) HTF temperature profiles at the final charging and discharging state, (b) distribution of energy stored and recovered for all cases, (c) distribution of charging, discharging, and overall efficiencies for all cases, (d) distributions of capacity ratio and total utilization ratio for all cases.
Energies 14 02175 g009aEnergies 14 02175 g009b
Figure 10. The effects of inverse Stefan number on the system dynamic performance during cyclic operation for different cases, (a) HTF temperature profiles of at the final charging and discharging state, (b) distribution of charging, discharging, and overall efficiencies for all cases, (c) distributions of total utilization ratio for all cases.
Energies 14 02175 g010
Table 1. Material properties and simulation parameters of thermocline tank [15].
Simulation ParametersValue
Height of the tank0.9 m
Diameter of the tank0.9 m
Volume of the tank0.57255 m3
Tank wall thickness (stainless steel)0.006 m
Outer insulation layer thickness (asbestos)0.035 m
Tank wall thermal conductivity15.3 W/m.K
Insulation layer thermal conductivity0.034 W/m.K
Number of PCM capsules9170
Outer diameter of PCM capsule0.042 m
Ambient temperature15
Shell thickness of PCM capsule0.5 mm
Bed porosity0.379
Bed volume0.356 m3
Volume of confined HTF0.217 m3
PCM shell specific heat500 J/kg.K
PCM shell thermal conductivity15.3 W/m.K
PCM shell density7930 kg/m3
Heat transfer fluid (HTF)water
Operating temperature range of HTF80/30
Volume flow rate of HTF0.3 m3/h
Nodes in the axial direction (Nx)296
Nodes within each sphere (Rx)30
Table 2. Thermo-physical properties of various PCM materials.
PropertyPCM40 [23]PCM50 [23]PCM70 [17]
Solid density, kg/m3844848838
Liquid density, Kg/m3760767834
Solid specific heat at constant pressure, J/kg.K205216502150
Liquid specific heat at constant pressure, J/kg.K241118632190
Solid thermal conductivity, W/m.K0.40.40.21
Liquid thermal conductivity, W/m.K0.150.150.21
Latent heat of fusion, kJ/kg168200254
Melting temperature, 435168
Table 3. The volume fraction (VF) of each layer for different study cases.
Case No.Top Layer, PCM70Middle Layer, PCM50Bottom Layer, PCM40
1VF = (H/3)VF = (H/3)VF = (H/3)
2VF =(H/2)VF = (H/4)VF = (H/4)
3VF = (H/4)VF = (H/2)VF = (H/4)
4VF = (H/4)VF= (H/4)VF= (H/2)
Table 4. Inverse Stefan number and melting temperature for all study cases.
Case No.Top PCM70
T m   =   68  
Middle PCM50
T m   =   51  
Bottom PCM40
T m   =   43  
AInvSte = 2.34InvSte = 2.28InvSte = 1.51
BInvSte = 2.34InvSte = 2.28InvSte = 3.02
CInvSte = 2.34InvSte = 4.56InvSte = 1.51
DInvSte = 4.68InvSte = 2.28InvSte = 1.51
EInvSte = 2.34InvSte = 4.56InvSte = 3.02
FInvSte = 4.68InvSte = 2.28InvSte = 3.02
GInvSte = 4.68InvSte = 4.56InvSte = 1.51
Publisher’s Note: MDPI stays neutral with regard to jurisdictional claims in published maps and institutional affiliations.

