
A General Framework for Multi-Criteria Based Feasibility Studies for Solar Energy Projects: Application to a Real-World Solar Farm


 ,
,  , , and
Abstract
1. Introduction
1.1. Multi-Criteria Decision Analysis (MCDA) for Sustainable Energy Decision Making
1.2. MCDA for Hybrid Energy System Sustainability
1.3. MCDA for Solar Energy Technology Assessment
- Identifying the relevant performance indicators of a solar energy project and proposing a scoring framework for key criteria.
- A new robust and flexible MCDA methodology for feasibility analysis of solar energy projects is proposed.
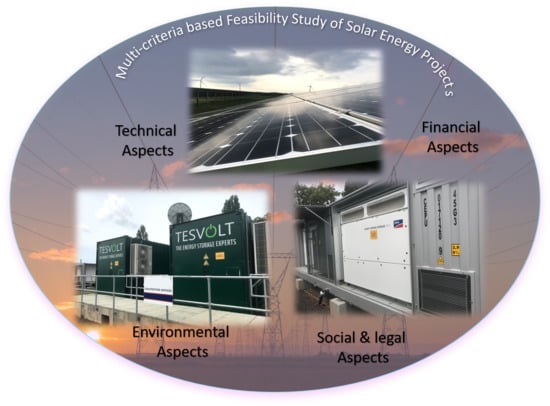
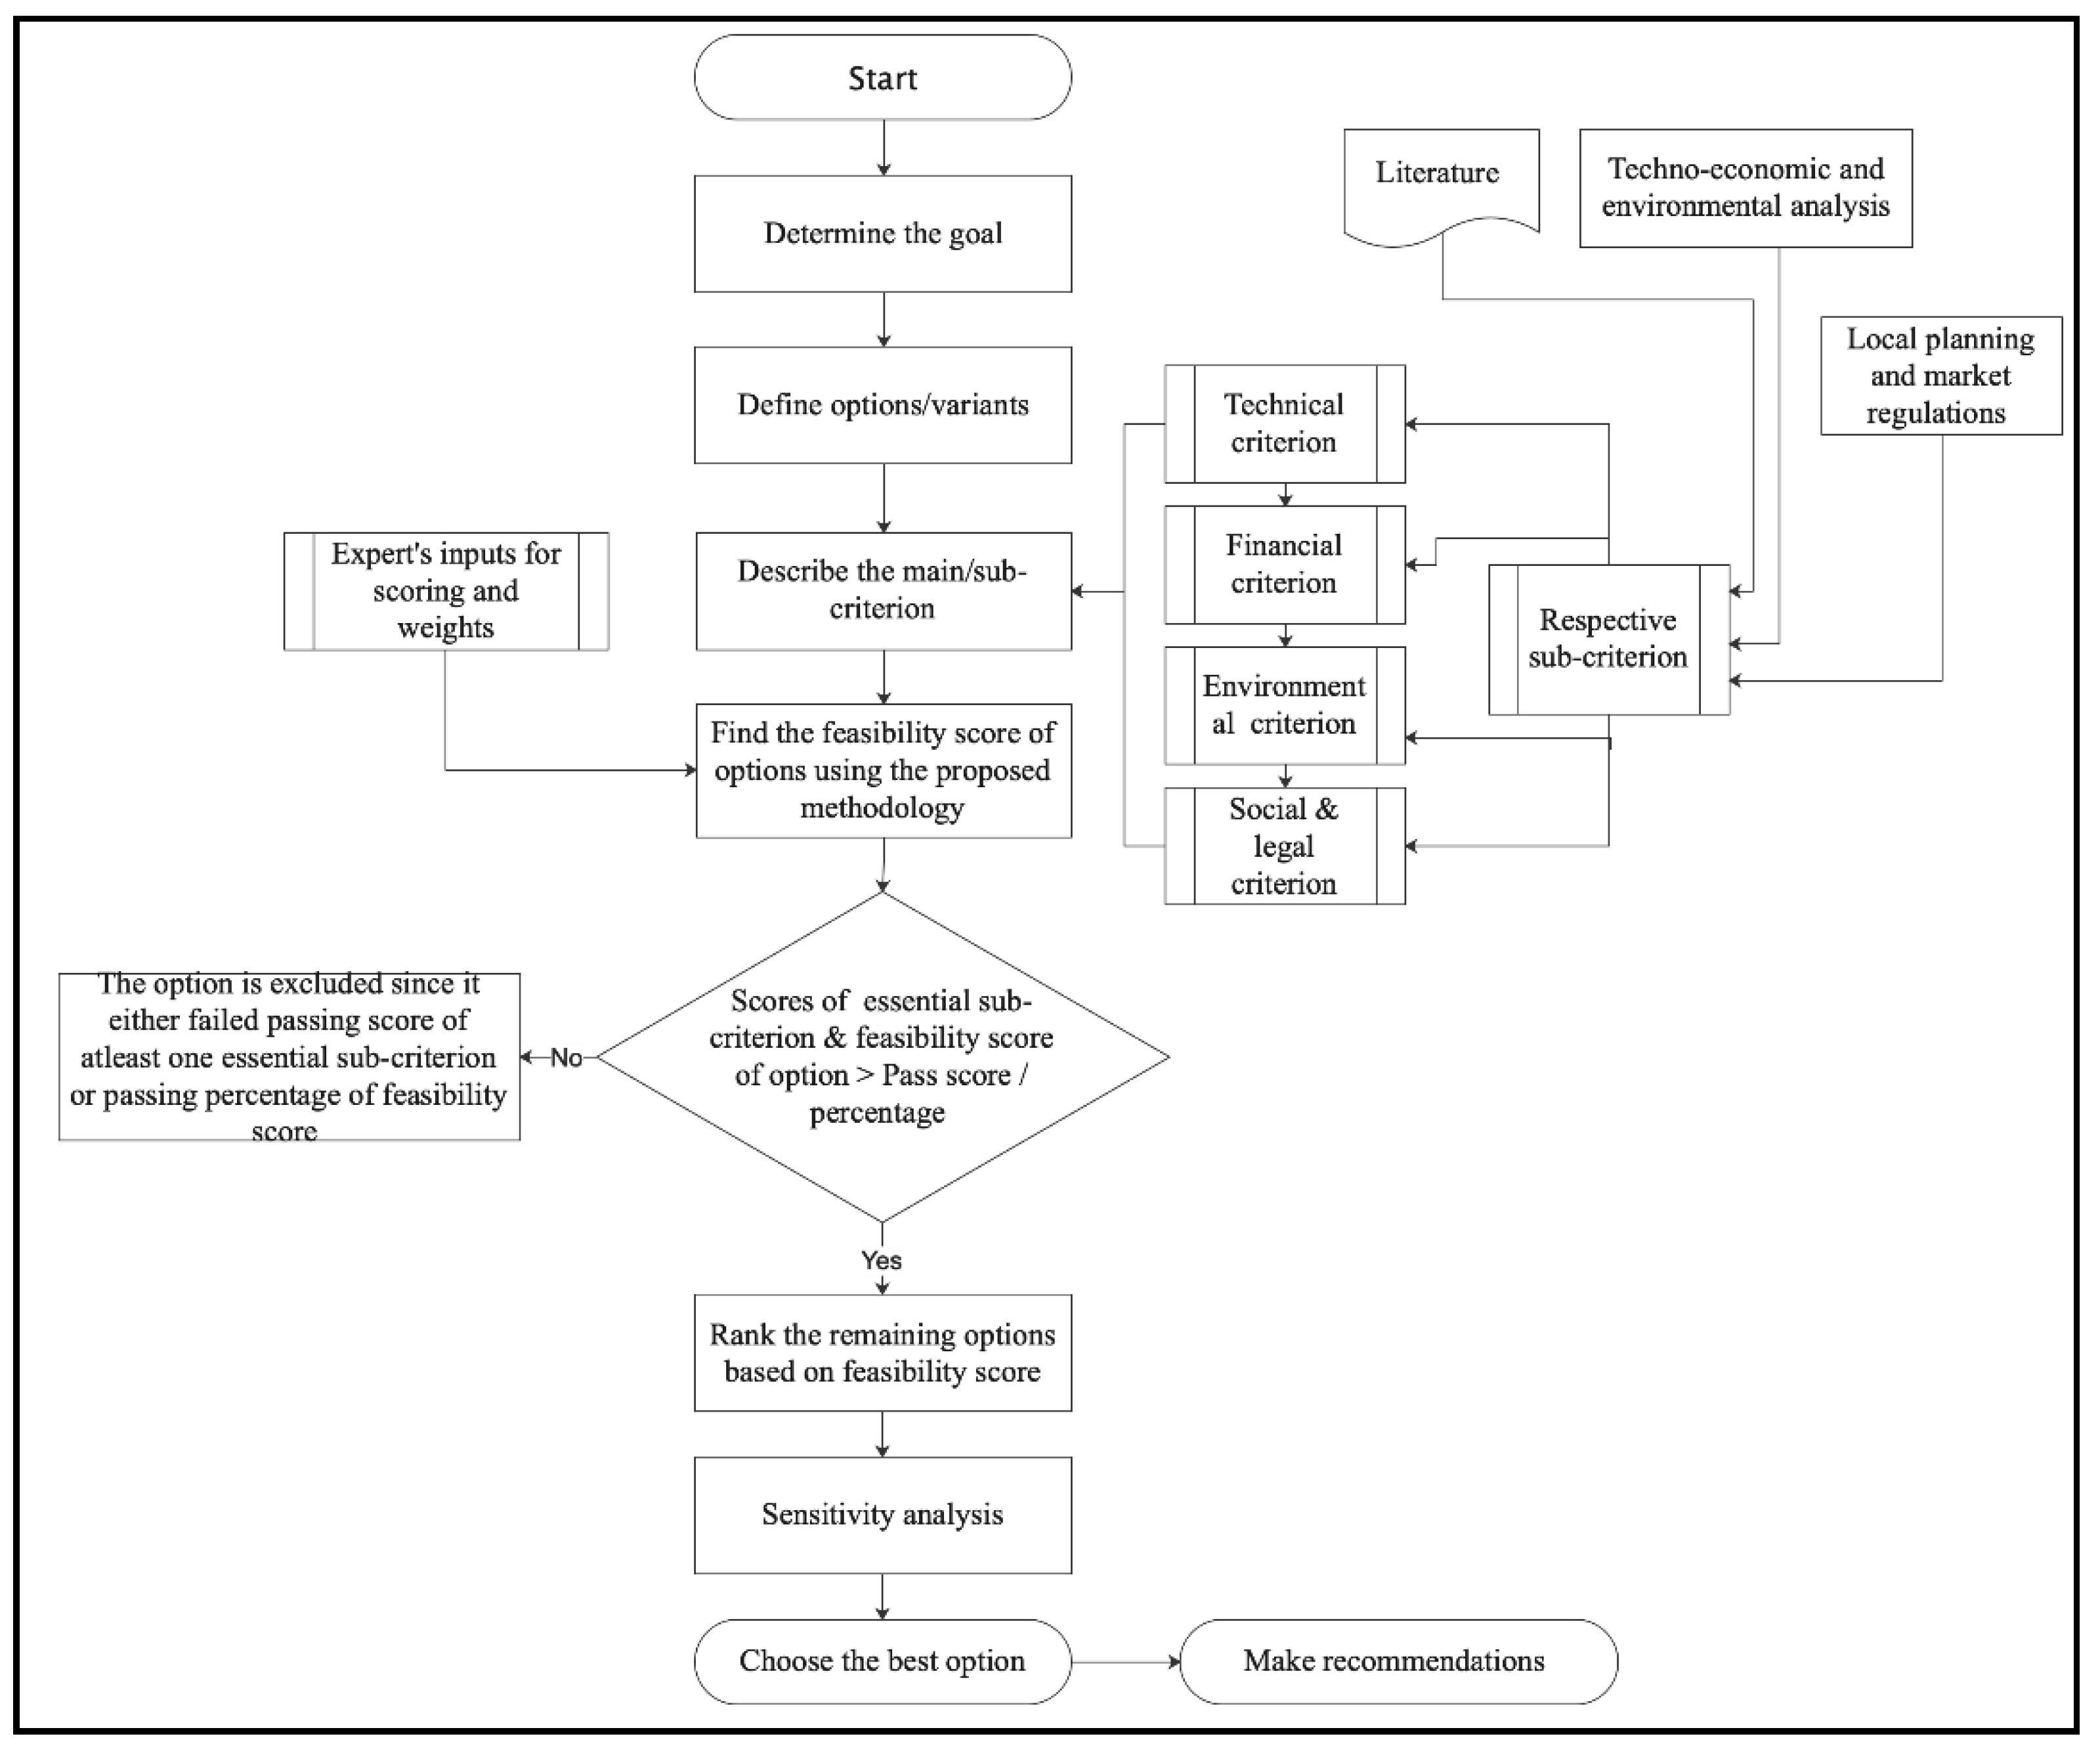
2. Methodology
2.1. Technical Aspects
2.1.1. Energy Production and Self-Consumption
- Estimated energy yield: this is an estimation of the amount of energy to be produced by the solar plant. Typically, a software package is employed to provide the estimated yield after losses with different levels of sophistication, depending on the purpose of the estimate. Although this value has well known financial implications, considering the energy yield as a sub-criterion is useful when comparing different options (for instance, different panel technologies and different areas). The score can be assigned depending on how the energy yield compares with other options being considered.
- Self-consumption fraction: this is the percentage of energy that is locally consumed (as opposed to energy exported to the main grid) with respect to the total energy yield after losses. The amount of energy consumed through power purchase agreements can also be counted towards self-consumption, as this is energy that is not being exported to the main grid. High scores can be assigned to options with higher self-consumption percentage. This sub-criterion is not relevant for installations that are principally intended to export energy to the main grid.
2.1.2. Site Aspects
- Features of land/roof area: this sub-criterion is intended to capture how easy it would be to mount the solar equipment. A high score should be given for a standard installation where no additional work is needed, and the score can be lowered appropriately where there are features of the land or roof that would require additional work to prepare the surface where the panels are to be installed. The scoring key is described in Table 5.
- Ease of connection to grid or local heat network: this integration can be technically easy or difficult depending on the site. A high score should be given when the connection to the grid or local heat network is straightforward, with very little or no additional work, equipment and materials required, and a lower score can be given when significant additional work, equipment and materials are needed to establish a connection to the electricity grid or local heat network. If the installation is intended to be off-grid or not connected to a local heat network, then the sub-criterion’s score can be set to 0, meaning that the sub-criteria is irrelevant. The scoring key is shown in Table 6.
- Presence of obtrusive objects causing shade: the presence of shade can adversely affect solar energy systems’ output. This sub-criterion is intended to capture the effect of such shade, with a high score being given when no shading is likely to affect the installation, and a lower score given if significant shade is expected to affect the installation. Table 7 is generated by considering the information in references [51,52].
2.1.3. Technology Suitability
- PV Panel efficiency: the solar panel module efficiency varies depending on the type of panel and its material. If the panel is monocrystalline, it is guaranteed to have better efficiency than a polycrystalline panel since the silicon semiconductor’s purity is higher. A thin-film panel is flexible and thin, allowing it to be shaped and mounted over roof tiles. Nevertheless, its efficiency is significantly lower than the monocrystalline and polycrystalline panels. Table 8 suggests scores for different levels of solar panel efficiency.
- PV Panel degradation: a PV module’s performance will degrade gradually due to several external factors, including environment and solar cell technology, and its ability to produce electricity for the same amount of solar irradiation will reduce over time. The panel’s thermal stresses lead to malfunction, and light-induced degradation due to ultraviolet (UV) exposure deteriorates the material, leading to cracks that can be infiltrated with water vapor and other contaminants. Another type of degradation occurs when polishing the panel surfaces as they become dirty, which can slowly deteriorate the anti-reflective coating. These factors would cause the panel to perform worse and produce a power output of approximately 90% after 12 years and 80% after 25 years (which is the average panel life). Table 9 suggests scores for different levels of degraded panel efficiency after 25 years.
- Solar PV panel manufacturer’s warranty: the warranty for solar panels ranges between 5 and 25 years, depending on the manufacturer. This is important as solar panels’ failure during the project’s life will represent extra expenditure in replacing the failed panels unless a valid manufacturer warranty is in place. In some cases, it is possible to pay an additional amount to obtain an extended warranty period. Table 10 suggests scores for different levels of solar panel manufacturer warranty. If the solar panels have a shorter warranty than the project’s expected life, it is vital to account for the cost of likely solar panel replacements during the project’s lifetime.
- Battery efficiency: batteries store chemically the electrical energy produced by solar panels to be used at a later time. This is convenient as it allows the use of any excess generation when needed, such as when the sun is not shining. Batteries are most often used in off-grid solar installations, but they are increasingly being used in on-grid installations as they promote self-consumption. Batteries incur energy losses during their operation, and their round-trip efficiency is defined as the ratio of energy output from the device to the energy input. For instance, a lead-acid-based battery’s efficiency is close to 80%, while most new lithium-based batteries can be as high as 98%, but is generally in the 92–95% range. The efficiency of a battery can be found in the manufacturer’s specifications. Table 11 gives suggested scores for different ranges of battery efficiency.
- Battery energy density: battery energy density is the amount of energy stored in the battery per unit of volume. It is very relevant to the space available for the installation of the battery system. If the battery is large and has a low energy density, it will be less desirable, especially when the installation area is limited. A small and high energy-dense battery system will cost more, nevertheless. A typical lead-acid battery has an energy density range of 60–110 kWh/m3, while a typical lithium-ion battery has an energy density range of 250–693 kWh/m3. Energy density can generally be found in the manufacturer specifications. Table 12 suggests scores for different levels of battery energy density.
- Battery cycle life: battery cycle life is the number of charge-discharge cycles a battery is expected to withstand before failing. Life can be affected by many parameters, such as the rate of charge-discharge, humidity, and temperature. Most specification sheets show the cycle of life for ambient temperature (25 °C). Battery charge and discharge rate are how fast the battery takes in energy and releases it. The depth of discharge (DOD) is the recommended capacity that the battery can be discharged. Going below the minimum DOD specified for a battery could damage it or reduce its life. For instance, lead-acid batteries typically have a cycle life in the range of 100–2000, while lithium-ion batteries typically have a life cycle range of 250–10,000. Table 13 suggests scores for different levels of battery cycle life.
- Maintenance requirements of batteries: the maintenance requirement of batteries depends on the type of battery. It is usually measured in the days or months between maintenance procedures. Table 14 shows the maintenance requirements for different types of battery and recommended scores.
- Efficiency of inverters: inverters are generally used for converting direct current (DC) electricity produced by the solar panels into alternating current (AC) electricity, thus enabling an interface to the local AC grid, sometimes through a transformer. The inverters are usually connected either in a string or central configurations. While the former is appropriate for large-scale power plants, the latter demands comparatively less specialized maintenance skills and can facilitate individual string Maximum Power Point Tracking (MPPT) [53]. An inverter’s efficiency indicates how much DC (direct current) power is converted to AC (alternating current) power after some loss in power due to heat. Also, some stand-by-power is required for keeping the inverter in powered mode. High-quality and low-quality sine wave inverters are generally rated at 90–95% and 75–85% efficiencies, respectively [54]. As in many installations, all the power generated by PV panels must be processed by inverters. Their efficiency has an impact on the actual energy yield of the installation. Table 15 suggests scores for different levels of inverter efficiency.
- Manufacturer warranty of inverters: manufacturers’ warranties of inverters range between 5 and 25 years. It is important as inverter failure during the project’s life will represent extra expenditure in replacing the failed inverter unless a valid manufacturer warranty is in place. In some cases, it is possible to pay an additional amount to obtain an extended warranty period. Table 16 suggests scores for different levels of inverter manufacturer warranty. If the inverters have a shorter warranty than the project’s expected life, it is important to account for the cost of likely inverter replacements during the project’s lifetime.
- Efficiency of solar collectors: solar thermal applications use solar collectors, which is a generic term used to refer to various systems that collect solar thermal energy. These could be, for instance, flat plate collectors, evacuated tube collectors, solar bowls, and parabolic trough collectors. The efficiency of solar collectors depends on the technology used. It is difficult to give guidelines for scoring due to the significant differences between collectors types, but the scoring described in Table 3 can be used to rank technological options that exhibit different efficiencies.
- Efficiency of the thermodynamic cycle in solar thermal systems: solar thermal applications typically involve a thermodynamic cycle. The thermodynamic cycle’s efficiency depends on the technology used and may involve different components, such as solar receivers, fluid transport through pipes, heat exchangers, heat pumps, and heat storage. The thermodynamic cycle may involve the input of energy of different types, including thermal energy and electrical energy. For example, some solar thermal systems, in addition to having thermal energy as an input, may use pumps and ventilation devices that require electrical energy. The variability of thermodynamic cycles is high, and it is not easy to discuss specific cases. In every case, a boundary needs to be defined to define the system where the thermodynamic cycle’s efficiency is to be calculated. Efficiency is defined as the energy that leaves the system’s boundary over a period of time to the energy that enters the system’s boundary over the same period. Specific measures of efficiency exist for cooling systems, including the coefficient of performance (CoP), which relates the usable cooling energy (or the cooling effect) to the electrical energy (or heat) consumed by the system; as well as the overall system efficiency (OSE), which relates the specific cooling effect (per unit of area) to the incident total radiation intensity.
2.2. Financial Aspects
2.3. Environmental Aspects
Expected energy yield (kWh/year) × Life-cycle duration (years) × Life-cycle emissions for photovoltaic systems (gCO2/kWh)
2.4. Social and Legal Aspects
- Land lease accord.
- Site access license.
- Planning consent.
- Environmental certificate.
- Grid connection contract; and
- Operator licence.
3. Case Study
3.1. Description of Options
- Solar PV development will need to be of an appropriate scale for its location, have no significant environmental impact, and a development scale that meets its user’s needs.
- Limit the system capacity to the scale of solar PV farms already approved by the local authorities to increase the likelihood of approval and avoid the likelihood of a full environmental impact assessment.
3.2. Modelling
3.2.1. Technical
3.2.2. Financial
4. Results and Discussion
5. Sensitivity Analysis
- What is the impact on alternatives ranking if a weight ( is changed to ?
- What is the smallest change in the weights required to change the highest alternative ranking?
- How many experts have selected the same alternative despite different opinions in terms of criteria comparison?
6. Conclusions
Author Contributions
Funding
Institutional Review Board Statement
Informed Consent Statement
Data Availability Statement
Acknowledgments
Conflicts of Interest
References
- United Nations. The Sustainable Development Goals Report 2019. 2019. Available online: https://unstats.un.org/sdgs/report/2019/The-Sustainable-Development-Goals-Report-2019.pdf (accessed on 14 April 2021).
- Streck, C. The Paris Agreement. Summary. Clim. Focus 2015, 1. Available online: http://unfccc.int/resource/docs/2015/cop21/eng/l09r01.pdf (accessed on 14 April 2021).
- EnAppSys. European Electricity Fuel Mix Summary. 2019. Available online: https://www.enappsys.com/free-reports (accessed on 14 April 2021).
- Karakaya, E.; Sriwannawit, P. Barriers to the adoption of photovoltaic systems: The state of the art. Renew. Sustain. Energy Rev. 2015, 49, 60–66. [Google Scholar] [CrossRef]
- Ritchie, H.; Roser, M. Renewable Energy. OurworldInData 2019. Available online: https://ourworldindata.org/renewable-energy (accessed on 31 October 2019).
- Bucak, S. Renewable energy investments to double as assets prove their resilience. Citywire 2020. Available online: https://citywire.co.uk/wealth-manager/news/renewable-energy-investments-to-double-as-assets-prove-their-resilience/a1429593 (accessed on 9 March 2020).
- International Energy Agency. Renewables 2018 Summary. 2018. Available online: https://webstore.iea.org/download/summary/2312?fileName=English-Renewables-2018-ES.pdf (accessed on 14 April 2021).
- Mastrocinque, E.; Ramírez, F.J.; Honrubia-Escribano, A.; Pham, D.T. An AHP-based multi-criteria model for sustainable supply chain development in the renewable energy sector. Expert Syst. Appl. 2020, 150, 113321. [Google Scholar] [CrossRef]
- Siksnelyte, I.; Zavadskas, E.K.; Streimikiene, D.; Sharma, D. An overview of multi-criteria decision-making methods in dealing with sustainable energy development issues. Energies 2018, 11, 2754. [Google Scholar] [CrossRef]
- Strantzali, E.; Aravossis, K. Decision making in renewable energy investments: A review. Renew. Sustain. Energy Rev. 2016, 55, 885–898. [Google Scholar] [CrossRef]
- Campos-Guzmán, V.; García-Cáscales, M.S.; Espinosa, N.; Urbina, A. Life Cycle Analysis with Multi-Criteria Decision Making: A review of approaches for the sustainability evaluation of renewable energy technologies. Renew. Sustain. Energy Rev. 2018, 104, 343–366. [Google Scholar] [CrossRef]
- Mardani, A.; Zavadskas, E.K.; Khalifah, Z.; Zakuan, N.; Jusoh, A.; Nor, K.M.; Khoshnoudi, M. A review of multi-criteria decision-making applications to solve energy management problems: Two decades from 1995 to 2015. Renew. Sustain. Energy Rev. 2017, 71, 216–256. [Google Scholar] [CrossRef]
- Wang, J.-J.; Jing, Y.-Y.; Zhang, C.-F.; Zhao, J.-H. Review on multi-criteria decision analysis aid in sustainable energy decision-making. Renew. Sustain. Energy Rev. 2009, 13, 2263–2278. [Google Scholar] [CrossRef]
- Polatidis, H.; Haralambopoulos, D.A.; Munda, G.; Vreeker, R. Selecting an appropriate multi-criteria decision analysis technique for renewable energy planning. Energy Sources Part B Econ. Plan. Policy 2006, 1, 181–193. [Google Scholar] [CrossRef]
- Ilbahar, E.; Cebi, S.; Kahraman, C. A state-of-the-art review on multi-attribute renewable energy decision making. Energy Strat. Rev. 2019, 25, 18–33. [Google Scholar] [CrossRef]
- Pohekar, S.; Ramachandran, M. Application of multi-criteria decision making to sustainable energy planning—A review. Renew. Sustain. Energy Rev. 2004, 8, 365–381. [Google Scholar] [CrossRef]
- Baumann, M.; Weil, M.; Peters, J.F.; Chibeles-Martins, N.; Moniz, A.B. A review of multi-criteria decision making approaches for evaluating energy storage systems for grid applications. Renew. Sustain. Energy Rev. 2019, 107, 516–534. [Google Scholar] [CrossRef]
- Kaya, I.; Çolak, M.; Terzi, F. A comprehensive review of fuzzy multi criteria decision making methodologies for energy policy making. Energy Strat. Rev. 2019, 24, 207–228. [Google Scholar] [CrossRef]
- Stojčić, M.; Zavadskas, E.K.; Pamučar, D.; Stević, Ž.; Mardani, A. Application of MCDM methods in sustainability engineering: A literature review 2008–2018. Symmetry 2019, 11, 350. [Google Scholar] [CrossRef]
- Kumar, A.; Sah, B.; Singh, A.R.; Deng, Y.; He, X.; Kumar, P.; Bansal, R. A review of multi criteria decision making (MCDM) towards sustainable renewable energy development. Renew. Sustain. Energy Rev. 2017, 69, 596–609. [Google Scholar] [CrossRef]
- Patlitzianas, K.D.; Ntotas, K.; Doukas, H.; Psarras, J. Assessing the renewable energy producers’ environment in EU accession member states. Energy Convers. Manag. 2007, 48, 890–897. [Google Scholar] [CrossRef]
- Afgan, N.H.; Carvalho, M.G. Multi-criteria assessment of new and renewable energy power plants. Energy 2002, 27, 739–755. [Google Scholar] [CrossRef]
- Afgan, N.H.; Carvalho, M.G. Sustainability assessment of a hybrid energy system. Energy Policy 2008, 36, 2903–2910. [Google Scholar] [CrossRef]
- Afgan, N.H.; Carvalho, M.G. Sustainability assessment of hydrogen energy systems. Int. J. Hydrogen Energy 2004, 29, 1327–1342. [Google Scholar] [CrossRef]
- Begic, F.; Afgan, N.H. Sustainability assessment tool for the decision making in selection of energy system-Bosnian case. Energy 2007, 32, 1979–1985. [Google Scholar] [CrossRef]
- Jovanović, M.; Afgan, N.; Radovanović, P.; Stevanović, V. Sustainable development of the Belgrade energy system. Energy 2009, 34, 532–539. [Google Scholar] [CrossRef]
- Rezaei, J. Best-worst multi-criteria decision-making method. Omega 2015, 53, 49–57. [Google Scholar] [CrossRef]
- Beemsterboer, D.; Hendrix, E.; Claassen, G. On solving the Best-Worst Method in multi-criteria decision-making. IFAC PapersOnLine 2018, 51, 1660–1665. [Google Scholar] [CrossRef]
- Mi, X.; Tang, M.; Liao, H.; Shen, W.; Lev, B. The state-of-the-art survey on integrations and applications of the best worst method in decision making: Why, what, what for and what’s next? Omega 2019, 87, 205–225. [Google Scholar] [CrossRef]
- Van De Kaa, G.; Fens, T.; Rezaei, J. Residential grid storage technology battles: A multi-criteria analysis using BWM. Technol. Anal. Strat. Manag. 2018, 31, 40–52. [Google Scholar] [CrossRef]
- Zhao, H.; Guo, S.; Zhao, H. Comprehensive performance assessment on various battery energy storage systems. Energies 2018, 11, 2841. [Google Scholar] [CrossRef]
- Stein, E.W. A comprehensive multi-criteria model to rank electric energy production technologies. Renew. Sustain. Energy Rev. 2013, 22, 640–654. [Google Scholar] [CrossRef]
- Saaty, R.M. The analytic hierarchy process-what it is and how it is used. Math. Model. 1987, 9, 161–176. [Google Scholar] [CrossRef]
- Cristóbal, J.S. Multi-criteria decision-making in the selection of a renewable energy project in Spain: The Vikor method. Renew. Energy 2011, 36, 498–502. [Google Scholar] [CrossRef]
- Ertay, T.; Kahraman, C.; Kaya, I. Evaluation of renewable energy alternatives using MACBETH and fuzzy AHP multicriteria methods: The case of Turkey. Technol. Econ. Dev. Econ. 2013, 19, 38–62. [Google Scholar] [CrossRef]
- Pak, B.K.; Albayrak, Y.E.; Erensal, Y.C. Renewable Energy Perspective for Turkey Using Sustainability Indicators. Int. J. Comput. Intell. Syst. 2014, 8, 187–197. [Google Scholar] [CrossRef]
- Jun, D.; Tian-Tian, F.; Yi-Sheng, Y.; Yu, M. Macro-site selection of wind/solar hybrid power station based on ELECTRE-II. Renew. Sustain. Energy Rev. 2014, 35, 194–204. [Google Scholar] [CrossRef]
- Uyan, M. GIS-based solar farms site selection using analytic hierarchy process (AHP) in Karapinar region Konya/Turkey. Renew. Sustain. Energy Rev. 2013, 28, 11–17. [Google Scholar] [CrossRef]
- Vafaeipour, M.; Zolfani, S.H.; Varzandeh, M.H.M.; Derakhti, A.; Eshkalag, M.K. Assessment of regions priority for implementation of solar projects in Iran: New application of a hybrid multi-criteria decision making approach. Energy Convers. Manag. 2014, 86, 653–663. [Google Scholar] [CrossRef]
- Aragonés-Beltrán, P.; Chaparro-González, F.; Pastor-Ferrando, J.; Rodríguez-Pozo, F. An ANP-based approach for the selection of photovoltaic solar power plant investment projects. Renew. Sustain. Energy Rev. 2010, 14, 249–264. [Google Scholar] [CrossRef]
- Cavallaro, F. Multi-criteria decision aid to assess concentrated solar thermal technologies. Renew. Energy 2009, 34, 1678–1685. [Google Scholar] [CrossRef]
- Cavallaro, F. Fuzzy TOPSIS approach for assessing thermal-energy storage in concentrated solar power (CSP) systems. Appl. Energy 2010, 87, 496–503. [Google Scholar] [CrossRef]
- Saenz, J.M.; Vantsiotis, G.; Collins, R.; Mutschler, M.; Bailey, F.; Gadney, G.; Muller, G. Multi criteria decision making (MCDM) application for the feasibility study of a potential CSP project in Namibia. AIP Conf. Proc. 2018, 2033. [Google Scholar] [CrossRef]
- García-Cascales, M.S.; Lamata, M.T.; Sánchez-Lozano, J.M. Evaluation of photovoltaic cells in a multi-criteria decision making process. Ann. Oper. Res. 2012, 199, 373–391. [Google Scholar] [CrossRef]
- Cucchiella, F.; D’Adamo, I. A multicriteria analysis of photovoltaic systems: Energetic, environmental, and economic assessments. Int. J. Photoenergy 2015, 2015, 627454. [Google Scholar] [CrossRef]
- Azzopardi, B.; Cesena, E.A.M.; Mutale, J. Decision support system for ranking photovoltaic technologies. IET Renew. Power Gener. 2013, 7, 669–679. [Google Scholar] [CrossRef]
- Golabi, K.; Kirkwood, C.W.; Sicherman, A. Selecting a Portfolio of Solar Energy Projects Using Multiattribute Preference Theory. Manag. Sci. 1981, 27, 174–189. [Google Scholar] [CrossRef]
- Sánchez-Lozano, J.M.; Teruel-Solano, J.; Soto-Elvira, P.L.; García-Cascales, M.S. Geographical Information Systems (GIS) and Multi-Criteria Decision Making (MCDM) methods for the evaluation of solar farms locations: Case study in south-eastern Spain. Renew. Sustain. Energy Rev. 2013, 24, 544–556. [Google Scholar] [CrossRef]
- Charabi, Y.; Gastli, A. PV site suitability analysis using GIS-based spatial fuzzy multi-criteria evaluation. Renew. Energy 2011, 36, 2554–2561. [Google Scholar] [CrossRef]
- Matulaitis, V.; Straukaitė, G.; Azzopardi, B.; Martinez-Cesena, E.A. Multi-criteria decision making for PV deployment on a multinational level. Sol. Energy Mater. Sol. Cells 2016, 156, 122–127. [Google Scholar] [CrossRef]
- Sun, Y.; Chen, S.; Xie, L.; Hong, R.; Shen, H. Investigating the Impact of Shading Effect on the Characteristics of a Large-Scale Grid-Connected PV Power Plant in Northwest China. Int. J. Photoenergy 2014, 2014, 763106. [Google Scholar] [CrossRef][Green Version]
- Sathyanarayana, P.; Ballal, R.; Sagar, P.L. Effect of Shading on the Performance of Solar PV Panel. Energy Power 2015. [Google Scholar] [CrossRef]
- World Bank Group-International Finance Corporation. Utility-Scale Solar Photovoltaic Power Plants: A Project Developer’s Guide. 2015. Available online: https://openknowledge.worldbank.org/handle/10986/22797 (accessed on 14 April 2021).
- PennState University. Efficiency of Inverters. Available online: https://www.e-education.psu.edu/eme812/node/738 (accessed on 25 February 2021).
- Miller, A.; Lumby, B. Sgurr Energy Limited, Utility Scale Solar Power Plants: A Guide for Developers and Investors. 2012. Available online: https://www.ifc.org/wps/wcm/connect/fe79dd27-5c9d-4cb0-8dc0-00e54073aa87/SOLAR%2BGUIDE%2BBOOK.pdf?MOD=AJPERES&CVID=jrR7UB7 (accessed on 14 April 2021).
- UK Government. Solar PV Cost Data. 2018. Available online: https://www.gov.uk/government/statistics/solar-pv-cost-data (accessed on 14 April 2021).
- Solarmango, What Is the Installation Cost of Utility Scale Solar Power Plant (£/MW) in the UK? 2015. Available online: http://www.solarmango.com/ask/2015/10/26/what-is-the-installation-cost-of-utility-scale-solar-power-plant-mw-in-the-uk/ (accessed on 14 April 2021).
- Ricardo-AEA Ltd. Wales Community Renewable Energy Toolkit. 2015. Available online: https://gov.wales/community-energy-connecting-grid (accessed on 14 April 2021).
- UK Department of Energy and Climate Change. DECC Small Scale Generation Costs Update. 2015. Available online: https://assets.publishing.service.gov.uk/government/uploads/system/uploads/attachment_data/file/456187/DECC_Small-Scale_Generation_Costs_Update_FINAL.PDF (accessed on 14 April 2021).
- Gaspars-Wieloch, H. Project Net Present Value estimation under uncertainty. Central Eur. J. Oper. Res. 2017, 27, 179–197. [Google Scholar] [CrossRef]
- Reniers, G.; Talarico, L.; Paltrinieri, N. Cost-Benefit Analysis of Safety Measures. In Dynamic Risk Analysis in the Chemical and Petroleum Industry; Elsevier: Amsterdam, The Netherlands, 2016; pp. 195–205. [Google Scholar]
- Dincer, I.; Abu-Rayash, A. Sustainability modeling. In Energy Sustainability; Elsevier: Amsterdam, The Netherlands, 2020; pp. 119–164. [Google Scholar]
- Yescombe, E.R. Financial Structuring. In Public-Private Partnerships; Elsevier: Amsterdam, The Netherlands, 2007; pp. 143–170. [Google Scholar]
- Clews, R.J. The Characteristics of Project Finance. In Project Finance for the International Petroleum Industry; Elsevier: Amsterdam, The Netherlands, 2016; pp. 3–21. [Google Scholar]
- Warnelid, R. LLCR—Loan Life Coverage Ratio. 2008. Available online: https://financialmodelling.mazars.com/resources/loan-life-coverage-ratio-llcr/ (accessed on 14 April 2021).
- Short, W.; Packey, D.J.; Holt, T. A Manual for the Economic Evaluation of Energy Efficiency and Renewable Energy Technologies. 1995. Available online: www.nrel.gov/docs/legosti/old/5173.pdf (accessed on 14 April 2021).
- Department for Business Energy & Industrial Strategy (UK). How Levelised Costs Are Calculated. 2016. Available online: https://assets.publishing.service.gov.uk/government/uploads/system/uploads/attachment_data/file/566567/BEIS_Electricity_Generation_Cost_Report.pdf (accessed on 14 April 2021).
- Iris, M.; Dickens, B. Case Study: Hydro Power Generation and Behavioral Finance in the U.S. Pacific Northwest. In Energy Trading and Risk Management; John Wiley & Sons, Ltd.: Chichester, UK, 2014; pp. 227–242. [Google Scholar]
- Gabbrielli, R.; Castrataro, P.; Del Medico, F. Performance and Economic Comparison of Solar Cooling Configurations. Energy Procedia 2016, 91, 759–766. [Google Scholar] [CrossRef]
- Gudmundsson, O.; Thorsen, J.E.; Zhang, L. Cost analysis of district heating compared to its competing technologies. Energy Sustain. IV 2013, 1, 3–13. [Google Scholar] [CrossRef]
- Vidya, D.; Kusuma, P.; Bhuvana, M.; Shruthi, M.; Tessy, V. Urbanization and Its Impacts on Ecosystem. 2010. Available online: http://wgbis.ces.iisc.ernet.in/energy/lake2010/Theme9/T9_Poster_12_PPT.pdf (accessed on 14 April 2021).
- Union of Concerned Scientists. Environmental Impacts of Solar Power; Union of Concerned Scientists: Cambridge, MA, USA, 2013; Available online: https://www.ucsusa.org/resources/environmental-impacts-solar-power (accessed on 14 April 2021).
- National Renewable Energy Laboratory. Solar Sheep and Voltaic Veggies: Uniting Solar Power and Agriculture. Available online: https://www.nrel.gov/state-local-tribal/blog/posts/solar-sheep-and-voltaic-veggies-uniting-solar-power-and-agriculture.html (accessed on 14 April 2021).
- Tsoutsos, T.; Frantzeskaki, N.; Gekas, V. Environmental impacts from the solar energy technologies. Energy Policy 2005, 33, 289–296. [Google Scholar] [CrossRef]
- Kaygusuz, K. Environmental Impacts of the Solar Energy Systems. Energy Sources Part A Recover. Util. Environ. Eff. 2009, 31, 1376–1386. [Google Scholar] [CrossRef]
- Silicon Valley Toxics Coalition. Solar Scorecard. 2016. Available online: http://www.solarscorecard.com/2016-17/2016-17-SVTC-Solar-Scorecard.pdf (accessed on 14 April 2021).
- McManus, M. Environmental consequences of the use of batteries in low carbon systems: The impact of battery production. Appl. Energy 2012, 93, 288–295. [Google Scholar] [CrossRef]
- Mahmud, M.A.P.; Huda, N.; Farjana, S.H.; Lang, C. Environmental Impacts of Solar-Photovoltaic and Solar-Thermal Systems with Life-Cycle Assessment. Energies 2018, 11, 2346. [Google Scholar] [CrossRef]
- Ecoinvent, Ecoinvent Database. Available online: https://www.ecoinvent.org/database/database.html (accessed on 14 April 2021).
- De Laborderie, A.; Puech, C.; Adra, N.; Blanc, I.; Beloin-Saint-Pierre, D.; Padey, P.; Payet, J.; Sie, M.; Jacquin, P. Environmental Impacts of Solar Thermal Systems with Life Cycle Assessment; World Renewable Energy Congress 2011: Linköping, Sweden, 2011; pp. 3678–3685. [Google Scholar] [CrossRef]
- Friggens, S. How Much CO2 Pollution Do Solar Panels Save? Available online: https://www.ethex.org.uk/how-much-co2-pollution-do-solar-panels-save_479.html (accessed on 14 April 2021).
- Andrei, H.; Badea, C.A.; Andrei, P.; Spertino, F. Energetic-Environmental-Economic Feasibility and Impact Assessment of Grid-Connected Photovoltaic System in Wastewater Treatment Plant: Case Study. Energies 2020, 14, 100. [Google Scholar] [CrossRef]
- Edalati, S.; Ameri, M.; Iranmanesh, M.; Tarmahi, H.; Gholampour, M. Technical and economic assessments of grid-connected photovoltaic power plants: Iran case study. Energy 2016, 114, 923–934. [Google Scholar] [CrossRef]
- Olczak, P.; Olek, M.; Matuszewska, D.; Dyczko, A.; Mania, T. Monofacial and Bifacial Micro PV Installation as Element of Energy Transition—The Case of Poland. Energies 2021, 14, 499. [Google Scholar] [CrossRef]
- Dhimish, M. Performance Ratio and Degradation Rate Analysis of 10-Year Field Exposed Residential Photovoltaic Installations in the UK and Ireland. Clean Technol. 2020, 2, 170–183. [Google Scholar] [CrossRef]
- Department for Business, Energy & Industrial Strategy. Updated Energy and Emissions Projections: 2017. 2017. Available online: https://www.gov.uk/government/publications/updated-energy-and-emissions-projections-2017 (accessed on 14 April 2021).
- Maroušek, J.; Hašková, S.; Zeman, R.; Váchal, J.; Vanickova, R. Assessing the implications of EU subsidy policy on renewable energy in Czech Republic. Clean Technol. Environ. Policy 2014, 17, 549–554. [Google Scholar] [CrossRef]
- Barcelona, R. Renewable Energy with Volatile Prices: Why NPV Fails to Tell the Whole Story. J. Appl. CorFinanc. 2015, 27. [Google Scholar] [CrossRef]
- Erkut, E.; Tarimcilar, M. On Sensitivity Analysis in the Analytic Hierarchy Process. IMA J. Manag. Math. 1991, 3, 61–83. [Google Scholar] [CrossRef]
- Interreg 2 Seas Project SOLARISE. Available online: https://www.interregsolarise.eu/ (accessed on 23 February 2021).


| Ref | Purpose of Study | MCDA Method | Key Performance Indicators |
|---|---|---|---|
| [41] | Preliminary assessment of concentrated solar power technologies | PROMETHEE I and II | Solar capacity factor, Levelised cost of electricity, Environmental risk |
| [42] | Compare different heat transfer fluids for concentrated solar power systems | fuzzy TOPSIS | Land use, Investment and operation and maintenance costs, Thermal storage costs, Technology maturity |
| [43] | Assess the feasibility of concentrated solar power project in Namibia | AHP | Water use, Availability, Landscape impact, Local community impact, Ecological impact |
| [44] | Find the best photovoltaic cell | TOPSIS | Efficiency, Pay-back time, Greenhouse emissions |
| [45] | Sustainability of PV projects in different locations | AHP | Net present value, Energy pay-back time, Discounted pay-back time |
| [46] | Rank the PV technologies | ELECTRE III | Solar fraction, Aesthetic, Module flexibility |
| [32] | Rank the electric energy production technologies | AHP | Capacity factor, Fuel cost, Loss of life expectancy, Public acceptance |
| [34] | Selection of renewable electric generation alternative | AHP-VIKOR | Avoided Tons of CO2, Useful life |
| [35] | Evaluation of renewable energy alternatives | AHP-MACBETH | Reliability, Need of waste disposal, Political acceptance, Compatibility with national energy policy |
| [47] | Selection of portfolio of solar energy project experiments for funding | MAUT | System size, Solar cell type |
| [36] | Selection of renewable energy source for a country | ANP-TOPSIS | Accident fatalities, Soil acidification |
| [37] | Site selection for wind/solar hybrid power station | ELECTRE II | Public attitude, Transmission line length, Electricity demand |
| [38] | Solar farm site selection | AHP | Slope, Location of system |
| [39] | Identification of regions for solar power plant construction | SWARA-WASPAS (Weighted Aggregated Sum Product Assessment) | Transmission grid accessibility, Energy independence, Social acceptability |
| [40] | Selection of PV power project for investment | AHP-ANP | Connection to the grid, Costs associated with agreements, Local body approval, obtaining licenses, Inverter selection, Availability of incentives |
| [48] | Evaluation of best location for PV solar power plant | AHP-TOPSIS | Cultural heritage, land slope, characteristics, and orientation |
| [49] | PV site suitability evaluation | Fuzzy Logic Ordered Weight Averaging (FLOWA) | Sand/dust risk, land accessibility |
| [50] | Impact of different financial support policies for PV | ELECTRE III | Internal rate of return, cost for support |
| Weight | Meaning |
|---|---|
| 5 | Very high importance |
| 4 | High importance |
| 3 | Medium importance |
| 2 | Low importance |
| 1 | Very low importance |
| 0 | Irrelevant/Not applicable |
| Score | Meaning |
| 10 | Outstanding satisfaction of sub-criterion |
| 9 | Excellent |
| 8 | Very good |
| 7 | Good |
| 6 | Above satisfactory |
| 5 | Satisfactory |
| 4 | Below satisfactory |
| 3 | Poor |
| 2 | Very poor |
| 1 | Sub-criterion not satisfied at all |
| 0 | Irrelevant/Not applicable |
| Criteria | Weight (0–5) | Non-Irrelevant Sub-Criteria | Input Score | Averaged Score | Weighted Score |
|---|---|---|---|---|---|
| C1 | w1 | C1,1 | S1,1 | S1 = | w1 × S1 |
| C1,2 | S1,2 | ||||
| C1,a | S1,a | ||||
| C2 | w2 | C2,1 | S2,1 | S2 = | w2 × S2 |
| C2,2 | S2,2 | ||||
| C2,b | S2,b | ||||
| C3 | w3 | C3,1 | S3,1 | S3 = | w3 × S3 |
| C3,2 | S3,2 | ||||
| C3,c | S3,c | ||||
| Cm | wm | Cm,1 | Sm,1 | Sm = | wm × Sm |
| Cm,2 | Sm,2 | ||||
| Cm,n | Sm,n | ||||
| Total score (percentage) | − | − |
| Features | Score Out of 10 |
|---|---|
| Significant additional work needed | 2 |
| Moderate additional work needed | 5 |
| No additional work needed | 10 |
| Ease of Connection | Score Out of 10 |
|---|---|
| Significant additional work needed | 2 |
| Moderate additional work needed | 5 |
| No additional work needed | 10 |
| Shading (%) | Score Out of 10 |
|---|---|
| 81–100 | 1 |
| 61–80 | 4 |
| 41–60 | 6 |
| 21–40 | 8 |
| 0–20 | 10 |
| Solar Panel Module Efficiency (%) | Score Out of 10 |
|---|---|
| 0–5% | 1 |
| 6–10% | 4 |
| 11–15% | 6 |
| 16–20% | 8 |
| >20% | 10 |
| Photovoltaic (PV) Panel Efficiency after 25 Years Compared to the Initial Value (%) | Score Out of 10 |
|---|---|
| 0–50% | 1 |
| 51–70% | 6 |
| 71–80% | 8 |
| 80–90% | 9 |
| >90% | 10 |
| Solar Panel Warranty (Years) | Score Out of 10 |
|---|---|
| 5–10 | 3 |
| 10–15 | 5 |
| 15–20 | 7 |
| 20–25 | 10 |
| Battery Round Trip Efficiency (%) | Score Out of 10 |
|---|---|
| 50–70 | 2 |
| 71–80 | 4 |
| 81–90 | 6 |
| 91–95 | 9 |
| 96–100 | 10 |
| Battery Energy Density (kWh/m3) | Score Out of 10 |
|---|---|
| 0–100 | 1 |
| 101–250 | 3 |
| 250–400 | 6 |
| 401–500 | 9 |
| >500 | 10 |
| Battery Cycle Life (Cycles) | Score |
|---|---|
| 100–500 | 1 |
| 501–2500 | 2 |
| 2500–5000 | 5 |
| 5001–7500 | 7 |
| 7500–9000 | 9 |
| >9000 | 10 |
| Battery Type | Maintenance Requirement | Score |
|---|---|---|
| NiCd | 30–60 days | 3 |
| NiMh | 60–90 days | 4 |
| Lead-acid | 3–6 months | 6 |
| Li-Ion | Not required | 10 |
| Li-Ion polymer | Not required | 10 |
| Inverter Efficiency (%) | Score Out of 10 |
|---|---|
| 85–87.5% | 3 |
| 87.5–90% | 6 |
| 90–95% | 9 |
| >95% | 10 |
| Inverter Warranty (Years) | Score Out of 10 |
|---|---|
| 0–5 | 1 |
| 5–10 | 3 |
| 10–15 | 5 |
| 15–20 | 7 |
| 20–25 | 10 |
| Technical | Financial | Environmental | Social and Legal | |
|---|---|---|---|---|
| Site Aspects | Technology Suitability | |||
|
|
|
|
|
| Specification | Details |
|---|---|
| A | 6.4 MWp PV system String Inverter Configuration |
| B | 2.5 MWp PV system String Inverter Configuration |
| Specification | Option | Electricity Sales | Technical | Connection | ||||||
|---|---|---|---|---|---|---|---|---|---|---|
| A | S1 | S2 | S3 | S4 | Battery Storage | Load balancing | Designated PV array | Grid connection and Private wire | Sleeving | |
| A1 | ✓ | ✓ | ||||||||
| A2 | ✓ | ✓ | ✓ | ✓ | ✓ | |||||
| A3 | ✓ | ✓ | ✓ | ✓ | ✓ | ✓ | ||||
| A4 | ✓ | ✓ | ✓ | ✓ | ✓ | |||||
| A5 | ✓ | ✓ | ||||||||
| B | B1 | ✓ | ✓ | |||||||
| B2 | ✓ | ✓ | ||||||||
| B3 | ✓ | ✓ | ✓ | ✓ | ||||||
| B4 | ✓ | ✓ | ✓ | ✓ | ✓ | |||||
| Stakeholder | Option A2, A3 | Option B3, B4 |
|---|---|---|
| S1 | 1.0 MWp array | 0.5 MWp array |
| S2 | 3.4 MWp array | Not sufficient generation |
| S3 | 2.0 MWp array | 2.0 MWp array |
| Description | Details |
|---|---|
| Solar Panel | |
| Module rating (Wp) | 400 |
| Module type | Monocrystalline |
| Module direct current (DC) nameplate (MWp) | 6.39 |
| Intrarow spacing (m) | 4 |
| Orientation | Due South |
| Panel Tilt | 20° |
| Inverter Average annual insolation at 20 deg | String configuration; 40 kWp 1321 kWh/m2 |
| Battery | |
| Rated power | 500 kW |
| Rated capacity | 1000 kWh |
| c-rate | 0.5 |
| Efficiency | 94% |
| Depth of discharge | 80% |
| State of charge (minimum) | 100 kWh |
| State of charge (maximum) | 900 kWh |
| Available discharge energy | 800 kWh |
| Time to full discharge | 1.6 h |
| Maximum half-hourly discharge rate | 250 kWh |
| Degradation | 1.2% |
| Maximum number of cycles | 7000 |
| Lifetime | 20 years |
| Stakeholder | Half Hourly Electricity Demand (MWh) | Key Features |
|---|---|---|
| S1 (large institution) | 1994 |
|
| S2 (large hospital complex) | 22,201 |
|
| S3 (large leisure complex) | 5417 |
|
| S4 (public buildings) | 8801 |
|
| Assumptions | Value |
|---|---|
| Inflation | 2.2% |
| Electricity price inflation | 3.25% |
| Availability of plant | 95% |
| Degradation of panels | 0.7% per year |
| Public Works Loan Board finance rate | 2.5% |
| Discount rate | 6.0% |
| Power purchase agreement—Off taker | £85/MWh |
| Power purchase agreement—Sleeving | £50/MWh |
| Power purchase agreement—Sold to grid | £50/MWh |
| Specification | Option | Development Costs (£) | Construction Costs (£) | Operating Costs (£) | Major Maintenance (£) (Year 10 and 20) |
|---|---|---|---|---|---|
| A | A1 | 295,750 | 4,594,000 | 107,000 | 320,000 |
| A2 | 295,750 | 4,345,000 | 107,000 | 320,000 | |
| A3 | 295,750 | 4,770,980 | 125,565 | 320,000 | |
| A4 | 295,750 | 4,620,000 | 107,000 | 320,000 | |
| A5 | 295,750 | 4,402,000 | 107,000 | 320,000 | |
| B | B1 | 178,750 | 1,652,000 | 52,000 | 125,000 |
| B2 | 178,750 | 1,791,000 | 52,000 | 125,000 | |
| B3 | 178,750 | 1,901,000 | 52,000 | 125,000 | |
| B4 | 178,750 | 2,326,980 | 70,565 | 125,000 |
| Sub-Criteria | Options | ||||||||
|---|---|---|---|---|---|---|---|---|---|
| A1 | A2 | A3 | A4 | A5 | B1 | B2 | B3 | B4 | |
| Energy yield (MWh/year) | ←---------------------------- 6867 ------------------------→ | ←--------------------- 2683 ----------------→ | |||||||
| PV panel efficiency (%) | ←----------------------------------------------------------- 19.4 -------------------------------------------------------------→ | ||||||||
| PV panel efficiency after 25 years compared to the initial value (%) | ←----------------------------------------------------------- 80 --------------------------------------------------------------→ | ||||||||
| Battery efficiency (%) | - | - | 94 | - | - | - | - | - | 94 |
| Battery number of cycles | - | - | 7000 | - | - | - | - | - | 7000 |
| Features of land | ←-----------------------------------------------------------✶--------------------------------------------------------------→ | ||||||||
| Ease of connection to grid or network | ←-----------------------------------------------------------✶--------------------------------------------------------------→ | ||||||||
| Presence of obtrusive objects causing shading | ←-----------------------------------------------------------✶--------------------------------------------------------------→ | ||||||||
| Self-consumption fraction (%) | 15 | 82 | 83 | 90 | 53 | 88 | 33 | 72 | 74 |
| Sub-criteria | Options | ||||||||
|---|---|---|---|---|---|---|---|---|---|
| A1 | A2 | A3 | A4 | A5 | B1 | B2 | B3 | B4 | |
| Capital costs (£ million) | 4.9 | 4.6 | 5.1 | 4.9 | 4.7 | 1.8 | 2 | 2.1 | 2.6 |
| Internal rate of return (IRR) (%) | 3.8 | 9.3 | 8.4 | 9.1 | 2.8 | 1.8 | 4.1 | 6.4 | 4.9 |
| Payback period ■ (years) | 17.5 | 11 | 11.5 | 11 | 19 | 21 | 17 | 13.5 | 15.5 |
| Net present value (NPV) @6% ❖ (£ million) | −1.1 | 1.7 | 1.3 | 1.7 | −1.4 | −0.7 | −0.4 | 0.1 | −0.3 |
| Sub-Criteria | Options | ||||||||
|---|---|---|---|---|---|---|---|---|---|
| A1 | A2 | A3 | A4 | A5 | B1 | B2 | B3 | B4 | |
| Habitat loss | ←------------------------------------------------------------- ✶ -------------------------------------------------------------→ | ||||||||
| Ground concurrency | ←------------------------------------------------------------- ❖ -------------------------------------------------------------→ | ||||||||
| Life cycle environmental impact of solar energy systems (tonnes CO2 eq.) | ←---------------------------- 4394.9 ------------------------→ | ←--------------------- 1717.1 ----------------→ | |||||||
| Landscape and visual impacts | ←------------------------------------------------------------- ⨀ ------------------------------------------------------------→ | ||||||||
| Life cycle (20 years) carbon emission reduction (tonnes CO2) | ←---------------------- 53,837.3 -----------------------------→ | ←------------------- 21,034.7 ---------------→ | |||||||
| Water Use | ←------------------------------------------------------------- ⮙ ------------------------------------------------------------→ | ||||||||
| Sub-Criteria | Options | ||||||||
|---|---|---|---|---|---|---|---|---|---|
| A1 | A2 | A3 | A4 | A5 | B1 | B2 | B3 | B4 | |
| Public approval | ←---------------------------------------------------------- ⨀ -----------------------------------------------------------→ | ||||||||
| Ease of permit acquisition | ←---------------------------------------------------------- ✶ -----------------------------------------------------------→ | ||||||||
| Impacts on cultural heritage | ←---------------------------------------------------------- ♦ -----------------------------------------------------------→ | ||||||||
| Contribution to energy independence | ←---------------------------------------------------------- ⮙ -----------------------------------------------------------→ | ||||||||
| Ease of agreement between stakeholders | ←---------------------------------------------------------- ❖ -----------------------------------------------------------→ | ||||||||
| Sub-Criteria | Options | |||||||||||||||||
|---|---|---|---|---|---|---|---|---|---|---|---|---|---|---|---|---|---|---|
| A1 | A2 | A3 | A4 | A5 | B1 | B2 | B3 | B4 | ||||||||||
| E | S | E | S | E | S | E | S | E | S | E | S | E | S | E | S | E | S | |
| Energy yield (MWh) | Y | 8 | Y | 8 | Y | 8 | Y | 8 | Y | 8 | Y | 6 | Y | 6 | Y | 6 | Y | 6 |
| PV panel efficiency (%) | Y | 8 | Y | 8 | Y | 8 | Y | 8 | Y | 8 | Y | 8 | Y | 8 | Y | 8 | Y | 8 |
| PV panel efficiency after 25 years compared to the initial value (%) | Y | 9 | Y | 9 | Y | 9 | Y | 9 | Y | 9 | Y | 9 | Y | 9 | Y | 9 | Y | 9 |
| Battery efficiency (%) | N | 0 | N | 0 | Y | 9 | N | 0 | N | 0 | N | 0 | N | 0 | N | 0 | Y | 9 |
| Battery number of cycles | N | 0 | N | 0 | Y | 7 | N | 0 | N | 0 | N | 0 | N | 0 | N | 0 | Y | 7 |
| Features of land | Y | 7 | Y | 7 | Y | 7 | Y | 7 | Y | 7 | Y | 8 | Y | 8 | Y | 8 | Y | 8 |
| Ease of connection to grid or network | Y | 9 | Y | 9 | Y | 7 | Y | 7 | Y | 8 | Y | 8 | Y | 9 | Y | 8 | Y | 7 |
| Presence of obtrusive objects causing shading | Y | 8 | Y | 8 | Y | 8 | Y | 8 | Y | 8 | Y | 9 | Y | 9 | Y | 9 | Y | 9 |
| Self-consumption fraction (%) | Y | 5 | Y | 9 | Y | 9 | Y | 10 | Y | 7 | Y | 10 | Y | 6 | Y | 8 | Y | 8 |
| TECHNICAL SCORE | 7.71 | 8.29 | 8.11 | 8.14 | 7.86 | 8.29 | 7.86 | 8.00 | 7.89 | |||||||||
| Sub-Criteria | Options | |||||||||||||||||
|---|---|---|---|---|---|---|---|---|---|---|---|---|---|---|---|---|---|---|
| A1 | A2 | A3 | A4 | A5 | B1 | B2 | B3 | B4 | ||||||||||
| E | S | E | S | E | S | E | S | E | S | E | S | E | S | E | S | E | S | |
| Capital costs (£ million) | Y | 7 | Y | 7 | Y | 6 | Y | 7 | Y | 7 | Y | 9 | Y | 9 | Y | 9 | Y | 8 |
| IRR (%) | Y | 7 | Y | 10 | Y | 9 | Y | 10 | Y | 6 | Y | 5 | Y | 7 | Y | 8 | Y | 7 |
| Payback period (years) | Y | 6 | Y | 9 | Y | 9 | Y | 9 | Y | 6 | Y | 5 | Y | 7 | Y | 8 | Y | 7 |
| NPV @6% (£ million) | Y | 6 | Y | 9 | Y | 9 | Y | 9 | Y | 5 | Y | 7 | Y | 7 | Y | 8 | Y | 8 |
| FINANCIAL SCORE | 6.5 | 8.75 | 8.25 | 8.75 | 6.0 | 6.50 | 7.50 | 8.25 | 7.50 | |||||||||
| Sub-Criteria | Options | |||||||||||||||||
|---|---|---|---|---|---|---|---|---|---|---|---|---|---|---|---|---|---|---|
| A1 | A2 | A3 | A4 | A5 | B1 | B2 | B3 | B4 | ||||||||||
| E | S | E | S | E | S | E | S | E | S | E | S | E | S | E | S | E | S | |
| Habitat loss | Y | 8 | Y | 8 | Y | 8 | Y | 8 | Y | 8 | Y | 9 | Y | 9 | Y | 9 | Y | 9 |
| Ground concurrency | Y | 8 | Y | 8 | Y | 8 | Y | 8 | Y | 8 | Y | 9 | Y | 9 | Y | 9 | Y | 9 |
| Life cycle environmental impact of solar energy systems | Y | 8 | Y | 8 | Y | 8 | Y | 8 | Y | 8 | Y | 9 | Y | 9 | Y | 9 | Y | 9 |
| Landscape and visual impacts | Y | 8 | Y | 8 | Y | 7 | Y | 8 | Y | 8 | Y | 9 | Y | 9 | Y | 9 | Y | 8 |
| Life cycle carbon emission reduction (tonnes CO2) | Y | 9 | Y | 9 | Y | 9 | Y | 9 | Y | 9 | Y | 6 | Y | 6 | Y | 6 | Y | 6 |
| Water Use | Y | 8 | Y | 8 | Y | 8 | Y | 8 | Y | 8 | Y | 9 | Y | 9 | Y | 9 | Y | 9 |
| ENVIRONMENTAL SCORE | 8.20 | 8.20 | 8.00 | 8.20 | 8.20 | 8.50 | 8.50 | 8.50 | 8.30 | |||||||||
| Sub-Criteria | Options | |||||||||||||||||
|---|---|---|---|---|---|---|---|---|---|---|---|---|---|---|---|---|---|---|
| A1 | A2 | A3 | A4 | A5 | B1 | B2 | B3 | B4 | ||||||||||
| E | S | E | S | E | S | E | S | E | S | E | S | E | S | E | S | E | S | |
| Public approval | Y | 8 | Y | 8 | Y | 7 | Y | 8 | Y | 8 | Y | 9 | Y | 9 | Y | 9 | Y | 7 |
| Ease of permit acquisition | Y | 8 | Y | 8 | Y | 7 | Y | 8 | Y | 8 | Y | 9 | Y | 9 | Y | 9 | Y | 8 |
| Impacts on cultural heritage | Y | 8 | Y | 8 | Y | 8 | Y | 8 | Y | 8 | Y | 9 | Y | 9 | Y | 9 | Y | 9 |
| Contribution to energy independence | Y | 9 | Y | 9 | Y | 9 | Y | 9 | Y | 9 | Y | 8 | Y | 8 | Y | 8 | Y | 8 |
| Ease of agreement between stakeholders | Y | 9 | Y | 8 | Y | 8 | Y | 8 | Y | 7 | Y | 7 | Y | 9 | Y | 8 | Y | 8 |
| SOCIAL AND LEGAL SCORE | 8.40 | 8.20 | 7.80 | 8.20 | 8.00 | 8.40 | 8.80 | 8.60 | 8.00 | |||||||||
| Criteria | Weight (1 to 5) | Score (1 to 10) | Total Average Weighted Score | ||||||||||||||||
|---|---|---|---|---|---|---|---|---|---|---|---|---|---|---|---|---|---|---|---|
| A1 | A2 | A3 | A4 | A5 | B1 | B2 | B3 | B4 | A1 | A2 | A3 | A4 | A5 | B1 | B2 | B3 | B4 | ||
| Technical | 4 | 7.71 | 8.29 | 8.11 | 8.14 | 7.86 | 8.29 | 7.86 | 8.00 | 7.89 | 30.84 | 33.16 | 32.44 | 32.56 | 31.44 | 33.16 | 31.44 | 32.00 | 31.56 |
| Financial | 5 | 6.5 | 8.75 | 8.25 | 8.75 | 6.00 | 6.50 | 7.50 | 8.25 | 7.50 | 32.50 | 43.75 | 41.25 | 43.75 | 30.00 | 32.50 | 37.50 | 41.25 | 37.50 |
| Environmental | 4 | 8.20 | 8.20 | 8.00 | 8.20 | 8.20 | 8.50 | 8.50 | 8.50 | 8.30 | 32.80 | 32.80 | 32.00 | 32.80 | 32.80 | 34.00 | 34.00 | 34.00 | 33.20 |
| Social and legal aspects | 4 | 8.40 | 8.20 | 7.80 | 8.20 | 8.00 | 8.40 | 8.80 | 8.60 | 8.00 | 33.60 | 32.80 | 31.20 | 32.00 | 32.00 | 33.60 | 35.20 | 34.40 | 32.00 |
| Final feasibility Score (%) | 76.32 | 83.83 | 80.52 | 83.48 | 74.26 | 78.39 | 81.26 | 83.32 | 78.98 | ||||||||||
| Weights (T, F, E, S) * | Feasibility Score (%) | ||||||||
|---|---|---|---|---|---|---|---|---|---|
| A1 | A2 | A3 | A4 | A5 | B1 | B2 | B3 | B4 | |
| (4,5,4,4) | 76.32 | 83.83 | 80.52 | 83.48 | 74.26 | 78.39 | 81.26 | 83.32 | 78.98 |
| (5,4,4,4) | 77.03 | 83.56 | 80.44 | 83.12 | 75.35 | 79.44 | 81.47 | 83.18 | 79.21 |
| (4,4,5,5) | 77.69 | 83.42 | 80.24 | 83.09 | 75.80 | 79.81 | 82.19 | 83.61 | 79.48 |
| (4,5,3,5) | 76.44 | 83.83 | 80.41 | 83.48 | 74.14 | 78.33 | 81.44 | 83.38 | 78.80 |
| (5,5,4,3) | 75.91 | 83.88 | 80.71 | 83.44 | 74.18 | 78.32 | 80.71 | 82.97 | 78.91 |
| (3,5,4,5) | 76.72 | 83.78 | 80.34 | 83.51 | 74.34 | 78.45 | 81.81 | 83.68 | 79.04 |
Publisher’s Note: MDPI stays neutral with regard to jurisdictional claims in published maps and institutional affiliations. |
© 2021 by the authors. Licensee MDPI, Basel, Switzerland. This article is an open access article distributed under the terms and conditions of the Creative Commons Attribution (CC BY) license (https://creativecommons.org/licenses/by/4.0/).
Share and Cite
Bandaru, S.H.; Becerra, V.; Khanna, S.; Espargilliere, H.; Torres Sevilla, L.; Radulovic, J.; Hutchinson, D.; Khusainov, R. A General Framework for Multi-Criteria Based Feasibility Studies for Solar Energy Projects: Application to a Real-World Solar Farm. Energies 2021, 14, 2204. https://doi.org/10.3390/en14082204
Bandaru SH, Becerra V, Khanna S, Espargilliere H, Torres Sevilla L, Radulovic J, Hutchinson D, Khusainov R. A General Framework for Multi-Criteria Based Feasibility Studies for Solar Energy Projects: Application to a Real-World Solar Farm. Energies. 2021; 14(8):2204. https://doi.org/10.3390/en14082204
Chicago/Turabian StyleBandaru, Sree Harsha, Victor Becerra, Sourav Khanna, Harold Espargilliere, Law Torres Sevilla, Jovana Radulovic, David Hutchinson, and Rinat Khusainov. 2021. "A General Framework for Multi-Criteria Based Feasibility Studies for Solar Energy Projects: Application to a Real-World Solar Farm" Energies 14, no. 8: 2204. https://doi.org/10.3390/en14082204
APA StyleBandaru, S. H., Becerra, V., Khanna, S., Espargilliere, H., Torres Sevilla, L., Radulovic, J., Hutchinson, D., & Khusainov, R. (2021). A General Framework for Multi-Criteria Based Feasibility Studies for Solar Energy Projects: Application to a Real-World Solar Farm. Energies, 14(8), 2204. https://doi.org/10.3390/en14082204