
The Fundamental Principles and Standard Evaluation for Fluid Loss and Possible Extensions of Test Methodology to Assess Consequences for Formation Damage

 , ,
, ,
Abstract
:1. Introduction
2. Analytical Approach
- Enabling reverse flow of a fluid through the discs, after the HTHP tests, to understand filter-cake lift-off pressures.
- Enabling measurement of disc mass before and after the HTHP test and filter-cake removal to obtain indications of polymer or solids invasion into the discs.
- Enabling disc permeability estimation before and after the HTHP test and filter-cake removal to obtain indications of changes in disc permeability.
- Studying fluid loss profiles and filter-cake building.
- Establishing a practical routine for application of breaker fluid or acid to remove filter-cake.
- Understanding how various fluid degradation methods may impact the fluid loss and reservoir formation damage.
2.1. Key Factors in Fluid Loss Measurement Using Water-Based Drilling Fluids
2.1.1. Equipment for Testing According to ANSI/API 13B-1
- Hamilton Beach Mixer, Virginia, USA;
- Ohaus Pioneer Precision PX3202, New Jersey, USA;
- Ofite Filter Press HTHP 175 mL, Double Capped, Texas, USA;
- Ofite Viscometer model 900, Texas, USA;
- Ofite roller-oven #172-00-1-C, Texas, USA;
- Apera pH90, pH meter, Wuppertal, Germany.
2.1.2. Test Procedure and Data Collection in Accordance with ANSI/API 13B-1
- Measure the filter-cake thickness, at its center, to the nearest millimeter (or 1/32 in).
- Observe indications of settling of solids on the filter-cake, such as an abnormally thick cake or coarse texture, and record comments.
- The filtrate volume Vf should be measured and normalized with regards to filter area.
2.2. Extending the HTHP Filtration Tests to Study Signs of Formation Damage
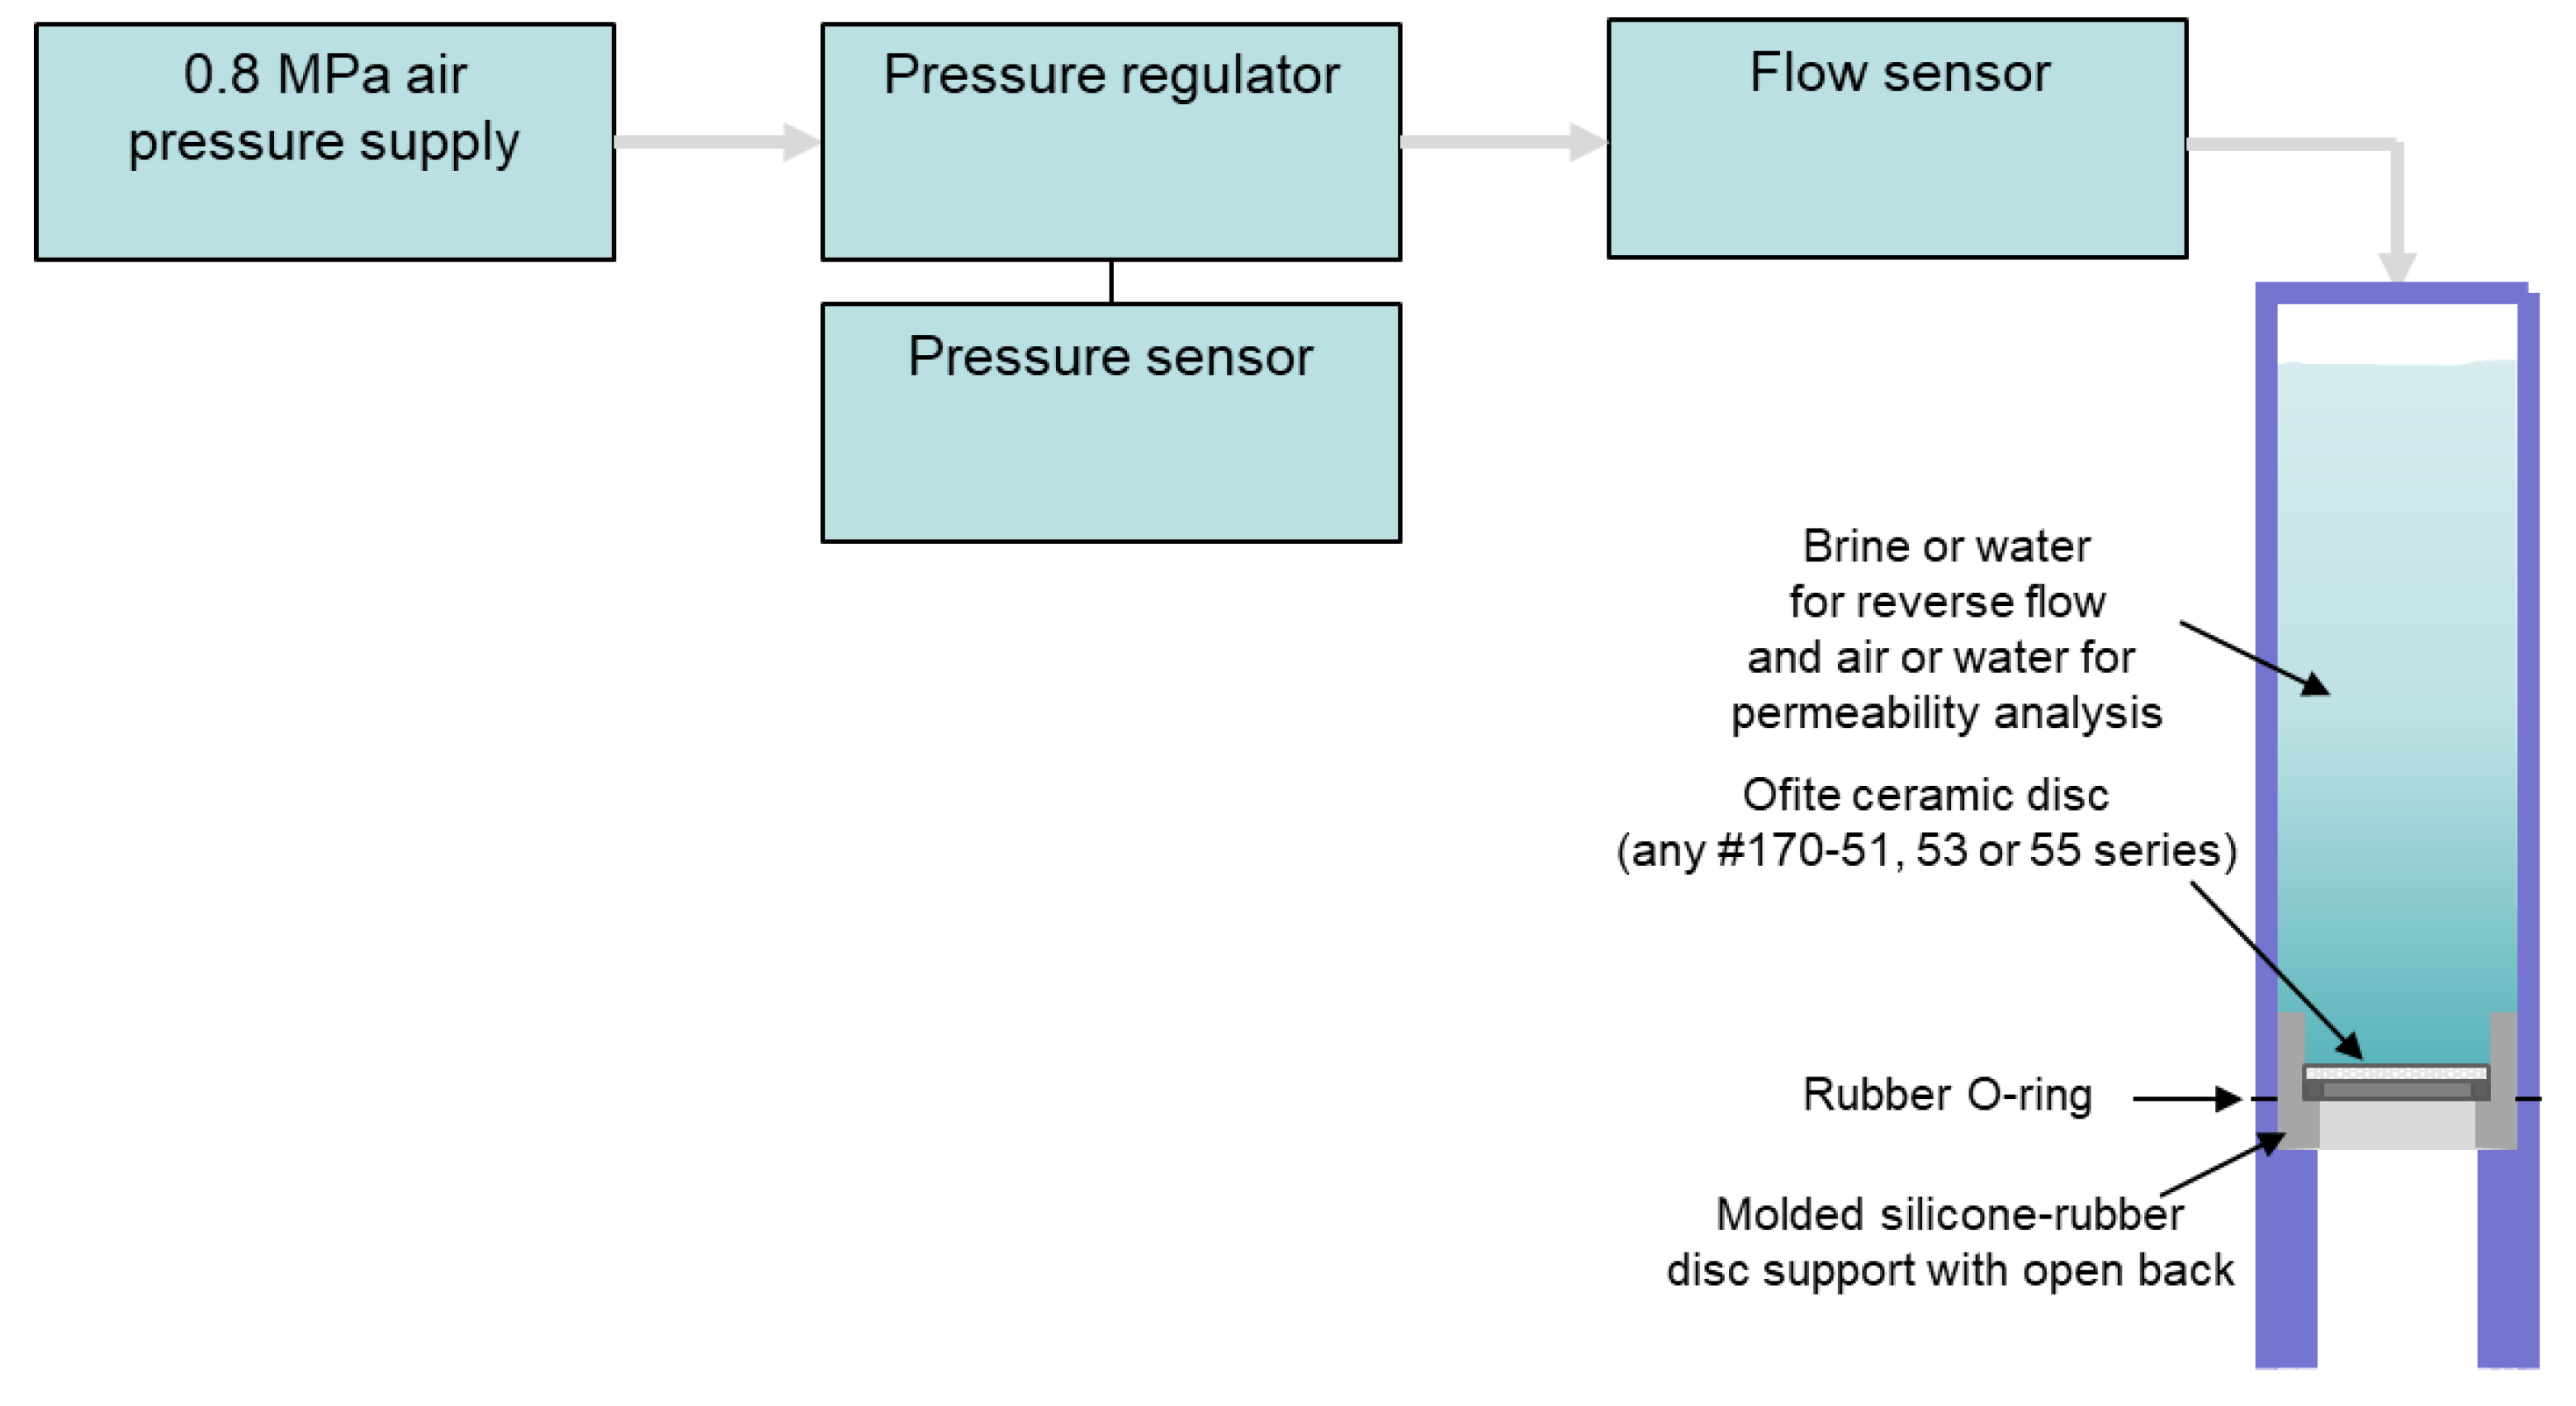
2.2.1. Equipment Overview
- Ohaus MB120 Moisture Analyzer;
- Custom built transparent acrylic cell with stand for enabling of reverse flow of fluid through the ceramic discs;
- Festo pressure regulator LRP-1/4-2.5 and LRP-1/4-0.25;
- Festo Pressure Sensor SPAN-P025R and SPAN-P10R;
- Festo Flowmeter SFAH-10U;
- Nitrogen source and manifold for pressure up to 9.3 MPa (1350 psi), Ofite #171-24;
- Vacuum machine, DVP EC.20-1.
2.2.2. Procedures Applied for Testing Using Experimental Set-Up
3. Experimental Data
3.1. Identifying Signs of Polymer, Solids or Fiber Invasion into Permeable Formations Using a Moisture Analyzer to Measure Changes in Disc Mass
3.2. Extending the Testing Regime to Include Estimation of Disc Permeability Changes
4. Observations and Lessons Learned from the Experimental Procedure
5. Conclusions
- By extending the testing procedure with (i) a moisture analyzer and (ii) reverse flow equipment and a procedure for reverse flow and breaker fluid application it was possible to measure the increases in disc mass accurately.
- Reverse flow of fluid through the disc with filter-cake enables studying the removal of filter-cake by back pressure.
- Application of an oxidizing breaker did in certain cases allow the test discs to return to almost its original state, with mass changes so low that they may be considered to be within the tolerances of the tests.
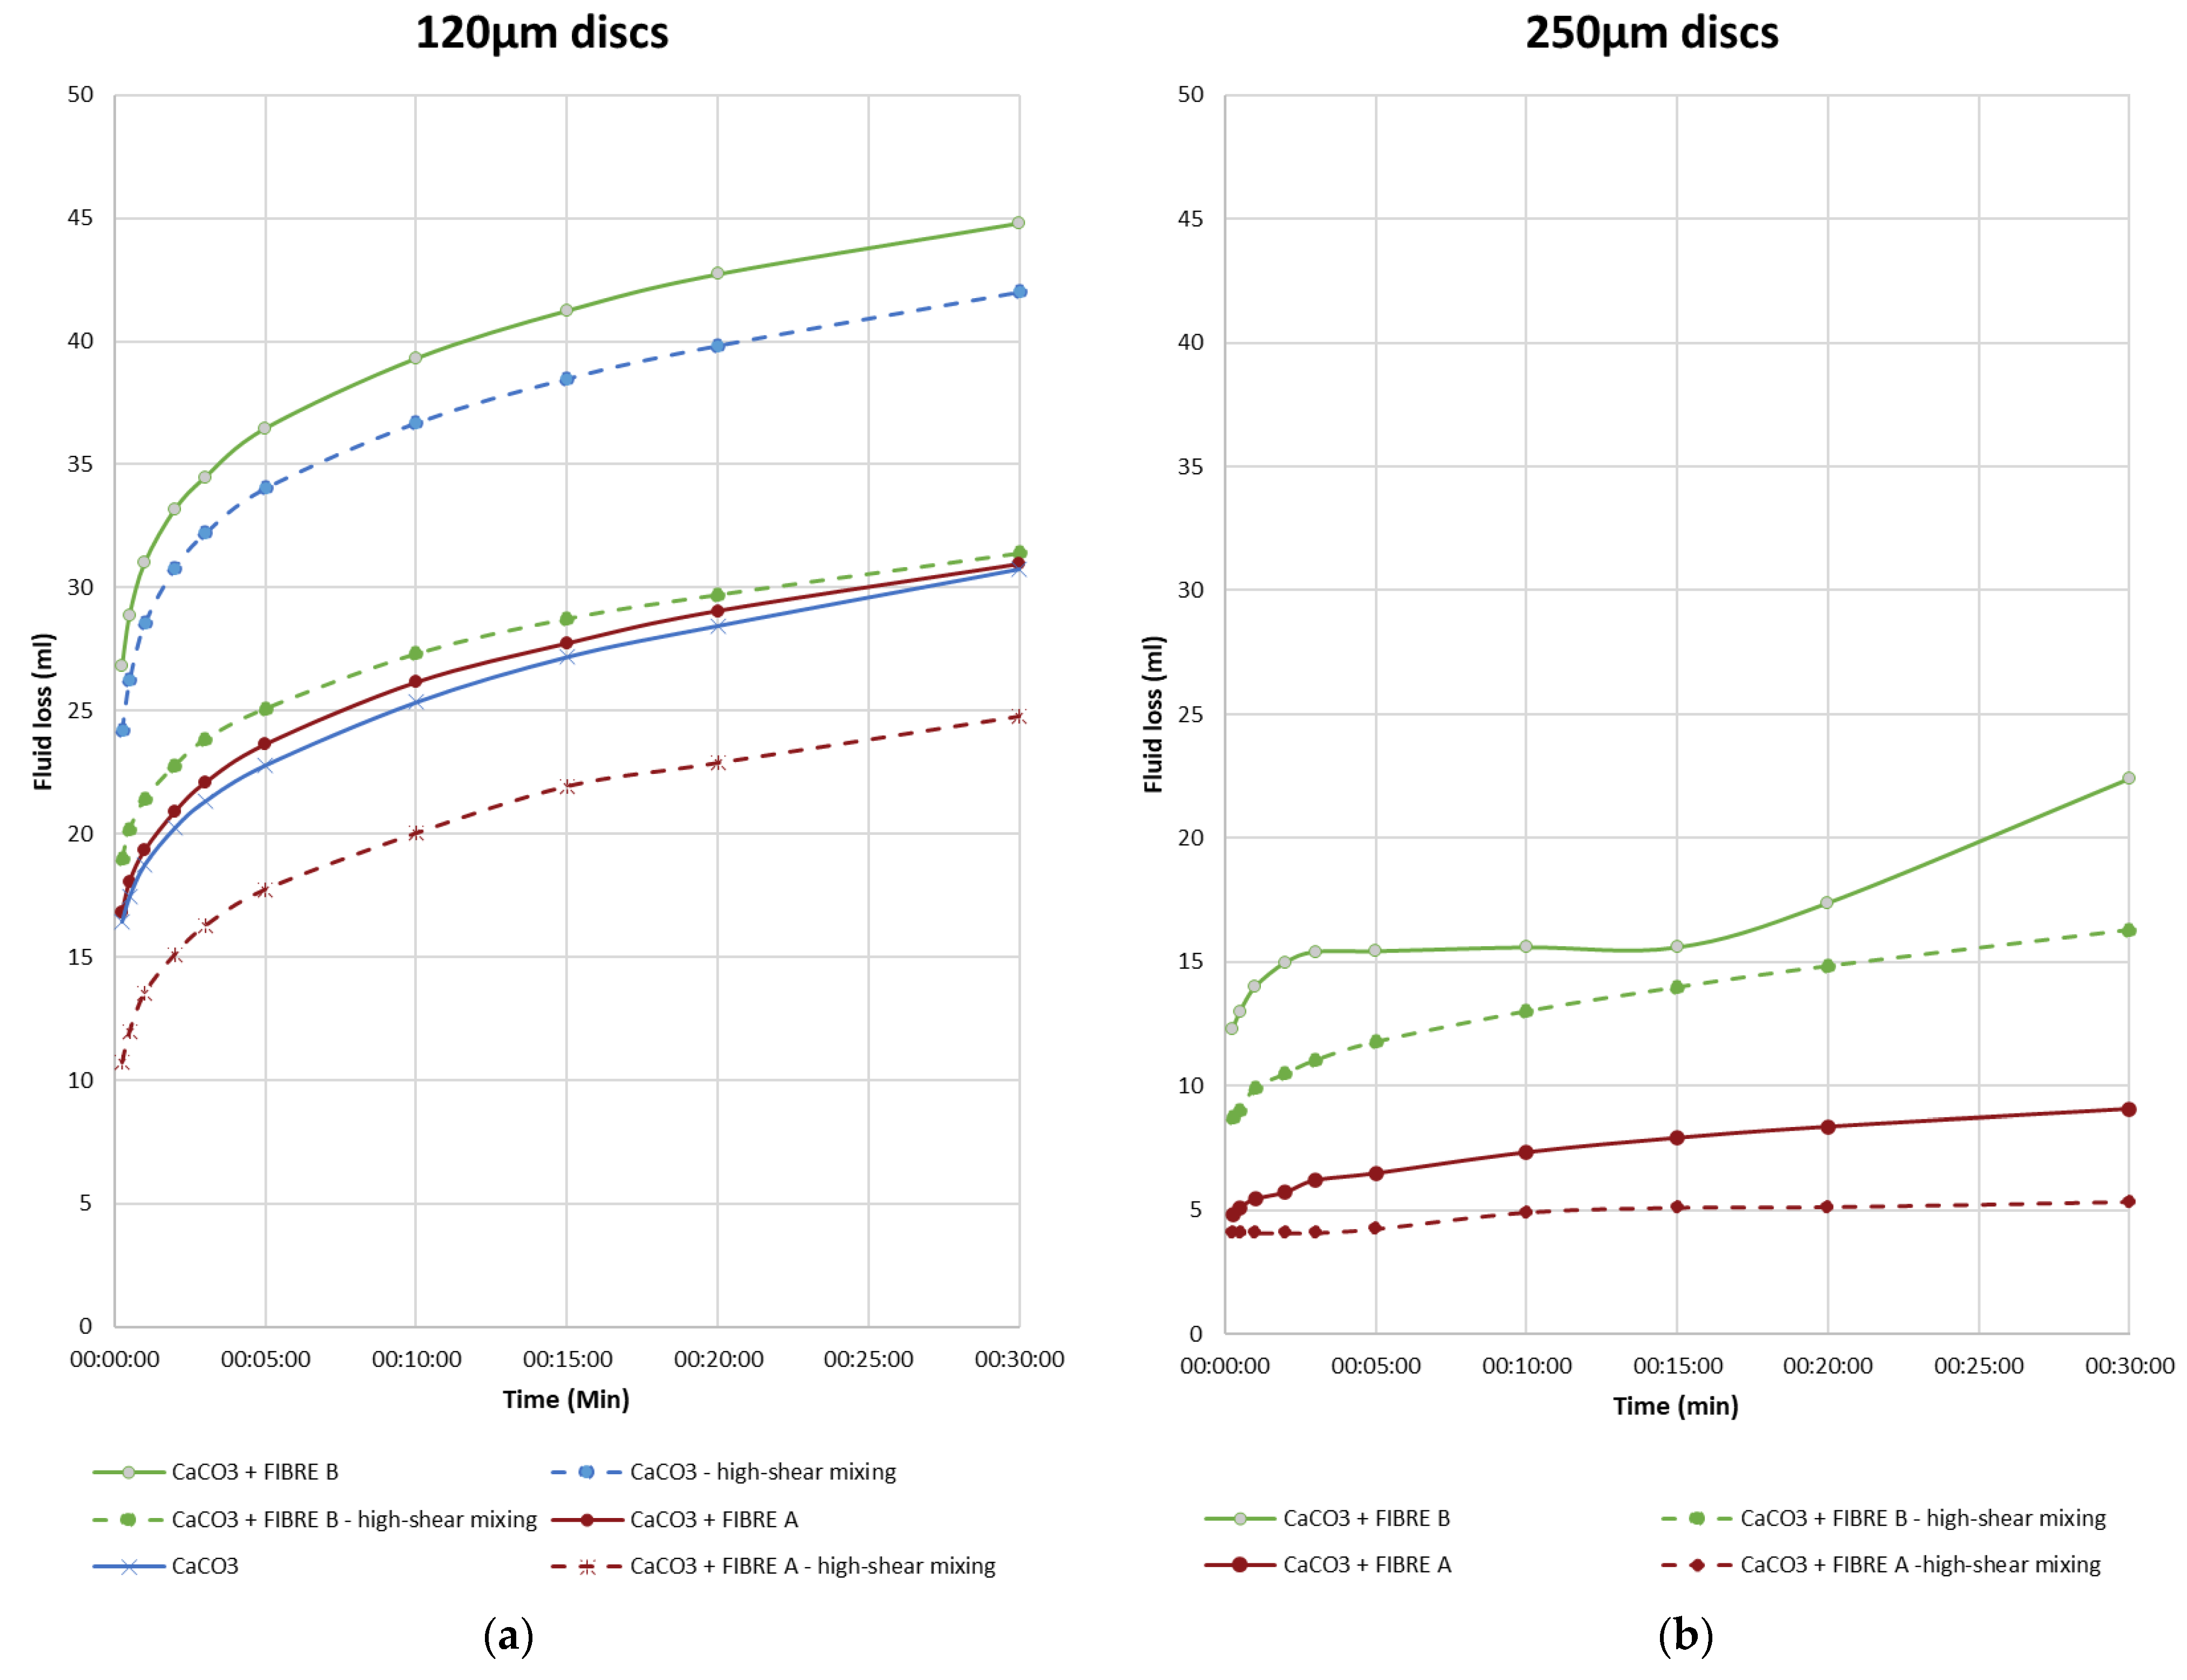
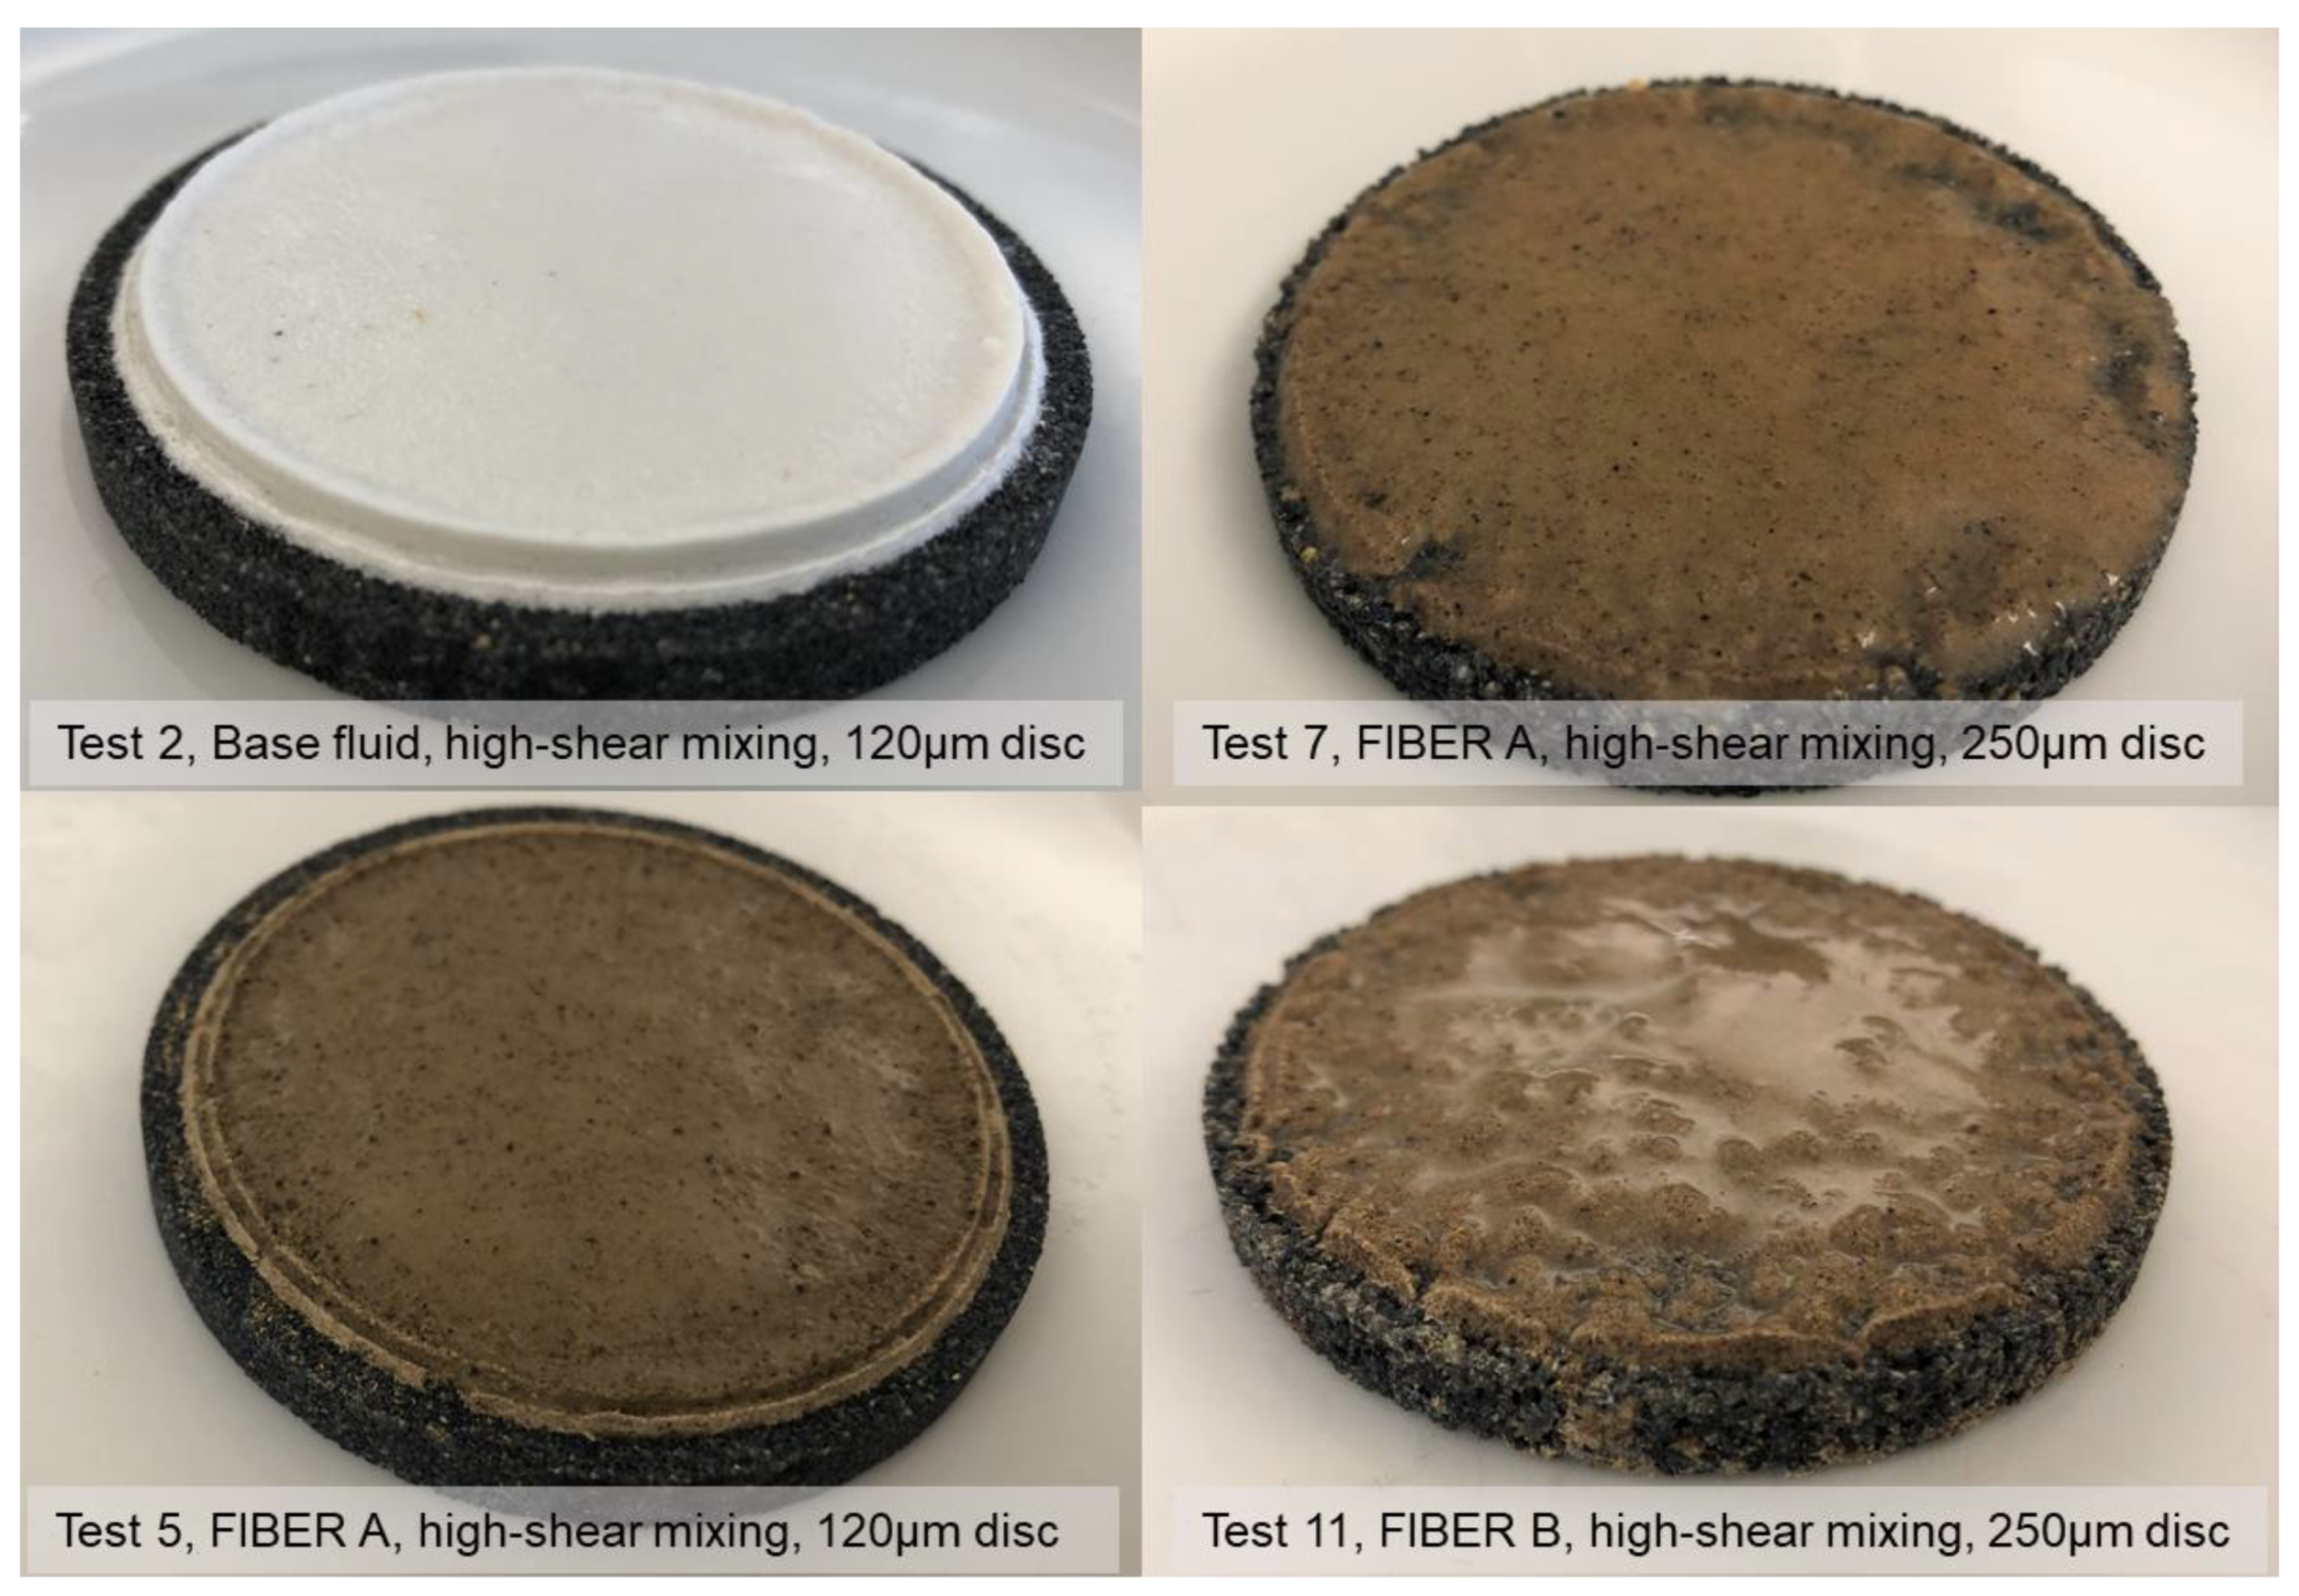
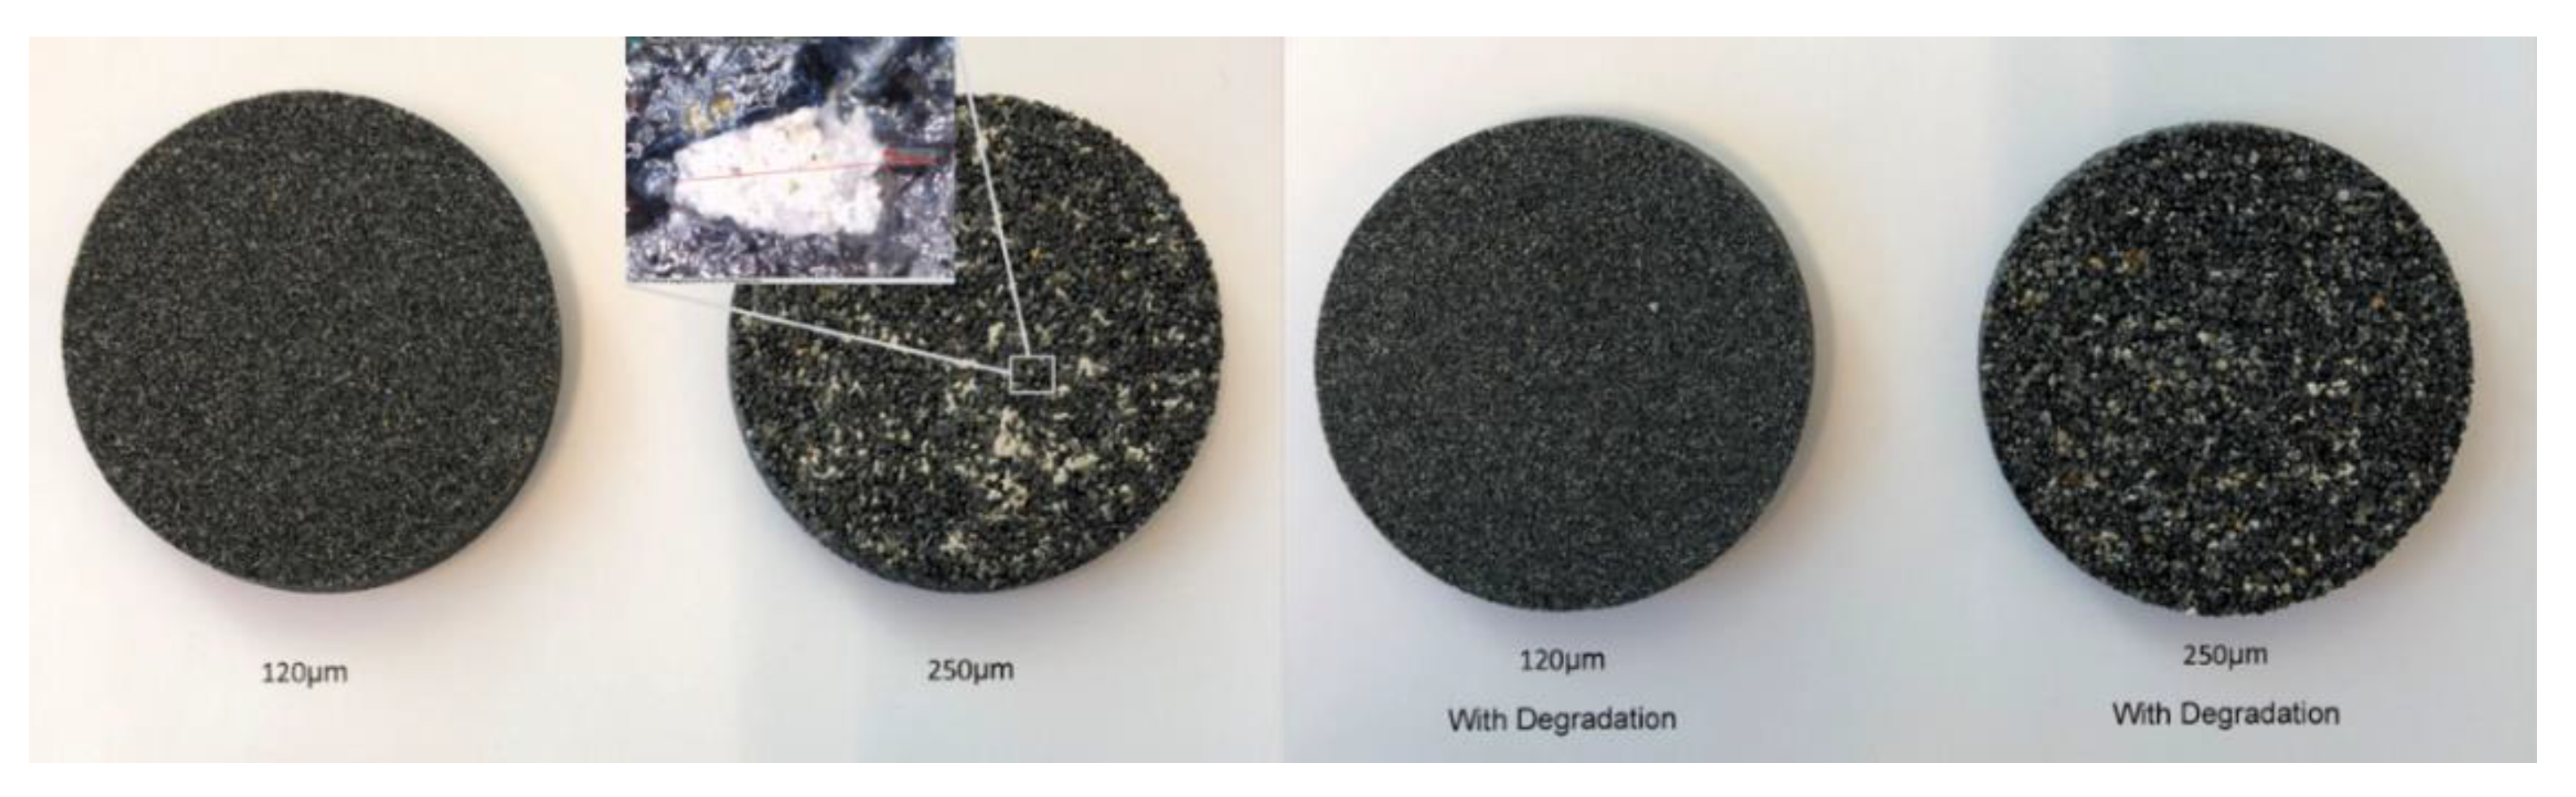
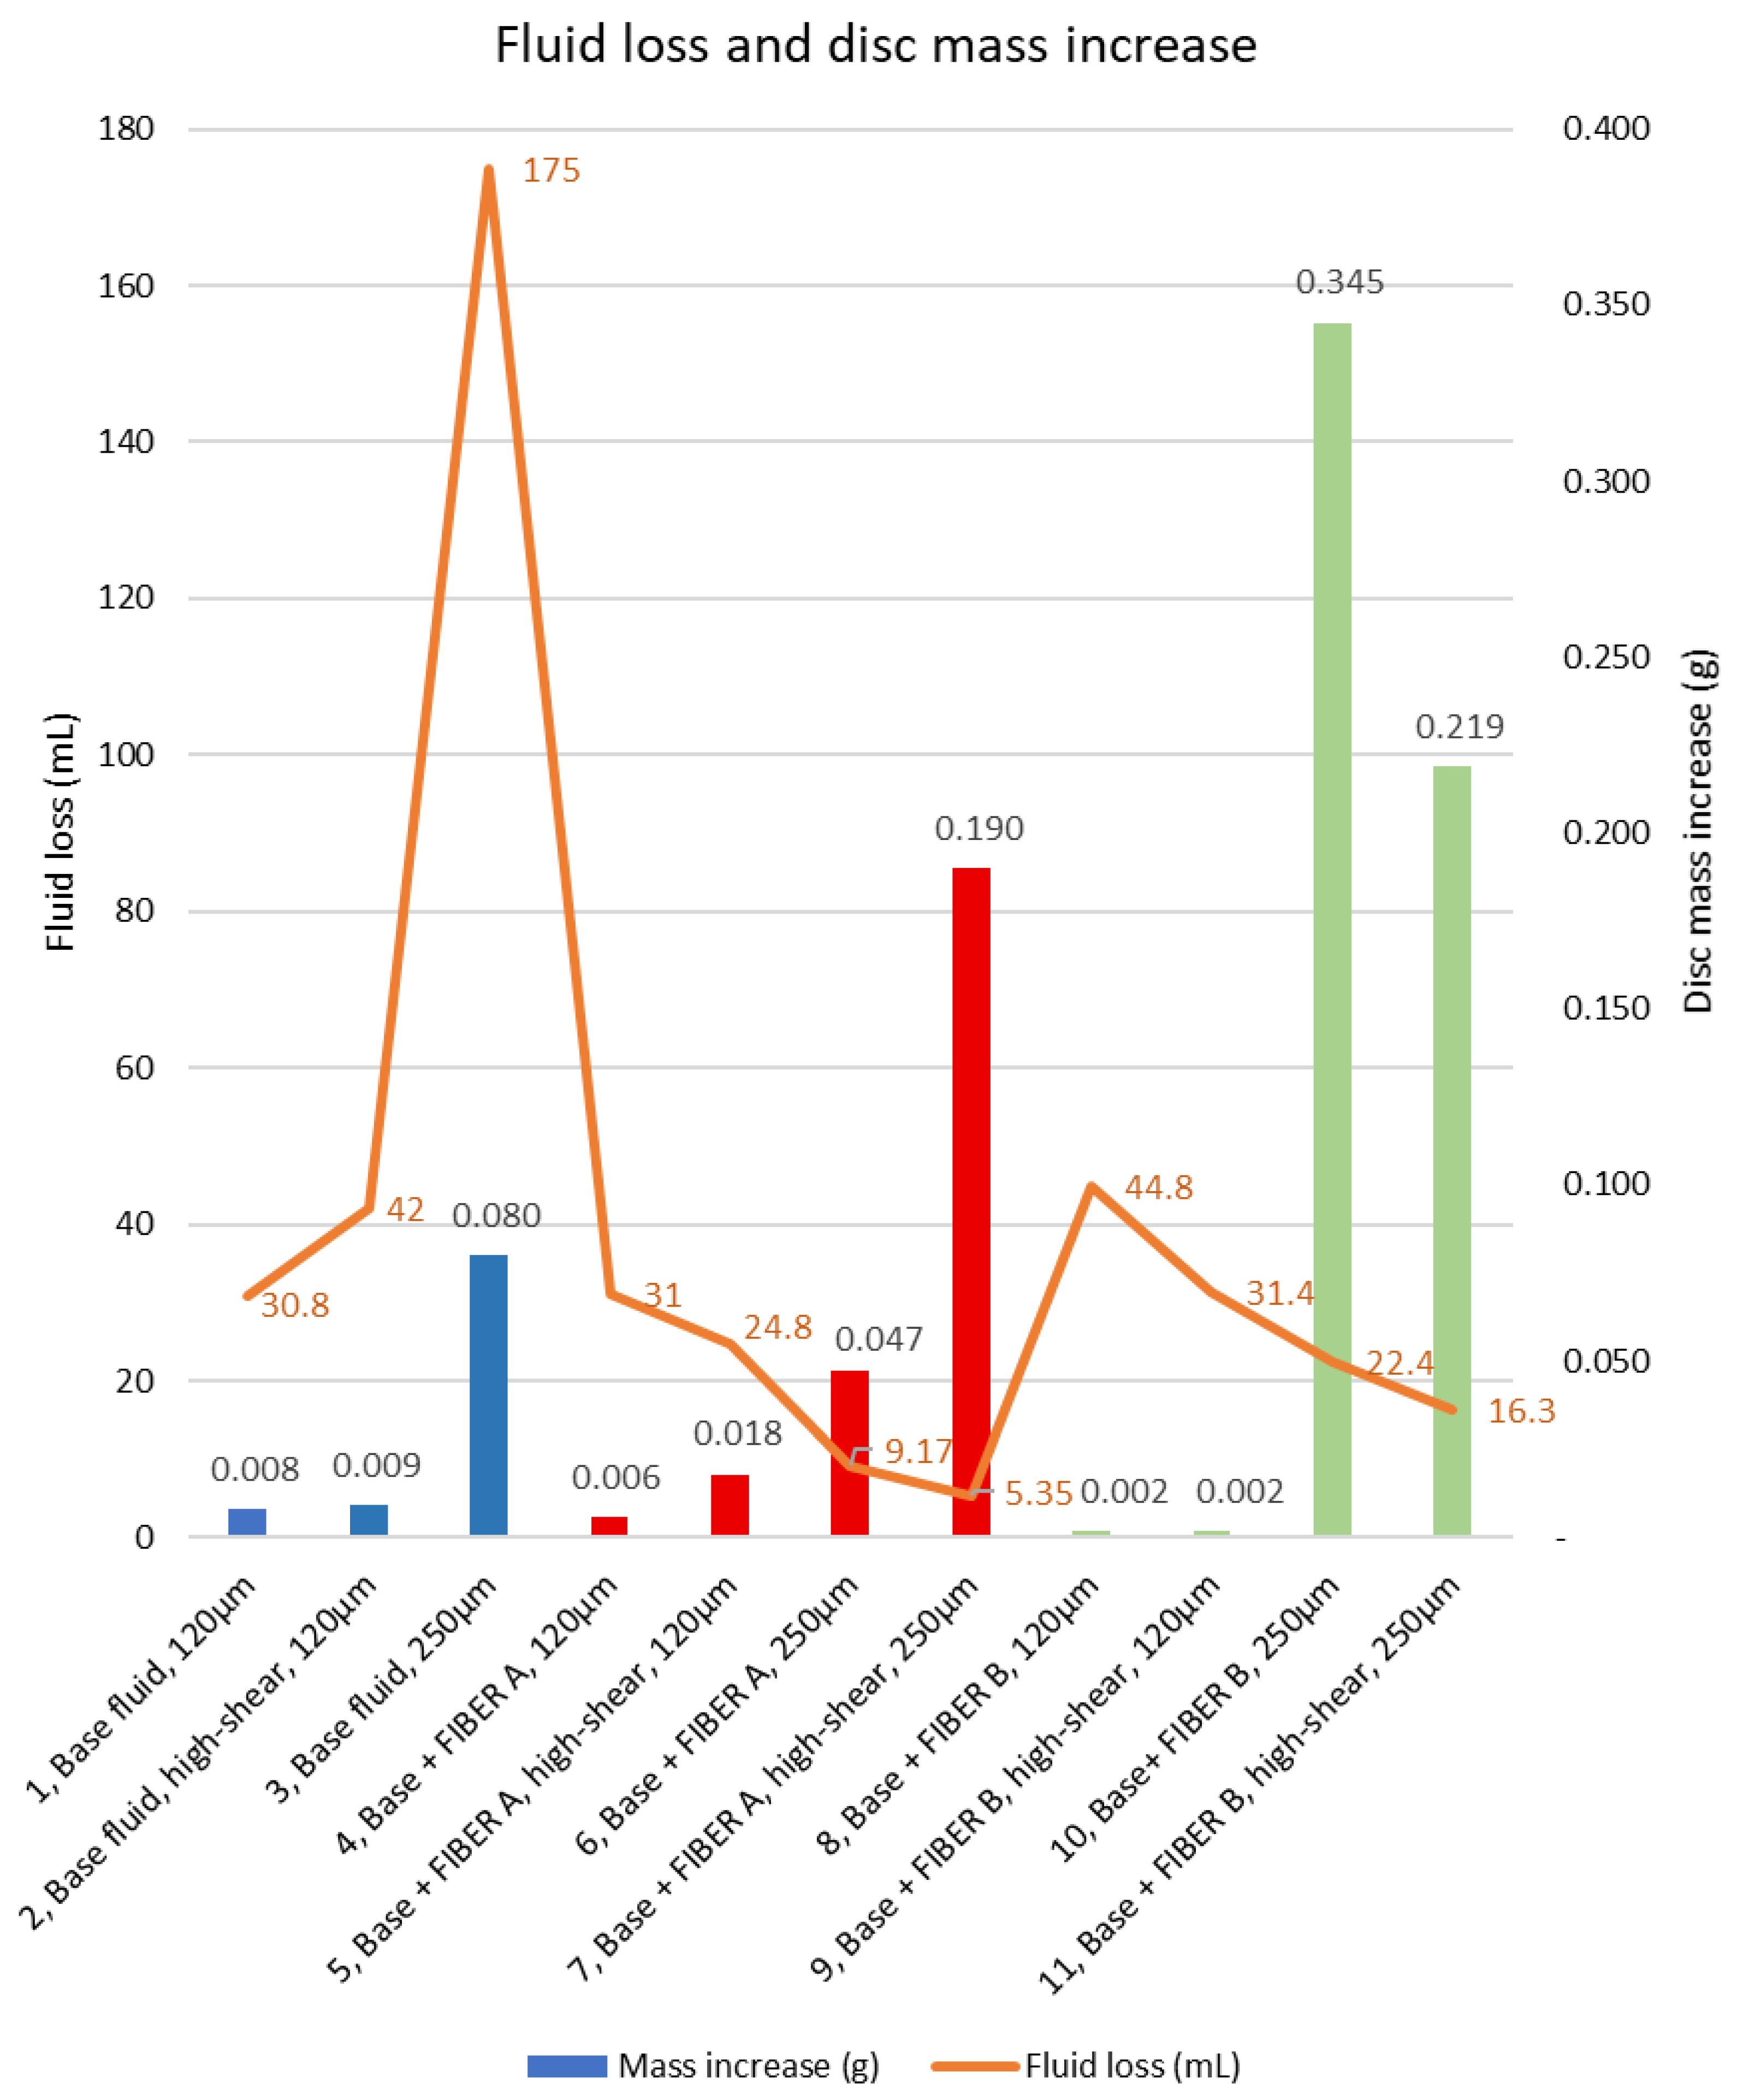
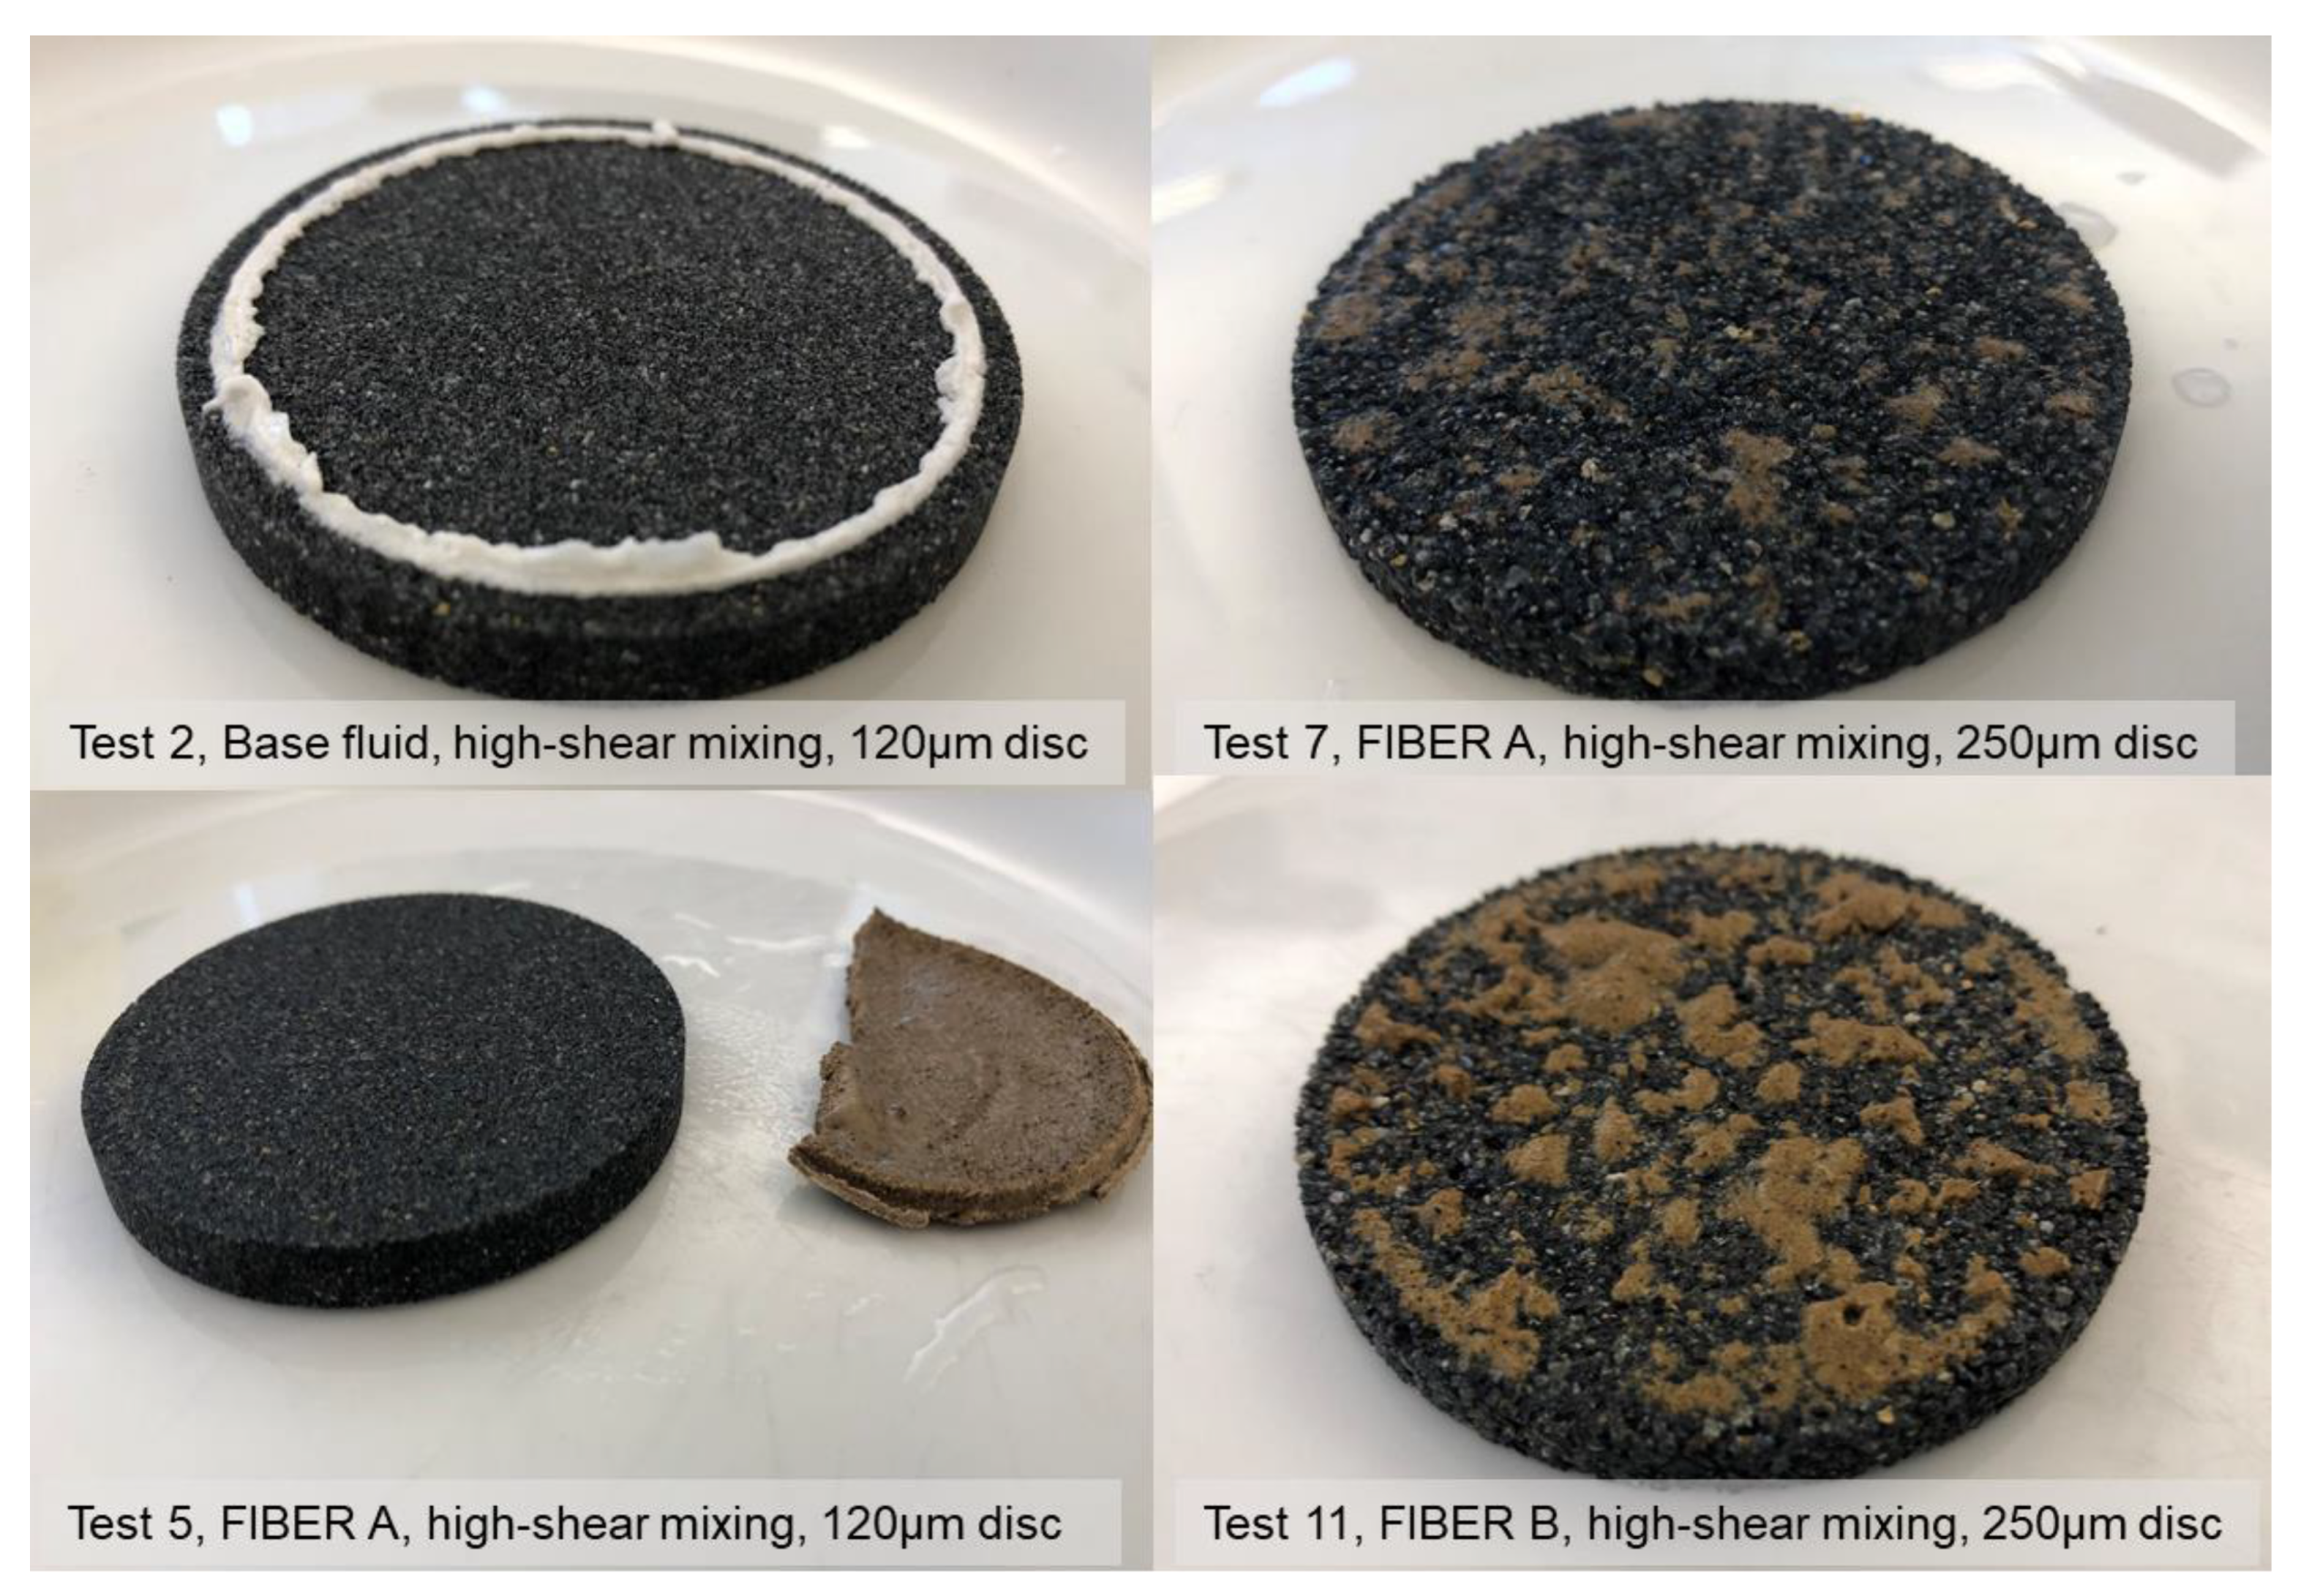
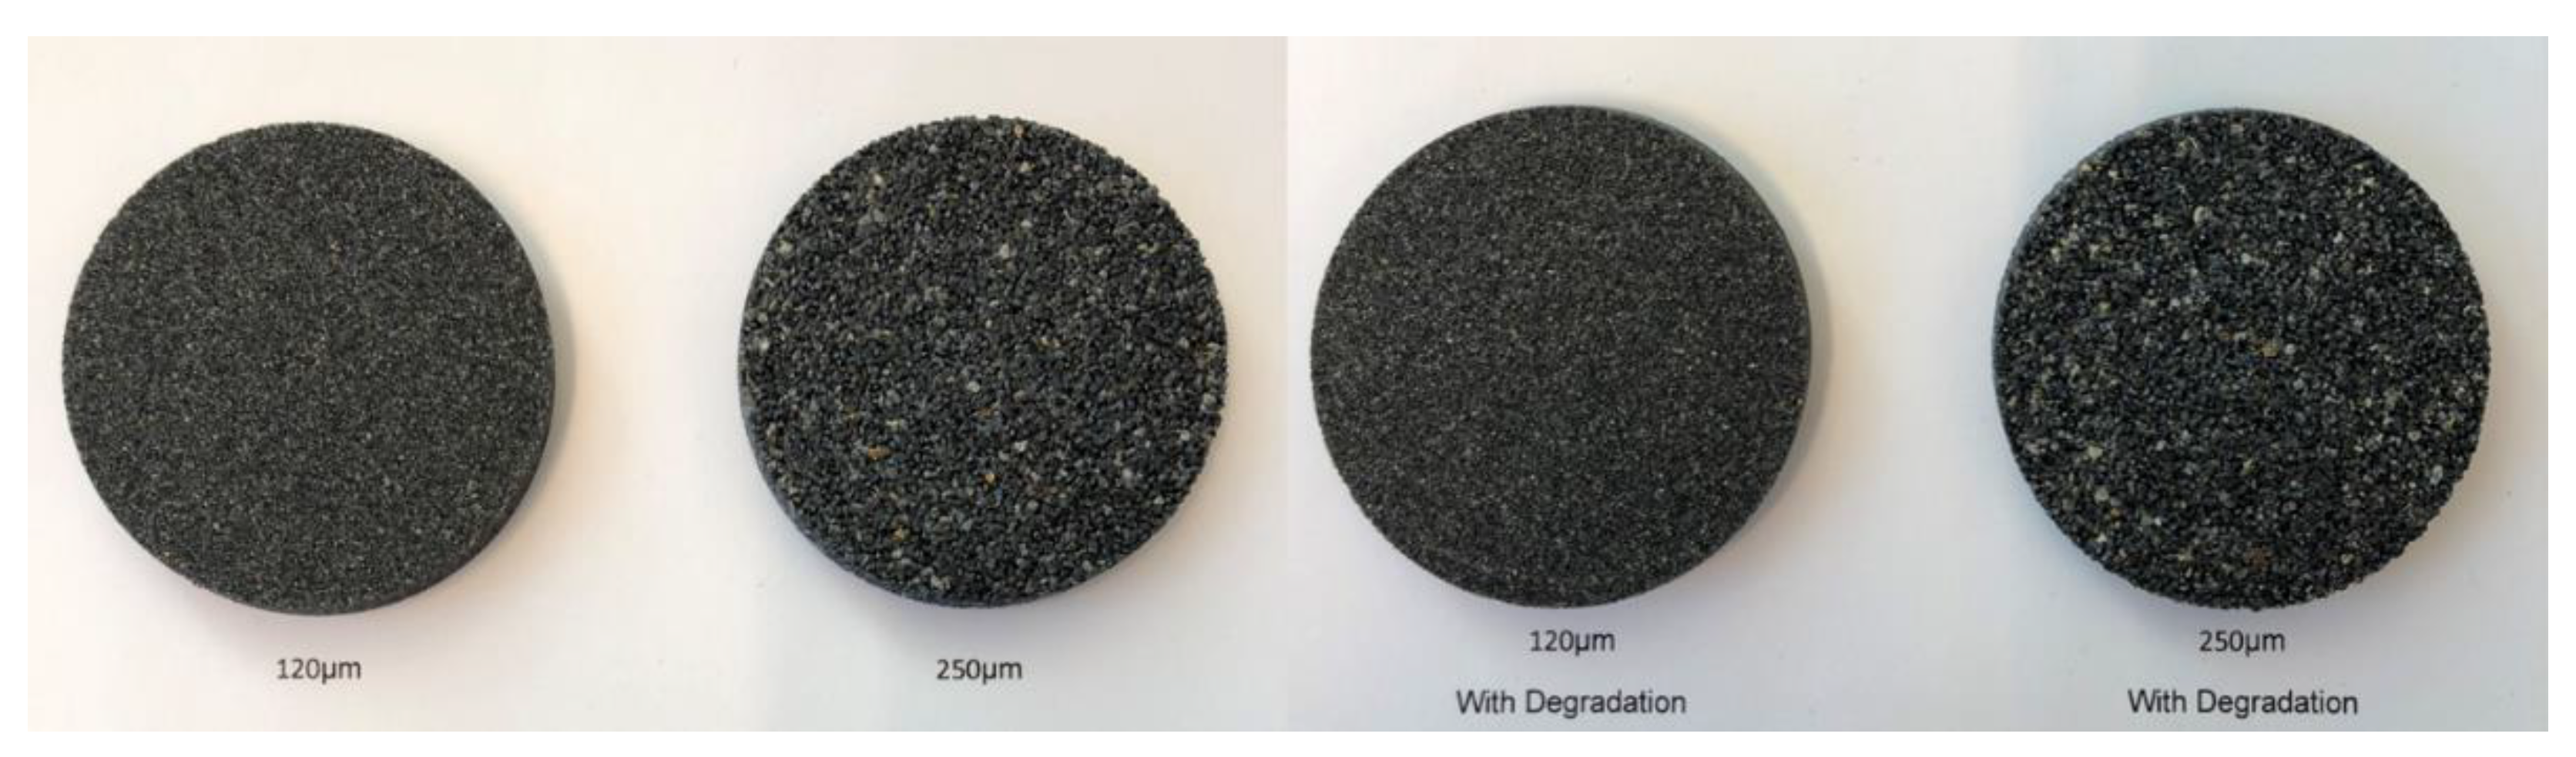
- As the discs median pore-throat size was varied relative to the particle size of the fibers and CaCO3, for tests 1–11, it appeared that different mechanisms for sealing the disc and creating a filter-cake was obtained. Hereunder, when the solids or fibers were equal or marginally smaller than the pore-throat openings, fluid loss was reduced, and the sealing appeared to partial plugging of the pore-throats. In contrast, when a significant portion of the particles was larger than the mean pore-throat size, a thicker and more uniform filter-cake was building on the disc. Without the presence of fibers or when the solids were smaller than the pore-throats, no low-permeability filter-cake was formed, and disc mass increases were significant.
- In the tests on the 120–250 µm discs where either of the fiber products was present, there was an inverse relationship between fluid loss and disc mass increases. In the tests on the 20 µm discs, the fibers appeared to be larger than the pore-throats, and there was a positive relationship between lower fluid loss and lower disc mass increase.
- Testing of disc mass change and change of permeability to water and air suggested that ranking 20 µm discs in terms of lowest increase in mass and lowest calculated change to water-permeability would yield consistent results in terms of indicating formation damage. Since the other disc grades are built up in the same way as the 20 µm discs, it may be possible to obtain equivalent results with discs of other grades.
- The findings on using the new testing methodologies are indicating that valuable information concerning reservoir formation damage may be observed and estimated using a relatively simple set-up and test procedure. To further investigate this potential, it is recommended to conduct further experiments. One of the natural extensions of the methodology is to investigate using a non-polar hydrocarbon-based fluid for testing of permeability and for presoaking discs before the fluid loss test.
Author Contributions
Funding
Institutional Review Board Statement
Informed Consent Statement
Data Availability Statement
Conflicts of Interest
Appendix A

| Mixing Sequence | Material/Additive | Mass (g) |
|---|---|---|
| 1 | H2O | 328 |
| 2 | Na2CO3 | 0.02 |
| 3 | NaOH | 0.25 |
| 4 | Xanthan Gum | 1.2 |
| 5 | Poly-Anionic Cellulose, Low Viscosity | 4.0 |
| 6 | MgO | 1.0 |
| 7 | KCl | 17.5 |
| 8 | Bentonite | 5.0 |
| 9 | CaCO3 (D50 of 50 µm) | 30.0 |
| 10 | With or without FIBER A or FIBER B at given concentration | 8.0 |
| Additive | <90 µm | 90–180 µm | >180 µm |
|---|---|---|---|
| CaCO3 | 74.2% | 24.8% | 1.0% |
| FIBER A | 56.3% | 30.6% | 13.1% |
| FIBER B | 29.5% | 56.5% * | 13.9% |
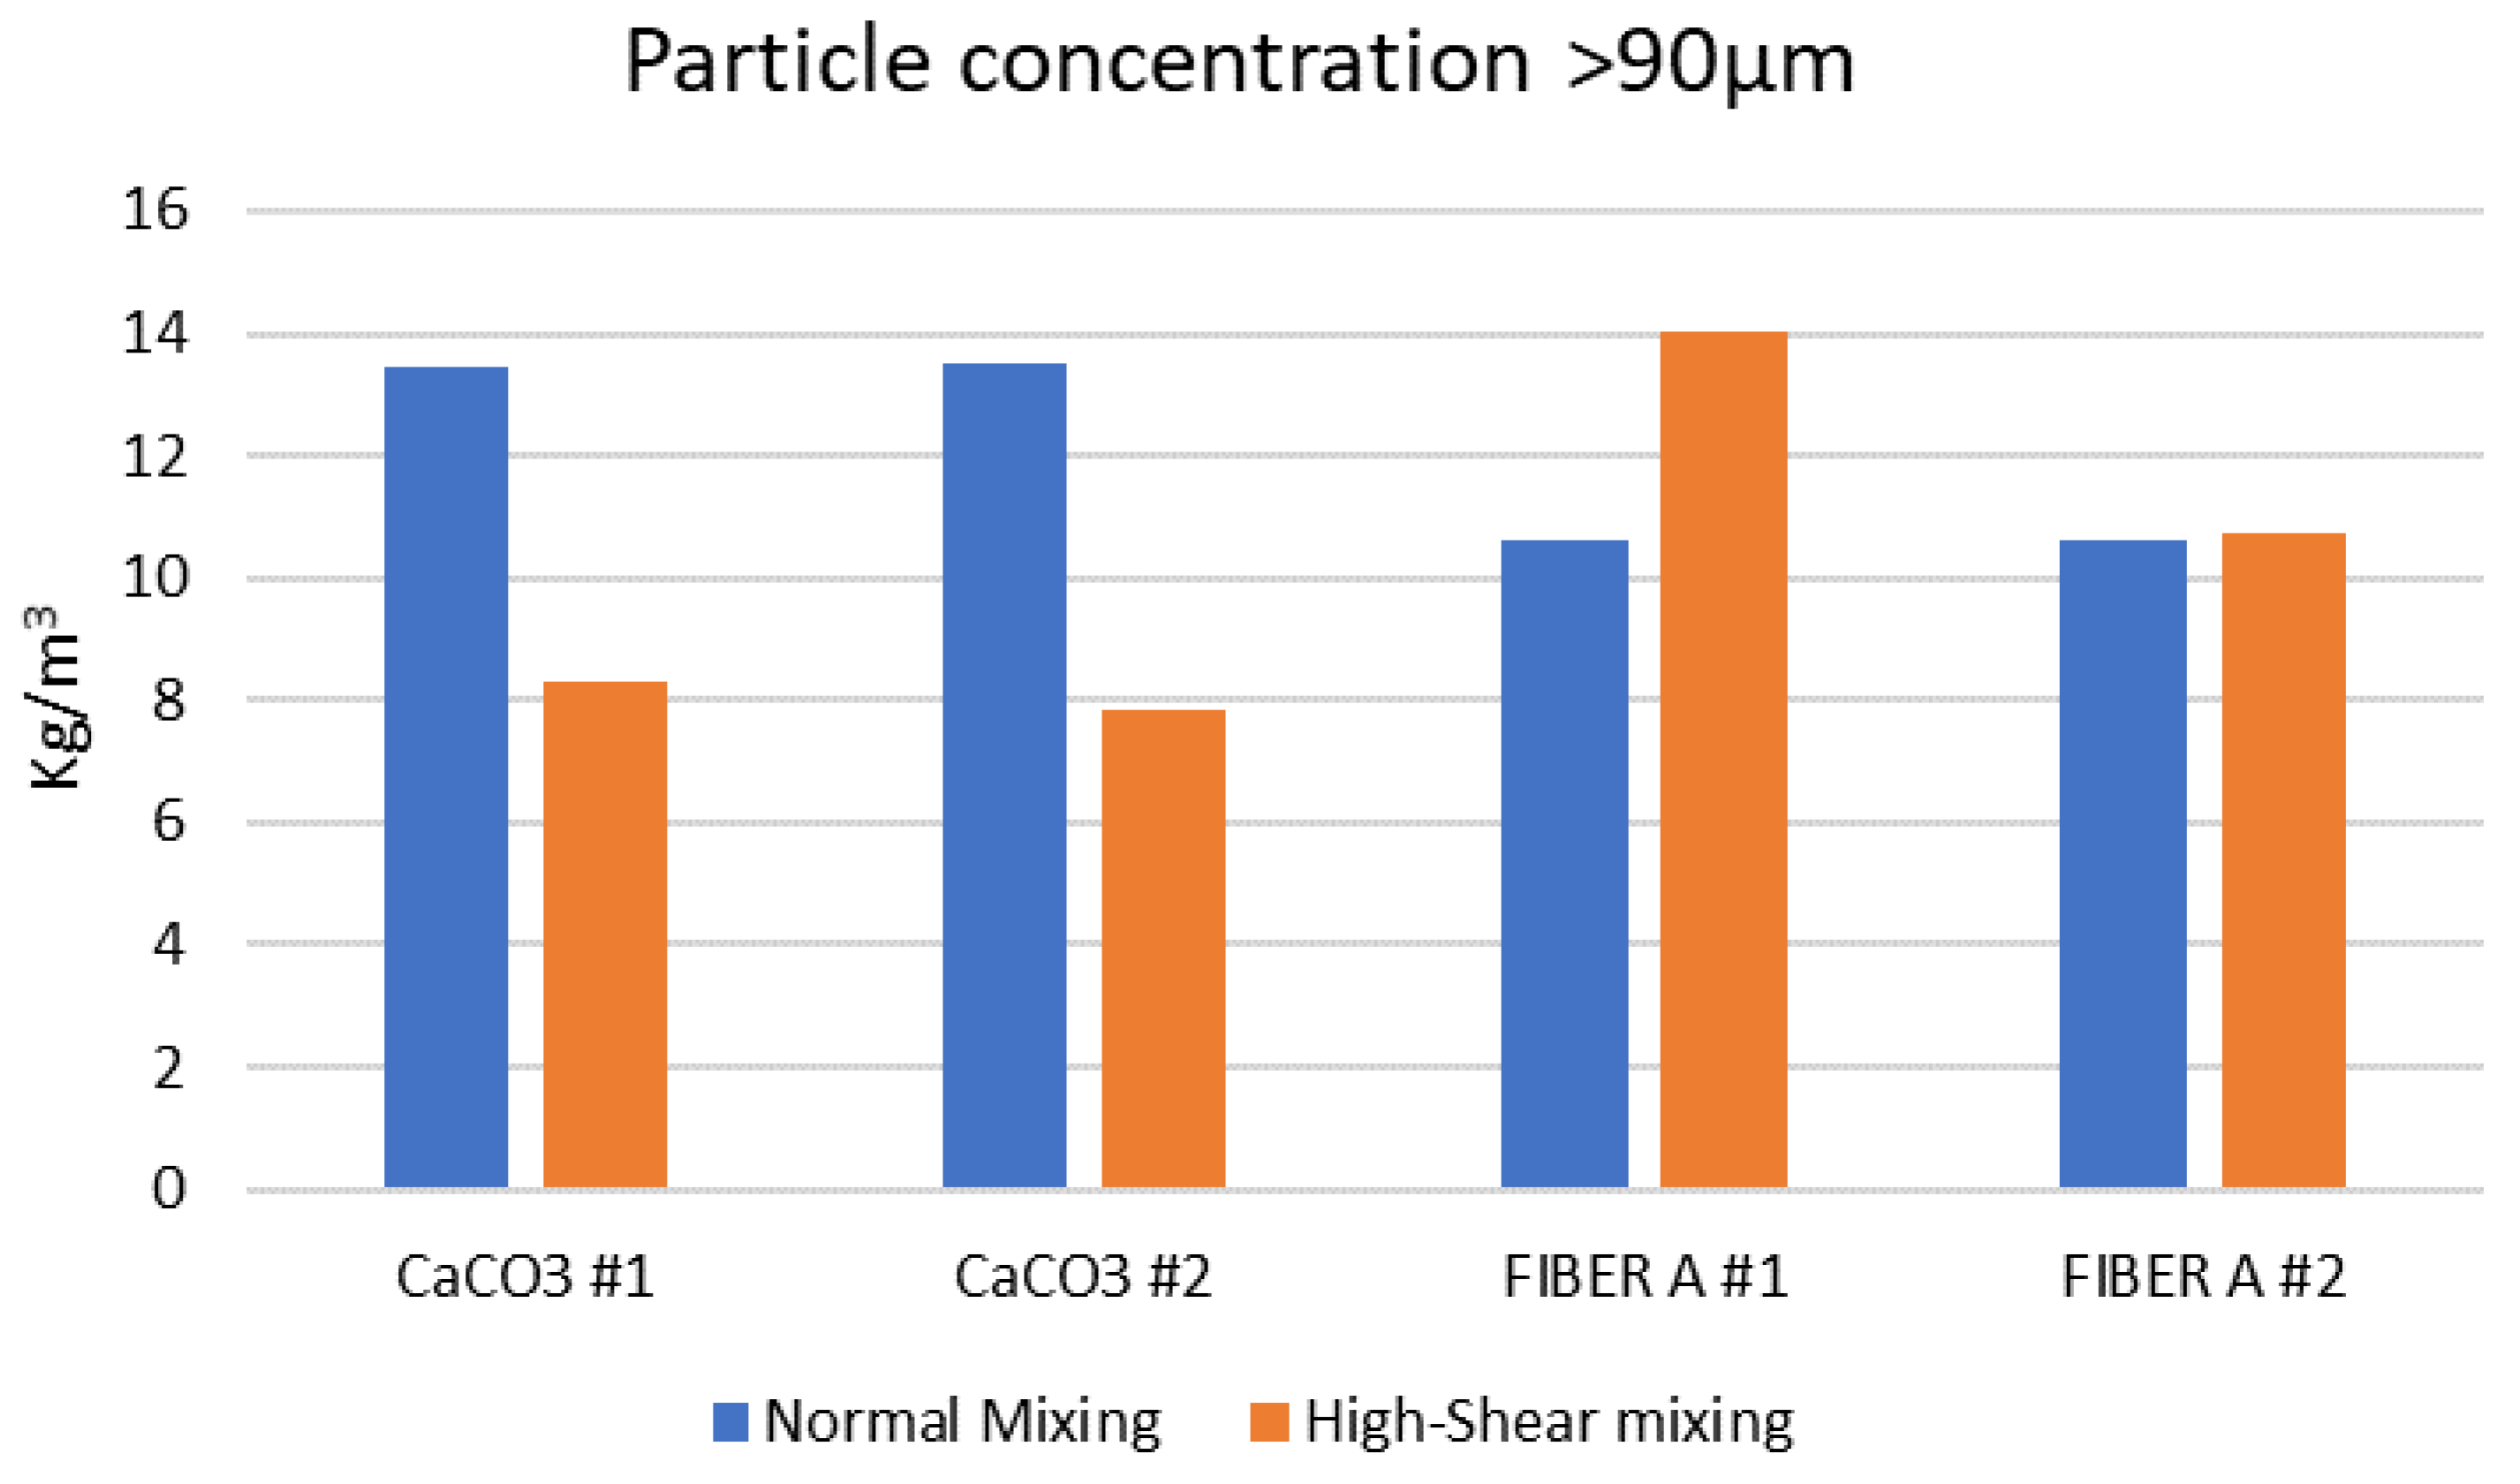
| Wet Sieving before and after High-Shear Degradation | <90 µm | >90 µm |
|---|---|---|
| CaCO3 Sample #1, normal mixing | 84.3% | 15.7% |
| CaCO3 Sample #2, normal mixing | 84.2% | 15.8% |
| CaCO3 Sample #1, 30 min high-shear mixing | 90.3% | 9.7% |
| CaCO3 Sample #2, 30 min high-shear mixing | 90.8% | 9.2% |
| FIBER A Sample #3, normal mixing | 53.4% | 46.6% |
| FIBER A Sample #4, normal mixing | 53.5% | 46.5% |
| FIBER A Sample #5, 30 min high-shear mixing together with bentonite | 38.6% | 61.4% |
| FIBER A Sample #4, 30 min high-shear mixing | 52.9% | 47.1% |
| Test with Changes in Disc Mass | Original Disc Mass (g) | Final Disc Mass (g) | Mass Increase (g) |
|---|---|---|---|
| 1, Base fluid (with bentonite and CaCO3), normal mixing, 120 µm disc | 50.098 | 50.106 | 0.008 |
| 2, Base fluid, high-shear mixing, 120 µm disc | 50.069 | 50.078 | 0.009 |
| 3, Base fluid, normal mixing, 250 µm disc (TOTAL LOSS) | 50.249 | 50.329 | 0.080 |
| 4, Base fluid plus FIBER A, normal mixing, 120 µm disc | 50.419 | 50.425 | 0.006 |
| 5, Base fluid plus FIBER A, high-shear mixing, 120 µm disc | 49.970 | 49.988 | 0.018 |
| 6, Base fluid plus FIBER A, normal mixing, 250 µm disc | 50.624 | 50.671 | 0.047 |
| 7, Base fluid plus FIBER A, high-shear mixing, 250 µm disc | 50.457 | 50.647 | 0.190 |
| 8, Base fluid plus FIBER B, normal mixing, 120 µm disc | 49.789 | 49.791 | 0.002 |
| 9, Base fluid plus FIBER B, high-shear mixing, 120 µm disc | 49.927 | 49.929 | 0.002 |
| 10, Base fluid plus FIBER B, normal mixing, 250 µm disc | 50.139 | 50.484 | 0.345 |
| 11, Base fluid plus FIBER B, high-shear mixing, 250 µm disc | 50.204 | 50.423 | 0.219 |
| Mixing Sequence | Material/Additive | Mass (g) |
|---|---|---|
| 1 | H2O | 328 |
| 2 | Na2CO3 | 0.02 |
| 3 | NaOH | 0.25 |
| 4 | Xanthan Gum | 1.2 |
| 5 | Poly-Anionic Cellulose, Low Viscosity | 4.0 |
| 6 | MgO | 1.0 |
| 7 | KCl | 17.5 |
| 8 | With or without Bentonite at given concentration | 10.0 |
| 9 | With or without FIBER UF at given concentration | 5.0 |

Appendix B
- Mix drilling fluid according to the recipe;
- Measure pH and rheology;
- Hot-roll and if applicable degrade by high-shear stirring or other degradation method;
- Measure pH and rheology after hot-rolling and any degradation;
- Mark and weigh disc in dry condition using the moisture analyzer (Mb). Moisture analyzer shall be set to dry disc at 105 °C until change in mass is less than 1 mg/60 s;
- Optional step: place disc in acrylic cell and measure air temperature and flowrate at different pressures to calculate average permeability to air (Kab);
- Optional step: place disc in acrylic cell and place arrangement with water in vacuum (circa −0.96 bar for 5 min) to remove any air from disc or water. Flow thereafter water through disc and measure water temperature and flowrate at different pressures to calculate average permeability to water (Kwb);
- Soak disc in brine (40 g NaCl per 1000 g freshwater) in vacuum;
- Conduct HTHP test at desired pressure, typically 3.45 MPa (500 psi) or 6.9 MPa (1000 psi), and measure both volume (Vf) and mass (Mf) of fluid filtrate at point in time of 15 s, 30 s, 1 min, 2 min, 3 min, 5 min, 10 min, 15 min, 20 min and 30 min (Vf). Calculate fluid filtrate density;
- Weigh disc with filter-cake and observe filter-cake;
- Place disc in acrylic cell and reverse flow with 1 L (40 g NaCl per 1000 g water) heated to 60 °C and then with 1 L water heated to 60 °C. Note pressure required to enable reverse flow through disc;
- Optional step: place disc in breaker fluid for required time and at required temperature. Place disc in acrylic cell and flow disc with 1 L water at ambient temperature to remove any dissolved filter-cake residue;
- Optional step: place disc in acrylic cell and place arrangement with water in vacuum to remove any air from disc or water. Flow thereafter water through disc and measure water temperature and flowrate at different pressures to calculate average permeability to water (Kwa);
- Weigh disc in dry condition using moisture analyzer (Ma) using the same settings as in step 5;
- Optional step: place disc in acrylic cell and measure air temperature and flowrate at different pressures to calculate average permeability to air (Kaa).
References
- ANSI/API 13B-1. In Recommended Practice for Field Testing Water-based Drilling Fluids, 5th ed.; API Publishing Sevices: Washington, DC, USA, 2019.
- Alsaba, M.; Nygaard, R.; Hareland, G. AADE-14-FTCE-25. In Review of Lost Circulation Materials and Treatments with an Updated Classification; AADE: Houston, TX, USA, 2014. [Google Scholar]
- Jeennakorn, M.; Alsaba, M.; Nygaard, R.; Saasen, A.; Nes, O.-M. The effect of testing conditions on the performance of lost circulation materials: Understandable sealing mechanism. J. Pet. Explor. Prod. Technol. 2018, 9, 823–836. [Google Scholar] [CrossRef] [Green Version]
- Jeennakorn, M.; Nygaard, R.; Nes, O.-M.; Saasen, A. Testing conditions make a difference when testing LCM. J. Nat. Gas Sci. Eng. 2017, 46, 375–386. [Google Scholar] [CrossRef]
- Alshubbar, G.; Nygaard, R.; Jeennakorn, M. The effect of wellbore circulation on building an LCM bridge at the fracture aperture. J. Pet. Sci. Eng. 2018, 165, 550–556. [Google Scholar] [CrossRef]
- Alsaba, M.; Nygaard, R.; Saasen, A.; Nes, O.M. Lost Circulation Materials Capability of Sealing Wide Fractures; SPE-170285-MS; SPE International: Houston, TX, USA, 2014. [Google Scholar]
- Khalifeh, M.; Klungtvedt, K.R.; Vasshus, J.K.; Saasen, A. Drilling Fluids—Lost Circulation Treatment; SPE-195609-MS; SPE Norway: Bergen, Norway, 2019. [Google Scholar]
- Saasen, A.; Hodne, H.; Ronæs, E.; Aarskog, S.A.; Hetland, B.; Løvereide, M.B.; Mohammadi, R. Wood Fibre Based Lost Circulation Materials; OMAE2018-77662; ASME: Madrid, Spain, 2018. [Google Scholar]
- Lee, L.; Taleghani, A.D. Simulating Fracture Sealing by Granular LCM Particles in Geothermal Drilling. Energies 2020, 13, 4878. [Google Scholar] [CrossRef]
- Enstad, G. On the theory of arching in mass flow hoppers. Chem. Eng. Sci. 1975, 30, 1273–1283. [Google Scholar] [CrossRef]
- Whitfill, D. In Proceedings of the Lost Circulation Material Selection, Particle Size Distribution and Fracture Modelling with Fracture Simulation Software, SPE-115039-MS, IADC/SPE, Jakarta, India, 25–27 August 2008.
- Alsaba, M.; Nygaard, R.; Saasen, A.; Nes, O.M. Experimental investigation of fracture width limitations of granular los circulation materials, 2015. J. Petrol. Explor. Prod. Technol. 2016, 6, 593–603. [Google Scholar] [CrossRef] [Green Version]
- Alsaba, M.; Aldushaishi, M.; Jeennakorn, M.; Nygaard, R.; Saasen, A.; Nes, O.M. Sealing Pressure Prediction Model for Lost Circulation Treatments Based on Experimental Investigations; AADE-17-NTCE-21; American Association of Drilling Engineers: Houston, TX, USA, 2017. [Google Scholar]
- Hoxha, B.B.; Yang, L.; Hale, A.; van Oort, E. Automated Particle Size Analysis using Advanced Analyzers; AADE-16-FTCE-78; AADE: Houston, TX, USA, 2016. [Google Scholar]
- Pitoni, E.; Ballard, D.A.; Kelly, R.M. Changes in Solids Composition of Reservoir Drill in Fluids during Drilling and the Impact on Filter Cake Properties; SPE 54753; SPE International: The Hauge, The Netherlands, 1999. [Google Scholar]
- Green, J.; Patey, I.; Wright, L.; Carazza, L.; Saasen, A. The Nature of Drilling Fluid Invasion, Clean-Up, and Retention during Reservoir Formation Drilling and Completion; SPE-185889-MS; SPE Bergen: Bergen, Norway, 2017. [Google Scholar]
- Czuprat, O.; Dahle, B.O.; Dehmel, U.; Ritschel, R.; Storhaug, J.; Adrian, T.; Patley, I. Systematic Selection of Drill-in and Completion Fluids for Development of the Dvalin HT Gas Field; SPE-195601-MS; SPE Norway: Bergen, Norway, 2019. [Google Scholar]
- Khan, R.; Kuru, E.; Tremblay, B.; Saasen, A. Extensional Viscosity of Polymer Based Fluids as a Possible Cause of Internal Cake Formation. Energy Sources A 2007, 29, 1521–1528. [Google Scholar] [CrossRef]
- Cobianco, S.; Bartosek, M.; Lezzi, A.; Previde, E. New Solids-Free Drill.in Fluid for Low Permeability Reservoirs; SPE-64979; SPE: Houston, TX, USA, 2001. [Google Scholar]
- Nelson, P.H. Pore-throat sizes in sandstones, tight sandstones, and shales. AAPG Bull. 2009, 93, 329–340. [Google Scholar] [CrossRef]
- Civan, F. Reservoir Formation Damage 2020; Gulf Professional Publishing: Waltham, MA, USA, 2020; pp. 1–6. ISBN 978-0-12-801898-9. [Google Scholar]
- ANSI/API 13B-2. In Recommended Practice for Field Testing Oil-Based Drilling Fluids, 5th ed.; API Publishing Services: Washington, DC, USA, 2014.


| Test Number | Description of Test |
|---|---|
| 1 | Base fluid (with bentonite and CaCO3), normal mixing, 120 µm disc |
| 2 | Base fluid, high-shear mixing, 120 µm disc |
| 3 | Base fluid, high-shear mixing, 250 µm disc |
| 4 | Base fluid plus FIBER A, normal mixing, 120 µm disc |
| 5 | Base fluid plus FIBER A, high-shear mixing, 120 µm disc |
| 6 | Base fluid plus FIBER A, normal mixing, 250 µm disc |
| 7 | Base fluid plus FIBER A, high-shear mixing, 250 µm disc |
| 8 | Base fluid plus FIBER B, normal mixing, 120 µm disc |
| 9 | Base fluid plus FIBER B, high-shear mixing, 120 µm disc |
| 10 | Base fluid plus FIBER B, normal mixing, 250 µm disc |
| 11 | Base fluid plus FIBER B, high-shear mixing, 250 µm disc |
| Test | Fluid Loss | Disc Mass Change | Water Permeability Retention | Air Permeability Retention |
|---|---|---|---|---|
| 12, Base fluid 2 | Total loss | From 42.031 to 42.279 g = +0.248 g | From 3.338 to 0.997 D = 30% | From 2.327 to 0.822 D = 35% |
| 13, Base fluid 2 + 14.3 kg/m3 (5 ppb) FIBER UF | 24.2 mL | From 41.394 to 41.419 g = +0.025 g | From 4.056 to 2.253 D = 56% | From 2.824 to 2.378 D = 89% |
| 14 Base fluid 2 + 28.5 kg/m3 (10 ppb) Bentonite | 32.2 mL | From 40.776 to 40.795 g = +0.029 g | From 5.633 to 3.166 D = 56% | From 2.823 to 2.686 = 95% |
| 15, Base fluid 2 + 28.5 kg/m3 (10 ppb) Bentonite and 14.3 kg/m3 (5 ppb) FIBER UF | 19.8 mL | From 40.990 to 40.986 g = −0.004 g | From 5.329 to 3.459 D = 65% | From 3.479 to 3.037 D = 87% |
Publisher’s Note: MDPI stays neutral with regard to jurisdictional claims in published maps and institutional affiliations. |
© 2021 by the authors. Licensee MDPI, Basel, Switzerland. This article is an open access article distributed under the terms and conditions of the Creative Commons Attribution (CC BY) license (https://creativecommons.org/licenses/by/4.0/).
Share and Cite
Klungtvedt, K.R.; Saasen, A.; Vasshus, J.K.; Trodal, V.B.; Mandal, S.K.; Berglind, B.; Khalifeh, M. The Fundamental Principles and Standard Evaluation for Fluid Loss and Possible Extensions of Test Methodology to Assess Consequences for Formation Damage. Energies 2021, 14, 2252. https://doi.org/10.3390/en14082252
Klungtvedt KR, Saasen A, Vasshus JK, Trodal VB, Mandal SK, Berglind B, Khalifeh M. The Fundamental Principles and Standard Evaluation for Fluid Loss and Possible Extensions of Test Methodology to Assess Consequences for Formation Damage. Energies. 2021; 14(8):2252. https://doi.org/10.3390/en14082252
Chicago/Turabian StyleKlungtvedt, Karl Ronny, Arild Saasen, Jan Kristian Vasshus, Vegard Bror Trodal, Swapan Kumar Mandal, Bjørn Berglind, and Mahmoud Khalifeh. 2021. "The Fundamental Principles and Standard Evaluation for Fluid Loss and Possible Extensions of Test Methodology to Assess Consequences for Formation Damage" Energies 14, no. 8: 2252. https://doi.org/10.3390/en14082252
APA StyleKlungtvedt, K. R., Saasen, A., Vasshus, J. K., Trodal, V. B., Mandal, S. K., Berglind, B., & Khalifeh, M. (2021). The Fundamental Principles and Standard Evaluation for Fluid Loss and Possible Extensions of Test Methodology to Assess Consequences for Formation Damage. Energies, 14(8), 2252. https://doi.org/10.3390/en14082252